Article

Solid Removal across the Bed Depth in Media Filters for Drip Irrigation Systems

1
Department of Chemical and Agricultural Engineering and Technology, University of Girona, C/Maria Aurèlia Capmany 61, 17003 Girona, Catalonia, Spain
2
Department of Mechanical Engineering and Industrial Construction, University of Girona, C/Universitat de Girona 4, 17003 Girona, Catalonia, Spain
*
Author to whom correspondence should be addressed.
Agriculture 2023, 13(2), 458; https://doi.org/10.3390/agriculture13020458
Submission received: 17 January 2023 / Revised: 12 February 2023 / Accepted: 13 February 2023 / Published: 15 February 2023

Abstract

:
Pressurized sand media filters are commonly used in drip irrigation systems to prevent emitter clogging. However, the performance of these filters may be improved with more information about the retention of solids at different bed depths under different filter operation conditions and irrigation water sources. In this study, experiments in a scaled sand media filter were conducted to clog the filter with two different filtration velocities (30 and 60 m h−1) and two-particle types (inorganic from A4 coarse sand dust and organic from a reclaimed effluent). The suspended solids retained in slices of 5 mm (in the first 20 mm of the bed) and 20 mm (from 20 to 200 mm depth) thick were determined following the van Staden and Haarhoff (2011) procedure. The solids retained in each slice per mass of media were significantly (p < 0.05) affected by the interaction between the filtration velocity, the bed depth, and the particle type. The solids retained in the first 5 mm of the bed were significantly higher than at other depths. Moreover, inorganic solids were retained more in upper slices than organic ones. Therefore, media depths may be adjusted depending on the irrigation water source to optimize media use.

1. Introduction

The Food and Agriculture Organization of the United Nations (FAO) estimates that, by 2050, agriculture will need to produce almost 50% more food, fiber, and biofuel than in 2012. Since irrigated farming produces 40% of the agricultural production on 20% of the land, increasing the irrigation area is key to achieving this milestone [1]. However, further increases will be restricted by inter-sectoral competition for land and water resources as well as for climate change, water scarcity and land and water degradation. These constraints can be overcome by increasing land and water productivity through the adoption of pressurized irrigation techniques such as sprinkler and drip irrigation, which considerably reduce water application; however, they boost both energy and investment requirements [2].
Drip irrigation allows increased water use efficiency, improved crop yields and quality, reduced deep percolation, minimized salinity hazards to plants, enhanced fertilizer and chemical application, and improved cultural practices [3]. The energy requirements in drip irrigation may also be reduced by its lower operating pressures than other pressurized irrigation technologies or by its increased irrigation efficiencies that can save energy [3]. Moreover, since drip irrigation reduces pollutant exposure to humans and plants, it can be safely used for applying reclaimed effluents, which can replace freshwater for irrigation and, therefore, alleviate water scarcity [4]. These advantages explain why the world drip irrigation surface has almost doubled between 2012 and 2021, increasing from 10.8 to 15.9 Mha, especially in emerging and developing countries where 68.2% of drip irrigation surface is located [5].
The main disadvantage of drip irrigation is emitter clogging which can cause nonuniformity of water application and system failure [4,6]. Thus, drip irrigation systems require some filtration treatment to remove the particles that can easily clog emitters. Media filters packed with granular materials, as well as disc and screen filters, are widely used for this purpose [7]. However, since particles can be caught across the whole filtration bed and not only on its surface, media filters are usually more efficient than screen and disc filters in preventing emitter clogging when low-quality irrigation water, such as reclaimed effluent, is used [8,9,10,11]. Solid removal efficiency can be increased by combining both media and disc filters [12,13,14].
In the pressurized media filters, a diffuser plate distributes the inlet water on the media bed surface, and once the water has passed through the bed, an underdrain releases the filtered water to an outlet. Thus, those particles carried by the irrigation water are trapped throughout the media bed by different and simultaneous mechanisms such as straining, interception, inertia, sedimentation, diffusion, and hydrodynamic action [15]. Those particles which are larger than the filter pore opening or highly concentrated are retrained by straining, mainly at the filter surface [15]. The media grains can also intercept those small particles transported in the flow streamlines which approach the grain surface. In addition, the streamlines diverge when approaching the media grains, but those particles with enough inertia maintain their trajectory and collide with the grains [15,16]. Moreover, those particles with greater density than water deviate from the streamline due to gravity and sediment on media grains [15]. Diffusion is due to the thermal energy of the fluid, which is transferred to the very small particles and causes them to drift from the streamlines to impact the surface of the grains or other particles [15,16]. Furthermore, every particle is subjected to hydrodynamic action caused by the velocity gradients within pore openings. The particles tend to rotate due to the higher velocities they experience on one side and create an additional spherical field, which leads to movement across the streamlines and further collision with the grains [15,16]. The suspended particles will be subjected to all of these mechanisms to varying degrees. However, their relative importance will depend on the fluid flow conditions, the geometry of the filter pores and the size, shape, and density of the particles [16].
Once the media pores become clogged with retained solids, the pressure drop across the filter increases until it is necessary to backwash the bed to remove the accumulated pollutants and restore appropriate filtration conditions.
Recent research on media filters for drip irrigation systems has focused on studying the pressure loss across media filters [17,18,19,20,21,22,23,24], leading to the suggestion of several design improvements [25,26,27,28], which yielded more uniform flow across the media bed. Despite advances in the knowledge of the hydrodynamics of pressurized media filters, few studies have deeply analyzed the retention of sediments across the media bed, which is necessary to optimize solid removal efficiency and filter performance. Several authors [19,29] observed that inorganic suspended solid removal efficiency increased with higher flow rates and, therefore, with higher filtration velocities, as well as smaller media particle sizes. On the other hand, Solé-Torres et al. [30] found that turbidity (which is highly correlated with suspended solids) removal in media filters when using effluents depended on the interaction between bed height, filtration velocity and filter underdrain design. In addition, turbidity removal is also explained by the interaction between filter design and media material [31]. Burt [32] highlighted that most of the particles filtered are attached to the upper layer of the media bed despite the fact that some variation was observed depending on the filtration velocity and particle size. In this regard, de Deus et al. [33] found that the inorganic solids retained decreased along media depth until the last quarter of the depth, where the solid amount increased again. Higher particle retention on superficial layers was also observed by Duran-Ros et al. [34], who worked with a pressurized scaled filter under laboratory conditions and using reclaimed effluent. These authors, using optical coherence tomography (OCT), did not find specific solid deposition patterns on the media slices analyzed. Nevertheless, differences in solid retention across the media bed depending on both the type of particles and filter operation conditions, such as velocity, have not been studied yet. Thus, the main goal of this study was to analyze the amount of suspended solids retained across the filter bed at two common filtration velocities and two irrigation water compositions.

2. Materials and Methods

2.1. Experimental Setup

2.1.1. Experimental Filter

A cylindrical polymethyl methacrylate (PMMA) media filter was designed and built (Figure 1) to carry out the experiments. The inner diameter of the filter was 110 mm and was scaled down by a factor of 4.54 from a commercial 500 mm diameter media filter allowing the experiments to be conducted at experimental level whilst keeping the same filtration water velocity. A diffuser plate, consisting of an 80 mm diameter and 10 mm height cylinder with a 2.5 mm square grid of 1 mm diameter openings avoiding the 10 mm central zone, was built and fixed to the filter top cover to obtain a homogenous flow on the bed media surface. The underdrain placed at the filter bottom was an iron-steel perforated plate. A screw system was also designed and assembled to raise the underdrain allowing the acquisition of media slices of desired thickness for further analysis.

2.1.2. Laboratory Setup

The laboratory experimental setup (Figure 2) worked as a closed circuit with a 0.06 m3 frustoconical tank where tap water was deposited, a digital water thermometer with an accuracy of ±1 °C, a Niza 60/3 (Hidráulica Alsina, La Llagosta, Barcelona, Spain) centrifugal pump, a CZ3000 DN15 (Contazara, Cartuja Baja, Zaragoza, Spain) flow meter with an accuracy of ±1% and the PMMA media filter unit. Outlet and inlet filter pressures were measured using a Leo 2 (Keller, Gallerstrasse, Winterthur, Switzerland) digital manometer with a precision of ±0.07%. Target filtration velocity was achieved by adjusting the opening of a gate valve placed before the flow meter. With the regulation of the outflow gate valve, pressure at the filter inlet was adjusted to 120 kPa. A pressure relief valve was also installed at the filter inlet pipe. This valve opened automatically when the pressure reached 200 kPa to prevent any damage to the experimental filter PPMA body. After being filtered, water was returned to the tank; therefore, the system worked as a closed circuit.

2.1.3. Wastewater Treatment Plant Setup

One set of experiments was carried out in the Celrà (Girona, Spain (42°02′25.3″ N 2°52′19.8″ E)) wastewater treatment plant (WWTP). The same experimental filter, pump, valves, flow meter, and pressure gauges used in the laboratory setup described in the previous section were moved to the WWTP facilities. In this case, however, the filter worked using a reclaimed effluent, which was pumped from the outlet chamber of the settling tanks placed after a biological reactor-type oxidation ditch operated by a sludge process. Once the effluent was filtered, it was released into the outlet chamber. Given the volume of the outlet chamber, the experimental setup did not work as a closed circuit.

2.2. Experimental Procedure

2.2.1. Filtration Experiments

The filtration experiments aimed to analyze the effect of two particle types and two filtration velocities on the particles retained under filtration conditions at different bed depths (Table 1).
The experimental filter was prepared for each run following the standard EN 16713-1 [35]. Thus, at the beginning of each test, in order to ensure the cleanliness of the equipment, the experimental setup was operated with tap water until the outlet water turbidity—which was measured with a HI 93703 (Hanna Instruments, Woonsocket, RI, USA) portable turbidimeter—was below 1.5 formazin nephelometric units (FNU). Then, the filter was filled with CA-07MS silica sand (Sibelco Hispania, Bilbao, Spain) previously washed and dried. The D10 diameter (diameter in which 10% of the weight of the sample was finer) of this silica sand was 0.48 mm, the D60 diameter (diameter in which 60% of the sand was finer) was 0.83 mm, the uniformity coefficient (D60/D10) was 1.73, and the porosity (ratio of the volume of voids versus the total volume occupied by the media) was 0.40.
Once the media bed was placed in its position, the filter was backwashed to get rid of the finest particles, which could cause future clogging problems, with a velocity 50% higher than the target filtration velocity until the turbidity of the backwashed water was lower than 1.5 FNU. Then, the filter was drained, and tap water was filtered for 5 min to ensure that turbidity was below 1.5 FNU, which is assumed to be the maximum water turbidity for a clean experimental setup. If turbidity was above 1.5 FNU, the tap water in the system was fully replaced, the filter was run for 5 min more, and the turbidity was measured again. This procedure was repeated until the outlet water turbidity was below 1.5 FNU. When this condition was verified, the inlet valve was opened or closed until a filtration velocity (indirectly measured with the flow meter) reasonably close to the target (30 or 60 m h−1) was reached. In addition, the outlet filter valve was also adjusted to achieve the filtration working pressure (120 kPa). Although the gate valves were carefully adjusted to allow the required treatment filtration, there were some changes during each test. Therefore, actual filtration velocities slightly differed from the targeted velocities (Table 1).
In the laboratory experiments, Arizona Test Dust A4 class (Powder Technology Inc., Arden Hills, MN, USA) sand, with D10 = 5.1 µm and D60 = 43.9 µm, was added in the frustoconical tank. During the same test, 0.28 g of A4 dust sand was added to the tank every 5 or 2.5 min for the 30 and 60 m h−1 filtration velocities, respectively, to maintain the filter inlet solid load at 0.5 g L−1, according to the EN 16713-1 standard [35]. Filtered volume, flow rate, filter inlet and outlet pressures, and temperature were recorded every 2.5 min. The filtration run ended when the bed media was clogged, which was assumed to be when the total pressure loss across the filter reached 50 kPa [9].
This procedure was also followed in the experiments carried out in the WWTP, but the filter was directly fed with reclaimed effluent, as previously explained in Section 2.1.3.
All the experiments in the laboratory and in the WWTP were conducted four times for each given target filtration velocity. The average experimental conditions of each set of experiments are shown in Table 2.

2.2.2. Measurement of the Solids Retained in the Media Bed

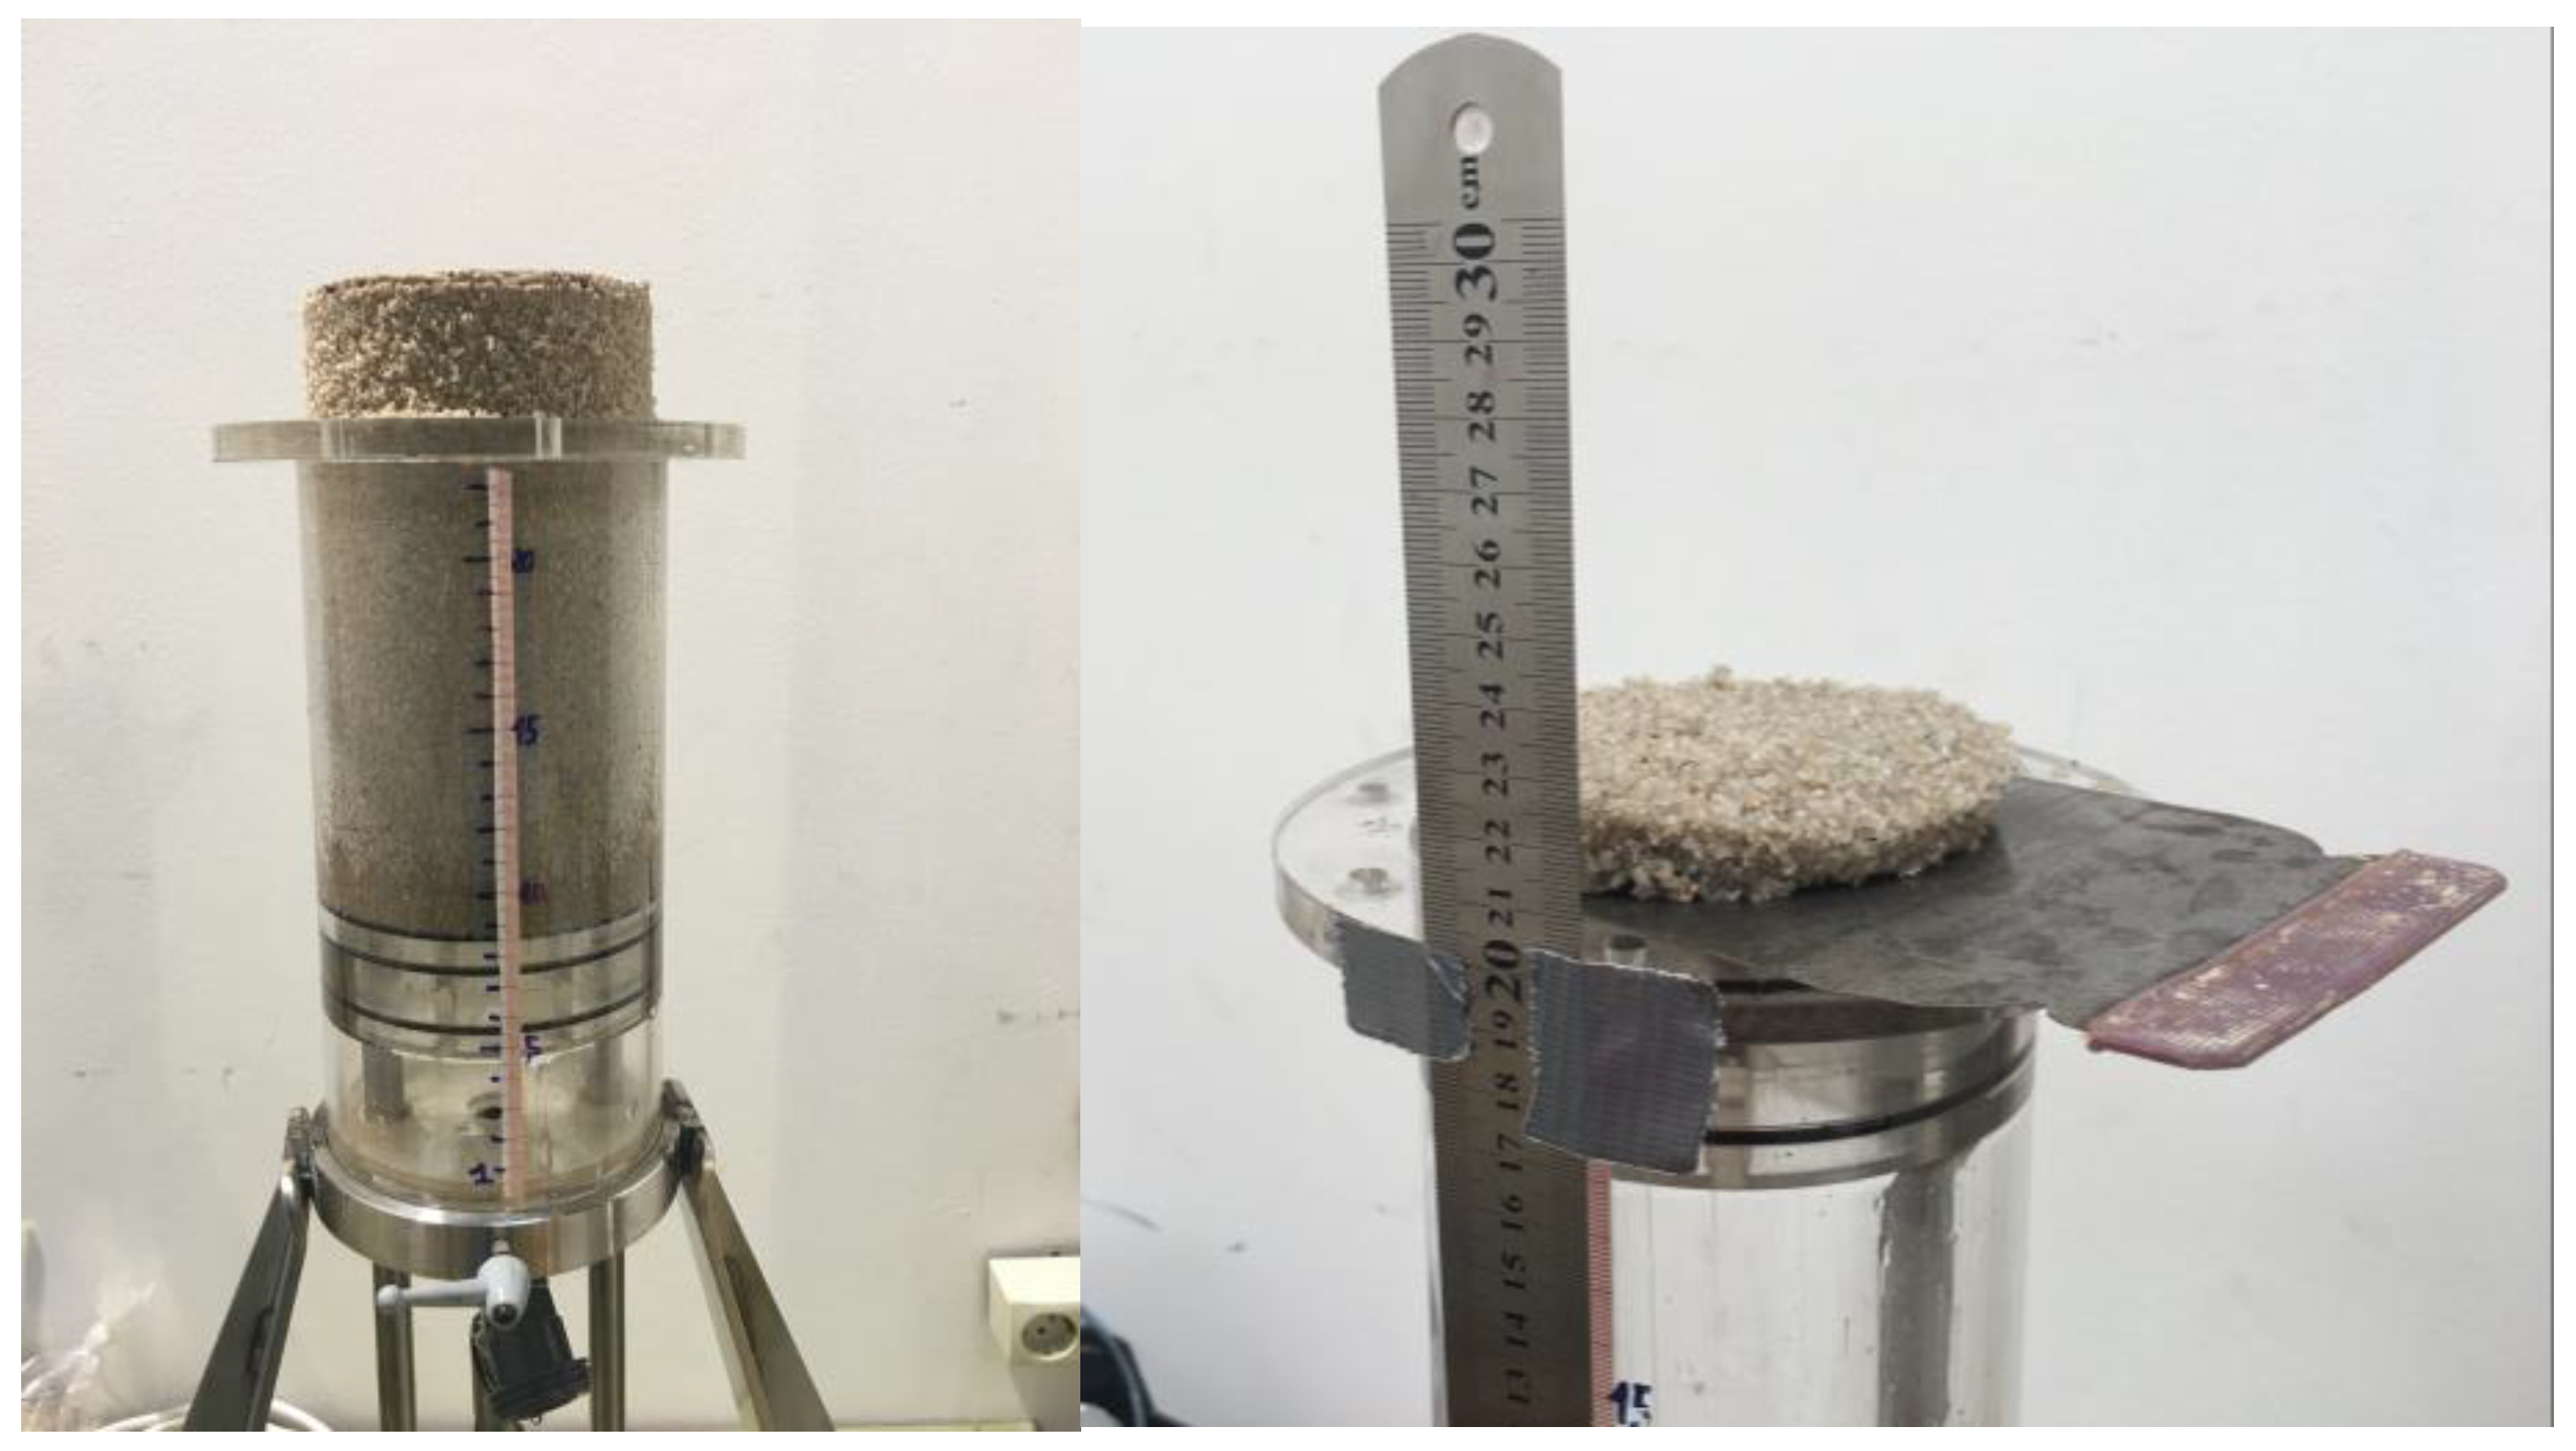
Once each test was finished, slices of the bed were obtained by pushing up the underdrain using the screw of the experimental filter (Figure 3). These slices were 5 mm thick in the upper 20 mm of the bed and 20 mm thick from 20 to 200 mm bed depth. Thus, a total of thirteen slices were obtained in each run. The slice thickness was carefully measured using a ruler (Figure 2), and then the slices were removed and put into a 1000 mL recipient.
The retained solids in each slice were determined following the van Staden and Haarhoff procedure [36]. For the first four media slices (5 mm thick), 100 mL of distilled water was added to the 1000 mL test tube containing each bed slice. In the 20 mm thick slices, the water was added to a sample of 50 mL since this is a volume of media similar to that of the four first slices. Then, the recipient was sealed and shake-inverted vigorously 20 times to achieve the physical stripping of the media, and the supernatant water was then decanted. This procedure was repeated four more times, so a total of five rounds per slice (except for the upper slice, for which a total of ten rounds were needed until the supernatant was clear) were carried out, and 500 mL of suspension (1000 mL for the first slice) were obtained. A sample from this suspension was used for analyzing the total suspended solids following the Standard Methods for the Examination of Water and Wastewater [37].
These samples were filtered in a magnetic filter funnel (Pall Corporation, East Hills, NY, USA) using 47 mm diameter and 1.2 µm porous size GMFC-52047 (Scharlab, Sentmenat, Barcelona, Spain) glass microfiber filters previously dried at 105 °C in a Digitheat 190 L (Selecta, Abrera, Spain) heater for 12 h, and weighed with an HM-200 (A&D Instruments Ltd., Tokyo, Japan) scale with a precision of ±0.01 mg. The samples were filtered using a 1C (Vacuubrand, Wertheim, Germany) vacuum pump. Once the samples were filtered, the glass microfiber filters were dried in the heater for 2 h at 105 °C. Then, they were cooled down in a desiccator for 2 h and weighed.
As all the retained particles in the media had to pass through the 500 mL water solution [38], the mass of the total suspended solids retained in each bed slice could be computed. Moreover, each media slice was dried at 105 °C for 24 h, and its weight was determined with a GX-4000 (A&D Instruments Ltd., Tokyo, Japan) scale with an accuracy of ±10 mg, so the ratio between the mass of retained suspended solids per mass of media slice was also calculated. Lastly, the percentage of solids retained in each slice regarding the total solids retained across the bed was computed.

2.3. Statistical Treatment

Statistical analyses were carried out using SPSS Statistics software (IBM, New York, NY, USA). The ratio of the solids retained regarding the slice mass as well as the total solid retention percentage across the media bed, were assessed using an analysis of the variance (ANOVA). In both cases, the model included as fixed effects the type of the particle filtered, the filtration velocity and the bed depth slice as well as all their double (i.e., filtration velocity × type of particle, filtration velocity × bed depth slice, and type of particle × bed depth slice) and triple (filtration velocity × type of particle × bed depth slice) interactions. Tukey’s pairwise comparison test was used to assess if averages were significantly different with a probability of 0.05 or less.

3. Results

3.1. Solids Retained Regarding the Slice Mass

The results of the analyses of the model’s variance for the solids’ ratio retained in each slice regarding the mass of the slice are shown in Table 3. The model was statistically significant (p < 0.05), as was the effect of filtration velocity, the bed depth slice, the double and triple interactions between filtration velocity, the type of particle added, and the bed depth slice. Although the type of particle added was not significant as a single factor (p > 0.05), it participated in all the significant interactions. The triple interaction will be further analyzed in this section since the effects of filtration velocity, type of particle, and bed depth cannot be considered independently.
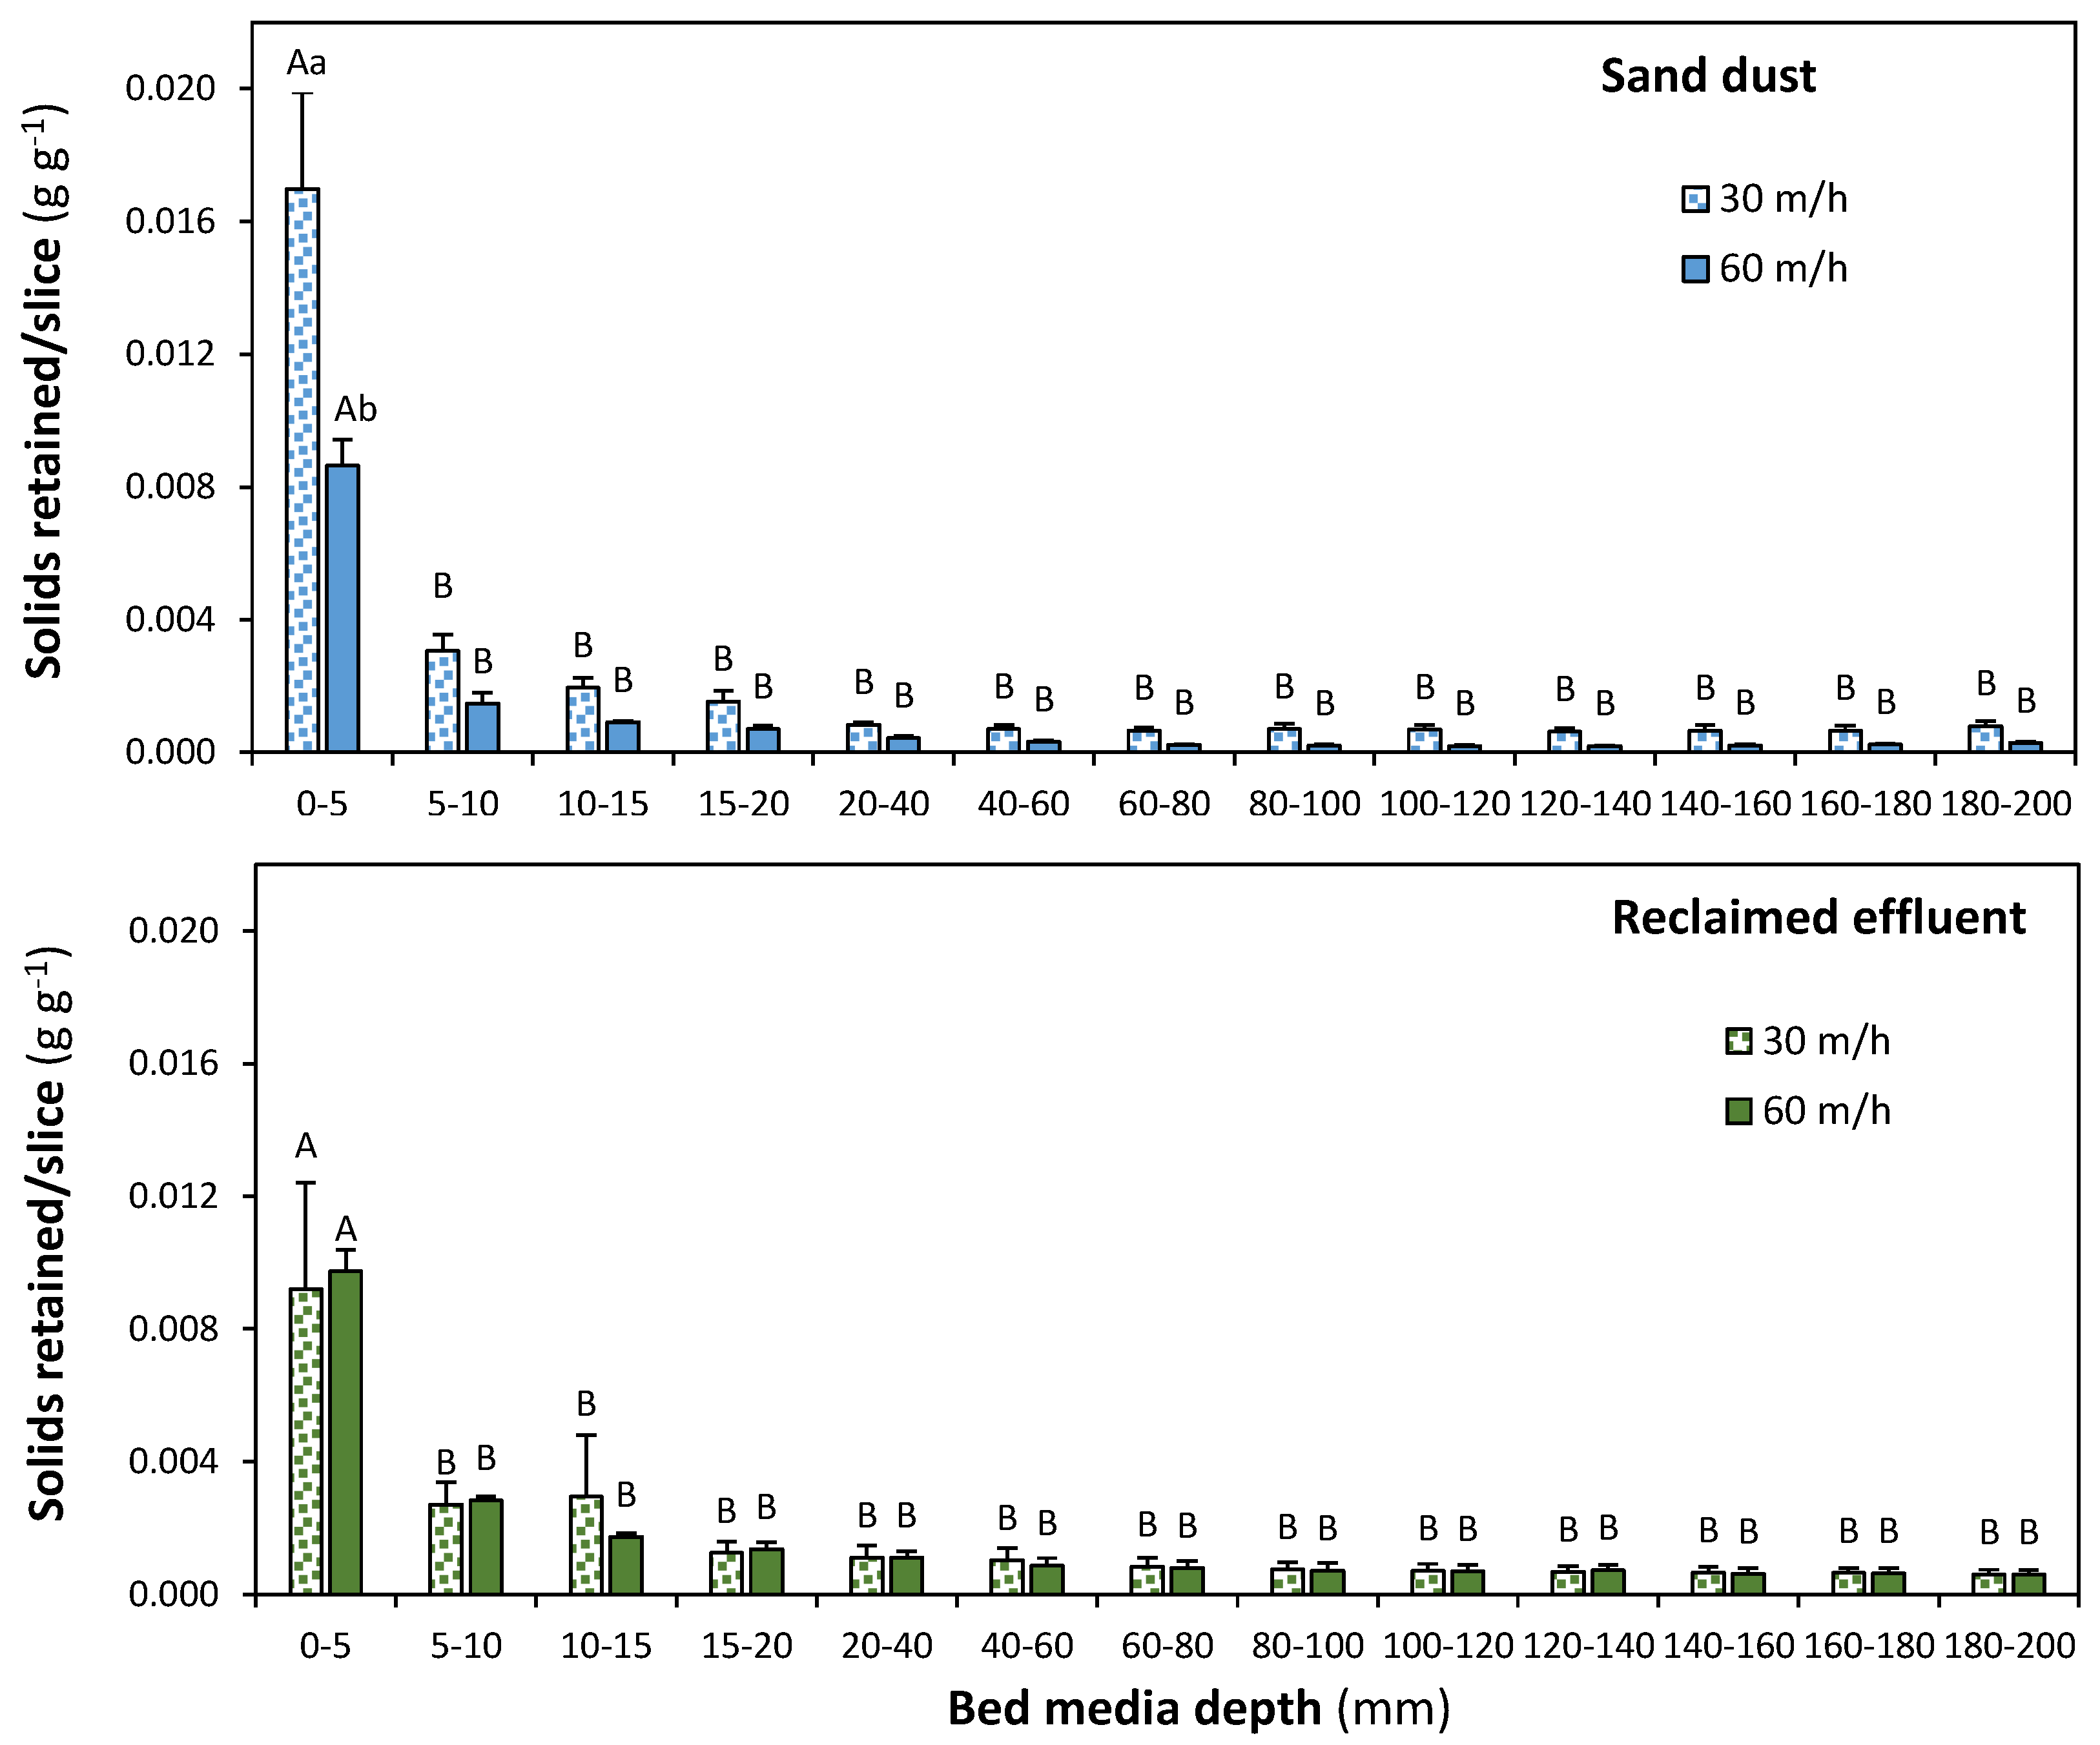
The ratio of the solids retained in a bed slice to the mass of each slice regarding each type of particle, filtration velocity, and bed depth slice is shown in Figure 4. For both the sand dust and the reclaimed effluent, this ratio was significantly (p < 0.05) higher in the 0-5 mm upper layer than in the rest of the bed, whatever the filtration velocity (30 or 60 m/h) was. Differences between filtration velocities were only observed in the 0–5 mm slice with sand dust. In this case, the suspended solids retained per mass of slice were significantly higher (p < 0.05) working at 30 m h−1 than at 60 m h−1. In the rest of the bed depth, no differences were found between velocities, either with sand dust or reclaimed effluent.

3.2. Percentage of Solids Retained across the Media

Table 4 shows the results of the model’s variance analysis for the percentage of solids retained in each bed slice regarding the total. Although the model was statistically significant (p < 0.05), only the factor of bed depth, the double interaction between the type of particle, and the bed depth were significant (p < 0.05). This means that neither the filtration velocity nor the type or particle completely explain the results of this index. Thus, the double interaction between the type of particle and bed depth is analyzed here.
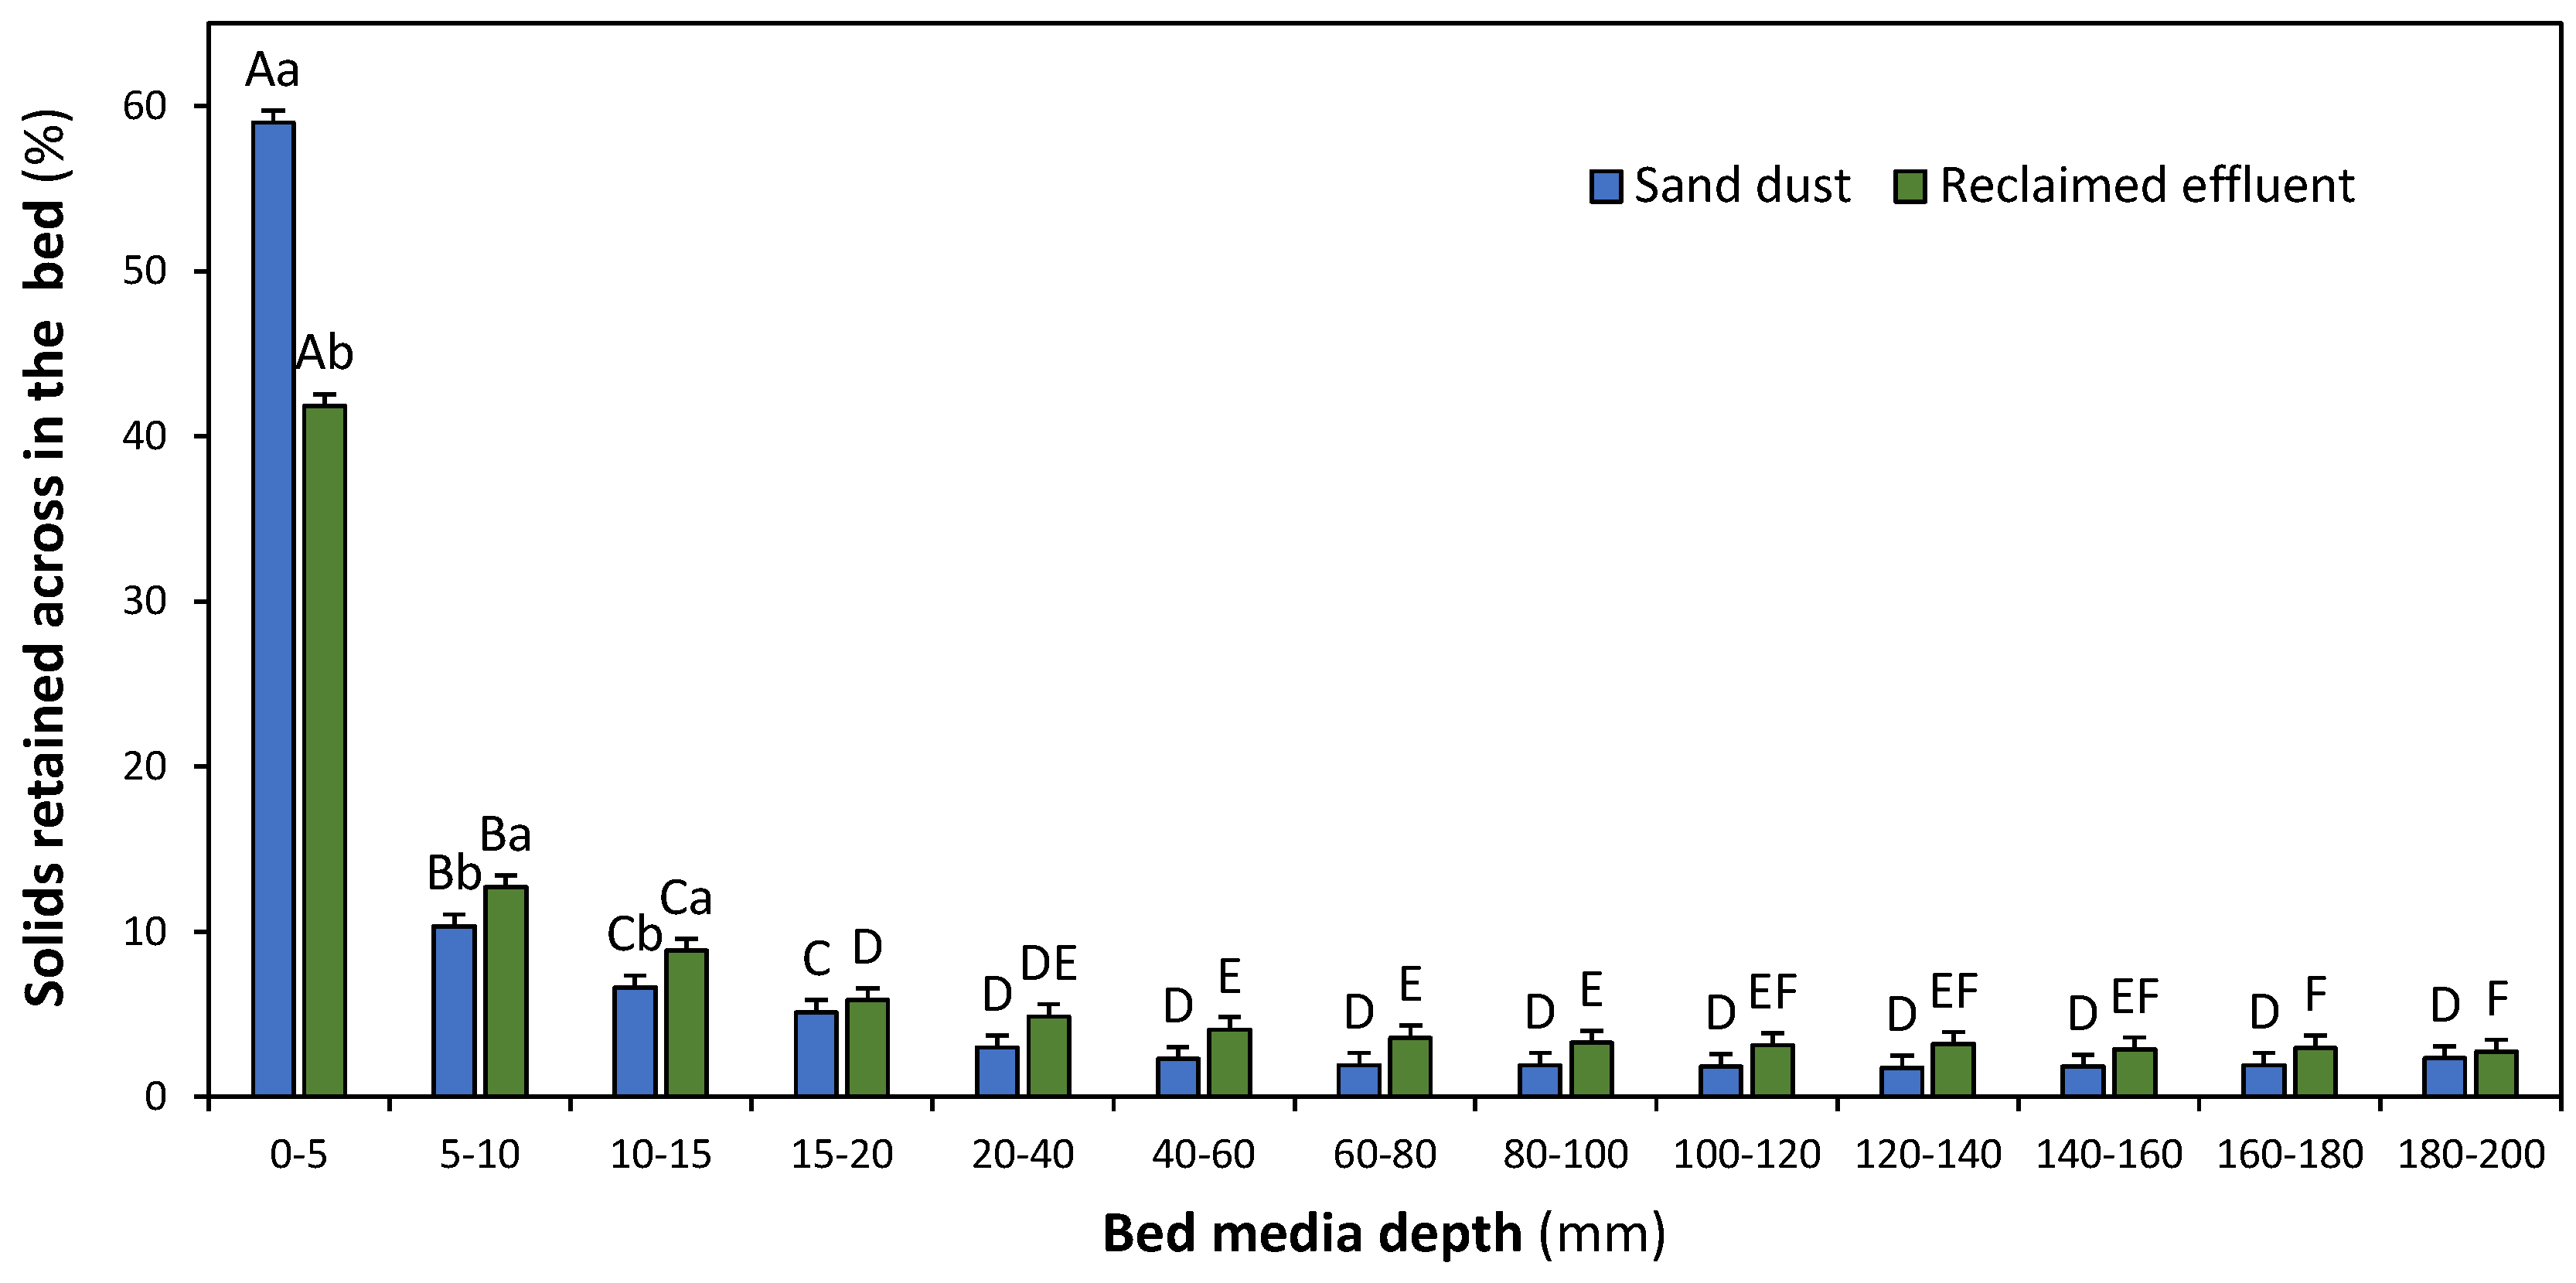
Figure 5 shows the percentage of the solids retained in each slice regarding the solids attached to the whole bed. There was a different pattern regarding the origin of the particles present in the irrigation water. Thus, when sand dust was added, 59% of the total solids were found in the upper slice (0–5 mm), which was significantly higher (p < 0.05) than the 42% of solids retained at this same depth working with the reclaimed effluent. In the two following slices, more solids were significantly retained using reclaimed effluent than with sand dust (12.7 vs. 10.3% at 5–10 mm and 8.9 vs. 6.6% at 10–15 mm). There were no significant differences (p > 0.05) in the percentage of solids retained below 15 mm regarding the type of particles, although they were slightly higher with the reclaimed effluent. In the first 20 mm of bed, 81% of solids on average were retained when sand dust was used for 69% with reclaimed effluent. It should also be highlighted that from a 20 mm bed depth to the bottom, the solids attached in each slice were below 5% of the total. On the other hand, when sand dust was added to irrigation water, the percentage of solids retained in the upper slice (0–5 mm) was significantly higher than that in the second layer (5–10 mm), which was also statistically greater than those of the third (10–15 mm) and fourth (15–20 mm) slices. There were no significant differences in the percentages of retained solids between the nine 20 mm thick slices between 20- and 200-mm bed depth. Comparable results were obtained with the reclaimed effluent. However, in this case, there were no significant differences in the percentage of solids retained either at 15–20 mm and 20–40 mm or between the seven slices from 20–40 mm to 140–160 mm bed depth. The percentage of particles retained in the last 40 mm of the bed was also significantly smaller (p < 0.05) than those obtained until half of the bed depth (100 mm).

4. Discussion

The effect of the filtration velocity and the type of particles (sand dust and reclaimed effluent) on the suspended solids retained across the media bed depth of a scaled pressurized sand media filter has been studied. The bed depth was fixed to 200 mm since this is a minimum value in commercial filters [30]. Other studies were conducted with media heights of 80 mm [34], 200 and 300 mm [30], and 350 mm [29,33]. Solé-Torres et al. [30] did not find clear differences between 200 and 300 mm depths regarding turbidity removal and filtered volume.
The slices taken (Figure 3) were 5 mm thick in the upper 20 mm and, from this depth to the bottom of the media bed, were 20 mm thick. Therefore, bed slices were thinner on the top than the 20 mm used by Duran-Ros et al. [34] and the 87.5 mm used by Mesquita et al. [29] and de Deus et al. [33]. These finer slices allowed a more detailed analysis of the solid retention, especially in the upper layers of the media bed, where large particles are usually found [32]. Since slice thickness was different, the results obtained here were presented as retained solid mass per analyzed mass of each slice. Thus, the results of solids are directly comparable between slice depths (Figure 4). There was a significant difference (p < 0.05) between the solids retained in the first 5 mm and the rest of the bed depth, whatever the type of solid added in the irrigation water and the filtration velocity. Higher solids in the upper layers were also found in previous research [33,34]. In our study, when sand dust was added, there were, on average, 0.013 g suspended solids g media−1 in the first 5 mm for 0.001 g suspended solids g media−1 from 5 to 200 mm depth (Figure 4). In the experiments with reclaimed effluent, the first 5 mm of the bed had a mean of 0.010 g suspended solids g media−1 for 0.001 g suspended solids g media−1 in the rest of the media bed.
The different filtration velocities only had a significant effect (p < 0.05) on the first 5 mm of bed working with sand dust. In this case, 0.017 and 0.009 g suspended solids g media−1 were found at 30 and 60 m h−1, respectively. Mesquita et al. [29] and de Deus et al. [31] observed that the greater the filtration velocity, the more the solids retained. In our case, the results were completely the opposite. Our experiments were carried out until a head loss of 50 kPa was reached, but in the other studies, they were conducted for a fixed time. Since the head loss threshold was reached faster at a higher velocity, filtration cycles were shorter, as Solé-Torres et al. [30] had previously observed in commercial sand media filters. Since the sand dust was added at the same rate and the filtered volume was slightly below half at 60 m h−1 than at 30 m h−1 (Table 2), then the sum of the suspended solids (Figure 4) in the whole media bed was close to the half at 60 m h−1 than at 30 m h−1 (0.014 vs. 0.030 g suspended solids g media−1, respectively).
When the reclaimed effluent was used, the filtration velocity did not have any significant effect on the solids retained in each slice. Despite more solids being found in the two first slices (0–5 and 5–10 mm) at 60 m h−1 than at 30 m h−1, the difference was not statistically significant. In fact, the sum of the suspended solids retained across the whole media was the same (0.023 g suspended solids g media−1) for both velocities (Figure 4). Fewer total suspended solids and reclaimed effluent were filtered at 30 m h−1 than at 60 m h−1. However, it should be pointed out that, besides suspended solids, reclaimed effluent may have other chemical and biological compounds, which were not analyzed here, that could contribute to quick filter clogging and, therefore, to increased head loss. Moreover, greater standard deviations (Table 2) clearly show higher variability with reclaimed effluents, as other authors describe [11,30]. As far as the authors know, there are no other studies dealing with the effect of particle retention across the bed in pressurized filters when using effluents.
The percentage of suspended solids for each slice regarding the total (Figure 5) was only explained by the interaction between the type of particle and the slice depth but not by the filtration velocity. In the first 5 mm of bed, 59% and 42% of the total solids were retained with sand dust and reclaimed effluent, respectively. From 5 to 20 mm depth, this percentage dropped to 22% and 27%, respectively. Overall, despite some slight differences when effluent was used, there were no significant differences in these percentages for the slices from 20 mm to the bottom (Figure 5). These noticeable differences between bed depths had not been previously observed. Duran-Ros et al. [34], using a similar experimental setup with a total of four 20 mm slices for a bed depth of 80 mm, found that the average percentages of retained mass were 35%, 24%, 23% and 17% from top to bottom, respectively. De Deus et al. [33], adding sand particles with a media bed similar (D10 = 0.55 mm) to that of the present study (D10 = 0.48 mm), found more uniform solids retention percentages in the four 85 mm thick layers. Thus, for a filtration velocity of 20 m h−1, these percentages were, from upper to lower layers, 32%, 25%, 25% and 19%, respectively. When filtration velocity was increased to 60 m h−1, the retention percentages were 25%, 21%, 22% and 32%, respectively. The percentages at the bottom increased with the number of filtration cycles using the same media [33]. In our case, the media was replaced after each filtration cycle, and the effect of the number of filtration cycles cannot be compared. De Deus et al. [33] observed greater solid retention in the upper layers at finer media sizes, especially at the highest filtration velocities. The results show that straining is the prevalent filtration mechanism at these grain sizes since more solids are found on the bed surface [15,16]. However, the other filtration mechanisms (interception, inertia, sedimentation, diffusion, and hydrodynamic action) play the most prominent role with coarse media sizes [33], which promote deep filtration.
The results also show a different pattern when reclaimed effluents are used. In this case, a significantly smaller percentage of retained solids regarding sand dust was observed in the first 5 mm but, conversely, was higher between 5 and 15 mm (Figure 5). Below this depth, no significant differences were observed between those percentages obtained using sand dust and reclaimed effluent. Reclaimed effluents have mainly organic particles, which can be deformed when pressure increases and, therefore, can be released from the top layers to deeper ones. Results show that the filtration process of reclaimed effluent in pressurized media filters occurs more in-depth than with inorganic particles. The smaller sizes of effluent organic particles and their deformation when pressure increases [39] allow those particles initially retained mainly by straining on the bed surface to be released to deeper layers where they are finally attached to sand grains by the other filtration mechanisms. The results suggest that media depth should not be reduced when using irrigation water with organic particles, but it might be shortened if the water source has mostly inorganic particles, such as groundwater. Filter operation with less media bed allows for reducing the environmental impact of the use phase [40].
Under real operation conditions, once the media pores become clogged with retained solids, the pressure drop across the filter increases until a bed backwashing is conducted to remove the accumulated pollutants and restore appropriate filtration conditions. The effect of backwashing on the solids retained across the media bed has not been analyzed in the present study. However, previous research shows that the differential solid retention across the media bed during filtration leads to non-uniform bed fluidizations, which compromises backwashing efficiency [33].
The results of solids retained were obtained using the van Staden and Haarhoff [36] methodology, which consists of measuring the total suspended solids retained in the bed. Mesquita et al. [29] successfully used the van Staden and Haarhoff method with four samples of 60 mL of media bed each and found it more representative than taking ad-hoc water samples at both filter inlet and outlet for determining the filter removal efficiency by analyzing the total suspended solids. In our case, we have analyzed the whole slices in the first 20 mm of depth (with a volume of around 50 mL in each of the four slices) and other 50 mL media samples for those slices from 20 mm to the bottom. Thus, suspended solids were determined using more media mass per filter bed than in previous studies [29,34]. However, when comparing the amount of sand dust added or the solids in reclaimed effluent estimated, the retained solids were about 40% of that supplied. The van Staden and Haarhoff procedure, in addition to being time-consuming, might not be able to release all the solids retained in the media. On the other hand, the smallest solids added might pass the filter to the driplines. Adin and Elimelech [39] have found that most of the particles in the effluent are smaller than 10 µm. Those particles smaller than 1.2 µm (the minimum particle size of the total suspended solids determined with the procedure described in Section 2.2.2) cannot be measured as suspended solids and may explain some of this difference. Other methods might be developed for quantifying the retention of all the solids in the whole media bed. They might be based on image analysis, such as optical coherence tomography [26] or on other alternative techniques not yet developed.
The experiments were carried out using an experimental scaled filter. Further research should be conducted with different bed depths, media materials and velocities and using commercial filters.

5. Conclusions

The effect of two filtration velocities (30 and 60 m h−1) and two types of particles present in irrigation water (inorganic as sand dust and organic particles as reclaimed effluent) were assessed under filtration operation in an experimental pressurized filter with a 200 mm sand media bed depth.
The suspended solids retained across the filter bed depended on the interaction between the type of particles, the filtration velocity, and the bed depth. The suspended solids per slice mass were significantly (p < 0.05) higher in the first 5 mm of the bed than in the rest 195 mm of the experimental filter used for both velocities and particle types. Filtration velocity only yields differences in the suspended solids per slice mass in the upper 5 mm of media when using sand dust. Since no differences were found between filtration velocities in the rest of the bed media depth, it would be advisable to work at 60 m h−1 because, for a given flow rate, less filtration surface and filters would be needed and, therefore, investing and maintenance costs would also be reduced.
81% of the solids retained were found within the 20 mm of the bed when adding sand dust compared with 69% when using a reclaimed effluent. The higher solid filtration observed in the superficial bed layers suggests that the media bed might be thinner when filtering inorganic particles than organic particles.

Author Contributions

Conceptualization, M.D.-R., T.P., G.A., J.P., F.R.d.C. and J.P.-B.; methodology, M.D.-R., G.A. and J.P.-B.; formal analysis, M.D.-R. and J.P.-B.; investigation, M.D.-R., T.P., J.P., G.A., S.C., F.R.d.C. and J.P.-B.; resources, M.D.-R., T.P. and J.P.-B.; data curation, M.D.-R. and J.P.-B.; writing—original draft preparation, J.P.-B. and M.D.-R.; writing—review and editing, J.P.-B., M.D.-R., T.P., J.P., G.A., S.C. and F.R.d.C.; supervision, J.P.-B. and F.R.d.C.; project administration, J.P.-B.; funding acquisition, J.P.-B. All authors have read and agreed to the published version of the manuscript.

Funding

This research was funded by the Spanish Research Agency and the European Regional Development Fund through Grant RTI2018-094798-B-100.

Institutional Review Board Statement

Not applicable.

Data Availability Statement

The data presented in this study are available on request from the corresponding author.

Acknowledgments

The authors would like to thank the Municipality of Celrà for their help in carrying out this experiment, as well as Arnau Riba Palou for his technical assistance in the experiments.

Conflicts of Interest

The authors declare no conflict of interest.

References

  1. Food and Agriculture Organization of the United Nations. The State of the World’s Land and Water Resources for Food and Agriculture—Systems at Breaking Point. Synthesis Report 2021; FAO: Rome, Italy, 2021. [Google Scholar] [CrossRef]
  2. Tarjuelo, J.M.; Rodriguez-Diaz, J.A.; Abadía, R.; Camacho, E.; Rocamora, C.; Moreno, M.A. Efficient Water and Energy Use in Irrigation Modernization: Lessons from Spanish Case Studies. Agric. Water Manag. 2015, 162, 67–77. [Google Scholar] [CrossRef]
  3. Ayars, J.E.; Bucks, D.A.; Lamm, F.R.; Nakayama, F.S. Introduction. In Microirrigation for Crop Production. Design, Operation and Management; Lamm, F.R., Ayars, J.E., Nakayama, F.S., Eds.; Elsevier: Amsterdam, The Netherlands, 2007; pp. 1–26. [Google Scholar]
  4. Trooien, T.P.; Hills, D.J. Application of biological effluent. In Microirrigation for Crop Production. Design, Operation and Management; Lamm, F.R., Ayars, J.E., Nakayama, F.S., Eds.; Elsevier: Amsterdam, The Netherlands, 2007; pp. 329–356. [Google Scholar]
  5. International Commission on Irrigation & Drainage. Annual Report 2021–2022. 2022. Available online: https://icid-ciid.org/icid_data_web/ar_2021.pdf (accessed on 21 December 2022).
  6. Solé-Torres, C.; Lamm, F.R.; Duran-Ros, M.; Arbat, G.; Ramírez de Cartagena, F.; Puig-Bargués, J. Assessment of microirrigation field distribution uniformity procedures for pressure-compensating emitters under potential clogging conditions. Trans. ASABE 2021, 64, 1063–1071. [Google Scholar] [CrossRef]
  7. Nakayama, F.S.; Boman, B.J.; Pitts, D.J. Maintenance. In Microirrigation for Crop Production. Design, Operation and Management; Lamm, F.R., Ayars, J.E., Nakayama, F.S., Eds.; Elsevier: Amsterdam, The Netherlands, 2007; pp. 389–430. [Google Scholar]
  8. Tajrishy, M.A.; Hills, D.J.; Tchobanoglous, G. Pretreatment of secondary effluent for drip irrigation. J. Irrig. Drain. Eng. 1994, 120, 716–731. [Google Scholar] [CrossRef]
  9. Ravina, I.; Paz, E.; Sofer, Z.; Marm, A.; Schischa, A.; Sagi, G.; Yechialy, Z.; Lev, Y. Control of clogging in drip irrigation with stored treated municipal sewage effluent. Agric. Water Manag. 1997, 33, 127–137. [Google Scholar] [CrossRef]
  10. Capra, A.; Scicolone, B. Recycling of Poor Quality Urban Wastewater by Drip Irrigation Systems. J. Clean. Prod. 2007, 15, 1529–1534. [Google Scholar] [CrossRef]
  11. Duran-Ros, M.; Puig-Bargués, J.; Arbat, G.; Barragán, J.; Ramírez de Cartagena, F. Effect of filter, emitter and location on clogging when using effluents. Agric. Water. Manag. 2009, 96, 67–79. [Google Scholar] [CrossRef]
  12. Tripathi, V.K.; Rajput, T.B.S.; Patel, N. Performance of different filter combinations with surface and subsurface drip irrigation systems for utilizing municipal wastewater. Irr. Sci. 2014, 32, 379–391. [Google Scholar] [CrossRef]
  13. Wu, W.-Y.; Huang, Y.; Liu, H.-L.; Yin, S.-Y.; Niu, Y. Reclaimed water filtration efficiency and drip irrigation emitter performance with different combinations of sand and disc filters. Irrig. Drain. 2015, 64, 362–369. [Google Scholar] [CrossRef]
  14. Hasani, A.M.; Aminpour, Y.; Nikmehr, S.; Puig-Bargués, J.; Maroufpoor, E. Performance of sand filter with disc and screen filters in irrigation with rainbow trout fish effluent. Irrig. Drain. 2022; in press. [Google Scholar] [CrossRef]
  15. Ives, K.J. Rapid filtration. Water Res. 1970, 4, 201–223. [Google Scholar] [CrossRef]
  16. Cescon, A.; Jiang, J.-Q. Filtration Process and Alternative Filter Media Material in Water Treatment. Water 2020, 12, 3377. [Google Scholar] [CrossRef]
  17. Mesquita, M.; Testezlaf, R.; Ramirez, J.C.S. The effect of media bed characteristics and internal auxiliary elements on sand filter head loss. Agric. Water Manag. 2012, 115, 178–185. [Google Scholar] [CrossRef]
  18. Arbat, G.; Pujol, T.; Puig-Bargués, J.; Duran-Ros, M.; Montoro, L.; Barragán, J.; Ramírez de Cartagena, F. An Experimental and Analytical Study to Analyze Hydraulic Behavior of Nozzle-Type Underdrains in Porous Media Filters. Agric. Water Manag. 2013, 126, 64–74. [Google Scholar] [CrossRef]
  19. De Deus, F.P.; Testezlaf, R.; Mesquita, M. Eficiência de filtros de areia pressurizados na remoção de diferentes tamanhos de partículas da água de irrigação. Pesq. Agropec. Bras. 2015, 50, 939–948. [Google Scholar] [CrossRef]
  20. García Nieto, P.J.; García-Gonzalo, E.; Arbat, G.; Duran-Ros, M.; Ramírez de Cartagena, F.; Puig-Bargués, J. Pressure drop modelling in sand filters in micro-irrigation using gradient boosted regression trees. Biosyst. Eng. 2018, 171, 41–51. [Google Scholar] [CrossRef]
  21. Jiao, Y.; Feng, J.; Liu, Y.; Yang, L.; Han, M. Sustainable operation mode of a sand filter in a drip irrigation system using Yellow River water in an arid area. Water Supply 2020, 20, 3636–3645. [Google Scholar] [CrossRef]
  22. Graciano-Uribe, J.; Pujol, T.; Puig-Bargués, J.; Duran-Ros, M.; Arbat, G.; Ramírez de Cartagena, F. Assessment of Different Pressure Drop-Flow Rate Equations in a Pressurized Porous Media Filter for Irrigation Systems. Water 2021, 13, 2179. [Google Scholar] [CrossRef]
  23. Zaki, M.G.H.; Abuarab, M.E.-S.; Sultan, W.M.; Kassem, M.A.E.-W. Evaluation of friction head loss as a function of media filter performance via different underdrain types and media specifications. Agric. Eng. Int. CIGR J. 2021, 23, 1–11. [Google Scholar]
  24. Hu, Y.; Wu, W.; Liu, H.; Huang, Y.; Bi, X.; Liao, R.; Yin, S. Dimensional Analysis Model of Head Loss for Sand Media Filters in a Drip Irrigation System Using Reclaimed Water. Water 2022, 14, 961. [Google Scholar] [CrossRef]
  25. Bové, J.; Arbat, G.; Pujol, T.; Duran-Ros, M.; Ramírez de Cartagena, F.; Velayos, J.; Puig-Bargués, J. Reducing Energy Requirements for Sand Filtration in Microirrigation: Improving the Underdrain and Packing. Biosyst. Eng. 2015, 140, 67–78. [Google Scholar] [CrossRef]
  26. Mesquita, M.; Testezlaf, R.; de Deus, F.P.; da Rosa, L.M. Characterization of flow lines generated by pressurized sand filter underdrains. Chem. Eng. Trans. 2017, 58, 715–720. [Google Scholar] [CrossRef]
  27. Mesquita, M.; de Deus, F.P.; Testezlaf, R.; Da Rosa, L.M.; Diotto, A.V. Design and Hydrodynamic Performance Testing of a New Pressure Sand Filter Diffuser Plate Using Numerical Simulation. Biosyst. Eng. 2019, 183, 58–69. [Google Scholar] [CrossRef]
  28. Pujol, T.; Puig-Bargués, J.; Arbat, G.; Chaves, M.; Duran-Ros, M.; Pujol, J.; Ramírez de Cartagena, F. Numerical study of the hydraulic effect of modifying the outlet pipe and diffuser plate in pressurized sand filters with wand type underdrains. J. ASABE 2022, 65, 609–619. [Google Scholar] [CrossRef]
  29. Mesquita, M.; de Deus, F.P.; Testezlaf, R.; Diotto, A.V. Removal efficiency of pressurized sand filters during the filtration process. Desalin. Water Treat. 2019, 161, 132–143. [Google Scholar] [CrossRef] [Green Version]
  30. Solé-Torres, C.; Puig-Bargués, J.; Duran-Ros, M.; Arbat, G.; Pujol, J.; Ramírez de Cartagena, F. Effect of Underdrain Design, Media Height and Filtration Velocity on the Performance of Microirrigation Sand Filters Using Reclaimed Effluents. Biosyst. Eng. 2019, 187, 292–304. [Google Scholar] [CrossRef]
  31. Duran-Ros, M.; Puig-Bargués, J.; Cufí, S.; Solé-Torres, C.; Arbat, G.; Pujol, J.; Ramírez de Cartagena, F. Effect of different filter media on emitter clogging using reclaimed effluents. Agric. Water Manag. 2022, 266, 107591. [Google Scholar] [CrossRef]
  32. Burt, C.M. Hydraulics of commercial sand media filter tanks used for agricultural drip irrigation. In ITRC Report No. R 10001. Irrigation Training and Research Center; California Polytechnic State University: San Luis Obispo, CA, USA, 2010. [Google Scholar]
  33. De Deus, F.P.; Testezlaf, R.; Mesquita, M. Assessment methodology of backwashing in pressurised sand filters. Rev. Bras. Eng. Agric. Ambient. 2016, 20, 600–605. [Google Scholar] [CrossRef] [Green Version]
  34. Duran-Ros, M.; Solé-Torres, C.; Ait-Mouheb, N.; Molle, B.; Arbat, G.; Puig-Bargués, J. Media filter fouling assessment using optical coherence tomography: New methodology. Biosyst. Eng. 2021, 204, 26–35. [Google Scholar] [CrossRef]
  35. EN 16713-1:2016; Domestic Swimming Pools—Water Systems—Part 1: Filtration Systems—Requirements and Test Methods. CEN: Brussels, Belgium, 2016.
  36. Van Staden, S.J.; Haarhoff, J. The use of filter media to determine filter cleanliness. Phy. Chem. Earth 2011, 36, 1135–1140. [Google Scholar] [CrossRef]
  37. Baird, R.B.; Eaton, A.D.; Rice, E.W. (Eds.) Standard Methods for the Examination of Water and Wastewater, 23rd ed.; American Public Health Association, American Water Works Association, Water Environment Federation: Washington, DC, USA, 2017. [Google Scholar]
  38. Haarhoff, J.; van Staden, S.J. Measurement and expression of granular filter cleanliness. WaterSA 2013, 39, 701–706. [Google Scholar]
  39. Adin, A.; Elimelech, M. Particle filtration for wastewater irrigation. J. Irrig. Drain. Eng. 1989, 115, 474–487. [Google Scholar] [CrossRef]
  40. Pujol, J.; Espinach, F.X.; Duran-Ros, M.; Arbat, G.; Pujol, T.; Ramírez de Cartagena, F.; Puig-Bargués, J. Environmental Assessment of Underdrain Designs for Granular Media Filters in Drip Irrigation Systems. Agriculture 2022, 12, 810. [Google Scholar] [CrossRef]
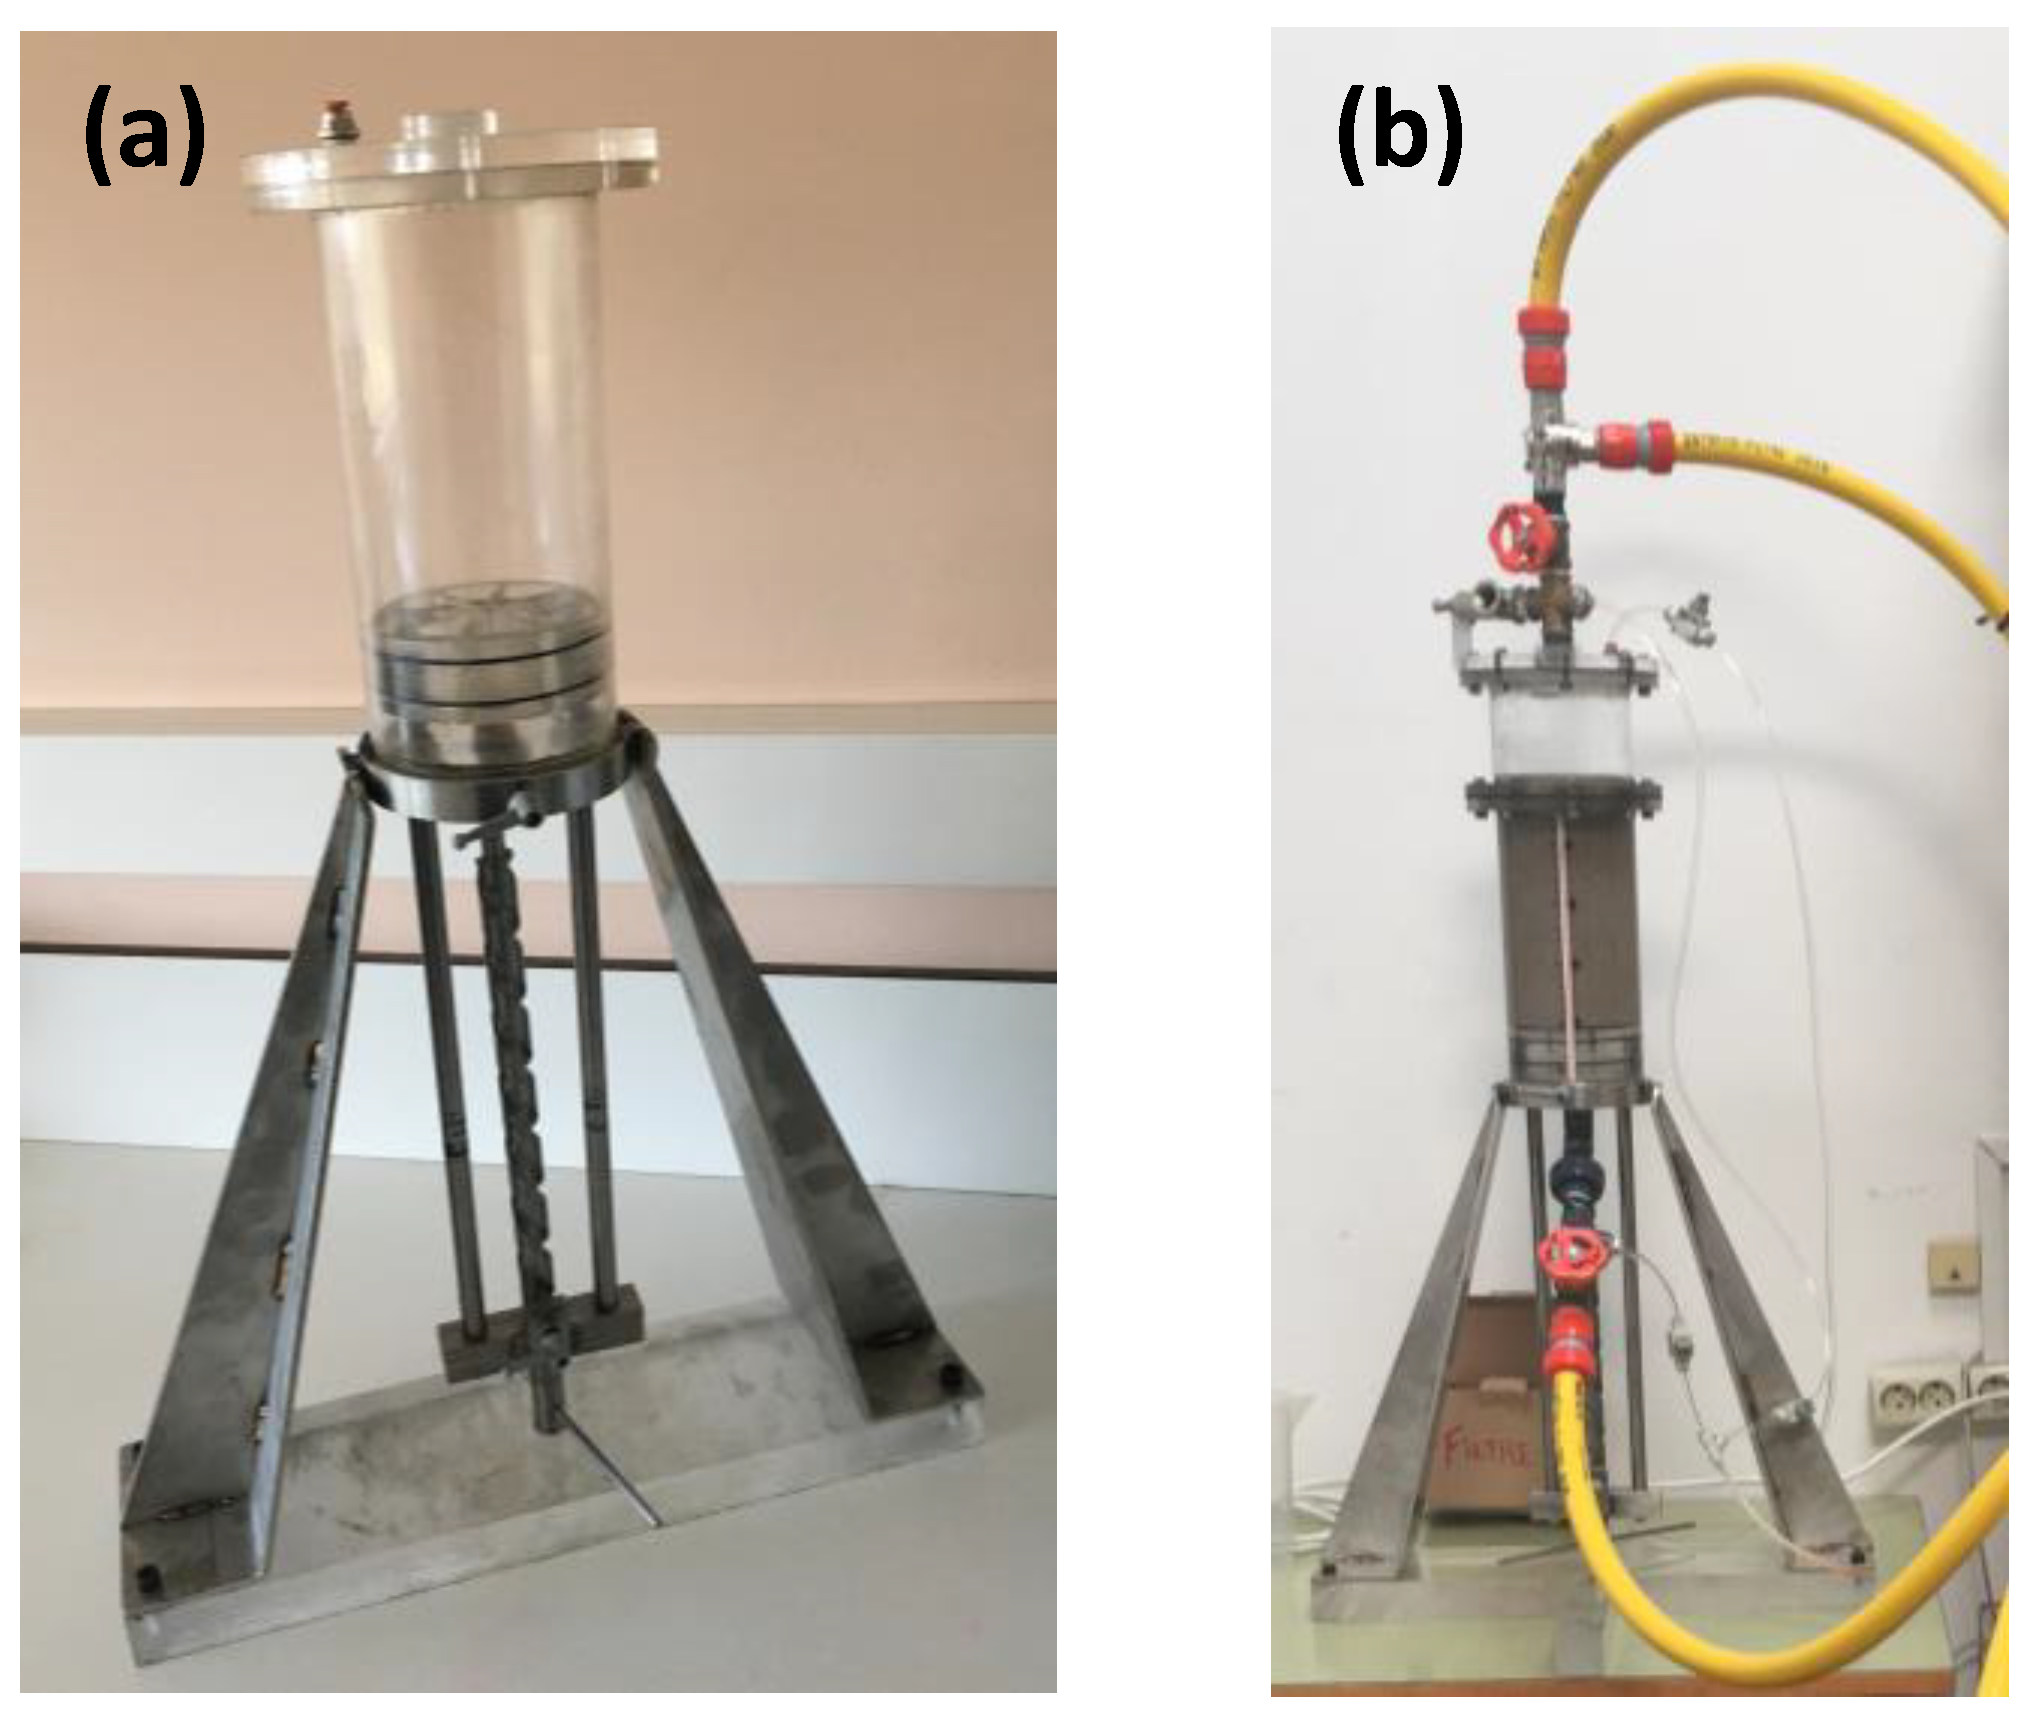
Figure 1. (a) Experimental filter built for the experiment before and (b) after the insertion of the sand bed and the necessary fittings for conducting the experiment.
Agriculture 13 00458 g001
Figure 2. Experimental laboratory setup.
Agriculture 13 00458 g002
Figure 3. Extraction of bed slices in the experimental filter.
Agriculture 13 00458 g003
Figure 4. Average (±standard error) of the total suspended solids (g) retained per mass (g) of slice bed across the whole media bed depth regarding the type of particles added and the target filtration velocity. Different small letters show significant differences (p < 0.05) between filtration velocities for a given bed depth. Different capital letters show significant differences (p < 0.05) between media bed depths for a given filtration velocity.
Agriculture 13 00458 g004
Figure 5. Average (± standard error) of the percentage of solids retained across the whole media bed in each slice of bed regarding the type of particles added. Different small letters show significant differences (p < 0.05) between sand dust and reclaimed effluent for a given bed slice. Different capital letters mean significant differences (p < 0.05) between bed slices for a given type of particle added.
Agriculture 13 00458 g005
Table 1. Factors included in the present study.
Type of Particle AddedTarget (and Actual Average ± Standard Deviation) Filtration Velocity (m h−1)Media Bed Slices (mm) 1
Inorganic (A4 sand dust)30 (30.5 ± 0.8)0–5
5–10
10–15
15–20
20–40
40–60
60–80
80–100
100–120
120–140
140–160
160–180
180–200
60 (59.5 ± 1.6)
Organic (reclaimed effluent)30 (31.4 ± 2.1)
60 (62.0 ± 2.7)
1 From the top of the bed to the bottom.
Table 2. Average ± standard deviation of mass of added solids, filtered volume and water temperature during the different experiments (N = 4).
Type
of Particle
Target Filtration Velocity (m h−1)Flow (m3 h−1)Added Solids 1
(g)
Filtered Volume (m3)Water Temperature (°C)
Inorganic (A4 dust sand)302.95 ± 0.168.38 ± 2.130.72 ± 0.1824.2 ± 1.3
605.69 ± 0.153.95 ± 0.880.32 ± 0.0722.8 ± 1.1
Organic (reclaimed effluent)302.99 ± 0.177.84 ± 3.990.46 ± 0.1419.9 ± 1.4
605.89 ± 0.2620.28 ± 8.751.68 ± 1.0617.6 ± 1.2
1 For the reclaimed effluent, this amount was estimated by multiplying the total suspended solids of the influent with the filtered volume.
Table 3. Significance levels (p-value) of the statistical model, each factor (filtration velocity, type of particle, and bed depth slice) and the double and triple interactions for explaining the ratio of total solids retained per mass of bed slice.
Parameterp-Value
Model<0.001
Filtration velocity0.001
Type of particlen.s. 1
Bed depth slice<0.001
Filtration velocity × type of particle0.003
Filtration velocity × bed depth slice0.020
Type of particle × bed depth slice0.013
Filtration velocity × type of particle × bed depth slice0.002
1 n.s.: not significant (p > 0.05).
Table 4. Significance levels (p-value) of the statistical model, each factor (filtration velocity, type of particle, and bed depth slice) and the double and triple interactions for explaining the percentage of the total suspended solids retained in each slice.
Parameterp-Value
Model<0.001
Filtration velocityn.s. 1
Type of particlen.s.
Bed depth slice<0.001
Filtration velocity × type of particlen.s.
Filtration velocity × bed depth slicen.s.
Type of particle × bed depth slice<0.001
Filtration velocity × type of particle × bed depth slicen.s.
1 n.s.: not significant (p > 0.05).
Disclaimer/Publisher’s Note: The statements, opinions and data contained in all publications are solely those of the individual author(s) and contributor(s) and not of MDPI and/or the editor(s). MDPI and/or the editor(s) disclaim responsibility for any injury to people or property resulting from any ideas, methods, instructions or products referred to in the content.