Article

Borated Fertilizations via Foliar and Soil for Peanut Production during the Sugarcane Reform

by
Ruan Aparecido Biagi Betiol
,
Risely Ferraz-Almeida
*,
Rafael Otto
and
Godofredo Cesar Vitti
Department of Soil Science, “Luiz de Queiroz” College of Agriculture, University of São Paulo, Padua Dias Ave, 11. Piracicaba, Piracicaba 13418-900, SP, Brazil
*
Author to whom correspondence should be addressed.
Agriculture 2023, 13(2), 347; https://doi.org/10.3390/agriculture13020347
Submission received: 31 December 2022 / Revised: 24 January 2023 / Accepted: 27 January 2023 / Published: 31 January 2023
(This article belongs to the Section Crop Production)

Abstract

:
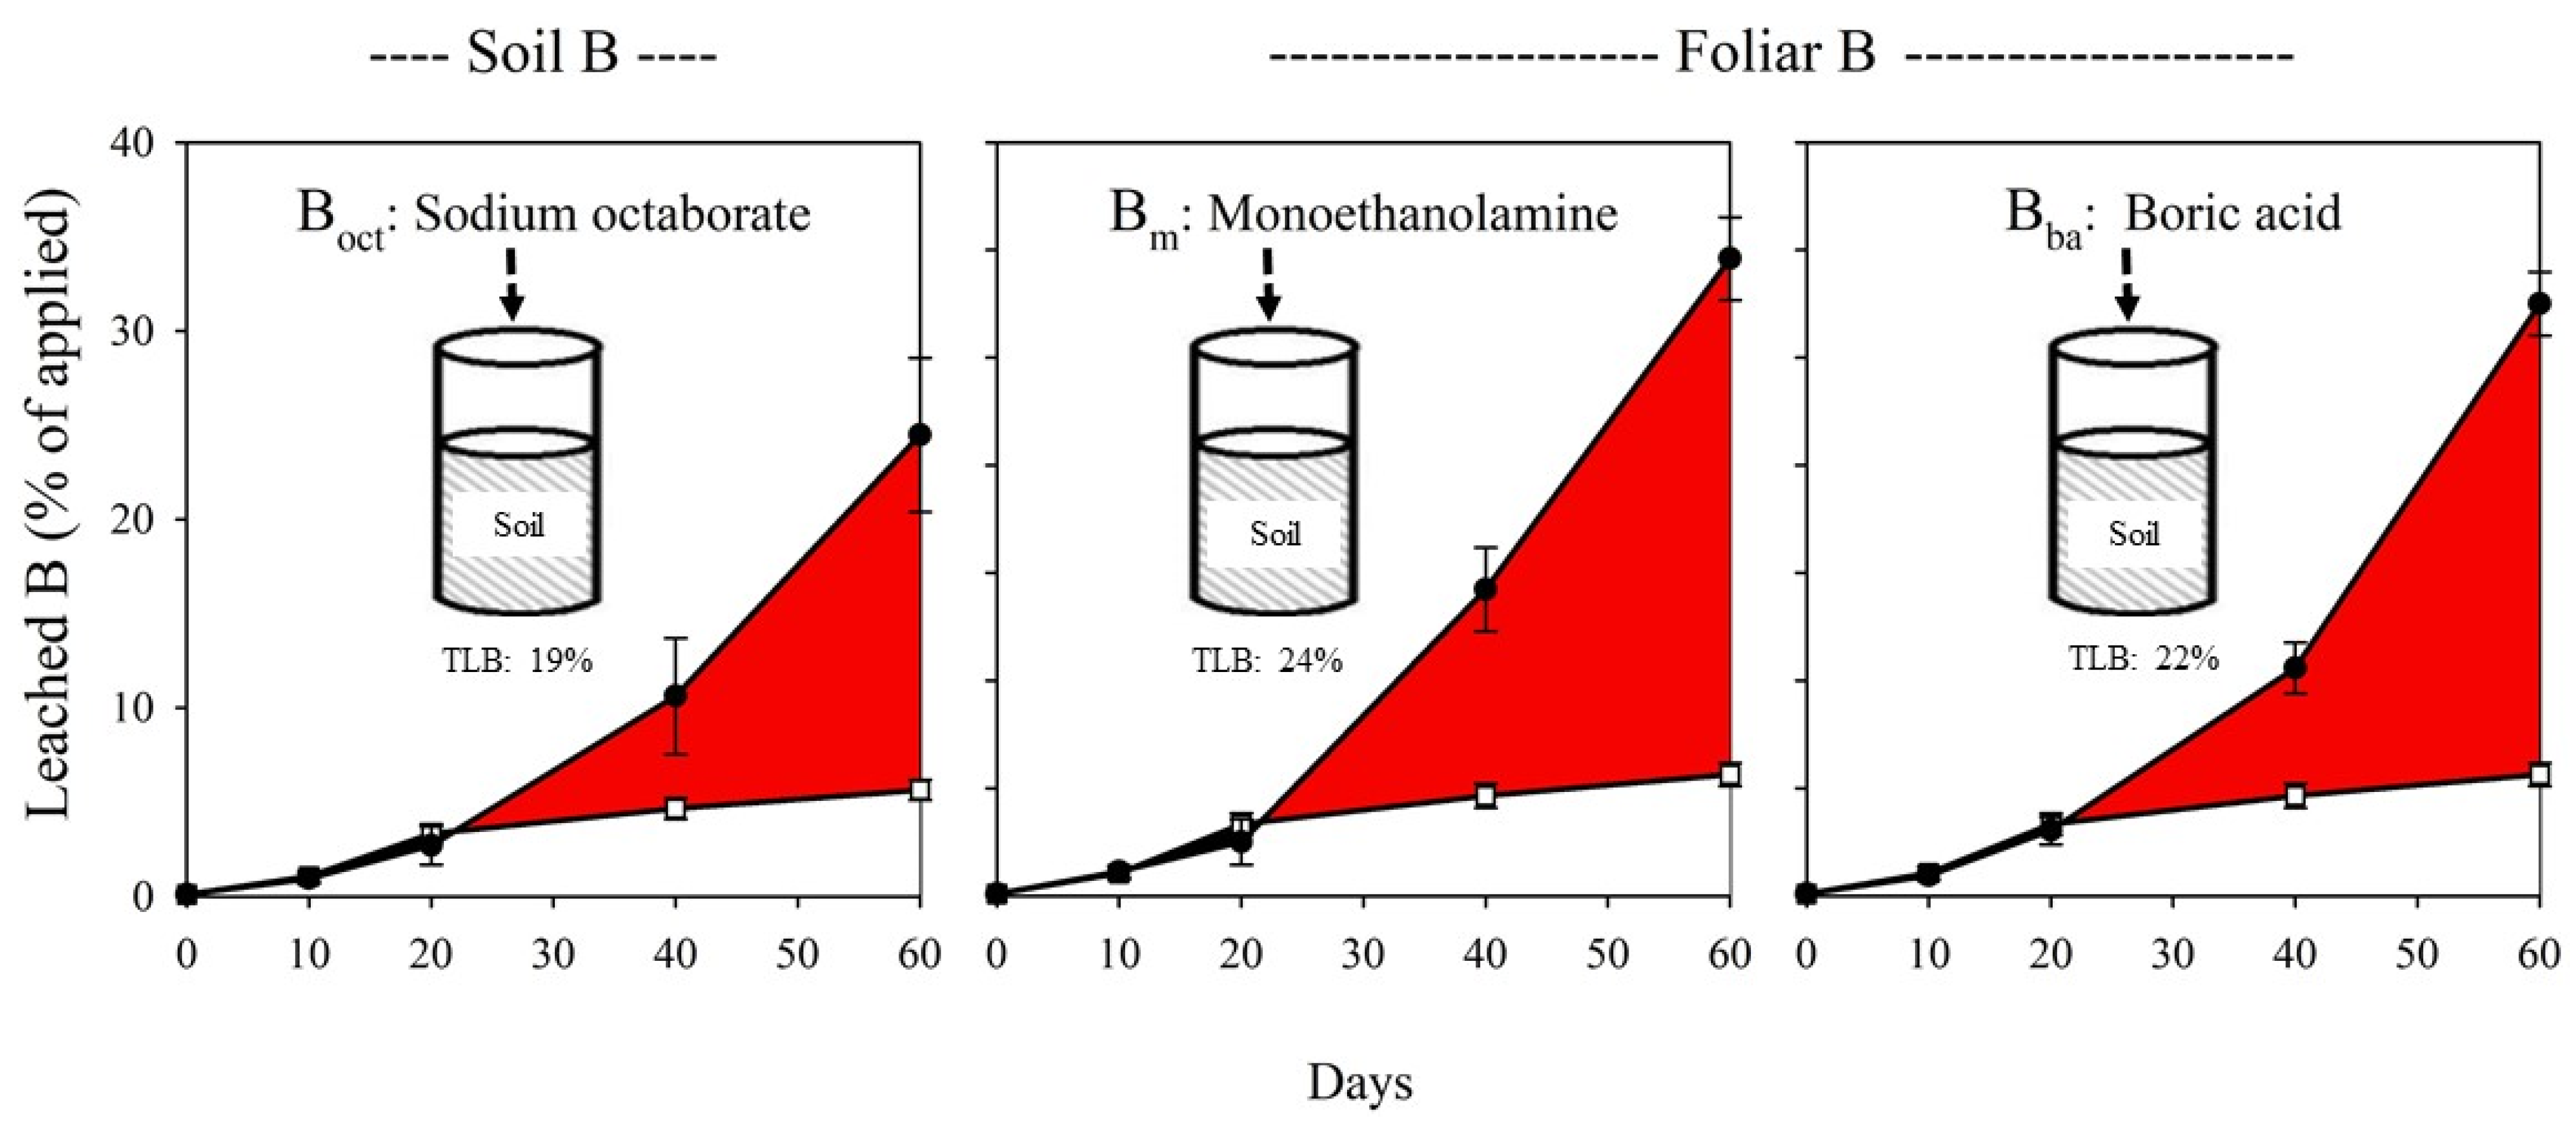
The sugarcane area expansion is promoting peanut production where the peanut is planted during the sugarcane reform in soils with low boron (B) content. This study aimed to monitor: (i) the efficiency of B application via soil and foliar on peanut yield parameters; (ii) the right B rate and source to increase peanut production; and (iii) the B leaching in the tropical soil. Methods: Two experiments were run in an area of sugarcane reform in São Paulo, Brazil. Study 1 applied foliar B (Bm, source: monoethanolamine) using rates from 250 to 1500 g ha−1, while study 2 applied soil B (Boct, source: sodium octaborate; rates) using rates of 0.5 (Boct0.5) to 1.0 kg ha−1 (Boct1.0), associated with foliar B (Bba, boric acid) with rates from 250 to 1500 g ha−1. Peanut yield parameters were measured, and an incubation study monitored soil B leaching. In both studies, isolated foliar Bba and Bm rates improved linearly the 100-grains yield of peanuts with an average of 74 g, while foliar Bba rates increased the grain yield. When there was an association between soil and foliar B, the optimal rates of Bba ranged from 700 to 900 g ha−1 at Boct0.5, while the optimal rates ranged from 400 to 700 g ha−1 at Boct1.0. Soil B leaching was lower in Boct < Bm < Bba with 19%, 24%, and 22% of leached-B, respectively. All sources increased leaf B indicating the B was absorbed by plants with a positive effect on leaf contents of calcium, potassium, nitrogen, and phosphorus. Based on the results, we conclude that the association of Bba (foliar) + Boct (soil) was shown to be the better alternative for increasing the peanut yield parameters and nutrient balance in leaves.

1. Introduction

Peanut (Arachis hypogaea L.) is a legume native to South America with a worldwide production of 44,041,913 tons per year. China is the largest peanut producer with 37% of worldwide production [1]. In Latin America, Brazil is the second-largest producer and exporter of peanuts. In the 2018/19 harvest, Brazil produced around 435,000 tons of peanut in an area of 146,600 ha (productivity of 2967 kg ha−1), while Argentina, the largest producer in Latin America, produced 977,000 tons in an area of 388,000 ha with productivity of 2520 kg ha−1 [2]. In Argentina, approximately 80% of peanut production is destined for export. By contrast, Brazil exports around 30% of its annual production, with a high level of internal demand [3].
In Brazil, peanut production is grown on the basis of the rotation system with sugarcane (Saccharum officinarum), where the peanut is planted during the sugarcane reform [4,5]. The association of sugarcane and peanut has improved soil conditions with a direct increase in nutrient availability (mainly nitrogen, N), due to the symbiotic relationship between peanut and soil bacteria with the atmospheric N fixation [6,7]. Salome et al. [8] showed that the planting of peanut (cultivar IAC-caiapó) in sugarcane reform increased sugarcane yield in 15 ton ha−1 and sugar pol in 3 ton ha−1. Ambrosano et al. [9] also noticed an incremental increase in sugarcane yield of 20 tons ha−1 and sugar pol of 3 tons ha−1 after peanut planting in sugarcane reform.
The sugarcane area is in expansion in the Brazilian Cerrado, which presents acid soil with low-nutrient natural content for plants. Brazil is the world’s largest sugarcane producer with a stalk and ethanol production of 642 million and 36 billion L yr−1, respectively, over a cultivated area of 8.5 M hectares [2]. In the new areas of production, the main soil conversion route is from degraded land to sugarcane with soil with a sandy texture, and low content of organic matter and nutrients (mainly, boron, B, and calcium, Ca) [4,5].
Boron is considered an essential element that directly influences cell wall structure maintenance due to the B presence in pectin, glycoproteins, and glycolipids [10,11]. The B is also linked to the formation of reproductive structures in plants (i.e., pollen grains and pollen tubes), and fruit and seed development, improving the nut quality [12]. Consequently, B deficiency in peanuts promotes the formation of new tissues with internal damage in grain, called “hollow-heart”, due to the deformation and discoloration of the cotyledons [13]. Peanut extracts 228 g ha−1 of B during the development cycle with a maximum extraction of 4.7 and 3.6 g ha−1 day−1 by plants and pods, respectively. Interestingly, the B requirement for peanuts is not as high as that for some other leguminous species (e.g., soybean) [14]. The B also improved the use of calcium with the translocation of sugars and proteins from the leaves to the grains, the development of root nodules, protein production, and flower retention [15].
If we consider that the expansion of the sugarcane area promotes peanut production in soil with low B content, soil management to increase the B content in soil is necessary to increase the peanut yield. The fertilizer applications via foliar and soil are the main strategies for B supply, positively affecting crop yield [16]. Mantovani et al. [17] showed that the peanut yield increased by 816 kg ha−1 with the foliar supplement of 1.5 kg ha−1 of boric acid, but with a significant reduction to B rate when higher than 2.5 kg ha−1. Kabir et al. [18] demonstrated higher peanut production (up to 340 kg ha−1) with application in the soil of 2.5 kg ha−1 of borax, while Vishwakarma et al. [19] recommended a rate of 5.0 kg ha−1 of borax to increase peanut production. The B application can be performed via foliar and soil with diverse B source options in agriculture (i.e., boric acid, borax, monoethanolamine, and sodium octaborate). Understanding the right source and rate is an important decision in the guiding principles for fertilizer management, mainly in tropical soil where B can be lost by leaching in sandy soils [20].
With the hypothesis that the application of B via soil and foliar is the optimal alternative to increase peanut production, this study aimed to monitor: (i) the efficiency of B application via soil and foliar in peanut yield parameters; (ii) identify the right B rate and source to increase peanut production; and (iii) monitor the B leaching in the soil.

2. Materials and Methods

2.1. Study Characterization

Two experiments were run in an area of sugarcane reform in Ribeirão Bonito, São Paulo, Brazil (22°04′ S, 48°10′ W, altitude: 590 m), in the 2018/2019 harvest (Figure 1). The climate of the region is classified as Cfa (humid subtropical climate) in the Köppen classification, with annual precipitation of 1315 mm and an average temperature of 20.7 °C. During the experimental study, the total precipitation was 669 mm, with a temperature ranging between 15.0 and 37.5 °C (Figure 1).
Before the experimental installation, soil samples were collected from five points (replications) at depths ranging from 0 to 0.25 m, and 0.25 to 0.50 m. The samples were homogenized and submitted to chemical and physical characterization according to Camargo et al. [21] and van Raij et al. [22] (Table 1). The soil was classified as an Argissolo Vermelho Amarelo in the Soil Classification Brazilian System [23], corresponding to a Ultisol in the Soil taxonomy [24] with a loamy sand textural class, and content of clay, silt, and sand of 116.5, 24, and 859.5 g kg−1, respectively. According to the analysis, the soil was classified as acidic (pH: 4.2–6.3) with low levels of B (<0.1 mg dm−3) in the 0–0.50 m layer [22].
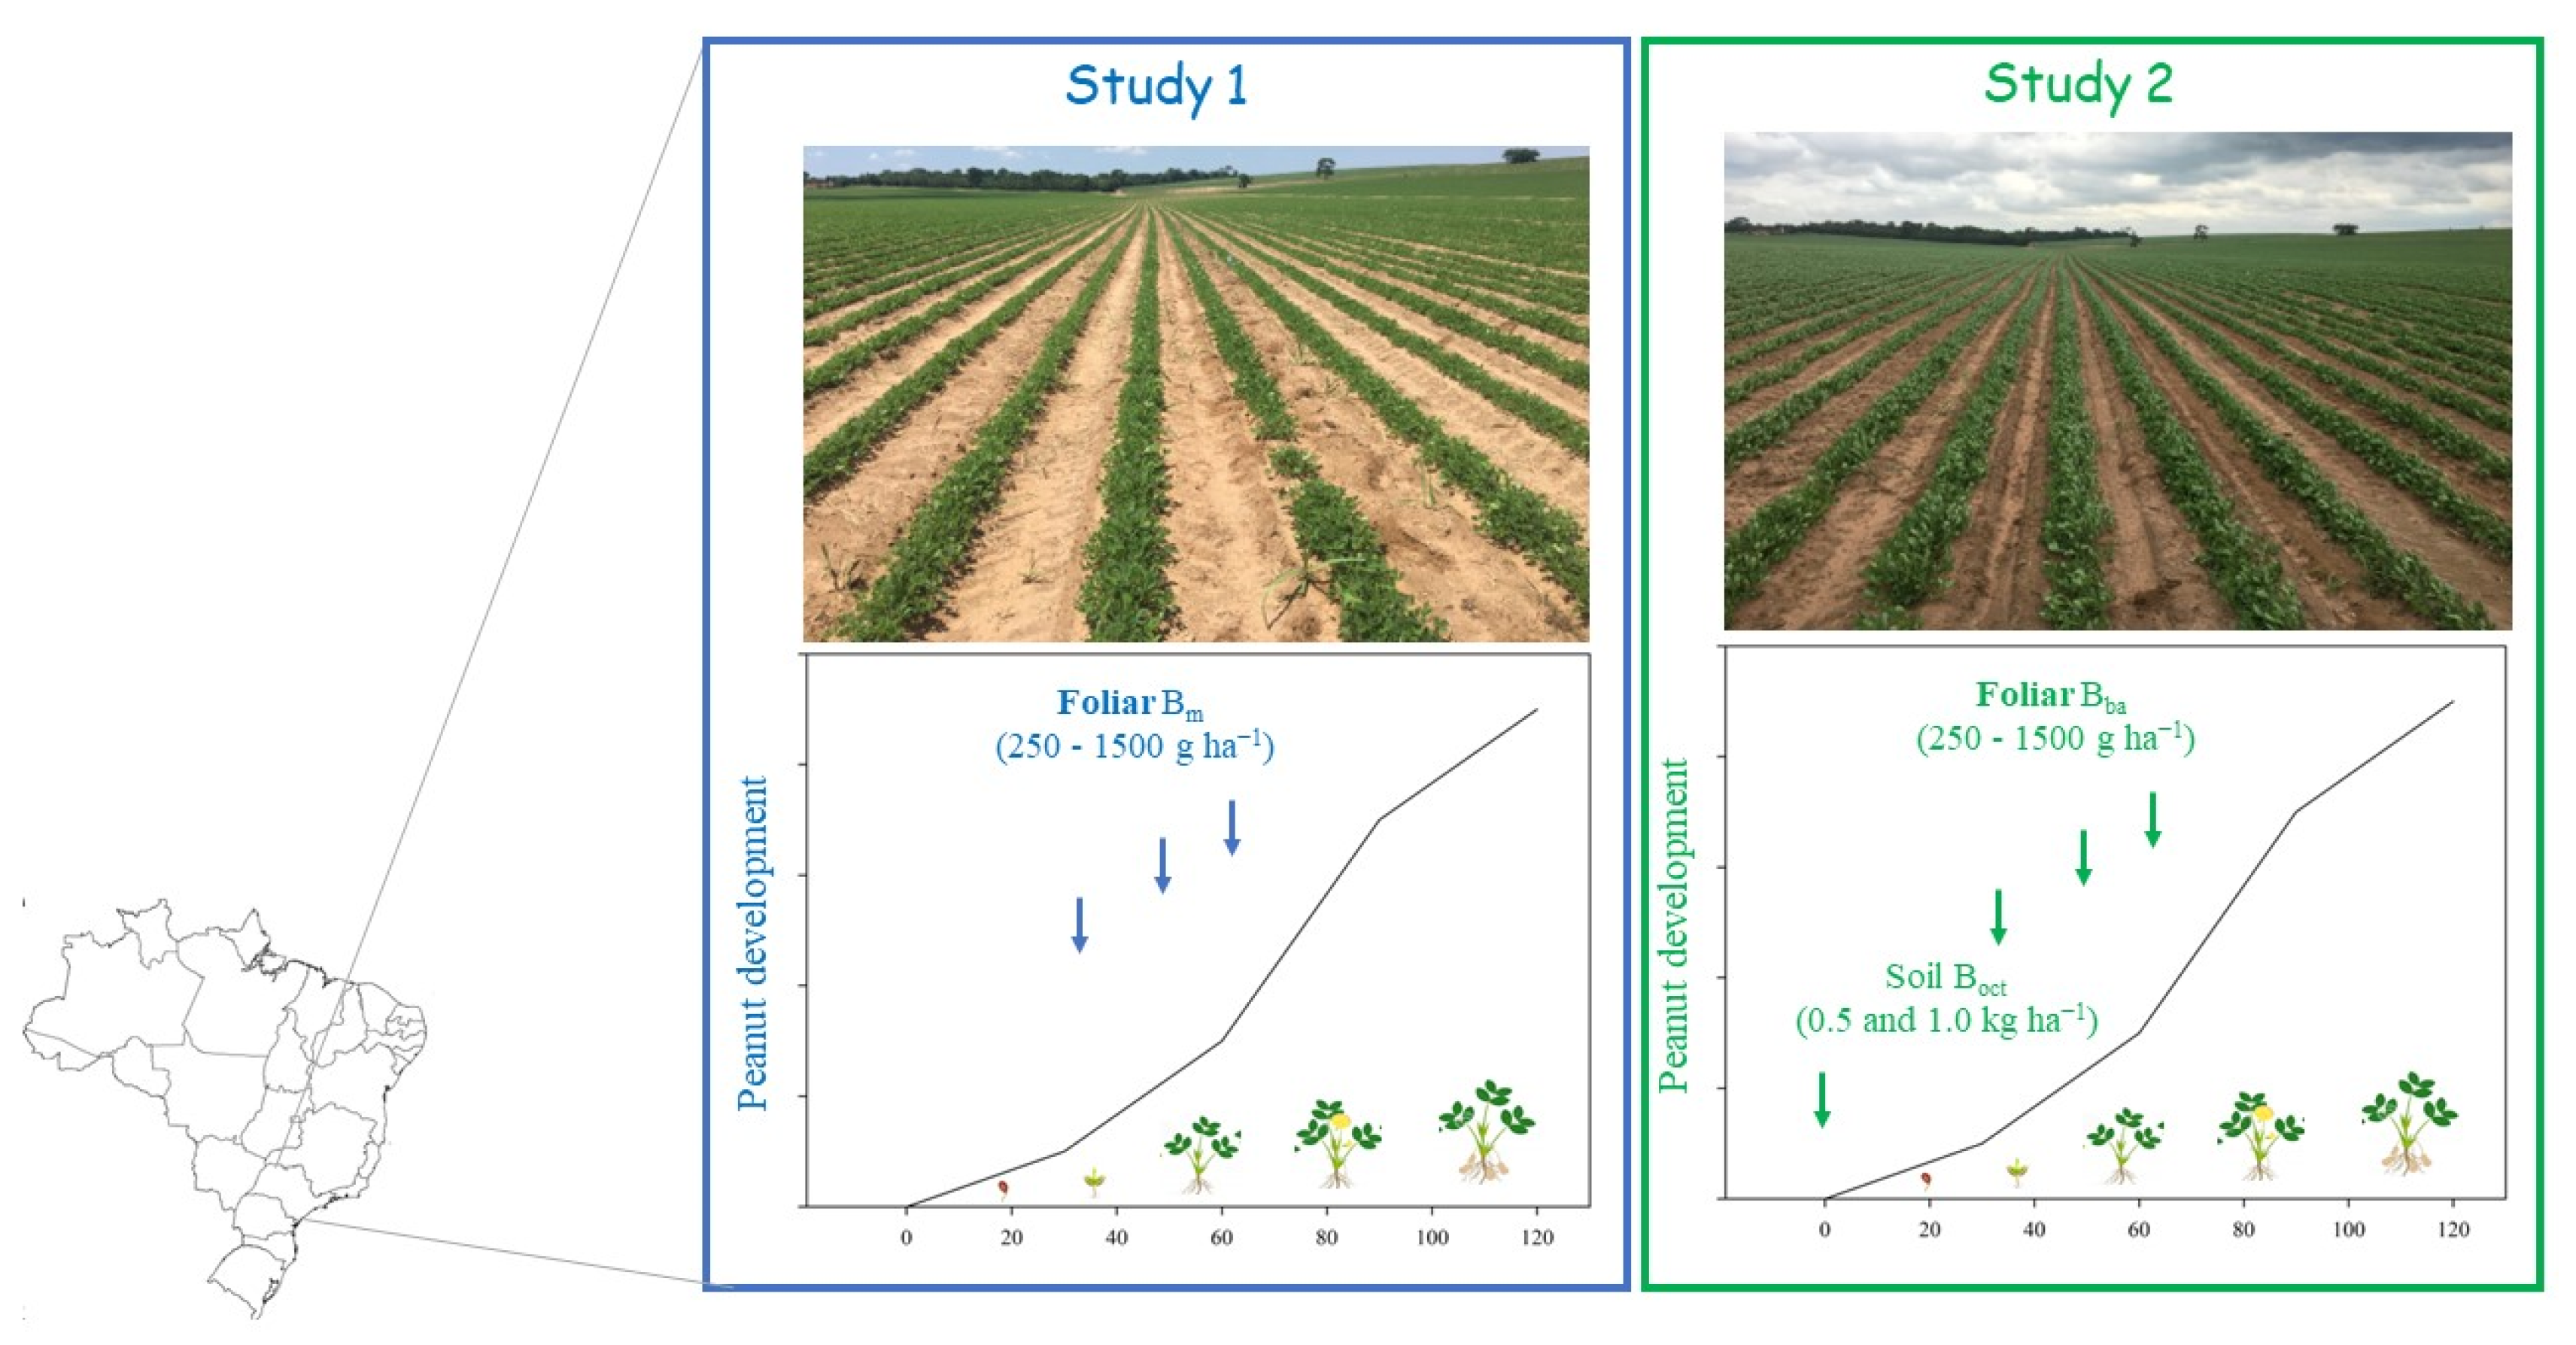
The two experiments were installed in a randomized block design (RBD) isolated from each other. In Study 1, there was the foliar application of B (Bm, monoethanolamine) using six B rates (250, 500, 750, 1000, 1250 and 1500 g ha−1) with four replications, totaling 24 experimental units (6 rates ∗ 4 replications = 24 units). In Study 2, there was the B application in soil using sodium octaborate (Boct) with two rates (Boct0.5: 0.5 kg ha−1; and Boct1.0: 1.0 kg ha−1), and the foliar B application using boric acid (Bba) with six rates (250, 500, 750, 1000, 1250, and 1500 g ha−1). In Study 2, there were four replications with a total of 48 experimental units (2 soil B rates ∗ 6 foliar B rates ∗ 4 replications = 48 units) (Figure 1).
In both experiments, the check-plots (controls) were run without B applications in soil and/or leaves, using four replications, and treated as an additional treatment. Each experimental unit presented four 3.6 m-wide planting lines spaced 0.90 m apart (two central lines as a useful plot), 20 m long, and an average stand of 12 plants per meter.
The peanut (variety, IAC-OL4) was planted in October using the conventional system in an area of sugarcane reform in both studies. The IAC-OL4 belongs to the Virgínia (Runner group), caracterized as a creeping peanut cultivar with a low growth habit, an average cycle of 130 days, and a yield between 4500–7000 kg ha−1. Initially, the sugarcane stubble was destroyed and incorporated into the soil using successive harrows (an average of five harrows).
The soil was prepared along the furrow according to the soil analysis involving the distribution and incorporation (0.25 m) of dolomitic limestone (rate: 2 Mg ha−1) and agricultural plaster (rate: 1 Mg ha−1), 30 days before planting to reach 70% base saturation. Furrows were opened and fertilized with 10, 75, and 25 kg ha−1 of nitrogen (urea: 45% N), phosphorus (P2O5; monoanionic phosphate), and potassium (potassium chloride: 60% K2O), respectively. The seeds were planted with a final population of 155,555 plants ha−1, using a spacing of 0.90 m between rows. During the conduction of the experiment, irrigation was not provided, due to ideal conditions of natural precipitation.
Foliar B applications were performed on the 30th, 45th, and 60th days after seed emergence using the monoethanolamine (135 g L−1) and boric acid (H3BO3; 17% of B), respectively, in Studies 1 and 2 (Figure 2). Foliar applications were carried out using a CO2 pressurized sprayer, operating at a constant pressure of 150 kPa, equipped with an application bar with four flat jet nozzles, model 110.04, spaced 0.50 m apart, which provided spray volume equivalent to 200 L ha−1. In Study 2, soil B was applied and incorporated after the planting using sodium octaborate (Na2B8O1 0.4H2O; 21% of B) in the plant-apply system (Figure 2). Boric acid and sodium octaborate present a dusty form with B concentration and solubility of 17% and 2.5 g 100 mL−1, and 21% and 5.3 g 100 mL−1, respectively. The monoethanolamine was a concentrated solution with 150% of B (Table 1).

2.2. Plant Measurements

In both studies, yields of grains and pods were mechanically performed in the two central lines after four months of planting (grains with 11% humidity). Random sampling was performed to determine the weight of 100 grains and 20 pods. In the second month after planting, leaves (top visible dewlap) were randomly sampled to determine the content of boron, calcium, nitrogen, phosphor, and potassium following the procedures of Malavolta et al. [25]. The nutrient contents in roots and peanut pods were not monitored because the focus of the study was to check nutrient absorption and not nutrient accumulation in plants.
The maturation of pods was monitored by the peeling scraping method with the endoderm verification (“hull scrape method”). According to the Rules for Seed Analysis, the germination test was performed using a paper substrate (Germitest paper) moistened with water. The germination percentage was determined by monitoring the germinated seeds and normal seedlings on the fifth day after the test installation.

2.3. B Leaching Study

An incubation study of soil B leaching was run at the University of São Paulo, Brazil, testing the monoethanolamine, sodium octaborate, and boric acid. Soil samples with a loamy sand textural class were collected in the soil layer 0–0.4 m (arable soil layer with higher root concentrations), air-dried, sieved (2 mm), and analyzed for soil characterization [22]. Soil presented a pH (CaCl2) of 5.1, and contents of organic matter (dichromate oxidation method) and B (hot-water method) of 16.0 g dm−3 and 0.3 mg dm−3, respectively. The soil was corrected with the application of calcium and magnesium carbonate (base saturation of 70%) and transferred to columns (height 0.4 m; diameter 0.1 m; total volume 3.5 dm−3).
Leached B was monitored on the 8th, 20th, 40th, and 64th days after the applying of B rate (4 kg ha−1) and moisture correction (60% of water retention capacity). B in leaching was filtered through Whatman filter paper No. 42, and B content was analyzed using ICP-MS.

2.4. Data Processing and Statistical Analysis

Data were evaluated using descriptive statistics, and outliers (when identified) were removed by the Grubb test. The normality of the data and the homogeneity of the variance were assessed using the Shapiro-Wilk test and Bartlett’s test, respectively. The data were submitted to analysis of variance (ANOVA) using the F test (p < 0.01), the averages of B soil rates (sodium octaborate) were compared using the LSD test (p < 0.01), and the averages of leaf B rates (sodium octaborate and boric acid) were compared with the egression Regression test (p < 0.05).
The interaction between monoethanolamine and sodium octaborate was tested: (i) significant interaction was represented by the average of all treatments; and (ii) lack of significant interaction was represented by the average of individual factors (soil and foliar B). In ANOVA, each experiment (Study 1 and 2) was statistically analyzed separately, due to the difference in B sources between them, and they were not compared here.
Statistical analysis was performed in R (version 4.0.0; R Foundation for Statistical Computing), and results were graphed in SigmaPlot (version 11.0; Systat Software, Inc., Palo Alto, CA, USA).

3. Results

3.1. Peanut Yield

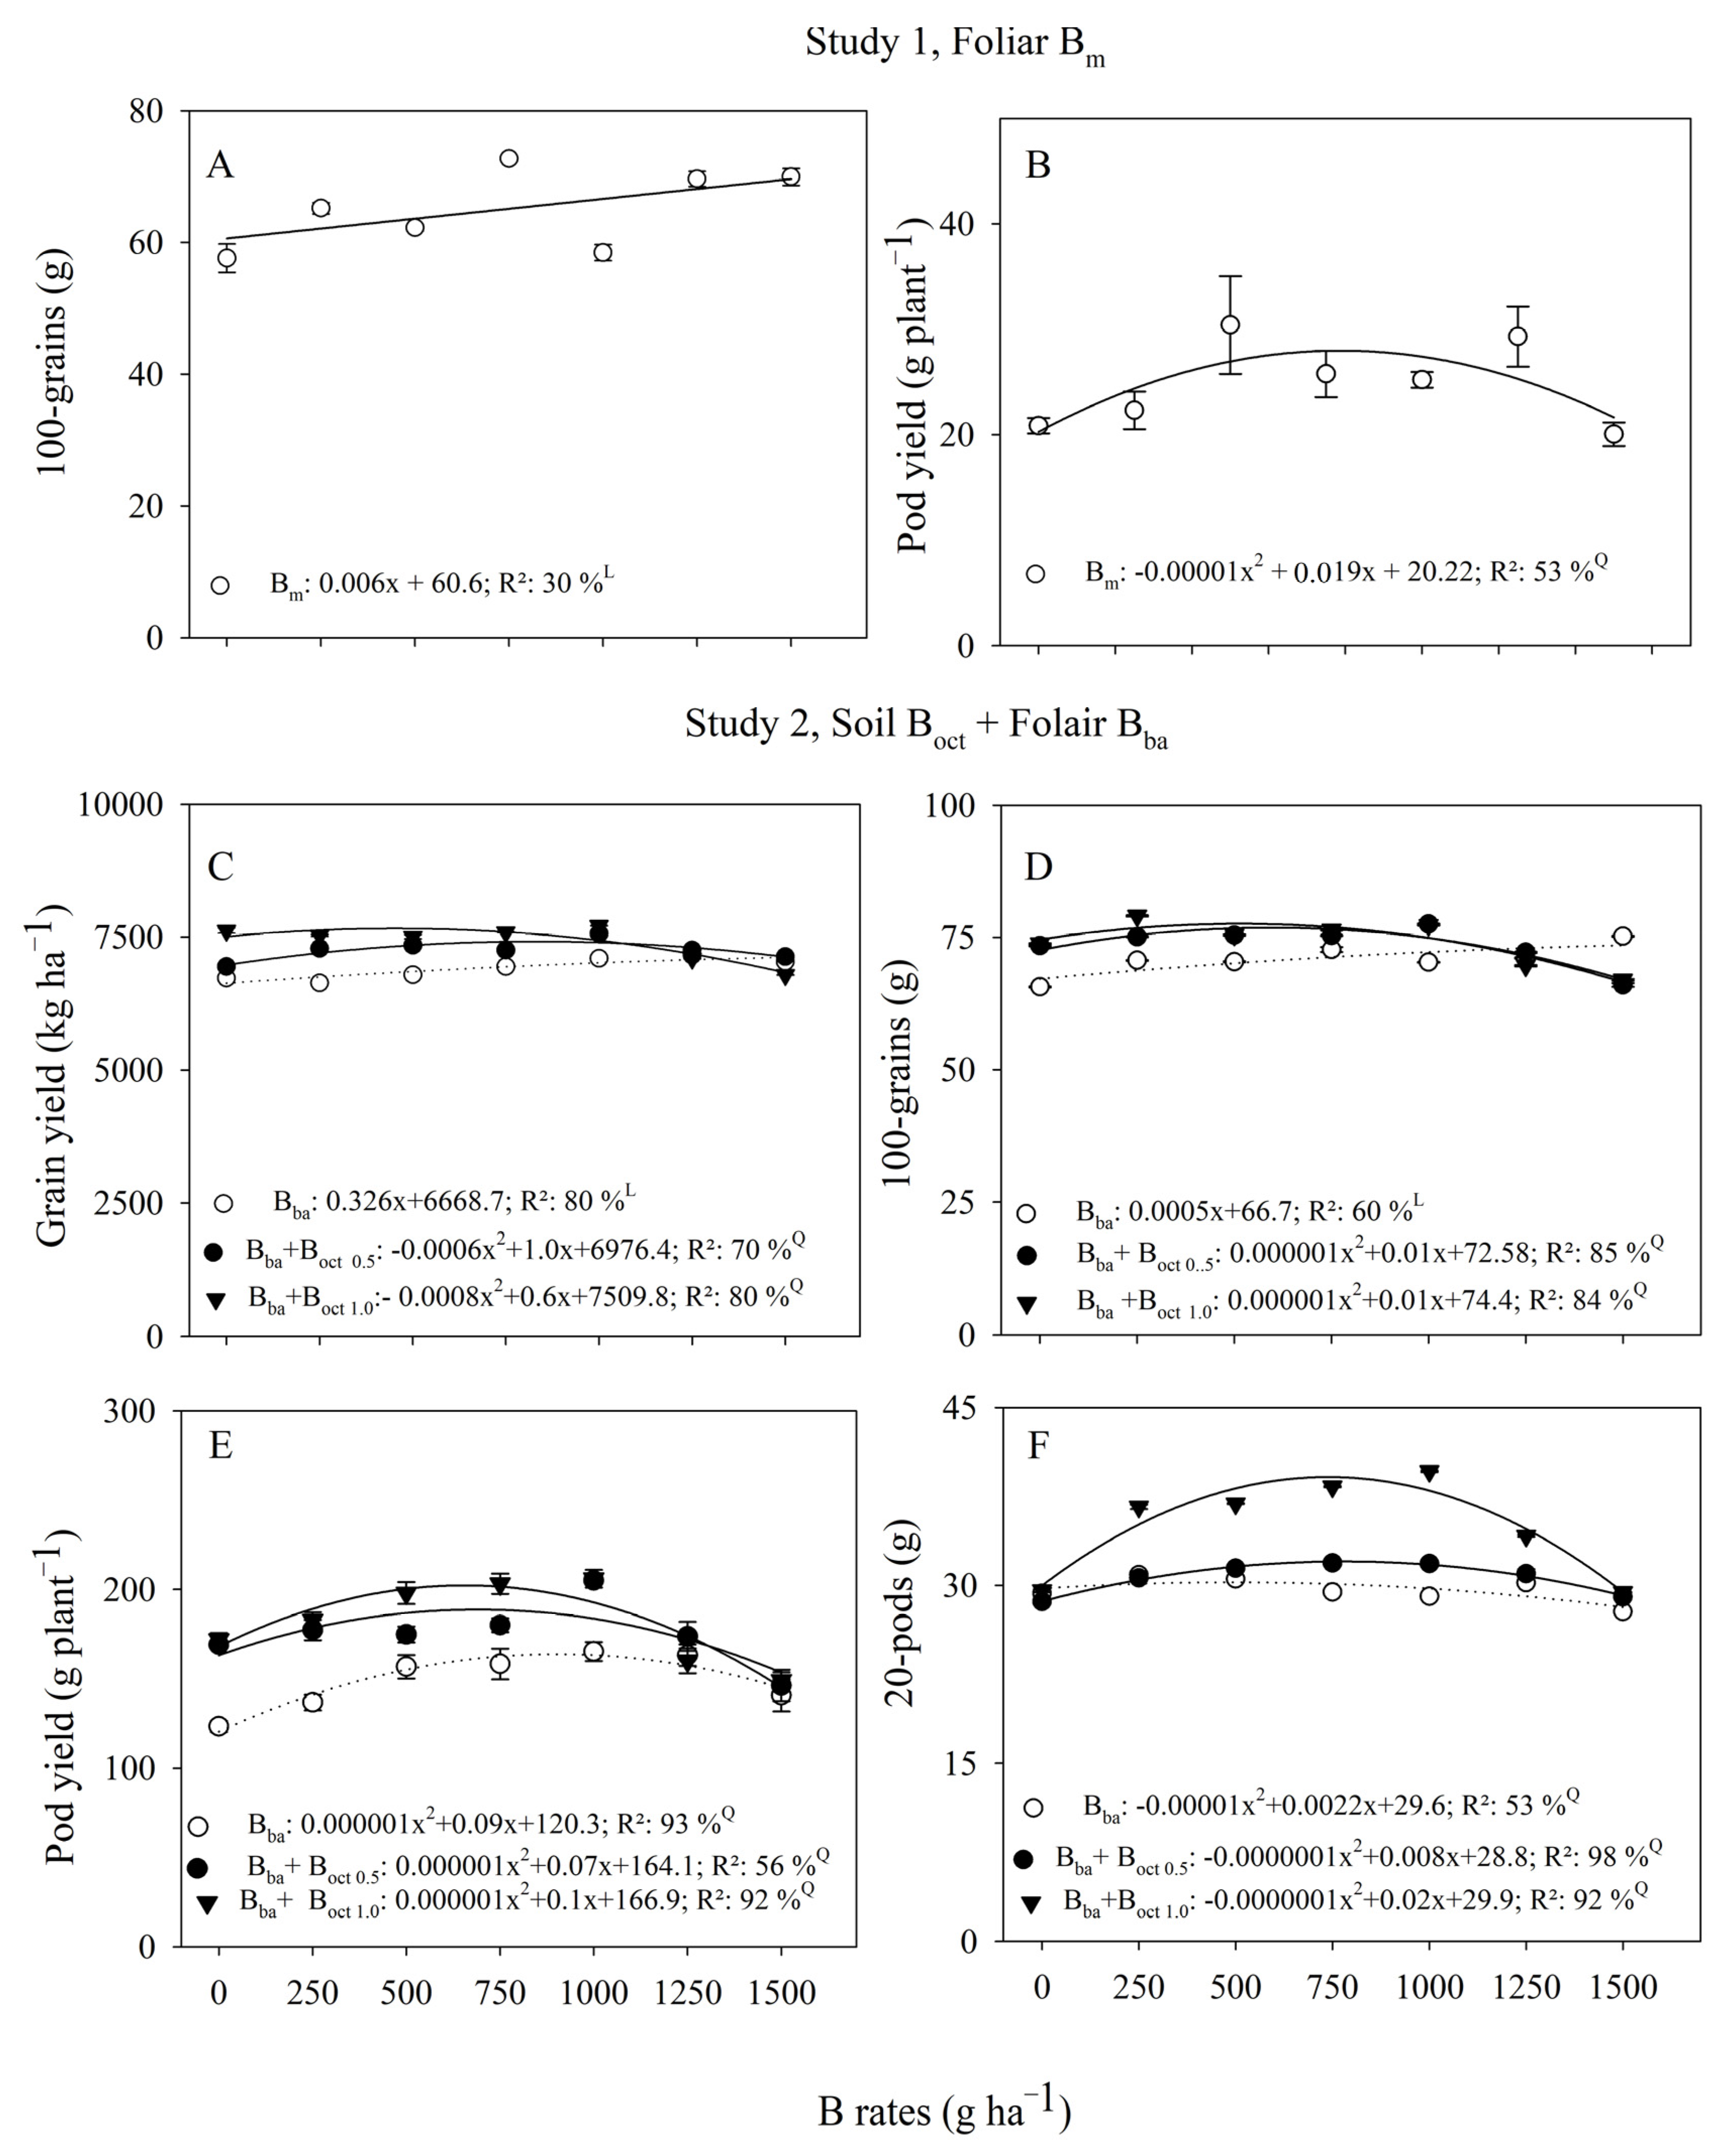
In Study 1, foliar Bm fitted a linear response in 100-grains with a maximum weight of 75.2 g (R2: 30%; p < 0.05), while there was a quadratic response in pod yield with the optimal rate adjusted at 950 g ha−1 (R2: 53%; p < 0.05) (Figure 3A,B). In contrast, there was no Bm effect in grain yield and 20-pods, with a general average of 6,882 kg ha−1 and 28.3 g, respectively (Table 2).
In Study 2, there was a positive interaction between Boct and Bba in all yield parameters, indicating that both practices are responsive in peanut yield (Table 2). The isolated Bba fitted linear response in grain yield and 100-grains with an average of 7157 kg ha−1 and 74 g, respectively (Figure 3C,D).
When there were associated Boct and Bba, the Bba rates fitted quadratic responses in grain yield, 100-grains, pod yield, and 20-pods with optimal rates at 886, 715, 704, and 850 g ha−1 at 0.5 kg ha−1 of Boct; and 428, 610, 681, and 620 g ha−1 at 1.0 kg ha−1 of Boct (Figure 3C–F). In general, 1.0 kg ha−1 of Boct promoted a higher yield of grains, 100-grains, pods, and 20-pods representing an increase of 2%, 1%, 6%, and 13% when compared to the rate of 0.5 kg ha−1 of Boct, and an increase of 7%, 4%, 19% and 16% compared to the control, respectively (Table 2).

3.2. Leaf-Nutrients

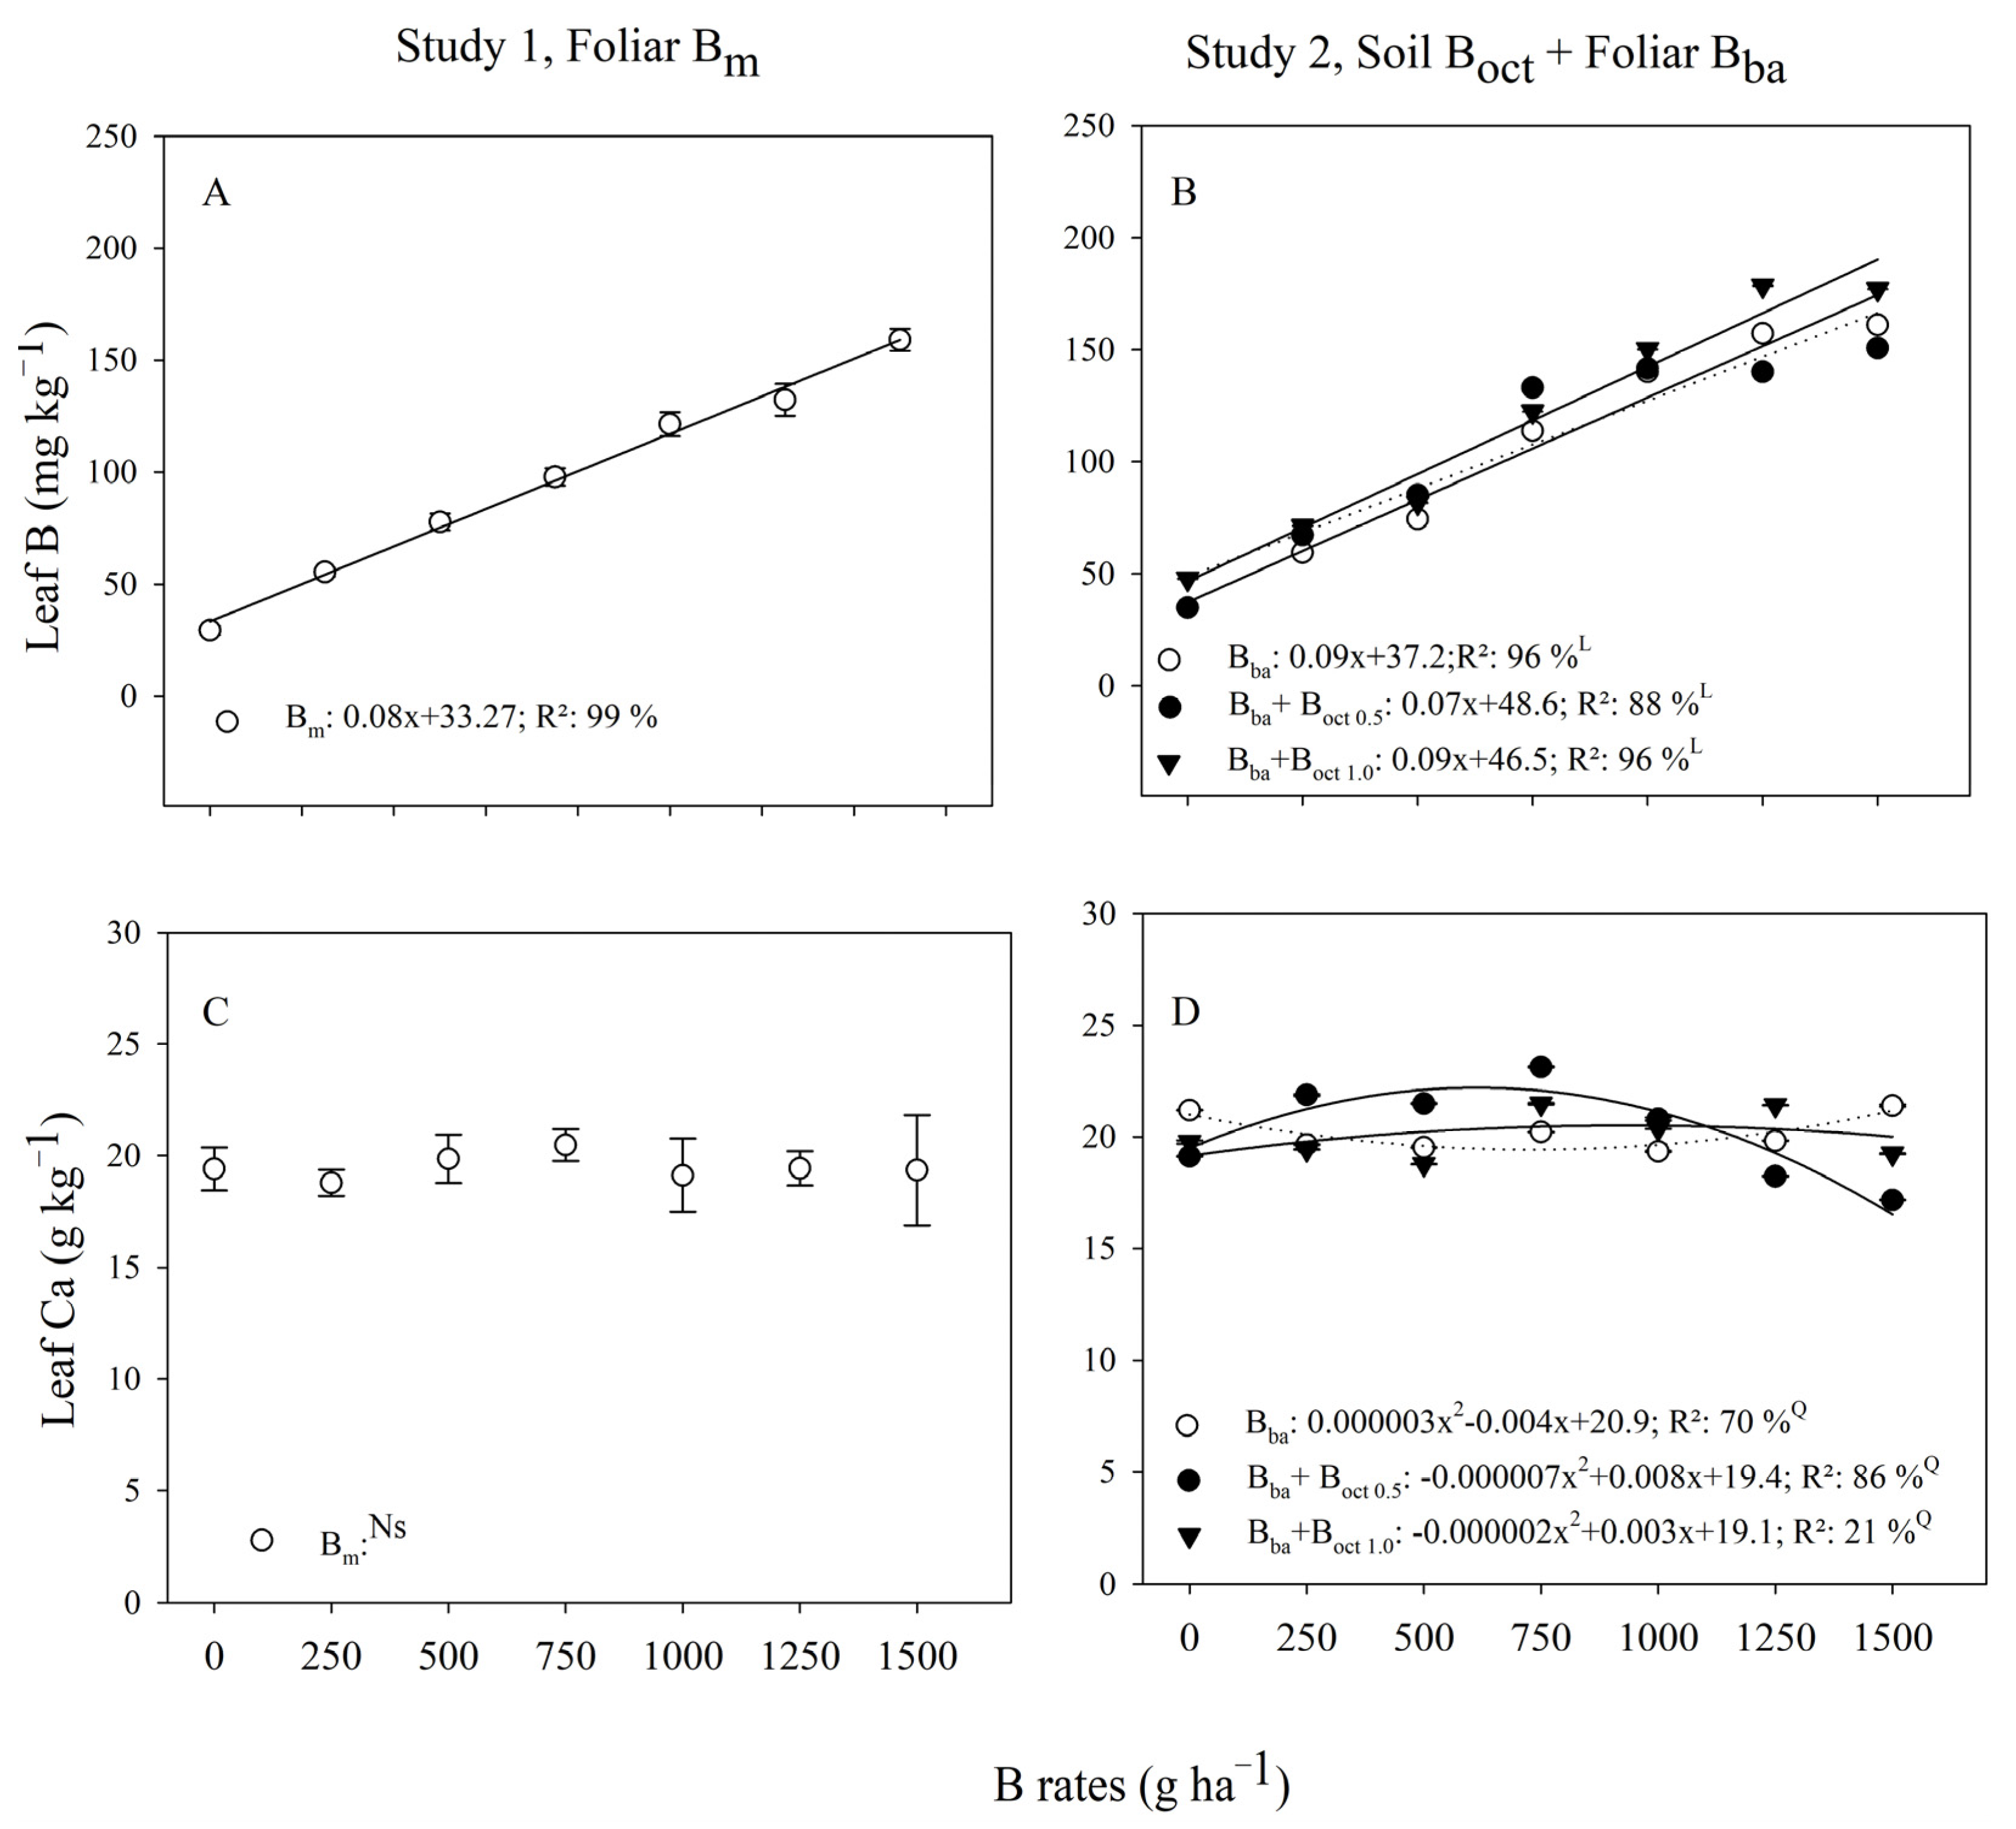
In both studies, the B rates promoted a linear increase in leaf B (R2: >88%) with an increment of 82%, 78%, 76% and 73% with Bm (Study 1), Bba, Bba + Boct0.5, and Bba + Boct1.0 (Study 2), respectively (Figure 4). In general, higher values of leaf B were found with the application of Bba + Boct1.0, representing an increase of 9% and 11% compared to Bba + Boct0.5 and the control, respectively (Table 3).
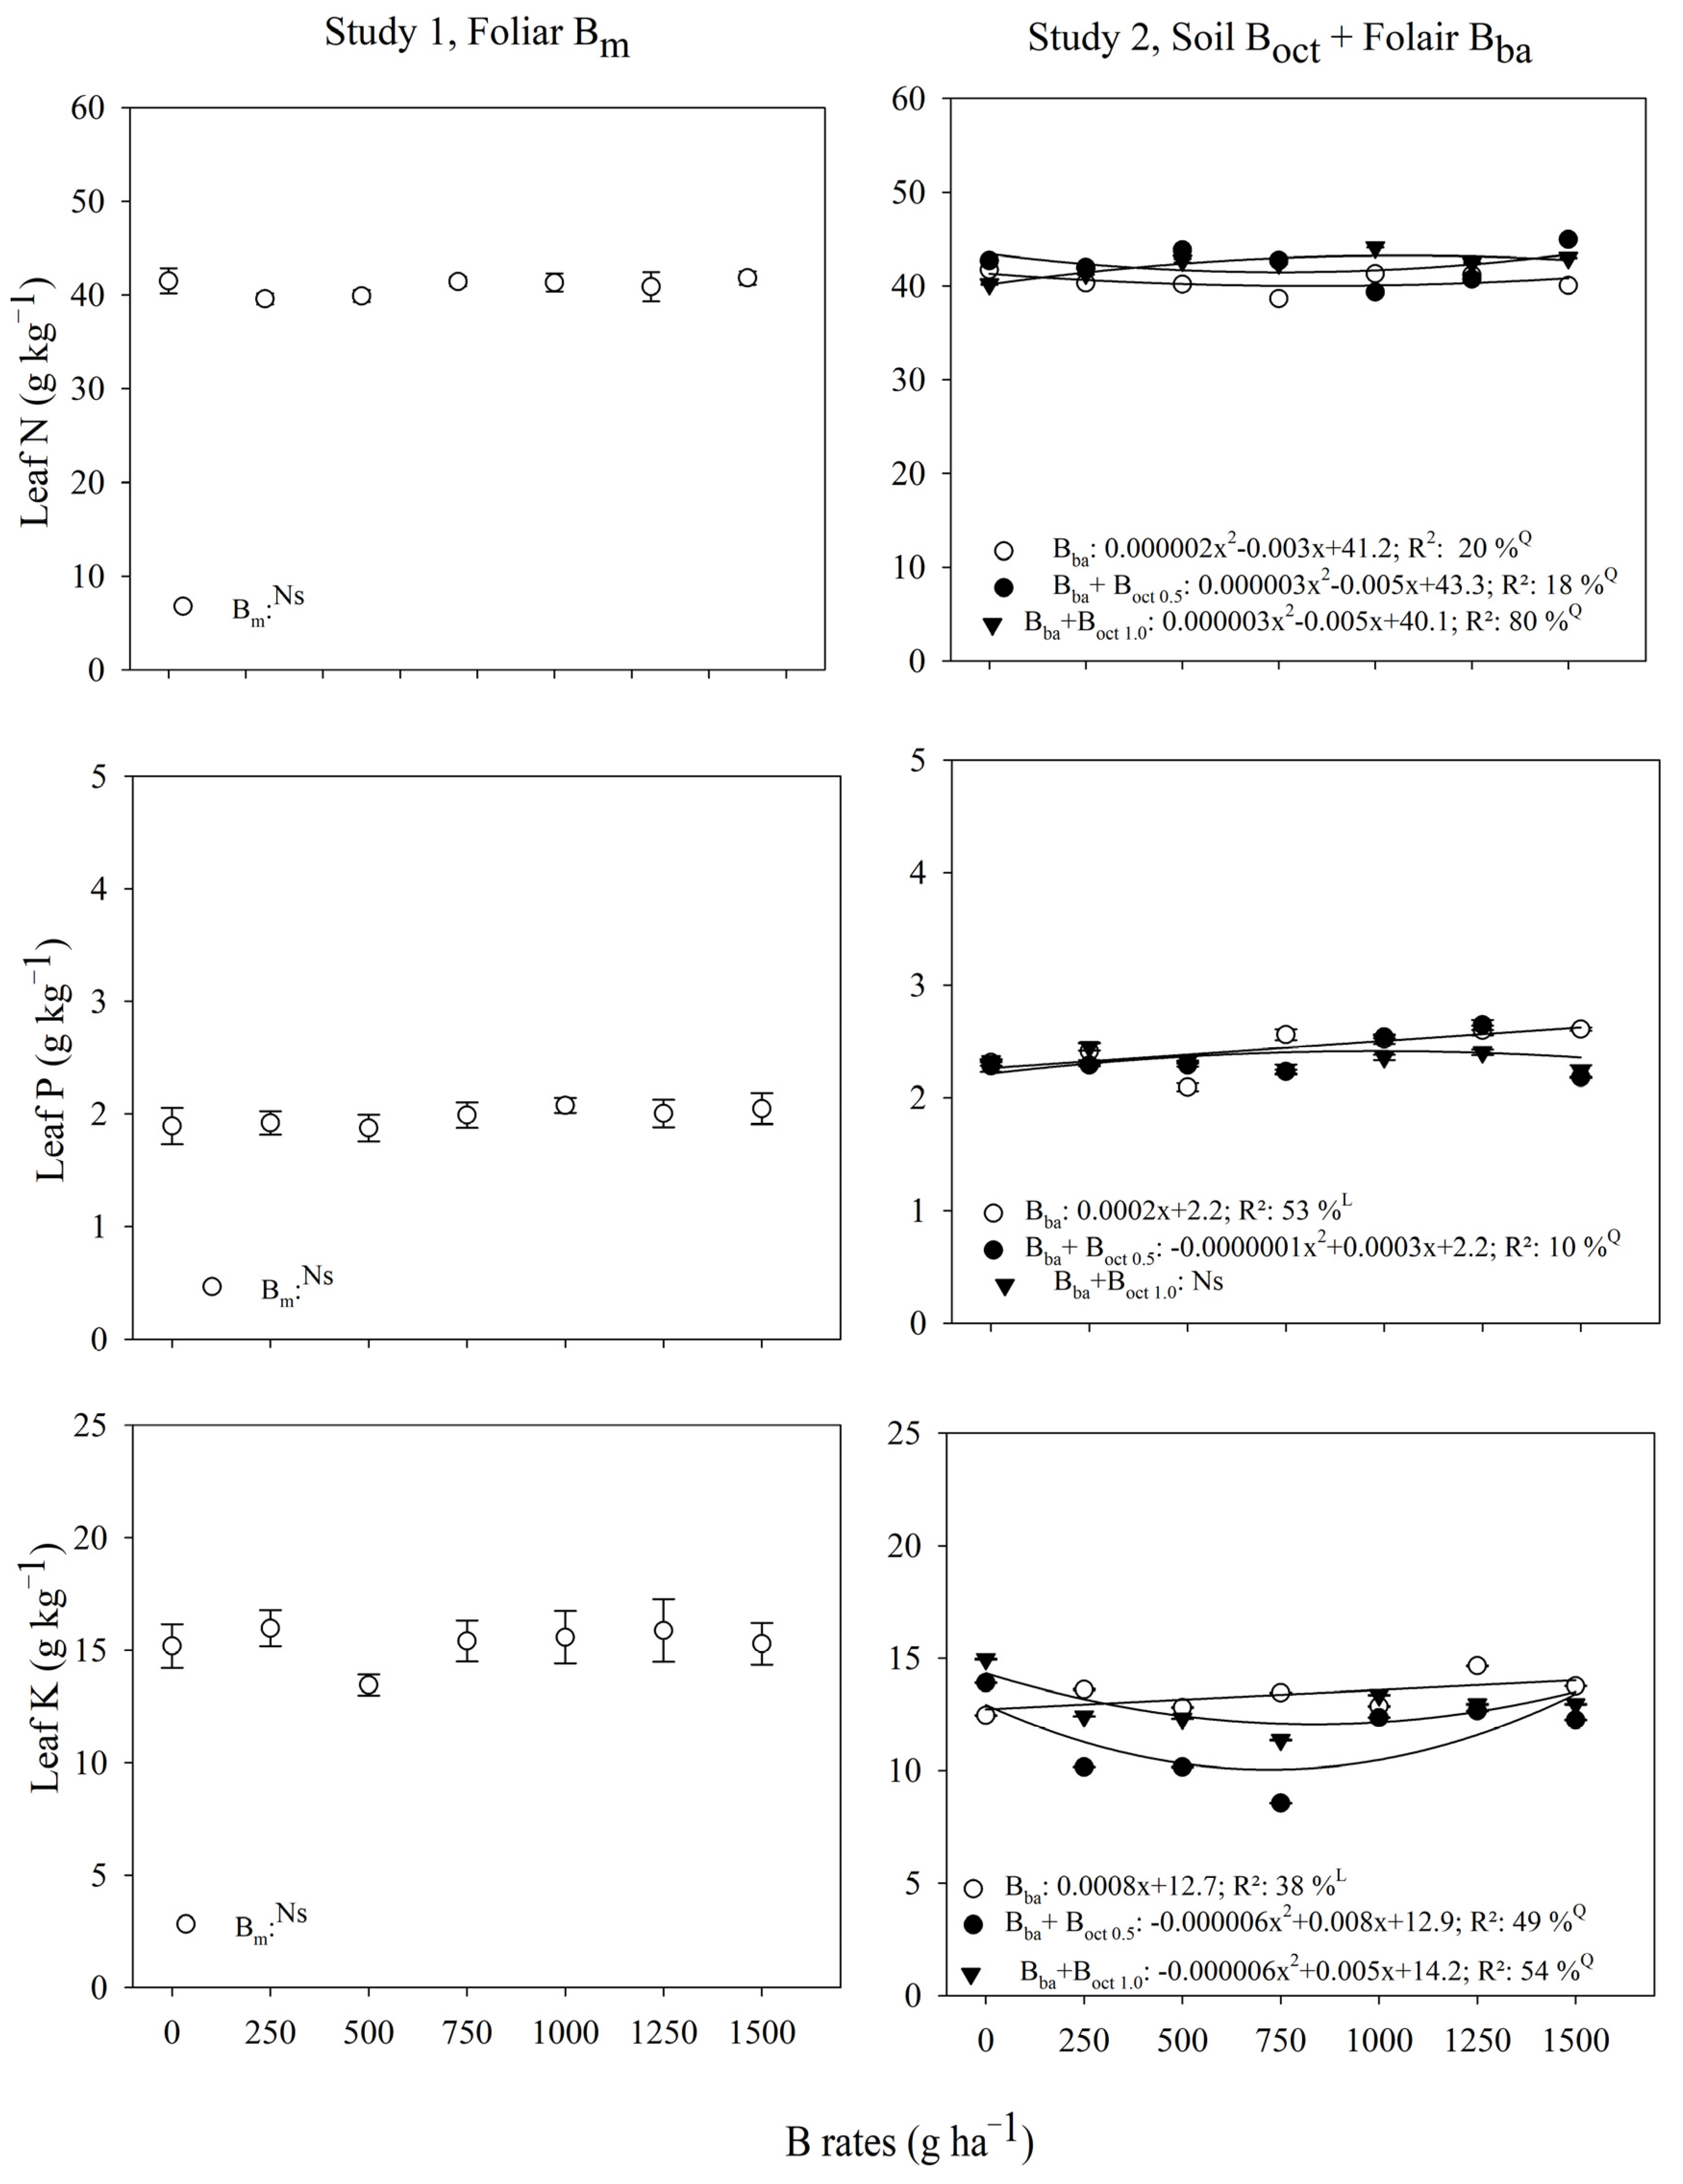
In Study 1, there was no effect of foliar Bm in leaf contents of Ca, N, P, and K, with a general average of 19.7, 40.8, 1.9, and 15.2 g kg−1, respectively (Table 3 and Table 4). By contrast, in Study 2, the isolated Bba fitted quadratic responses in leaf Ca with the optimal rates adjusted at 733, 635, and 775 g ha−1 in, respectively, the control, 0.5, and 1.0 kg ha−1 of Boct (Figure 4).
Additionally, in Study 2, the isolated Bba fitted linear responses in leaf P and K (R2: 38%), and a quadratic response in leaf N with the optimal rate fitted at 750 g ha−1 (Table 4 and Figure 5). With the association of fertilizers, Bba fitted a quadratic response in leaf N with the optimal rate at 833 g ha−1 with both rates of Boct (0.5 and 1.0 kg ha−1). The Bba fitted a quadratic in leaf K with optimal rates at 666 and 416 g ha−1 associated with 0.5 and 1.0 kg ha−1 of Boct, respectively (Table 4; and Figure 5).
Bba and Bba + Boct0.5 fitted a linear response in maturation with values higher than 67% (R2: >64%). By contrast, the association of Bba + Boct1.0 fitted a quadratic response with the optimal rate adjusted at 500 g ha−1 (Table 5; Figure 6).
The highest average of maturation was noticed with the association of Bba + Boct1.0, with a general average of 64% (Table 5). Bba did not influence the normal seedlings, with a general average of 73%. However, there was an increase of 15% with the application of Bba + Boct, fitting a quadratic response with the optimal rate at 1000 g ha−1 in both Boct rates (Table 5; Figure 6).

3.3. Leached B

Sodium octaborate presented a low B leaching in the soil, with an average ranging from 1% to 24% of lost B and a total of 19% leached B. Both monoethanolamine and boric acid, used as foliar, showed a higher B leaching in the soil, with an average of 24% and 22% of the total B leached, respectively (Figure 7).

4. Discussion

In Study 1, the monoethanolamine applied foliar promoted the production of 100-grains and pods with the optimal rate adjusted at 950 g ha−1. However, there was no effect on peanut yield, with an average of 6882 kg ha−1. The absence of a significant effect of monoethanolamine on the productivity of legumes was also demonstrated by Kappes et al. [26] in soybeans, using doses between 0 and 400 g ha−1. However, Bergmann [27] showed that monoethanolamine contributed to increasing biomass yield, and water uses the efficiency of spring barley. Varanda et al. [28] showed that B rates ranging from 1 to 1.5 kg ha−1, using monoethanolamine, promoted soybean production in sandy soil with a low level of B in soil (0.2 mg dm−3). In the literature, there were no studies with the application of monoethanolamine as a B source in peanut production with which to compare our results. Monoethanolamine (C2H10BNO4) is a fertilizer found as a concentrated solution with a density of 1.3, and a pH of 8.2. The increments of 100-grains and pods are associated with higher grain filling and more viable flowers for the formation of gynophores and pods. Chitdeshwari and Poongothai [29] showed a positive correlation between borated fertilization and the increase in the synthesis of amino acids and proteins, resulting in larger-caliber grains. The B promotes the photosynthetic activity in leaves and the transport of photoassimilates from the vegetative part to the reproductive part of the plant, promoting greater production of flowers [30]. Rahman et al. [16] observed a higher number of flowers and gynophore formation in peanuts with the application of boron at 3 kg ha−1, combined with 100 and 150 kg ha−1 phosphorus.
In Study 2, the association between foliar boric acid and soil sodium octaborate presented higher peanut production with a general average of 7.331 kg ha−1, considered superior to isolated monoethanolamine (up to 6.1%; 6.882 kg ha−1), boric acid (up to 5.7%; 6.913 kg ha−1), and 146% superior to the average of Brazilian production (2980 kg ha−1) [2]. The sodium octaborate (Na2B8O1 4H2O) is a fertilizer found as dust with a density of 1.1, and a pH of 7.5, while boric acid is also found as dust with a density of 1.4, and pH of 5.1. In our study, the soil B content was considered low (<0.1 mg dm−3), according to van Raij et al. [22], explaining the B positive effect on yield in Study 2. In the US state of Georgia, levels above 0.15 mg dm−3 (extraction in hot water) are considered adequate for the cultivation of peanuts, with recommendations for B content below 0.5 mg dm−3.
The associated application of Boct and Bba also increased the percentual of maturation pods and normal plants, with a general average of 63.4% and 86.9%, respectively. The peanut harvest is recommended with a percentual maturation higher than 75% [31]. The linear response with Bba rates associated with control and Boct at 0.5 kg ha−1 indicated the positive B effect in maturation, even though the percentual was lower than recommended. Pierre et al. [32], testing foliar fertilization with N (10 kg ha−1), P (1.0 kg ha−1), and B (0.34 kg ha−1), noticed that the B presented a positive response in maturation. However, there was no effect in the percentual of normal plants. The increase in maturation pods with B application is because B participates in cell maturation and sugar transport [33], and, therefore, the deficiency or high B content promotes negative effects on cell function [34]. The B deficiency in the grains can cause embryo rot, impacting the seed germination and seedlings’ development.
The greatest B source associations were noticed with (i) 0.5 kg ha−1 of Boct in planting associated with 886 g ha−1 of Bba; or (ii) 1.0 kg ha−1 Boct in planting associated with 428 g ha−1 of Bba. A rate of 2 kg ha−1 of a commercial product with boric acid (25%) and sodium octaborate (75%) was recommended by Varanda et al. [28] to increase soybean yield. Singh et al. [35] showed that the acid boric application of 1.0 kg ha−1 (soil + foliar; three applications: 30, 50 and 70 days after the emergency) promoted the productive parameters of peanuts (productivity, the weight of 100 grains, and pods per plant). In sugarcane, Marangoni et al. [36] noticed that rates of acid boric higher than 2 kg ha−1 via soil reduced sugarcane yield in the first and second ratoon. Therefore, soil B promoted a reduction in rates of foliar B with continuous B supply during the plant development.
In both studies, there was a linear increase in B content in leaves, indicating the B was absorbed with foliar and soil applications. B absorption by leaves and roots is strictly related to the nutrient concentration outside the structures. This absorption occurs passively, controlled by the formation of boron complexes (non-exchangeable) in the cytoplasm and cell wall, and by the plasma membrane’s permeability [37]. In Study 2, the B application also increased the leaf Ca, with optimal rates adjusted between 600 and 700 g ha−1 of Bba with 0.5 or 1.0 kg ha−1 of Boct. The synergistic effect of B and Ca was demonstrated by Davis et al. [38] in tomatoes, using the nutritive solution (boric acid and B-mannitol) with an increment of 0.37 mg of B and 0.04 g of Ca plant−1. Boron and calcium synergy have been studied and analyzed in plants, bacteria, animals, and humans, but the processes of this interaction are still debated. The synergistic effect of B and Ca in peanuts is important due to high Ca demand. Interestingly, there was no effect of foliar Bm in leaf Ca with a general average of 19.7 g kg−1, within the appropriate range of 12–20 g kg−1. This result may be a response to the lack of effect of B on productivity. The B deficiency can cause a reduction in the pectin fraction of the cell wall, inhibiting the formation of pectates due to Ca reduction [39].
The application of B also contributed to increasing the N and P in leaves, possibly due to the plant’s best nutrition and development. Power and Woods [40] showed the importance of B in the maintenance of plasma membranes, being fundamental for the P transport, which may justify the significant increase in this nutrient due to B content in the plant. El-Kader and Mona [41], using borate fertilization in peanuts, showed a positive B effect on the N content, chlorophyll, and photosynthetic intensity of the leaves; with an increase in the protein content of the plant. B applications stimulated the absorption of K, with a positive interaction between B and K in the leaves. However, with an increase in Bba inputs associated with Boct, there was a reduction followed by an increase in leaf K.
The B leaching in tropical soil was demonstrated in our study and also in Marangoni et al. [36], demonstrating B dynamics in tropical soil. In contrast, Azevedo et al. [42] demonstrated that the adsorption was highly correlated with organic matter, specific surface area, kaolinite, and exchangeable aluminum in lowland soils from the southern state of Minas Gerais, Brazil. In our study, Boct presented the lower B leaching (19% of B applied), justifying the soil application mainly in high rainfall conditions during the crop cycle. In Brazil, the peanut is planted during the sugarcane reform between October and February, when there is a high rainfall period. Therefore, the recommendation of 0.5 kg ha−1 of Boct in planting associated with 886 g ha−1 of Bba; or (ii) 1.0 kg ha−1 Boct in planting associated with 428 g ha−1 of Bba, demonstrated to be a successful scenario for increasing peanut yield and avoiding B losses in soil. In addition, there is a continuous B supply during the crop cycle allows the absorption of the nutrient by the peanut pods, preventing the symptoms of a “hollow heart”.

5. Conclusions

In study 1, monoethanolamine applied foliar and isolated promoted the production of 100-grains and pod yield, but there was no effect on yield, while in Study 2, the greatest B source associations were noticed with (i) 0.5 kg ha1 of sodium octaborate in planting associated with 886 g ha1 of boric acid; or (ii) 1.0 kg ha1 sodium octaborate in planting associated with 428 g ha1 of boric acid. Soil B promoted a reduction in rates of foliar B promoting a continuous B supply during the plant development. Soil B leaching was lower in sodium octaborate < monoethanolamine < boric acid and all sources increased leaf B indicating the B was absorbed by plants with a positive effect on the contents of Ca, K, N, and P in leaves. Based on results, foliar boron is commonly used for B supply, using different sources, with a positive effect on plant development at the right rate. The association between foliar and soil B applications was demonstrated to be a successful scenario for increasing peanut yield and avoiding B losses in soil.

Author Contributions

Conceptualization, R.A.B.B. and G.C.V.; methodology, R.A.B.B., R.O. and G.C.V.; formal analysis, R.A.B.B. and R.F.-A.; writing—review and editing, visualization, R.A.B.B., R.F.-A., R.O. and G.C.V. All authors have read and agreed to the published version of the manuscript.

Funding

This research received no external funding.

Acknowledgments

Thanks to the Coordenação de Aperfeiçoamento de Pessoal de Nível Superior (CAPES; grant number 88882.317567/2019-01) and the University of São Paulo “Luiz de Queiroz” College of Agriculture for technical and financial support.

Conflicts of Interest

The authors declare no conflict of interest.

References

  1. Hauser, A. Peanuts. J. Agric. Food Inf. 2018, 19, 195–202. [Google Scholar] [CrossRef]
  2. CONAB. Conab—Boletim da Safra de Grãos, 8o Levantamento—Safra 2019/20. Available online: https://www.conab.gov.br/info-agro/safras/graos/boletim-da-safra-de-graos (accessed on 24 June 2020).
  3. EMBRAPA. Study Maps Peanut Production Areas in Brazil to Prevent Peanut Smut. Available online: https://www.embrapa.br/en/busca-de-noticias/-/noticia/40697528/estudo-mapeia-areas-de-producao-de-amendoim-do-brasil-para-prevenir-doenca-do-carvao (accessed on 20 January 2021).
  4. Ferraz-Almeida, R.; da Mota, R.P. Routes of soil use and conversions with the main crops in Brazilian Cerrado: A scenario from 2000 to 2020. Land 2021, 10, 1135. [Google Scholar] [CrossRef]
  5. Salata, B.L.; Ferraz-Almeida, R. Perfil da produção agrícola na região de São Carlos, SP: Um balanço dos últimos 12 anos. Rev. Acta Ambient. Catarin. 2021, 18, 55. [Google Scholar]
  6. Zhang, X.; Chen, P.; Du, Q.; Zhou, Y.; Ren, J.; Jin, F.; Yang, W.; Yong, T. Effects of maize/soybean and maize/peanut intercropping systems on crops nitrogen uptake and nodulation nitrogen fixation. Chin. J. Eco-Agric. 2019, 27, 1183–1194. [Google Scholar] [CrossRef]
  7. Htoon, W.; Kaewpradit, W.; Vorasoot, N.; Toomsan, B.; Akkasaeng, C.; Puppala, N.; Wongkaew, S.; Jogloy, S. Relationships between Nutrient Uptake and Nitrogen Fixation with Aflatoxin Contamination in Peanut under Terminal Drought. Agronomy 2019, 9, 419. [Google Scholar] [CrossRef] [Green Version]
  8. Salome, J.R.E.; Sakai, R.H.E.; Ambrosano, E. Viabilidade econômica da rotação de adubos verdes com cana-de-açúcar. Rev. Bras. Agroecol. 2007, 2, 116–119. [Google Scholar]
  9. Ambrosano, E.J.; Trivelin, P.C.O.; Cantarella, H.; Ambrosano, G.M.B.; Schammass, E.A.; Guirado, N.; Rossi, F.; Mendes, P.C.D.; Muraoka, T. Sugarcane yield on consecutive cuts after pre-cultivation of green manure species. Rev. Agric. 2015, 89, 235. [Google Scholar]
  10. Begum, R.A.; Fry, S.C. Boron bridging of rhamnogalacturonan-II in Rosa and arabidopsis cell cultures occurs mainly in the endo-membrane system and continues at a reduced rate after secretion. Ann. Bot. 2022, 130, 703–715. [Google Scholar] [CrossRef]
  11. Archana, V.; Pandey, N. Reproductive development and pollen-stigma interaction in sunflower plants receiving boron deficient and toxic supply. J. Plant Nutr. 2021, 44, 2157–2166. [Google Scholar] [CrossRef]
  12. Galeriani, T.M.; Neves, G.O.; Santos Ferreira, J.H.; Oliveira, R.N.; Oliveira, S.L.; Calonego, J.C.; Crusciol, C.A.C. Calcium and Boron Fertilization Improves Soybean Photosynthetic Efficiency and Grain Yield. Plants 2022, 11, 2937. [Google Scholar] [CrossRef]
  13. Sarker, M.M.H.; Kashem, M.A.; Ali, S. Role of Vermicomposts Quality on Zinc and Boron Nutrition and Growth of Cauliflower. Agric. Res. 2021, 10, 205–214. [Google Scholar] [CrossRef]
  14. Moghadam, N.K.L.; Behnam, A.E.; Ghorbanpour, M. Boron Tolerance in Plants. In Metalloids in Plants: Advances and Future Prospects; Wiley: Hoboken, NJ, USA, 2020; pp. 301–314. [Google Scholar]
  15. Crusciol, C.A.C. Adubação de Cultivares de Amendoim do Tipo Rasteiro; Jaboticabal: São Paulo, Brazil, 2017; pp. 1–5. [Google Scholar]
  16. Rahman, N.E.; Suntoro, S.E.; Sakya, A.T. Peanut Growth and Gynophore Formation on Boron and Phosphor Applications. J. Soil Sci. Agroclimatol. 2019, 16, 57–66. [Google Scholar]
  17. Mantovani, J.P.M.; Calonego, J.C.; Foloni, J.S.S. Adubação foliar de boro em diferentes estádios fenológicos da cultura do amendoim. Rev. Ceres 2013, 60, 270–278. [Google Scholar] [CrossRef] [Green Version]
  18. Kabir, R.; Yeasmin, S.; Islam, A.K.M.M.; Sarkar, M.R. Effect of Phosphorus, Calcium and Boron on the Growth and Yield of Groundnut (Arachis hypogea L.). Int. J. Bio-Sci. Bio-Technol. 2013, 5, 51–60. [Google Scholar]
  19. Vishwakarma, A.K.; Singh, B.; Pathak, K.A.; Ramesh, S.; Singh, A.L. Effect of different sources of boron application on productivity of groundnut in Mizoram. Int. J. Trop. Agric. 2008, 26, 157–159. [Google Scholar]
  20. Han, C.; Li, W.; Wang, J.; Huang, Z. Boron leaching: Creating vacancy-rich Ni for enhanced hydrogen evolution. Nano Res. 2022, 15, 1868–1873. [Google Scholar] [CrossRef]
  21. Camargo, O.D.; Moniz, A.C.; Jorge, J.A.; Valadares, J.M.A.S. Métodos de Análise Química, Mineralógica e Física de Solo, 1st ed.; Instituto Agronômico de Campinas: Campinas, Brazil, 2009. [Google Scholar]
  22. Van Raij, B. Análise Química para Avaliação da Fertilidade de Solos Tropicais; Instituto Agronômico de Campinas: Campinas, Brazil, 2001. [Google Scholar]
  23. EMBRAPA. Sistema Brasileiro de Classificação de Solos, 5th ed.; Embrapa: Rio de Janeiro, Brazil, 2018. [Google Scholar]
  24. Soil Survey Staf. Soil Taxonomy. Keys to Soil Taxonomy; United States Department of Agriculture Natural Resources Conservation Service: Washington, DC, USA, 2022.
  25. Malavolta, E.E.; Vitti, G.C.; de Oliveira, G.C.V.E.S. Avaliação do Estado Nutricional das Plantas: Princípios e Aplicações, 2nd ed.; Potafos: Piracicaba, Brazil, 1997. [Google Scholar]
  26. Kappes, C.E.G.; Carvalho, A.L.E.; Camillo, M.A. Doses and periods of boron foliar applications on agronomic characteristics and quality of soybean seeds. Sci. Agrar. 2008, 9, 291–297. [Google Scholar]
  27. Bergmann, H.; Eckert, H.; Meisgeier, G. Effect of monoethanolamine on yield and water use efficiency of spring barley. Z. Pflanz. Bodenkd. 1990, 153, 21–24. [Google Scholar] [CrossRef]
  28. Varanda, M.A.F.; Capone, A.; Menegon, M.Z.; Almeida, M.P.; Barros, H.B. Produtividade de soja submetida a diferentes fontes de boro via foliar em várzea irrigada no estado do Tocantins. Nucleus 2018, 15, 117–128. [Google Scholar] [CrossRef] [Green Version]
  29. Chitdeshwari, T.E.; Poongothai, S. Yield Of Groundnut And Its Nutrient Uptake As Influenced By Zinc, Boron And Sulphur. Agric. Sci. Dig. 2003, 23, 263–266. [Google Scholar]
  30. Li, M.; Zhao, Z.; Zhang, Z.; Zhang, W.; Zhou, J.; Xu, F.; Liu, X. Effect of boron deficiency on anatomical structure and chemical composition of petioles and photosynthesis of leaves in cotton (Gossypium hirsutum L.). Sci. Rep. 2017, 7, 4420. [Google Scholar] [CrossRef] [PubMed] [Green Version]
  31. Instituto Agronômico (IAC). Culturas Econômicas. Amendoim Arachis hypogaea; Instituto ed. Campinas: São Paulo, Brazil, 2014; pp. 22–27. [Google Scholar]
  32. Pierre, A.K.; Mulvaney, M.; Rowland, D.; Tillman, B.; Grey, T.; Iboyi, J.; Leon, R.; Perondi, D.; Wood, C. Foliar Fertilization as a Strategy to Increase the Proportion of Mature Pods in Peanut (Arachis hypogaea L.). Peanut Sci. 2019, 46, 140–147. [Google Scholar] [CrossRef]
  33. Peerzada, A.M.E.; Ali, H.H.E.; Chauhan, B.S. Weed management in sorghum [Sorghum bicolor (L.) Moench] using crop competition: A review. Crop Prot. 2017, 95, 74–80. [Google Scholar] [CrossRef]
  34. Herrera-Rodríguez, M.B.; González-Fontes, A.; Rexach, J.; Camacho-Cristobal, J.J. Role of Boron in Vascular Plants and Response Mechanisms to Boron Stresses, 1st ed.; Global Science Books: Carrollton, GA, USA, 2010. [Google Scholar]
  35. Singh, A.E.; Lal, A.E.; Misra, R.S. Boron Fertilization is a Must to Enhance Peanut Production in India. Available online: https://escholarship.org/uc/item/9z63872f (accessed on 19 January 2021).
  36. Marangoni, F.F.; Otto, R.; de Almeida, R.F.; Casarin, V.; Vitti, G.C.; Tiritan, C.S. Soluble Sources of Zinc and Boron on Sugarcane Yield in Southeast Brazil. Sugar Tech 2019, 21, 917–924. [Google Scholar] [CrossRef]
  37. Yin, A.; Huang, B.; Xie, J.; Huang, Y.; Shen, C.; Xin, J. Boron decreases cadmium influx into root cells of Capsicum annuum by altering cell wall components and plasmalemma permeability. Environ. Sci. Pollut. Res. 2021, 28, 52587–52597. [Google Scholar] [CrossRef] [PubMed]
  38. Davis, J.M.; Sanders, D.C.; Nelson, P.V.; Lengnick, L.; Sperry, W.J. Boron improves growth, yield, quality, and nutrient content of tomato. J. Am. Soc. Hortic. Sci. 2003, 128, 441–446. [Google Scholar] [CrossRef]
  39. Bethke, G.; Thao, A.; Xiong, G.; Li, B.; Soltis, N.E.; Hatsugai, N.; Hillmer, R.A.; Katagiri, F.; Kliebenstein, D.J.; Pauly, M.; et al. Pectin biosynthesis is critical for cell wall integrity and immunity in arabidopsis thaliana. Plant Cell 2016, 28, 537–556. [Google Scholar] [CrossRef] [Green Version]
  40. Power, P.P.E.; Woods, W.G. The chemistry of boron and its speciation in plants. Plant Soil 1997, 193, 1–14. [Google Scholar] [CrossRef]
  41. El-Kader, A.E.; Mona, G. Effect of Sulfur Application and Foliar Spraying with Zinc and Boron on Yield, Yield Components, and Seed Quality of Peanut (Arachis hypogaea L.). J. Agric. Biol. Sci. 2013, 9, 127–135. [Google Scholar]
  42. Azevedo, W.R.; Faquin, E.; Valdemar, E.; Fernandes, L.A. Boron adsorption in lowland soils from Southern of the State of Minas Gerais, Brazil. Pesqui. Agropecu. Bras. 2001, 36, 957–964. [Google Scholar] [CrossRef]
Figure 1. Precipitation and temperature (maximum and minimum) during October to February (2018/2019 harvest), in Ribeirão Bonito, São Paulo, Brazil. The experimental design was randomized complete blocks, with four replications.
Agriculture 13 00347 g001
Figure 2. Study 1 with foliar application of B (Bm, monoethanolamine) using six B rates (250, 500, 750, 1000, 1250, and 1500 g ha−1), and Study 2, with B application in soil using sodium octaborate (Boct) with two rates (Boct0.5: 0.5 kg ha−1; and Boct1.0: 1.0 kg ha−1), and the foliar B application using boric acid (Bba) with six rates (250, 500, 750, 1000, 1250, and 1500 g ha−1).
Agriculture 13 00347 g002
Figure 3. The 100-grains (g; (AD)), pod yield (g planta−1; (BE)), grain yield (kg ha−1; C), and 20-pods (g; (F)) in Study 1 with foliar application of B (Bm, monoethanolamine) using six B rates (250, 500, 750, 1000, 1250 and 1500 g ha−1), and in Study 2 with B application in soil using sodium octaborate (Boct) with two rates (Boct0.5: 0.5 kg ha−1; and Boct1.0: 1.0 kg ha−1), and the foliar B application using boric acid (Bba) with six rates (250, 500, 750, 1000, 1250, and 1500 g ha−1). L and Q: linear and quadratic models, respectively. Averages presented with error variation. Boct0.5 = sodium octaborate at 0.5 kg ha−1; Boct1.0 = sodium octaborate at 1.0 kg ha−1.
Agriculture 13 00347 g003
Figure 4. Leaf boron (mg kg−1; (A,B)) and leaf calcium (g kg−1; (C,D)) in Study 1 with foliar application of B (Bm, monoethanolamine) using six B rates (250, 500, 750, 1000, 1250 and 1500 g ha−1), and in Study 2 with B application in soil using sodium octaborate (Boct) with two rates (Boct0.5: 0.5 kg ha−1; and Boct1.0: 1.0 kg ha−1), and the foliar B application using boric acid (Bba) with six rates (250, 500, 750, 1000, 1250, and 1500 g ha−1). L and Q: linear and quadratic models, respectively. Averages presented with error variation. Boct0.5 = sodium octaborate at 0.5 kg ha−1; Boct1.0 = sodium octaborate at 1.0 kg ha−1.
Agriculture 13 00347 g004
Figure 5. Leaf nitrogen (mg kg−1), leaf phosphorus (g kg−1), and leaf potassium (g kg−1) in Study 1 with foliar application of B (Bm, monoethanolamine) using six B rates (250, 500, 750, 1000, 1250 and 1500 g ha−1), and in Study 2 with B application in soil using sodium octaborate (Boct) with two rates (Boct0.5: 0.5 kg ha−1; and Boct1.0: 1.0 kg ha−1), and the foliar B application using boric acid (Bba) with six rates (250, 500, 750, 1000, 1250, and 1500 g ha−1). L and Q: linear and quadratic models, respectively. Averages presented with error variation. Boct0.5 = sodium octaborate at 0.5 kg ha−1; Boct1.0 = sodium octaborate at 1.0 kg ha−1.
Agriculture 13 00347 g005
Figure 6. Maturation (%) and normal seedlings (%) in Study 2 with B application in soil using sodium octaborate (Boct) with two rates (Boct0.5: 0.5 kg ha−1; and Boct1.0: 1.0 kg ha−1), and the foliar B application using boric acid (Bba) with six rates (250, 500, 750, 1000, 1250, and 1500 g ha−1). L, Q, and N stand for, respectively, linear and quadratic models, and no significant response. Averages presented with error variation. Boct0.5 = sodium octaborate at 0.5 kg ha−1; Boct1.0 = sodium octaborate at 1.0 kg ha−1.
Agriculture 13 00347 g006
Figure 7. Leached B (% of applied) and total leached B (TLB; %) of sodium octaborate, monoethanolamine, and boric acid. Averages presented with error variation.
Agriculture 13 00347 g007
Table 1. Soil and physical characterization before installing the experiment at depths ranging from 0 to 0.50 m, and fertilizer characterization.
Soil LayerpHOMPKCaMg
(m)CaCl2mg dm−3mmolc dm−3
0.0–0.256.3 ± 0.914.0 ± 2.79.0 ± 4.01.5 ± 0.428.0 ± 11.019.0 ± 7.0
0.25–0.504.2 ± 0.68.0 ± 1.52.0 ± 0.90.7 ± 0.28.0 ± 3.16.0 ± 2.2
BCuFeMnZnAl
mg dm−3mmolc dm−3
0.0–0.25<0.11.2 ± 0.127 ± 0.73.7 ± 0.10.4 ± 0.10.0 ± 0.0
0.25–0.50<0.10.9 ± 0.125 ± 0.74.1 ± 0.10.2 ± 0.03.0 ± 0.1
Fertilizers FormBDensitySolubilitypH
%g cm 3g 100 mL−1-
Boric acid, H3BO3Dust17 (w/w)1.4 ± 0.12.55.1 ± 0.4
Sodium octaborate, Na2B8O14 H2ODust21(w/w)1.1 ± 0.05.37.5 ± 0.6
Monoethanolamine, C2H10BNO4CS150 (w/v)1.3 ± 0.1-8.2 ± 0.6
pH: hydrogen potential; organic matter (colorimetric method); contents of phosphorus (P, extraction in Mehlich 1); potassium (K, extraction in HCL 0.05 mol L−1 + H2SO4 0.0125 mol L−1); calcium; magnesium; aluminum (Ca, Mg, Al, extraction in KCl 1 mol L−1); boron (B, BaCl2.2H20 0.0125%; hot water), copper, iron, manganese, and zinc (Cu, Fe, Mn, and Fe, extraction in DTPA 0.005 mol L−1 + TEA 0.1 mol L−1 + CaCl2 0.01 mol L−1 at pH 7.3). CS: concentrated solution. w/w: weight/weight; w/v: weight/volume. Averages presented with error variation of a population.
Table 2. Peanut yield of grains (kg ha−1), 100-grains (g), pods (g planta−1), 20-pods (g) in Study 1 with foliar application of B (Bm, monoethanolamine) using six B rates (250, 500, 750, 1000, 1250 and 1500 g ha−1), and in Study 2 with B application in soil using sodium octaborate (Boct) with two rates (Boct0.5: 0.5 kg ha−1; and Boct1.0: 1.0 kg ha−1), and the foliar B application using boric acid (Bba) with six rates (250, 500, 750, 1000, 1250, and 1500 g ha−1).
B Rates Study 1, FoliarStudy 2, Foliar + Soil
(g ha−1)BmBbaBba + Boct 0.5Bba + Boct 1.0
Grain yield (kg ha−1)
06824.2 ± 390.46727.7 ± 13.9 C6943.7 ± 5.8 B7623.2 ± 52.2 A
2506677.7 ± 173.36636.2 ± 26.4 C7284.2 ± 5.6 B7531.0 ± 18.5 A
5006834.2 ± 223.96790.0 ± 3.5 C7346.0 ± 5.3 B7507.0 ± 36.8 A
7507178.5 ± 444.06944.2 ± 4.4 C7253.0 ± 26.4 B7593.0 ± 6.5 A
10007200.0 ± 161.37098.7 ± 3.1 C7562.0 ± 2.9 B7716.0 ± 3.9 A
12506941.0 ± 366.27159.7 ± 4.5 B7252.2 ± 7.9 A7099.0 ± 7.2 C
15006518.5 ± 297.07036.7 ± 8.0 B7129.7 ± 4.4 A6789.7 ± 4.3 C
100-grains (g)
057.6 ± 2.165.6 ± 0.1 B73.4 ± 0.1 A73.8 ± 0.1 A
25065.2 ± 0.870.6 ± 0.1 C75.1 ± 0.1 B79.1 ± 0.1 A
50062.2 ± 0.570.4 ± 0.1 B75.4 ± 0.1 A75.5 ± 0.1 A
75072.7 ± 0.472.7 ± 0.5 C75.3 ± 0.1 B76.4 ± 0.1 A
100058.5 ± 1.270.3 ± 0.1 B77.5 ± 0.1 A77.3 ± 0.0 A
125069.6 ± 1.171.1 ± 0.1 B72.2 ± 0.1 A69.7 ± 0.1 C
150069.9 ± 1.375.2 ± 0.1 A66.0 ± 0.4 C67.0 ± 0.2 B
Pod yield (g plant−1)
020.9 ± 0.7123.3 ± 3.1 B169.0 ± 2.3 A172.0 ± 3.7 A
25022.3 ± 1.8136.7 ± 4.4 B177.2 ± 5.7 A182.7 ± 4.6 A
50030.4 ± 4.6156.6 ± 6.6 C174.5 ± 4.5 B198.0 ± 6.2 A
75025.8 ± 2.2158.2 ± 8.6 C180.0 ± 3.9 B203.5 ± 5.7 A
100025.2 ± 0.7165.2 ± 5.3 B205.0 ± 3.9 A206.0 ± 5.0 A
125029.3 ± 2.9163.2 ± 6.0 A160.0 ± 8.1 A173.7 ± 7.0 A
150020.1 ± 1.1140.7 ± 9.0 A146.2 ± A8.8149.0 ± 4.7 A
20-pods (g)
029.2 ± 0.829.3 ± 0.1 A28.6 ± 0.1 B29.5 ± 0.1 A
25024.3 ± 0.930.9 ± 0.1 B30.6 ± 0.0 B36.6 ± 0.2 A
50031.2 ± 0.830.5 ± 0.1 C31.4 ± 0.1 B36.9 ± 0.0 A
75031.5 ± 1.529.1 ± 0.1 C31.8 ± 0.0 B39.6 ± 0.0 A
100026.7 ± 1.629.1 ± 0.1 C31.8 ± 0.0 B39.6 ± 0.1 A
125026.4 ± 0.030.2 ± 0.1 C31.0 ± 0.4 B34.2 ± 0.1 A
150029.3 ± 1.527.8 ± 0.1 C29.0 ± 0.2 A29.4 ± 0.0 A
ANOVA 1Grains100-grainsPods20-pods
pBm0.58<0.01<0.050.50
p Boct andp Bab andp Boct ∗ Bab<0.01<0.01<0.01<0.01
1 Values were compared by the LSD test (B sources) and the Regression test (B rates) at a confidence level of 0.01. The interaction was tested using monoethanolamine (foliar) and sodium octaborate (soil). Averages of B sources with significant results were represented by different uppercase letters (A, B and C). Averages presented with error variation.
Table 3. Leaf boron (mg kg−1) and calcium (g kg−1) in Study 1 with foliar application of B (Bm, monoethanolamine) using six B rates (250, 500, 750, 1000, 1250 and 1500 g ha−1), and in Study 2 with B application in soil using sodium octaborate (Boct) with two rates (Boct0.5: 0.5 kg ha−1; and Boct1.0: 1.0 kg ha−1), and the foliar B application using boric acid (Bba) with six rates (250, 500, 750, 1000, 1250, and 1500 g ha−1).
B RatesStudy 1, FoliarStudy 2, Foliar + Soil
(g ha−1)BmBbaBba + Boct 0.5 1Bba + Boct 1.0 1
Leaf B (mg kg−1)
029.3 ± 2.134.9 ± 0.0 B34.9 ± 0.0 B47.8 ± 0.1 A
25055.4 ± 2.059.4 ± 0.1 C67.2 ± 0.1 B71.3 ± 0.1 A
50077.7 ± 3.874.3 ± 0.2 C85.2 ± 0.2 A81.7 ± 0.0 B
75097.8 ± 3.9113.8 ± 0.0 C133.0 ± 0.1 A122.4 ± 0.0 B
1000121.4 ± 5.4140.1 ± 0.1 C141.6 ± 0.0 B150.2 ± 0.1 A
1250132.3 ± 7.1157.3 ± 0.2 B140.1 ± 0.1 C178.6 ± 0.2 A
1500159.0 ± 4.9161.1 ± 0.0 B150.7 ± 0.1 B177.0 ± 0.0 A
Leaf Ca (g kg−1)
019.4 ± 1.021.2 ± 0.0 A19.1 ± 0.0 C19.7 ± 0.1 B
25018.8 ± 0.819.6 ± 0.0 B21.8 ± 0.0 A19.4 ± 0.0 C
50019.8 ± 0.519.5 ± 0.0 B21.5 ± 0.0 A18.7 ± 0.0 C
75020.5 ± 0.920.2 ± 0.0 C23.1 ± 0.0 A21.5 ± 0.0 B
100019.1 ± 1.219.3 ± 0.0 C20.8 ± 0.1 A20.4 ± 0.0 B
125019.4 ± 1.419.8 ± 0.0 B18.2 ± 0.0 C21.4 ± 0.0 A
150019.3 ± 0.921.4 ± 0.0 A17.2 ± 0.0 C19.2 ± 0.0 B
ANOVA 2
Leaf B Leaf Ca
pBm<0.0010.94
p Boct<0.001<0.001
p Bba<0.001<0.001
p Boct ∗ Bba<0.001<0.001
1 Boct0.5 = sodium octaborate at 0.5 kg ha−1; Boct1.0 = sodium octaborate at 1.0 kg ha−1. 2 Values were compared by the LSD test (B sources) and the Regression test (B rates) at a confidence level of 0.01. The interaction was tested by the application of monoethanolamine (foliar) and sodium octaborate (soil). Averages of B sources with significant results were represented by different uppercase letters (A, B and C). Averages presented with error variation.
Table 4. Contents of leaf nitrogen, phosphorus, and potassium (g kg−1) in Study 1 with foliar application of B (Bm, monoethanolamine) using six B rates (250, 500, 750, 1000, 1250 and 1500 g ha−1), and in Study 2 with B application in soil using sodium octaborate (Boct) with two rates (Boct0.5: 0.5 kg ha−1; and Boct1.0: 1.0 kg ha−1), and the foliar B application using boric acid (Bba) with six rates (250, 500, 750, 1000, 1250, and 1500 g ha−1).
B RatesStudy 1, FoliarStudy 2, Foliar + Soil
(g ha−1)BmBbaBba + Boct 0.5 1Bba + Boct 1.0 1
Leaf N (g kg−1)
041.5 ± 1.441.7 ± 0.1 B42.7 ± 0.1 A40.2 ± 0.1 C
25039.5 ± 0.640.3 ± 0.2 C41.9 ± 0.1 A41.3 ± 0.1 B
50039.9 ± 0.640.2 ± 0.1 C43.8 ± 0.2 A42.7 ± 0.2 B
75041.4 ± 0.538.6 ± 0.2 B42.7 ± 0.1 A42.4 ± 0.1 A
100041.3 ± 1.041.3 ± 0.1 B39.4 ± 0.1 C44.1 ± 0.0 A
125040.8 ± 1.641.1 ± 0.0 B40.7 ± 0.1 C42.4 ± 0.1 A
150041.8 ± 0.740.0 ± 0.1 C44.9 ± 0.1 A42.9 ± 0.0 B
Leaf P (g kg−1)
01.9 ± 0.22.3 ± 0.0 A2.3 ± 0.1 A2.3 ± 0.0 A
2501.9 ± 0.12.4 ± 0.1 A2.3 ± 0.0 B2.4 ± 0.0 A
5001.8 ± 0.12.1 ± 0.0 B2.3 ± 0.0 A2.3 ± 0.0 A
7501.9 ± 0.12.5 ± 0.0 A2.2 ± 0.0 B2.2 ± 0.0 B
10002.1 ± 0.12.5 ± 0.0 A2.5 ± 0.0 A2.3 ± 0.0 B
12502.0 ±0.12.6 ± 0.0 A2.6 ± 0.0 A2.4 ± 0.0 B
15002.0 ± 0.12.6 ± 0.0 A2.2 ± 0.0 B2.2 ± 0.1 B
Leaf K (g kg−1)
015.2 ± 1.012.4 ± 0.0 A13.9 ± 0.0 B14.9 ± 0.0 A
25015.9 ± 0.813.6 ± 0.0 A10.1 ± 0.0 C12.4 ± 0.0 B
50013.4 ± 0.512.8 ± 0.0 A10.1 ± 0.0 C12.3 ± 0.0 B
75015.4 ± 0.913.4 ± 0.0 A8.5 ± 0.0 C11.3 ± 0.0 B
100015.6 ± 1.212.8 ± 0.0 B12.3 ± 0.0 C13.3 ± 0.0 A
125015.9 ± 1.414.6 ± 0.0 A12.6 ± 0.0 C12.9 ± 0.0 B
150015.3 ± 0.913.7 ± 0.0 A12.2 ± 0.0 C12.9 ± 0.0 B
ANOVA 2
Leaf NLeaf PLeaf K
pBm0.650.830.49
p Boct<0.001<0.001<0.001
p Bba<0.001<0.001<0.001
pBoct∗ Bba<0.001<0.001<0.001
1 Boct0.5 = sodium octaborate at 0.5 kg ha−1; Boct1.0 = sodium octaborate at 1.0 kg ha−1. 2 Values werecompared by the LSD test (B sources) and the Regression test (B rates) at a confidence level of 0.01. The interaction was tested by the application of monoethanolamine (foliar) and sodium octaborate (soil). Averages of B sources with significant results were represented by different uppercase letters (A, B and C). Averages presented with error variation.
Table 5. Maturation (%) and normal seedlings (%) in Study 2 with B application in soil using sodium octaborate (Boct) with two rates (Boct0.5: 0.5 kg ha−1; and Boct1.0: 1.0 kg ha−1), and the foliar B application using boric acid (Bba) with six rates (250, 500, 750, 1000, 1250, and 1500 g ha−1).
B Rates Study 2, Foliar + Soil
(g ha−1)BbaBba + Boct 0.5 1Bba + Boct 1.0 1
Maturation (%)
054.2 ± 0.2 C59.4 ± 0.1 B64.6 ± 0.0 A
25059.2 ± 0.1 C62.2 ± 0.1 B66.2 ± 0.1 A
50057.8 ± 0.0 C63.4 ± 0.1 B73.0 ± 0.1 A
75058.5 ± 0.1 C62.7 ± 0.1 B69.4 ± 0.1 A
100058.3 ± 0.1 C62.9 ± 0.1 B64.2 ± 0.1 A
125063.2 ± 0.1 A62.8 ± 0.1 A58.6 ± 0.1 B
150066.7 ± 1.0 A64.9 ± 0.1 B53.3 ± 0.2 C
Normal seedlings (%)
065.5 ± 6.7 B85.5 ± 4.8 A87.0 ± 1.9 A
25066.5 ± 1.9 B92.7 ± 2.9 A97.5 ± 1.3 A
50085.2 ± 2.6 A88.7 ± 1.7 A85.7 ± 4.2 A
75080.7 ± 3.1 B90.5 ± 2.5 A74.5 ± 4.3 B
100085.2 ± 3.9 B95.0 ± 2.1 A80.0 ± 2.2 B
125073.2 ± 5.4 B93.5 ± 1.3 A75.2 ± 4.6 B
150056.0 ± 4.2 C78.0 ± 2.4 B88.0 ± 0.8 A
ANOVA 2
MaturationNormal seedlings
p Boct<0.001<0.001
p Bba<0.001<0.001
pBoct∗ Bba<0.001<0.001
1 Boct0.5 = sodium octaborate at 0.5 kg ha−1; Boct1.0 = sodium octaborate at 1.0 kg ha−1. 2 Values were compared by the LSD test (B sources) and the Regression test (B rates) at a confidence level of 0.01. The interaction was tested by the application of monoethanolamine (foliar) and sodium octaborate (soil). Averages of B sources with significant results were represented by different uppercase letters (A, B and C). Averages presented with error variation.
Disclaimer/Publisher’s Note: The statements, opinions and data contained in all publications are solely those of the individual author(s) and contributor(s) and not of MDPI and/or the editor(s). MDPI and/or the editor(s) disclaim responsibility for any injury to people or property resulting from any ideas, methods, instructions or products referred to in the content.