Article

Investigating the Profitability of Government-Funded Small-Scale Broiler Projects in Northern KwaZulu-Natal, South Africa

by
Sifiso Themba Clement Mdletshe
1,* and
Ajuruchukwu Obi
2,*
1
Department of Agricultural Economics & Extension, University of Fort Hare, Alice 5700, South Africa
2
College of Agriculture and Environmental Sciences, University of South Africa, Pretoria 1710, South Africa
*
Authors to whom correspondence should be addressed.
Agriculture 2023, 13(12), 2269; https://doi.org/10.3390/agriculture13122269
Submission received: 16 August 2023 / Revised: 20 November 2023 / Accepted: 22 November 2023 / Published: 13 December 2023
(This article belongs to the Special Issue Sustainable Rural Development and Agri-Food Systems)

Abstract

:
The frequent failures of government-funded broiler enterprises raise concerns about the viability and wisdom of government funding for smallholders. This study therefore investigates the scope for the profitability of the small-scale broiler production and the range of socio-demographic and production issues that are implicated. The study area was the Northern KwaZulu-Natal (KZN) Province of South Africa, where smallholder broiler production is popular. A total of 75 randomly selected, small-scale broiler producers from three districts in Northern KZN, namely, King Cetshwayo, uMkhanyakude, and Zululand, participated in the survey out of the 134 small-scale broiler producers supported by the government. The analyses employed diverse descriptive analysis and included the calculation of the gross margin to proxy broiler chicken profitability. Three models were fitted for the empirical analysis, namely, the OLS, the Two-Stage Least Squares, and the Stochastic Frontier models, to determine the factors influencing profitability, correcting for endogeneity, and computing the technical efficiency and inefficiency of the small-scale broiler production system. The results show that the primary production and marketing challenges were the lack of infrastructure (abattoirs and refrigeration) and the lack of formal markets, including the lack of market information and high transport costs. On average, the sampled government-funded small-scale broiler enterprises achieved a positive gross profit margin of 31 percent, which is relatively low when compared to the small-scale farmers that work for a large-scale enterprise—the Commercial Chicken Farm, near Pietermaritzburg. It was revealed that the profits are significantly influenced by gender, farmgate price, access to market information, and access to extension services. The production system was also shown to be operating at a reasonably high technical efficiency, which is strongly influenced by flock size, feeds, and labour input, while age, gender, and educational level contributed to technical inefficiency. The recent crisis that was experienced by the poultry industry in South Africa linked to the outbreak of the Avian Flu and its devastating consequences point up the urgency for more investment in infrastructure to enhance bird safety at affordable costs. Although the government-funded small-scale broiler enterprises in Northern KZN were found to be viable, it is evident that they can be better, possibly through more capacity building and collective action to take full advantage of the economies of scale.

1. Introduction

The consumption of livestock-derived foods has undergone significant transformations globally. The global average meat consumption per capita is increasing at a faster rate than population growth [1]. Population growth, urbanization, and higher incomes have been known as the key drivers of this transformation, accounting for the increase in the demand for foods of animal origin [2] It is estimated that the global population currently stands at around 7.7 billion, and it is projected to reach about 10 billion in 2056 [3,4]. This situation implies that the overall food demand is on course to increase, with some projections hinting at the likelihood that the demand for animal-based foods will increase by nearly 70 percent by 2050 [1]. The correlation of the increase in the consumption of meat products with the growing human population will require efficient management and feeding conditions that best fit the needs of livestock [5]. At the same time, global poultry production is estimated to have expanded by over twenty times over the past 8-10 decades, although much of that have occurred outside Sub-Saharan Africa [4].
South Africa is transitioning towards becoming a developed economy, and a substantial proportion of its population is becoming wealthier in such a way that demand for livestock-derived foods is on the increase [6]. In the agricultural sector, livestock production is on the rise, with broiler production dominating as the main supplier of protein. In fact, the poultry industry is the largest single contributor to the agricultural sector in South Africa [7]. For instance, in 2021, 16.6% of total agricultural gross value and 39.9% of animal product gross value came from poultry production [8]. The broiler sub-sector accounted for about 93.6 per cent of the total poultry-meat production in South Africa in 2009/10, with the remainder being accounted for by mature chicken slaughter (culls) and small-scale and backyard poultry meat production, including specialized poultry meat products (geese, turkey, ducks, and guinea fowl) [8]. In 2020, the production volume of slaughtered chickens in South Africa amounted to nearly 968 million heads, from its level of 966.1 million heads only a year earlier [8]. The per capita broiler meat has also increased over the years. For instance, the per capita broiler meat consumption in South Africa has increased from 19.7 kg per annum in 2000 to 32.96 kg per person in 2010 [9].
The available data have shown that South Africa consumes more broiler meat than it produces [9]. The issue of poultry imports has been a very thorny issue for some time. In fact, poultry meat imports have been expanding quite significantly from the country’s traditional suppliers, like Brazil, the United States, Spain, Argentina, and Canada [9,10,11]. In March 2023, the quantity of poultry meat imported into South Africa rose to 46,000 tonnes per month, up from 17,000 tonnes per month a year earlier, possibly driven in part by the lifting of import tariffs implemented from August 2022 to July 2023 [9,10,11]. The tariffs were reintroduced at the end of July 2023 in response to concerns by poultry farmers regarding the negative effects of the imports on domestic prices of chicken, which was considerably detrimental to producers [11]. In 2021, chicken was the leading meat type imported in South Africa, with almost 346 thousand metric tons of chicken meat being imported. Meat meal and turkey followed, at 63.2 thousand and 25.28 thousand metric tons, respectively. Recently, in June 2023, 24.31 thousand metric tons of pig meat were imported into the country [10]. Brazil was the main country of origin for poultry in 2021, accounting for 66.6% or 287 880 tons of the total poultry imports into South Africa [10,11].
In 2023, the import bill became even larger as the country struggled to make up for the devastating production shortfalls arising from the Avian Flu (i.e., the Highly Pathogenic Avian Influenza, HPAI) infestation that occurred mostly in the second half of the year [8,10,11,12]. The South African Poultry Association (SAPA) estimates that about 7.5 million birds died as a result of the disease [11,12].
As part of the efforts to reduce the high import bill on meat importation, the government has been supporting local producers to invest in import-replacing livestock production. There is an argument that a country’s food import substitution policy could thrive by identifying and supporting enterprises that are capable of increasing food production volumes and attain world-class returns to scale, employing new production technologies that can be competitive on the world market [13]. The decision of the Government of KwaZulu Natal to support small-scale broiler production is undoubtedly anchored on the foregoing argument linked to poverty reduction and economic empowerment. Expectedly, there is considerable interest in the way this programme has performed. Over the past years, the feedback received on how the programme has performed has not been encouraging. Some accounts actually suggest that the bulk of these farmers have experienced massive losses and have wound up operations. In preliminary assessments conducted prior to this study, it was not possible to locate several farmers known within the communities as being scheme participants. This could suggest that the stories circulating regarding the failure of the government scheme need to be more closely interrogated.
In this paper, using provincially representative data, we evaluate government-funded small-scale broiler production to understand the technical production relationships that can explain the performance of the scheme. South Africa provides an excellent location for this study because of a high number of supported small-scale broiler farmers, sizeable poultry products imports, and high consumption of poultry products. In the period from October 2009 to December 2011, the KZN Province embarked on a purposeful strategy to accelerate the development and modernization of broiler production in the province by supporting small-scale broiler projects in Northern KZN [14]. International experience reveals that poultry production has commonly been chosen to address smallholder livelihood enhancement schemes where rising prices and limited access to credit facilities deepen poverty and constrain opportunities for productive investment in farming [15]. Poultry production guarantees reasonable returns to investment at considerably lower costs than other agricultural projects and is therefore the priority area for support to farmers in low-income areas and countries [15]. For this reason, the findings of this research are likely to be relevant for many government-assisted programmes around sub-Saharan Africa, where conditions are identical to those that prevail in South Africa’s rural areas. These projects have scored mixed results because of social problems, market availability, poor infrastructure, poor financial management, and poor resource management.
To date, the economic viability of government-funded small-scale broiler production enterprises has not been assessed systematically for the Province of Kwazulu-Natal or South Africa. Therefore, this study makes an important contribution to the literature. It is acknowledged that differences in the factors of production, which are largely influenced by both the production and marketing environment and socio-economic landscape play an important role in determining both productivity and profitability [8,16]. This study analyses the economic viability (profitability) of government-funded small-scale broiler projects in Northern KZN in a way that seeks to test the effectiveness of such financing as a tool for addressing poverty, food supply deficits, and import substitution. Thus, the results are expected to help farmers, the government, and other developmental agencies to select the most appropriate innovation for broiler production improvement. Such an insight can be crucial and helpful in the design of viable or sustainable small-scale broiler projects, and this could be very important to not only address or improve the small-scale rural livelihoods in the long run, but substitute large volumes of imports of poultry products into South Africa and other countries with a similar predicament.

2. Materials and Methods

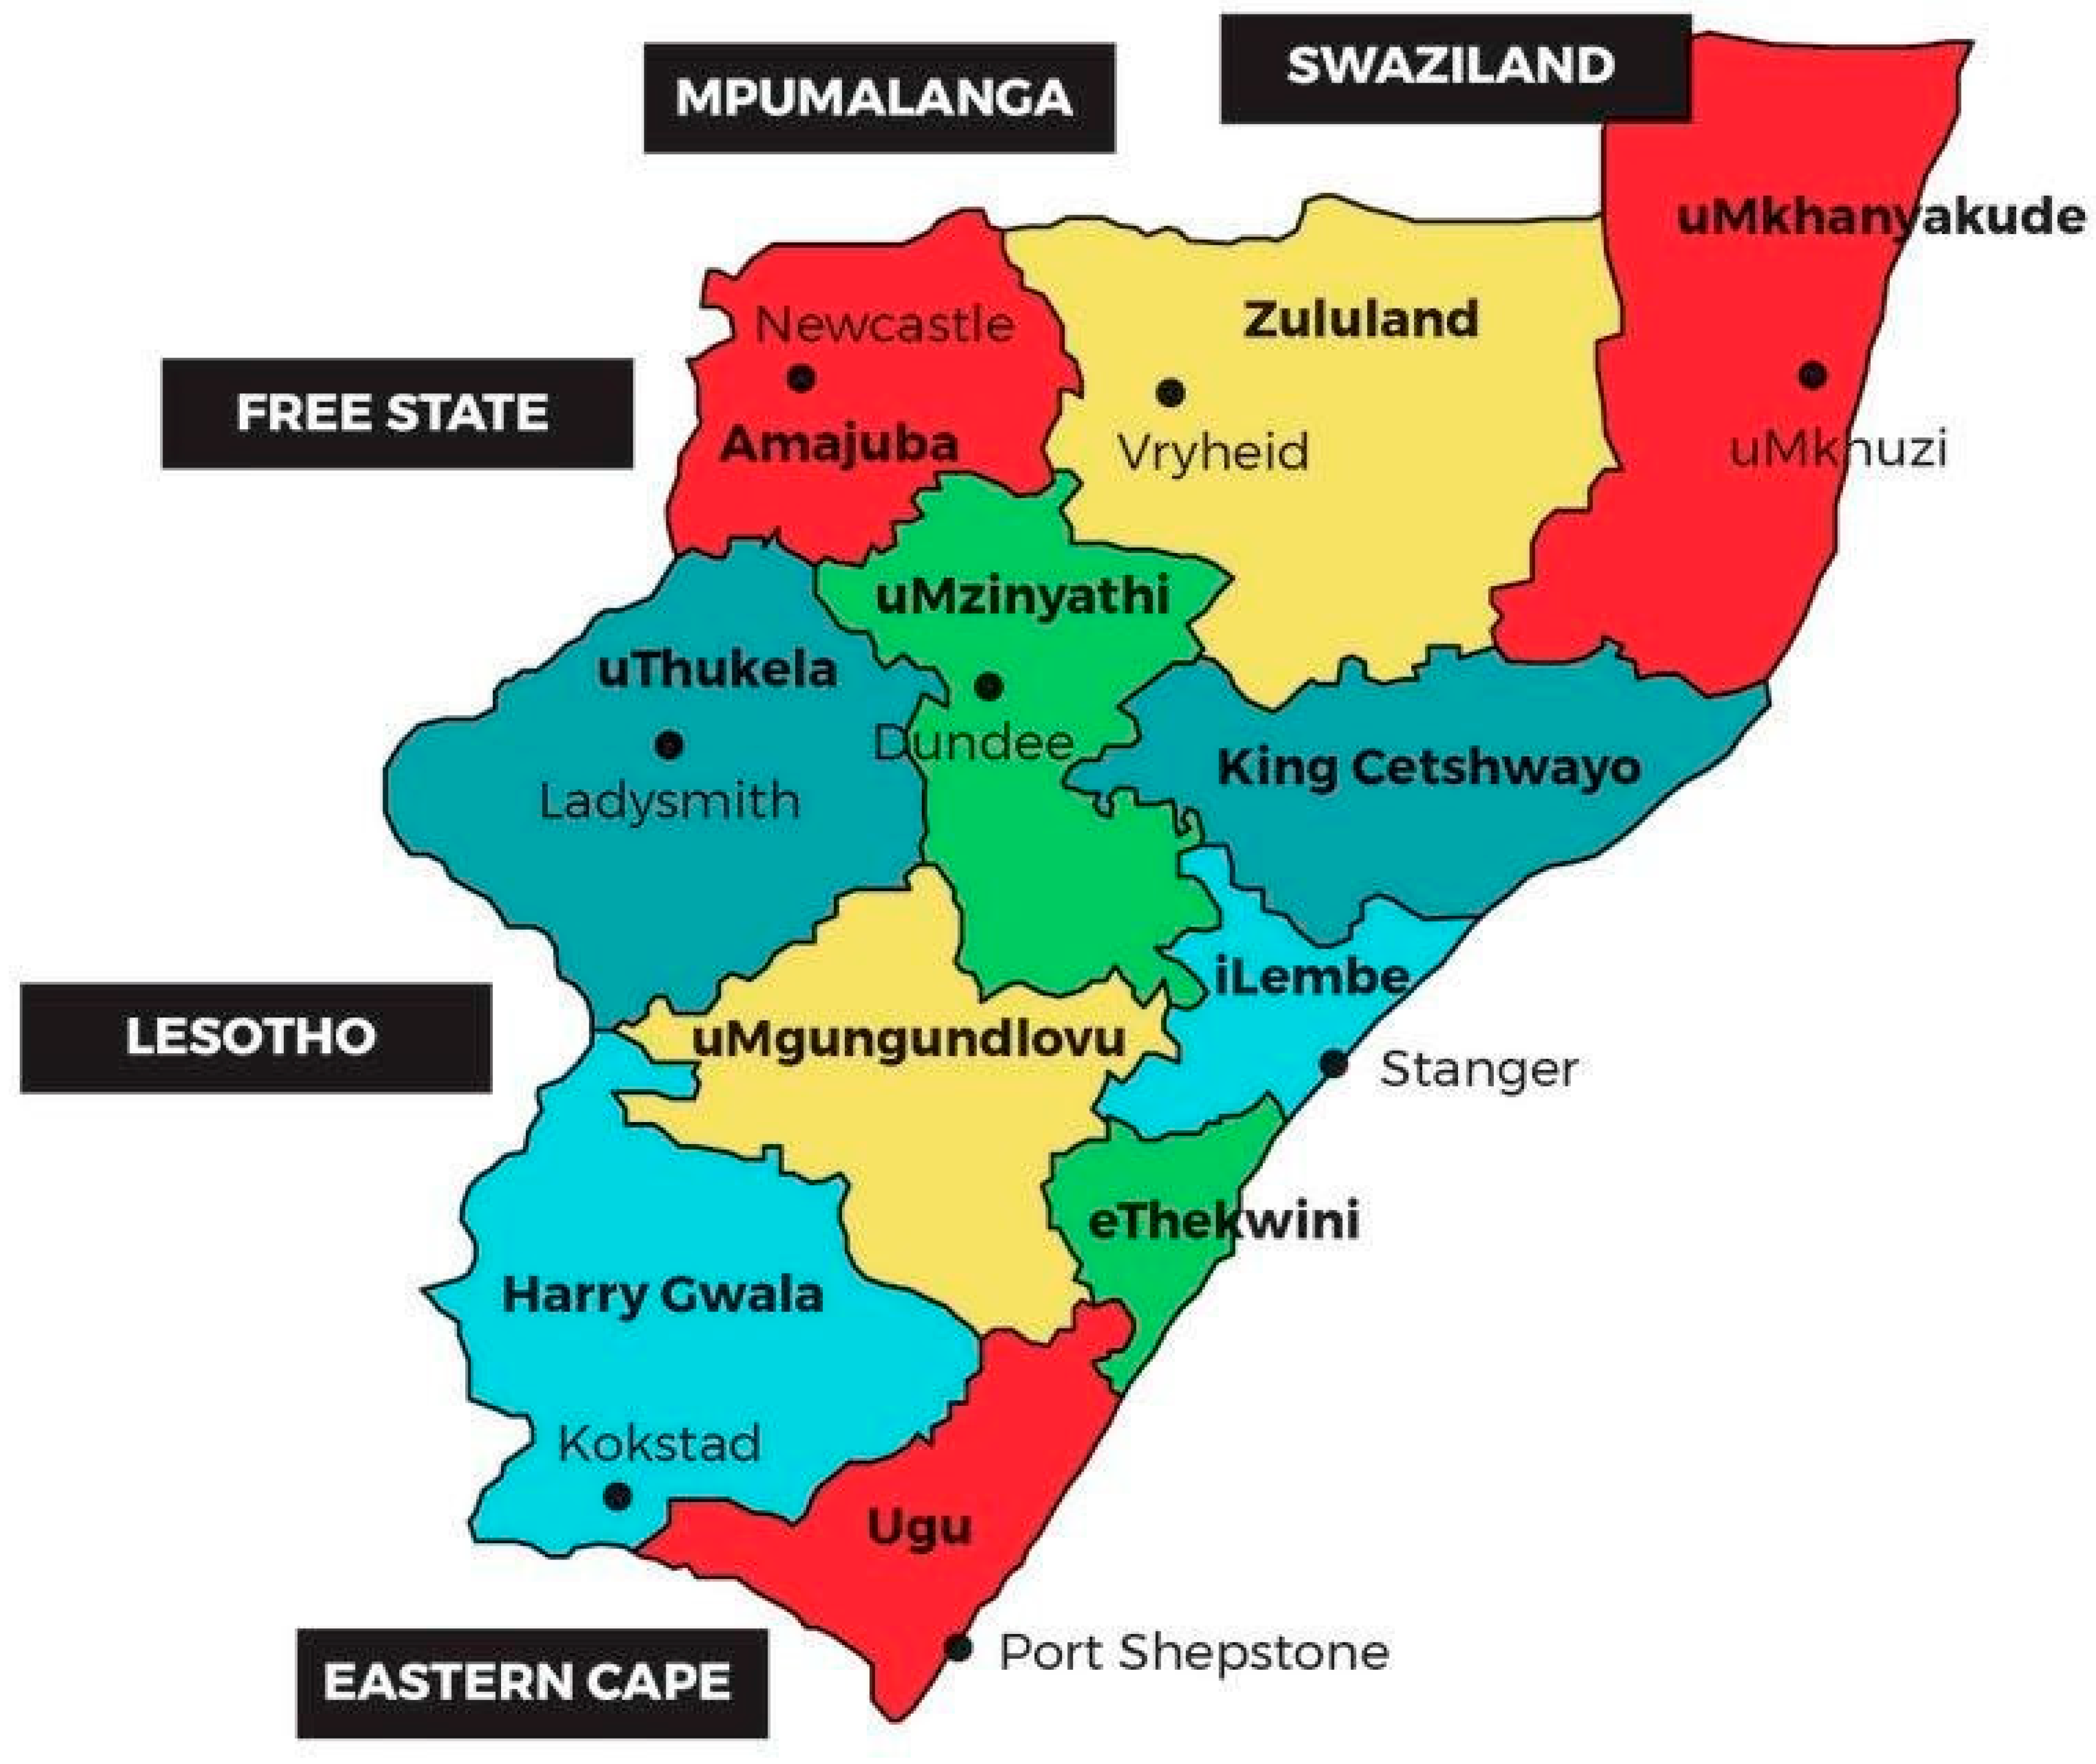
2.1. Selection of the Study Areas

Figure 1 provides a geophysical description of the study area within the broader context of the KZN Province and South Africa. The geophysical description of the study areas is provided with a focus on the selected districts, namely, King Cetshwayo (formerly, uThungulu), uMkhanyakude, and Zululand District Municipalities, in terms of their geophysical aspects. The choice of the northern region is because these districts were identified as the ones with a high incidence of poverty rate, especially the uMkhanyakude.

2.2. Sampling Method and Data Collection

The study employed a case study design and quantitative approach to understand the viability of government-funded broiler enterprises. The data for this study were collected from individual government-funded small-scale broiler producers that were financed during the 2012/13 financial year and resided in Northern KZN (King Cetshwayo, uMkhanyakude, and Zululand Districts). In total, there were about 134 small-scale broiler enterprises that were funded by the KZN Department of Agriculture in the 2012/13 financial year.
This government assistance for broiler production in the province was provided during the 2012/2013 financial year in the form of poultry-keeping equipment, day-old chicks, feeds, and medications. The total value of the assistance was estimated in 2012 as ZAR 250,000 to each family in the form of the aforementioned broiler production inputs. No cash was provided at any time. The equipment were poultry housing, feeders, drinkers, and lighting facilities for each beneficiary. Following that, each beneficiary received 100 units of day-old chicks, feeds to last the birds from the day of delivery to maturity, as well as all the medications required by the birds until maturity.
Due to time and financial constraints, a total of 75 small-scale government-funded broiler enterprises (25 in each district) were randomly selected for the study. The data were collected through a personally administered questionnaire in 2014/2015. The questionnaire was designed to obtain information on the demographics, production challenges, marketing channels, and the viability of the broiler enterprises. The choice of the data collected was based on previous research conducted across the country and region [18,19,20,21]. The University of Zululand Ethics Research Committee (UZREC) and University of Fort Hare Ethics Research Committee issued ethical clearance for this study. The variables are shown in Table 1.

2.3. Data Analysis

The resulting field data were captured and coded in Microsoft Excel from where they were exported to Statistical Package for Social Science (SPSS) version 29 (SPSS Inc. (IBM), Chicago, IL, USA) and STATA for analysis. Descriptive statistics, chiefly, frequencies and means, and inferential analysis, were implemented to describe the data. Gross margin (GM) and gross profit margin (GPM) analyses were conducted to assess the profitability of government-funded small-scale broiler enterprises in Northern KZN. To determine the factors influencing the profitability of government-funded small-scale broiler enterprises, the study fitted two econometric models, namely, an OLS (multiple regression) model and a Stochastic Frontier Model. This provided a basis for determining the factors that influence the profitability of government-funded small-scale broiler enterprises, proxied by the gross margin.

2.3.1. Gross Margin and Gross Profit Margin Analyses

The gross margin computation was aligned to Government of South Africa and South Australian guidelines generally followed by farmers and institutions in South Africa [2]. The standard definition of gross margin as the difference between gross product value and specific variable costs [22] was followed. The government-funded small-scale broiler producers keep broilers for seven weeks and the “rest period” for the house in two weeks. This results in 5.8 batches per annum. A four percent mortality rate was expected in small-scale broiler producers, and we used this mortality rate in the computation of the GM and GPM in this study [18,22]. Equation (1) shows a simple mathematical expression of GM for an enterprise:
GM = GI − TVC
where
GM = Gross margin measured in ZAR;
GI = Gross income measured in ZAR;
TVC = Total variable costs measured in ZAR.
The computation of the gross margin alone has the disadvantage of not showing the profit obtained by an enterprise. Therefore, we also computed the GPM. A gross profit margin is the GM expressed as a percentage or in total financial terms or the ratio of gross profit to costs. A higher margin percentage is a desirable profit indicator. Equation (2) is the expression of the GPM for an enterprise:
G r o s s   P r o f i t   M a r g i n   G P M = G r o s s   P r o f i t N e t   S a l e s   R e v e n u e   × 100 %
where
Gross Profit = Sales − Cost of Goods Sold;
Net sales (Revenue) = Gross Sales − Total Sales Discounts + Returns.
Benchmarking is a common practice and is used extensively in a range of industries to compare key performance parameters and financial results among competitors or best performing firms. In broiler production, benchmarking is critical in assessing performance and evaluating expenditure in significant cost areas, including feed, cost of chicks, vaccines, and transport. For this study, to achieve a meaningful assessment of the profitability of the government-funded small-scale broiler enterprises under study, we compared the GM analysis per hectare (ha) with that of small-scale farmers that work for a large-scale enterprise—the Commercial Chicken Farm near Pietermaritzburg. The Rainbow Chicken programme was an initiative to uplift small-scale farmers. The GM reports for the small-scale farmers that worked for the Commercial Chicken Farm were supplied by market economists for the Commercial Chicken Farm (using data of the 2014/15 financial year). The Commercial Chicken Farm is the largest chicken producer in South Africa. Several studies conducted in South Africa and the region have calculated the gross margin and the gross profit margin to proxy profit in the broiler and farm enterprise [18,19].

2.3.2. The Empirical Model

The study fitted a multiple regression model employing Ordinary Least Squares (OLS) procedures to determine the factors that influence the profitability of government-funded small-scale broiler enterprises in the study areas. The use of the OLS to estimate the determinants of profitability has been widely reported for the United States and Zambia [20,22]. In this study, we used the GM as the dependent variable (a proxy for profitability). The predictive association for profitability or the independent variables were the socio-economic characteristics of the small-scale broiler producers.
The first step is to state the general formula underlying the multiple linear regression model as follows:
Y = f ( X i , X n )
This suggests that the dependent variable Y is influenced by a set of variables X i ,   X n in line with a set of specific conditions. In line with the linear trend predicted by theory, the relationship is specified as:
Y   G M = β 0 + β 1 X 1 + β 2 X 2 + + β n X n + μ i
where
Y is the dependent variable measured by the GM;
β1, β2,..., βn are coefficients of independent (explanatory) variables;
X1, X2,..., Xn are the independent (explanatory) variables, and U i is the error term.
As it is well-known, the common problem of endogeneity associated with the OLS regression of the non-experimental data remains a threat to the reliability of the causal inferences based on them [23]. The concern is that predictions based on such estimates will be biased because the fundamental conditions for independence and unbiased linearity in the OLS are violated [24]. For this reason, explicit measures were taken to ascertain the integrity and reliability of the results, so that they provide a reasonable guide for causal inference. Because of the research topic as well as intuition, the variables of interest in the fitted an OLS model from the standpoint of profitability (the size of the gross margin) were education, farmgate prices, and extension as the explanatory variables [21]. What makes the education variable particularly fit for consideration as an endogenous regressor is that it was not expected to have direct effect on profitability, but could work through one of the explanatory variables, such as information and awareness potentially through extension and market information, to influence the response variable, namely the gross margin in this case. For the foregoing reasons, the education variable was instrumented to yield an instrument from within the explanatory variable set, namely, extension. This possible instrument can be seen to possess the characteristics of determing the endogenous regressor, education, but only able to affect the response variable through another exogenous variable such as prices [25]. The estimation strategy for dealing with presumed endogeneity is presented below.
Having established the viability of the instrument, the two-stage least-squares (2SLS) was fitted to allow for the Hausman test to be applied to fully ascertain the presence or absence of endogeneity. The two stages of the 2SLS modeling proceeded as follows:
Stage 1:
x i = I + Z v + δ i
where
x i is a vector of the endogenous predictor i (I = 1…N-predictors);
I is the design matrix for IVs (education);
is the vector of slope parameters for IVs;
Z is the design matrix for the covariates;
v is the vector of the slope parameters for the covariates;
δ i is the error term.
This model was run in STATA with the ivregress command. The model instruments and covariates must be exogenous.
The second stage was modeled as follows:
Stage 2:
y = β i X + Z β + ε
where
X-hat is the vector of predicted values of X based on the first stage estimation;
β I = the parameter reflecting the causal effects from X to Y;
Z is the design matrix for the covariates used in Stage 1;
β is the vector of the slope parameters for the covariates from Z;
ε is the error term.
Stage 2 is simply a repetition of the OLS, where the potential endogenous predictor was replaced by the predictors estimated as x-hat in Stage 1.
The endogeneity test was performed at this stage. For endogeneity to be confirmed, the following conditions must be met:
Durbin (Score) chi2 (1), p < 0.05;
Wu–Hausman (Fstat), p < 0.05.
The foregoing test shows that endogeneity truly exists in the model based on the non-significance of the statistics, as follows:
Durbin (score) chi2(1) = 2.09637 (p = 0.1476);
Wu–Hausman F(1,64) = 1.84034 (p = 0.1797).
The results of the endogeneity test shown above means that the null hypothesis cannot be rejected, suggesting that the instruments are not weak. The minimum eigenvalue statistics of:
F(2,64) = 17.9018
satisfies the conditions for instrument strength of being higher than 10 based on the rule of thumb, exceeding the critical values for the test statistic at different levels of the maximal IV relative bias.
The next step was to test for overidentification, which indicates the validity of the chosen instrument. In spite of the unresolved debate about its relevance, the overidentifying restrictions test is still used for testing instrument validity [26]. The test of overidentifying restrictions generates the Sargan and Basmann statistics. The Sargan statistic (chi-squared = 0.231241 with a p-value of 0.6306) and the Basmann statistic (chi-squared = 0.197936 with a p-value of 0.6564) are used to test the overall validity of the instruments. The high p-value (greater than the significance level of 0.05) suggests that we cannot reject the null hypothesis of the instruments being valid and lead to the conclusion that the instrument is valid.
The Cobb–Douglas model was fitted to determine the factors that influence the technical efficiency and profitability of government-funded small-scale broiler enterprises in the study areas. In this model, capital represents various forms of non-labour inputs, including the variable costs entailed in the flock size, medication/vaccination, housing, lighting, and heating costs. While there are many other factors affecting economic performance and technical efficiency, the flexibility of the Cobb–Douglas model makes it a very convenient tool for modelling technical efficiency. It is generally the case that policymakers rely on the results of the resource use efficiency of farmers as a platform to suggest the best enterprises to capitalize for a more efficient, profitable, and sustainable farming business. The formal model can be generalized as:
Y = f X i ,   β + ε
where
Y is the output that is expressed as the revenue or gross income from the production activity;
X is a vector of the variables employed in the production process, representing the capital and labour inputs and all the variable factors involved in the production process, with capital and labour being interchangeable without any effect on output;
β is the coefficient of the explanatory variables included in the model;
ε is the error term.
The foregoing expression can be linearized and defined in logarithmic terms to yield the following:
ln Y i t = β 0 + β i ln L i t + β 2 l n K i t + ( V i t U i t )
where ln is natural logarithm;
Yi is output of the ith broiler farmer;
β0 is the constant;
βi is the regression coefficient or parameter to be estimated;
Lij is the jth labour input employed by the ith broiler farmer;
Kit is the non-labour input (including capital) employed by the broiler farmer.
The Stochastic Frontier Model assumes a composite error term made up of two components. One is a random (stochastic) component V, which are errors beyond the control of the broiler farmers and are assumed to be symmetric, identically and independently distributed (iid) with a zero mean and constant variance (0, σ ) , and depicts the random variation of the production function from one farm to the other. It is also assumed to arise from the measurement errors (which of course is outside of the control of the farmer). The second error component, U, is the non-negative technical inefficiency term that is assumed to have a truncated normal distribution, which is expressed as:
U i i d N μ i   σ i i 2
Based on the foregoing, the technical inefficiency can be expressed as:
U i = Z i i δ + W i 1
In this instance, Zi is a vector of the explanatory variables that captures the technical inefficiency effect that will normally comprise the socioeconomic characteristics of the farmers and some farm management factors that are at the instance of the farmer, such as access to extension services and access to electricity. Furthermore, δ is a vector of unknown parameters to be estimated and Wi represents the unobserved random variables, which are assumed to be independently and normally distributed with a zero mean and constant variance.
In line with the standard procedures [27]-modified estimations that combine the Stochastic Frontier Model with inefficiency effects in a one-step process, the log-transformed linearized model can be stated as:
ln Y = β 0 + β 1 ln X i 1 + β 2 ln X i 2 β n ln X i n + ε i
where ln is the notation that depicts the natural logarithm as defined earlier; Y is the output of the ith farm; β 0 represents a constant term; β 1 β n represent the vectors of the production function, which are the unknown parameters to be estimated; X i 1 X i n are the independent variables or the input bundles that participate in the production of the broiler chickens comprising the capital items, the cost of day-old chickens, medication, feed, sanitation, and housing, among others. The model is defined as follows:
X1 = Quantity/price of feed for each production period;
X2 = Flock size (total number of birds at sale);
X3 = Labour input in workdays;
X4 = Medication given to birds for immunization and therapy;
X5 = Variable housing costs, including lighting and heating.
When fitting the inefficiency model, the assumption is that variations in production efficiencies of each farming unit can explain the differences in performance from one farm to the other. These differences are captured by the inefficiency model, which is incorporated in the one-step estimation approach, whereas in the two-step approach, the inefficiencies are captured by a separate estimation using the OLS techniques to determine the factors that influence technical efficiency. Specifying the inefficiency model creates the following expression:
U i = δ 0 + δ 1 Z 1 i + δ 2 Z 2 i + δ 3 Z 3 i + δ 4 Z 4 i + δ 5 Z 5 i
where
Ui = The technical inefficiency of the ith broiler farmer;
δ 0 = Constant term;
δ 1 δ 5 = Coefficients;
Z 1 i = Age of the farmer in years;
Z 2 i = Educational level of the broiler farmer in years;
Z 3 i = Experience of the farmer (years spent in broiler farming);
Z 4 i = Veterinary service (dummy: 1 = Yes; 0 = No);
Z 5 i = Extension contact (dummy: 1 = Yes; 0 = No).

3. Results

3.1. Demographic Characteristics of the Respondents

The demographic characteristics presented in this paper include age distribution of the small-scale broiler producer, gender of the small-scale producer, and educational level of the small-scale broiler producer; this was followed by the farm characteristics (production and marketing information) describing their relationship with the viability of the small-scale broiler enterprises. Table 2 shows that the mean ages of the small-scale broiler producers in King Cetshwayo, uMkhanyakude, and Zululand Districts were 51, 49, and 61 years, respectively. In the King Cetshwayo District, females represented the majority (67%) of the sampled small-scale broiler producers, while the uMkhanyakude and Zululand Districts had more (80%) males each. The majority (Table 2) of the respondents had attained some formal (primary and secondary) education in all districts.

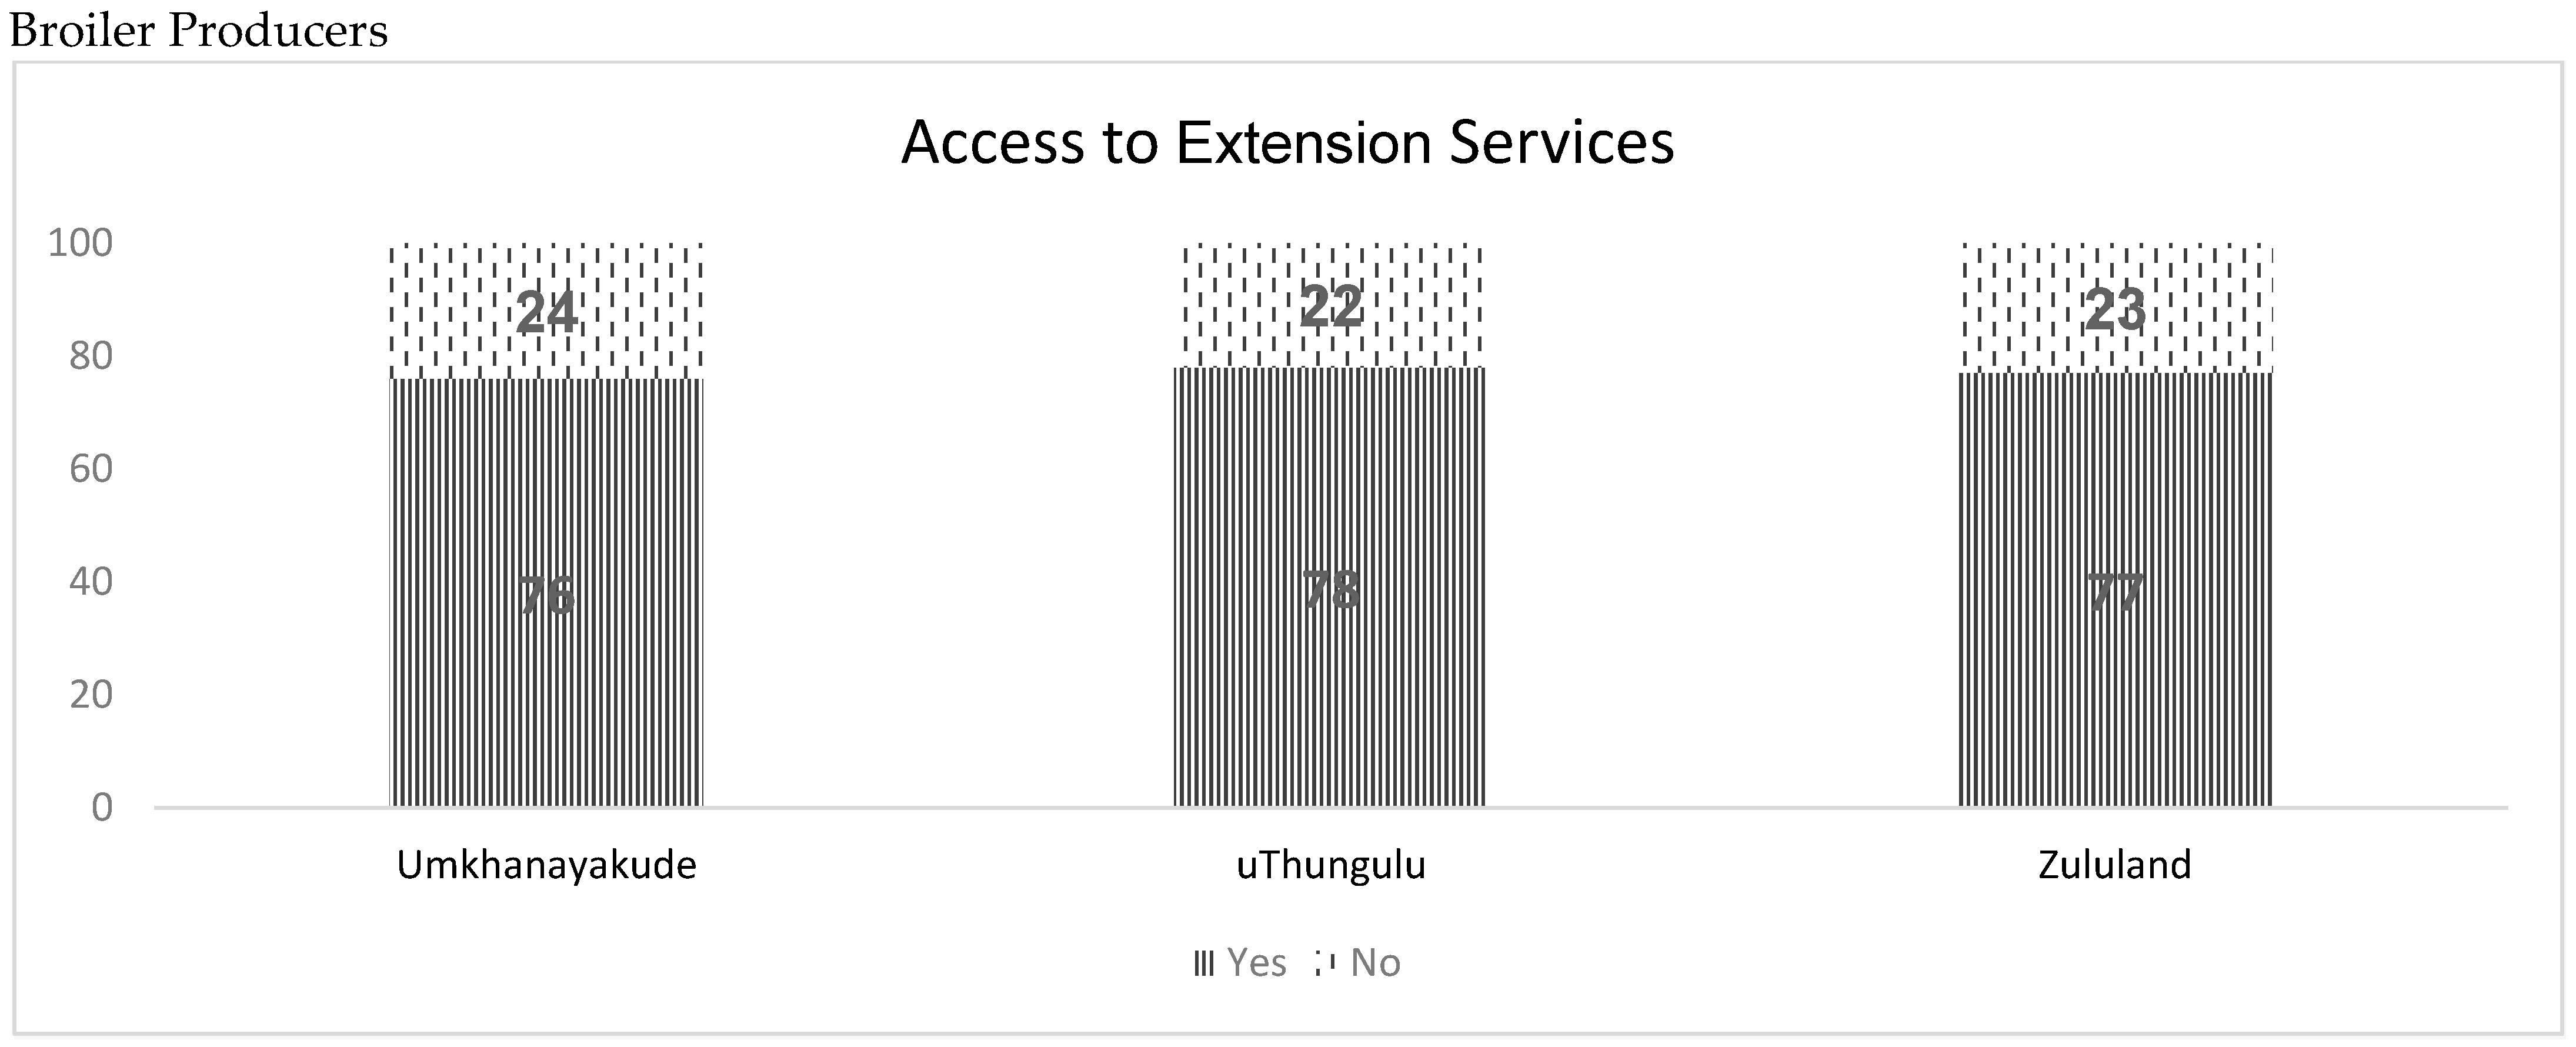
3.2. Knowledge on Broiler Production and Access to Extension Services in Northern KwaZulu-Natal

The majority (98%) of the sampled government-funded small-scale broiler producers in the study areas agreed that they received some training and acquired skills in broiler production. The majority (65%) of the sampled government-funded small-scale broiler producers indicated that they have knowledge of the common broiler diseases. The training and poultry production skills, affirmed by the respondents, can be attributed to the better access to extension services, which is visible in the study areas. Figure 2 below shows the level of access to extension services affirmed by the sampled government-funded small-scale broiler producers.

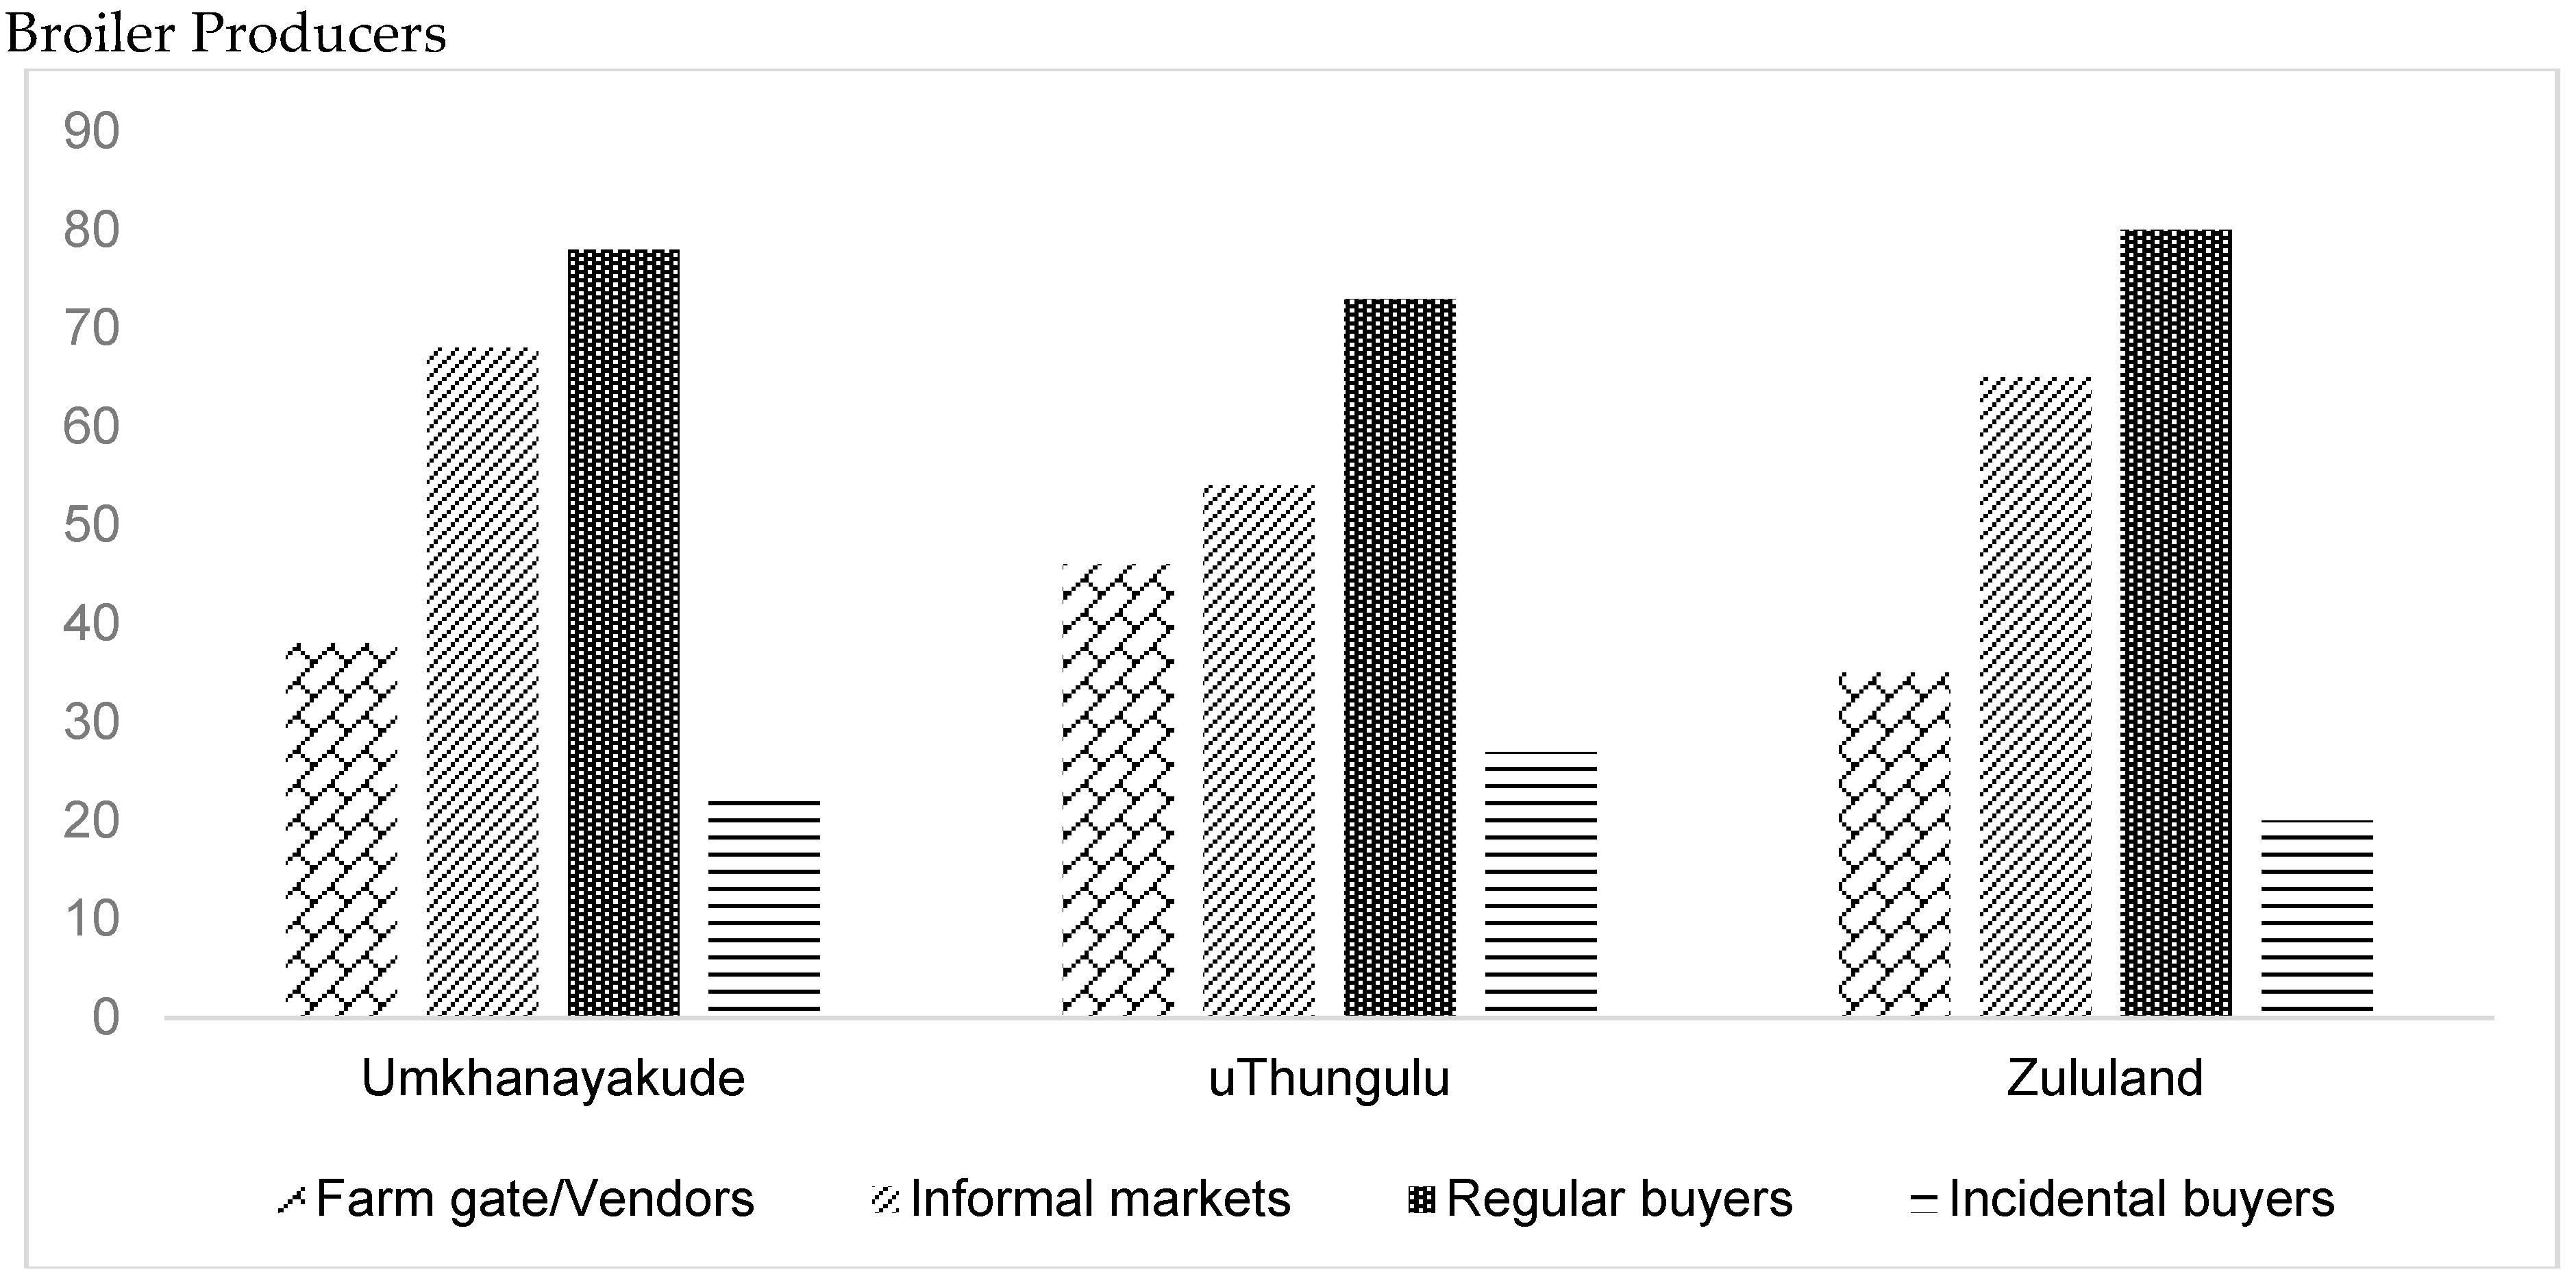
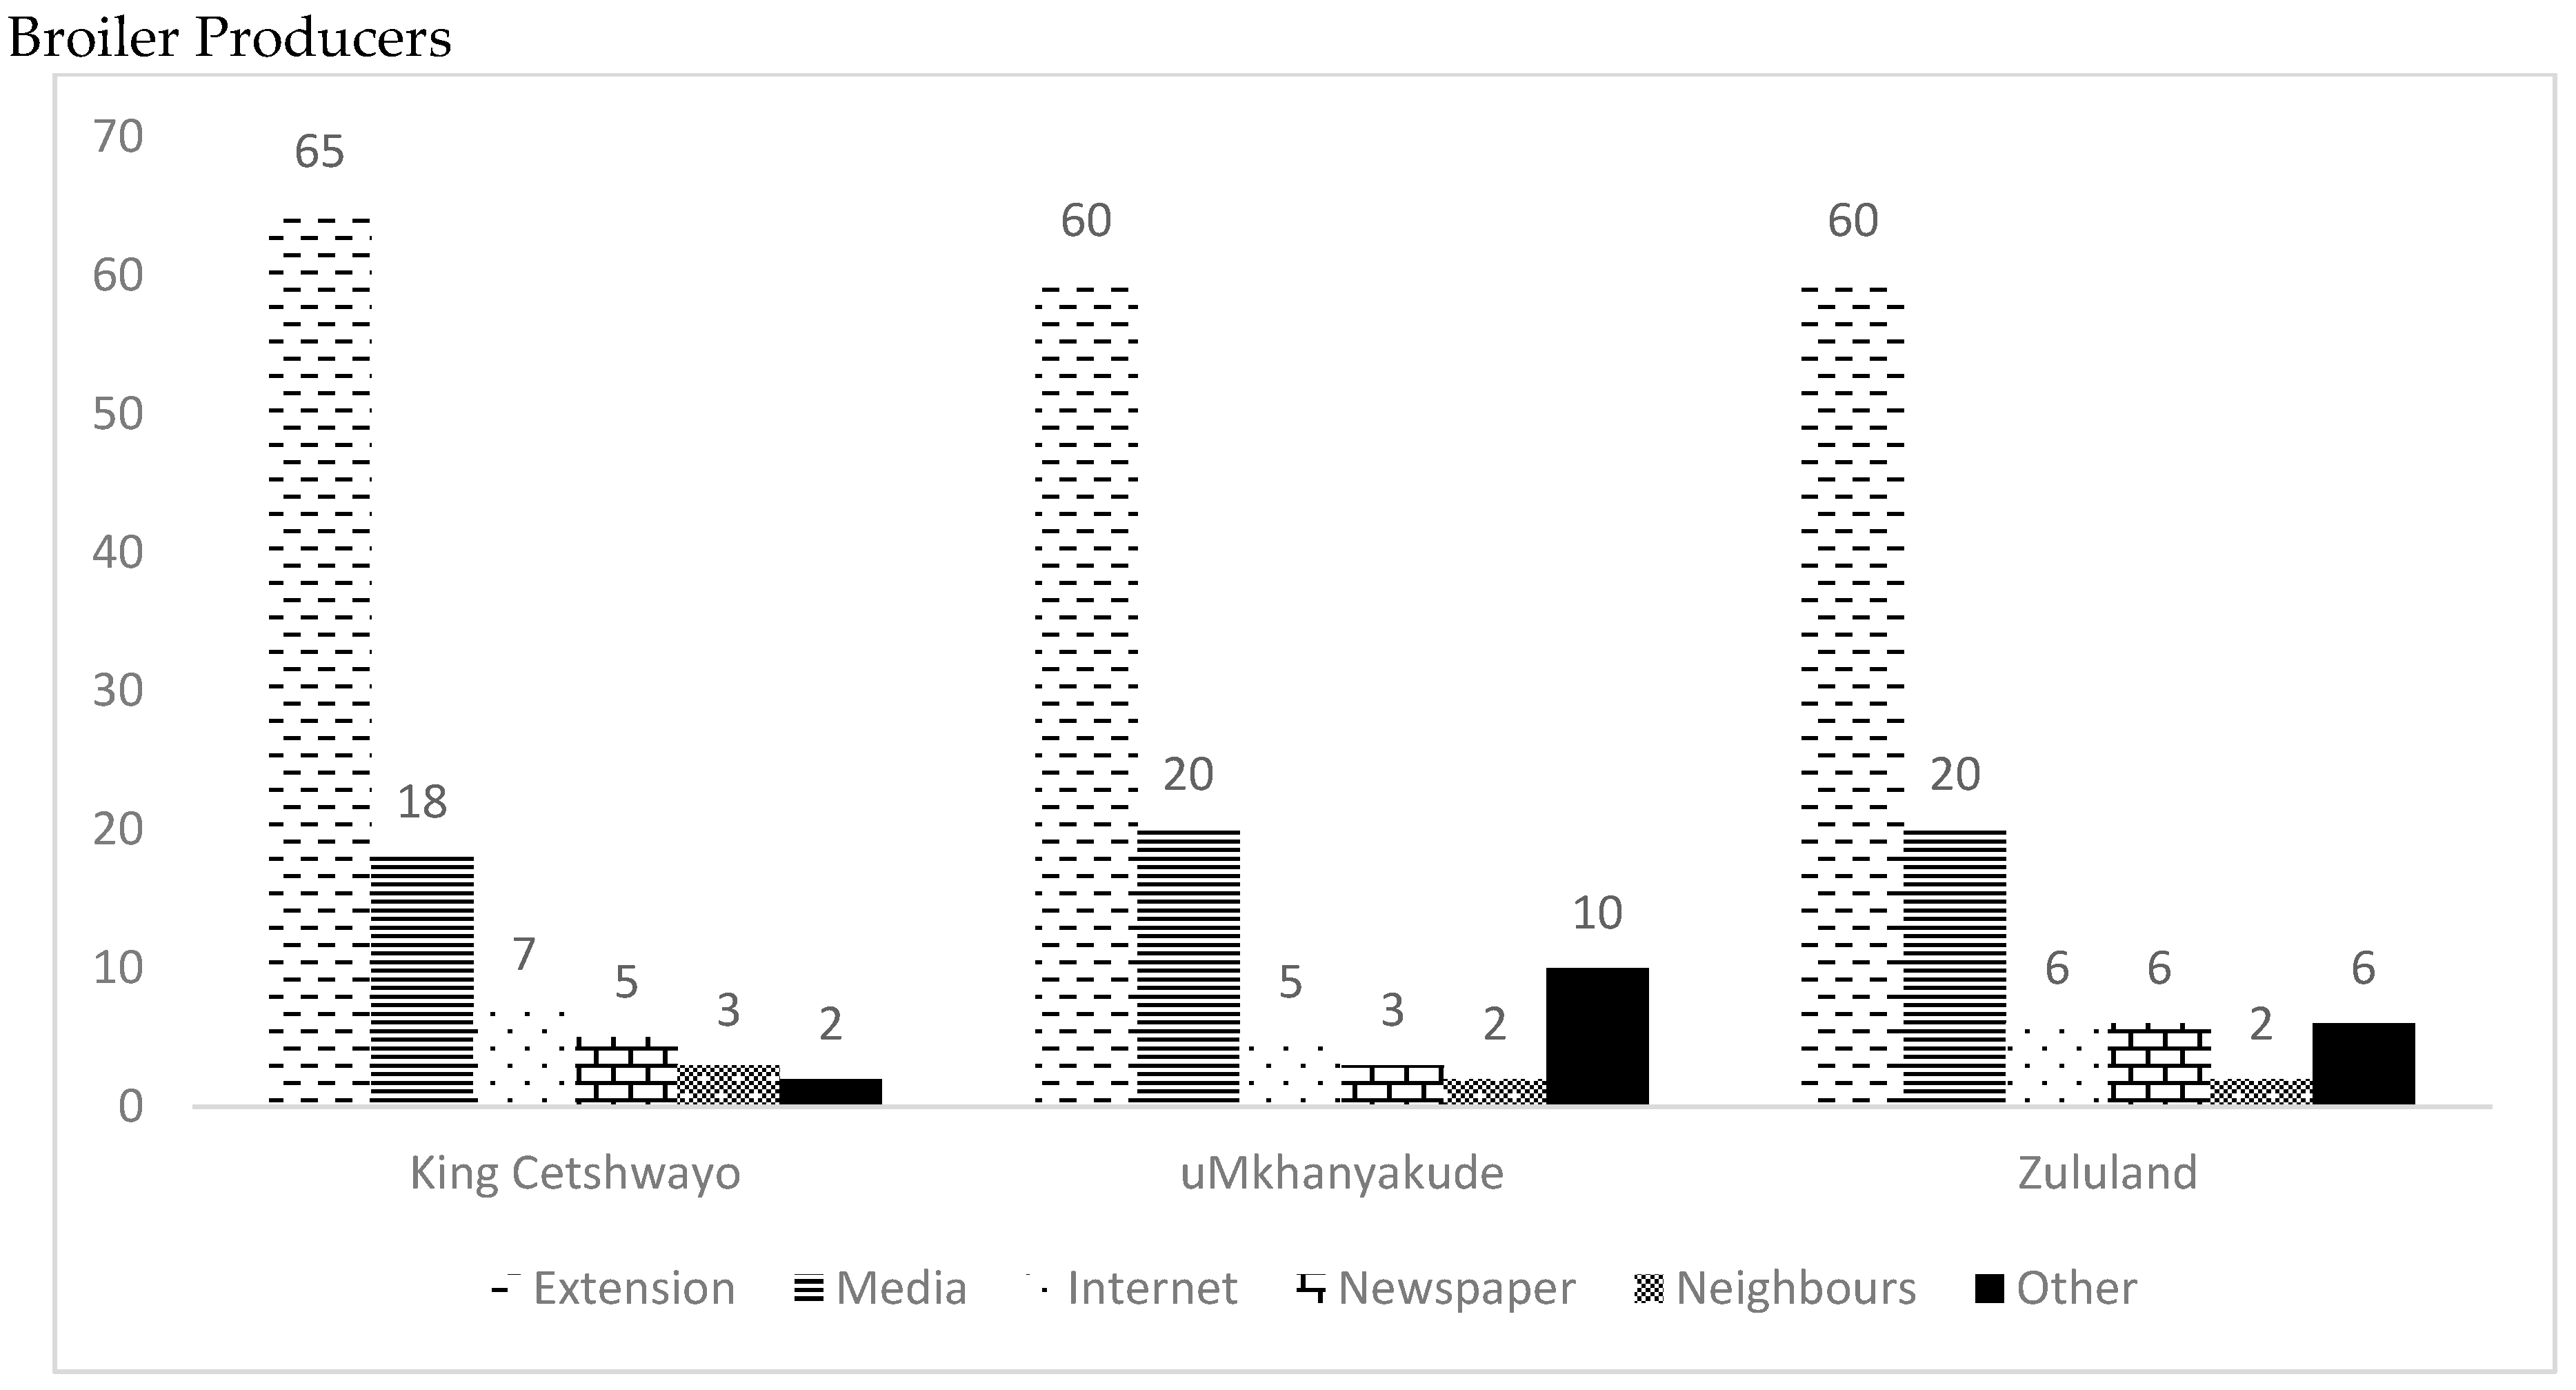
3.3. Marketing Channels and Sources of Market Information for Small-Scale Broiler Producers in Northern KwaZulu-Natal

The sampled government-funded small-scale broiler producers produced solely for the market; therefore, in this case, the importance of access to markets and market information cannot be overemphasized. Figure 3 and Figure 4 show the types of markets accessed and the sources of market information by the sampled government-funded small-scale broiler producers, respectively. Although South Africa is a net importer of poultry products, the sampled government-funded small-scale broiler producers reported that they do not have access to formal markets; thus, there is a low market off-take. The reported market channels were primarily informal pension points and farmgate selling (Figure 4). Pension pay points were the most preferred market as the small-scale broiler producers were confident of finding buyers. It is a norm for many pensioners to buy live birds when they are paid. None of the sampled government-funded small-scale broiler producers travelled to sell at the nearest town or practiced bakkie trading or street vending. Possible reasons for not conducting bakkie trading and taking produce to the nearest town could be the lack of their own transport and high transport costs and the uncertainty of any broilers being sold.
The primary (Figure 3) source of market information for the sampled government-funded small-scale broiler producers was extension services, followed by the media (radio and television). Other sources of market information, though to a lesser extent, included the Internet and news studies and other unverified sources.

3.4. Small-Scale Broiler Production and Marketing Challenges in Northern KwaZulu-Natal

The sampled government-funded small-scale broiler producers in the study area experienced a myriad of challenges, ranging from infrastructural to institutional (marketing) constraints. A lack of value-adding infrastructure, like refrigeration and abattoirs, was the primary constraint reported by all the respondents. All (100%) respondents indicated that they did not have access to proper processing and storage facilities, such as abattoirs and refrigerators (Figure 5). In all the three municipalities, the majority (73, 78, and 80%) of the sampled government-funded small-scale broiler producers in the King Cetshwayo, uMkhanyakude, and Zululand Districts, respectively, experience problems accessing formal markets. As already shown in Figure 4, the sampled small-scale broiler producers do not have established markets for the broilers. A similar challenge is also observed in accessing market information (Figure 5). In addition to travelling a maximum distance of 30 km and mean distance of 14.6 km, 54, 68, and 65 percent of farmers in the King Cetshwayo, uMkhanyakude, and Zululand Districts, respectively, complained of either high transportation costs or lack of transport. The qualitative data showed that most rely on hired transport, which is costly. A lesser proportion of the sampled government-funded small-scale broiler producers complained of a lack of access to extension services and electricity (Figure 5).

3.5. Gross Margin and Gross Profit Margin Analyses

This section presents the results of the benchmarking process, i.e., the comparative analyses of the key profitability parameters of the government-funded small-scale broiler producers and the small-scale producers that supplied the Commercial Chicken Farm (a large-scale broiler producer). Farm production costs refer to the costs of production inputs, including day-old chicks, feed (starters, finishers, and post-finishers), vaccine/medication, brooders, and marketing costs. Table 3 shows the average costs of production, GM, and GPM by the sampled government-funded small-scale broiler producers in Northern KZN. Costs presented in this table are the average costs taken from all three district municipalities (King Cetshwayo, uMkhanyakude, and Zululand).
The cost of critical inputs is important when computing the profitability and competitiveness of an enterprise. Table 3 shows the cost of production and the average share of the variable production cost spend and attempts to present a comparative analysis of the GM of the sampled government-funded small-scale broiler producers with those of the small-scale producers that supply the Commercial Chicken Farm to assess their viability. The results show that the sampled government-funded small-scale broiler producers have a mean gross margin of ZAR 1935.01 per 100 broiler batch across all districts compared to the ZAR 3050.06 per 100 broiler batch obtained by small-scale producers that supply the Commercial Chicken Farm. The mean GPM for the sampled government-funded small-scale broiler producers across all districts was 31%, while the mean GPM for the Commercial Chicken Farm was about 58%. However, a closer look at each of the districts shows that King Cetshwayo performed better (with a GPM of about 54%), followed by Zululand (42%) and uMkhanyakude (35%).

3.6. Factors That Influence the Profitability of the Broiler Enterprises

Table 4 presents the results of the multiple regression model employed to determine the factors that influence the profitability of the sampled government-funded small-scale broiler enterprises. The eight explanatory variables included in the model were the age of the household head (broiler farmer), gender of the farmer, educational level of the farmer, farmgate prices for broilers, distance to the nearest markets for livestock marketing, access to market information, access to electricity, and access to extension services. As previously highlighted, these variables were chosen on the basis of their popularity in the literature on similar studies in South Africa and the region in general [18,19,20,21].
The unadjusted and adjusted multiple R-squared values for these data were 0.850 and 0.832, respectively. This value suggests the model accounts for about 83% of the total variability. The assumption in running the multiple regression model was that errors in regression are independent. The Durbin–Watson for this dataset was 1.504. A Durbin–Watson statistic that is around 2 (between 1 and 3) is normally acceptable. Also, variance inflation factors (VIFs) were used to inspect the level of multicollinearity among the independent variables. The classification accuracy in this dataset indicates that multicollinearity is not a problem and, thus, the correctness of the model. Table 4 shows that the factors that significantly influence the profitability of government-funded small-scale broiler enterprises in Northern KZN include gender, farmgate price, access to market information, and access to extension services.
The variable gender is statistically significant at the 10% significance level (p = 0.071; β = 1.176) and positively related to the gross margin. In line with the conventional understanding and our prior expectations, the selling price was found to be positively related to the gross margin (p = 0.001; β = 27.218). Surprisingly, and inconsistently with our expectation, access to market information was found to be statistically significant at the 10% level (p = 0.087; β = −40.745), but negatively correlated with the gross margin. The variable access to extension services was statistically significant at a 5% significance level (p = 0.008; β = 68.865) and positively correlated to the gross margin.
Furthermore, the goodness-of-fit tests of the model was assessed using the F-test (41.310) and the important test statistics of Akaike Information Criteria (AIC) and Bayesian Information Criteria (BIC), both of which yielded near identical values (AIC = 868.268 and BIC = 891.443), which were reasonable and pointed to a good model fit. To ascertain the relevance of the education variable for instrumentation, as discussed in the Methodology Section, the 2SLS regression was run and instruments were defined from the education variable. An inspection of the results of the OLS regression in Table 4 and 2SLS regression in Table 5 reveals the substantial dispersion in the coefficients for education, which points to the presence of bias.
The diagnostic tests to determine whether or not there was endogeneity were conducted using the Instrumental Variable and Two-Stage Least Squares (IV & 2SLS) approach, which showed that there was no endogeneity. Table 6 presents the results of the test and compares the coefficients of the OLS estimates with those of the Instrumental Variable and Two-Stage Least Squares (2SLS) estimates, which shows that there are no grounds to replace the OLS estimates. As already highlighted in the Methodology Section, the test of overidentifying restrictions also yielded an F(2,64) = 17.9018, which was higher than the critical values at 10% and exceeds the cut-off of F = 10. We can conclude that the instruments are viable and not weak. Overall, the indication from Table 6 is that OLS fitted better than the alternative models (IV and 2SLS.).

3.7. Technical Efficiency of Broiler Production

An important objective of this study was to determine the technical efficiency of the broiler industry in the project area. To achieve this objective, the Stochastic Frontier Model was fitted to the production and socioeconomic data collected as part of the study. As explained in the Methodology Section, a one-step approach was adopted to allow for the determination of the factors that affect inefficiency at the same time as the frontier analysis was performed. The Maximum Likelihood Estimation option was employed on STATA, which yielded the results through multiple iterations. The variable costs of production, such as the cost of procuring the day-old chicks, cost of purchasing feeds, heating and lighting costs, vaccinations, and therapies, were included in the initial runs of the model, and the iterations continued until the most influential variables were shown in the output table. The results of the frontier estimation are presented in Table 7.
The results in Table 7 show that the estimated coefficients of Flock Size (number of day-old chicks), feed consumed by the birds, and the labour input to run the broilers were statistically significant at the 1% level. These coefficients are positive, which supports the notion that the higher the number of birds that are kept to maturity, the better the performance in a commercial sense. Similarly, the greater the amount of feed that is fed to the birds, the higher their liveweight at the time of sale and the higher their economic value. At the market, buyers hold chickens up to size them up before quoting a price, and the heavier the chicken, the higher the price asked by the seller and accepted by the buyer. The appearance of heaviness is also related to the weight and state of health of the chicken, which are influenced by the feeding regime on which the chickens have been raised. It also stands to reason that the more labour that is devoted to taking care of the birds, the better their performance, although this is also likely to add to the costs. Labour is needed to place feed and water in the pens at least two times a day in the morning and evening, although it may often be necessary to take a tour of the pen during the day to ensure that everything is going well and to refill the feeders and waterers. Labour is also required to clean the chick pen periodically. The wood shavings commonly spread on the floor of the chicken pens become wet and muddy within a short time due to the activities of the birds and need to be replaced to avoid them becoming fertile media for disease-bearing micro-organisms. Many lethal diseases of chickens, such as coccidiosis, arise from contaminated and unhygienic environments. There has to be a balance between the cost-effective use of labour and its optimal use to ensure that profitability is not compromised.
Ironically, the coefficient of medication was insignificant, which could be due to the absence of a consistent and systematic use of the medications in the small-scale broiler production as a result of limited awareness, low capital base, and weak extension contact. While the use of medications, particularly antibiotics, is rampant in poultry production worldwide, it is not unlikely that this is not typical among the small-scale sector, which exhibits the usual constraints in technology adoption that characterize smallholder production systems. Contrary to previous studies, the authors of [28] established that farmers who access extension services have a lower probability of adopting technologies. Also, in Ghana, extension services are shown not to be significantly associated with the likelihood of increasing household food security position [29].

3.8. Technical Inefficiency

The one-step approach for the estimation of technical efficiency incorporates an inefficiency model within the same operation. In line with the theory, factors such as the age of the farmer, gender of the farmer, educational level of the farmer, and extension contact were considered to have an important influence on the efficiency of any system. For this reason, those variables were included in the model, and the results are presented in Table 8.
The results show that the estimate of age had a positive coefficient that was statistically significant at the 1% probability level. This means that, the older the farmer, the more inefficient the operations of the farm, thus implying that younger farmers might be more technically efficient than older farmers. While this result makes intuitive sense, it contradicts the findings of [30]. On the other hand, the results support the findings of [31,32].
The results regarding gender, educational level, and extension access were also examined. According to the results, the estimates for the gender and educational level of the farmer had a negative coefficient but were statistically significant at 5% and 1%, respectively. These results are consistent with results obtained by other studies with respect to the educational level [32], and gender of the farmer [33]. These results could suggest that, with respect to gender, women are more technically efficient than men in the management of broiler projects. With respect to the educational level, the negative coefficient suggests that a lower level of education corresponds with more technical inefficiency, meaning that the more educated the farmer, the more technically efficient the broiler business. Curiously, extension access was not statistically significant probably because it was not well-structured and delivered according to the farmers’ needs.
It is often necessary to test the reliability of the estimates. One element that tends to be susceptible to error is the inefficiency model, since problems of heteroscedasticity may arise. When such a problem exists, then, the estimates are likely to be biased. In STATA, the cross-command allows for the testing of the inefficiency term, USigma, and its correction, if heteroscedasticity is detected. Table 9 presents the results of the heteroscedasticity test of the inefficiency term, which confirms that its variance is explained by differences in age and the educational level of the farmer, which invariably suggests that the experience of the farmer determines how efficient the operations would be.
It may be the case that the heteroscedasticity originates from the disturbance term, v, rather than the inefficiency term, U. In that case, the Vsigma was tested to ascertain whether the variables fitted with respect to the inefficiency term provide any information that might help to understand the behaviour of the overall model. Table 9 provides the results of the test with respect to the disturbance term and confirmed that only the age of the farmer has the possibility of varying to the extent that it affects the estimation results, while Table 10 presents the results with respect to the stochastic error term.

4. Discussion

This study sought to assess the viability of government-funded small-scale broiler enterprises in Northern KZN. A gross margin/gross profit margin analysis was employed to determine the profitability of the government-funded small-scale broiler enterprises, including an analysis of the production and marketing challenges and the factors influencing their profitability. The gross margin and gross profit margin analyses show that, generally, the gross margin and gross profit margin obtained by the sampled government-funded small-scale broiler producers are positive, suggesting that these enterprises are viable (profitable). However, the sampled government-funded small-scale broiler producers had a lower performance in comparison to the small-scale producers that supply the Commercial Chicken Farm. This finding was expected given that the small-scale producers that supply the Commercial Chicken Farm produce on a large scale and use bulk feed, medication, and controlled environments that contribute to the increased gross margin and gross profit margin under that programme.
On the other hand, the government-funded small-scale broiler producers have a lower mean gross margin because they still use low input technology, which may affect their gross margin and gross profit margin. When comparing the districts, it was found that broiler producers in King Cetshwayo realized gross margins and gross profit margins that exceeded those of farmers in the two other study districts. This finding could be attributed to the developmental level of the district in terms of better infrastructure such, as roads and water services, when compared to the Zululand and uMkhanyakude Districts. Generally, the results imply that the government-funded small-scale broiler producers can do better in respect to production, marketing, and financial management to enhance their profitability. Dumping continues to pose a serious threat to survival of the poultry enterprise [34].
Several production and marketing challenges were observed that could potentially translate to the viability of the broiler enterprises. The descriptive statistics revealed that the primary challenges ranged from poor infrastructure, lack of value addition facilities like refrigeration, and lack of access to proper processing and storage facilities, such as abattoirs and refrigerators. The lack of infrastructure, such as abattoirs and refrigeration, prevent the producers from participating in formal markets [20]. The primary marketing challenges reported include a lack of access to formal markets, lack of market information, and high transport costs. Access to formal markets and market information provides an opportunity for farmers, given their budgetary constraints, to sell their output at the best price. Ready access to market information reduces the transaction costs of searching for information [35]. Therefore, having access to market information, ceteris paribus, can significantly increase the profitability of broiler production. Our findings show that the sampled government-funded small-scale broiler producers relied mostly on informal markets instead of guaranteed formal markets. It has been demonstrated that it is not good for a business to rely on unguaranteed customers because there is no assurance that the product will be marketed [35]. Other studies [36] suggest that the lack of transport by small-scale broiler producers is a significant problem and one of the main reasons for small-scale producers and their business not being viable. Small-scale broiler producers may receive a lower gross margin because of the resulting feeding costs for the matured broilers that are ready for the market but remain unsold due to lack of markets [37]. Again, the government-funded small-scale broiler producers travelled long distances to access markets. This situation reduces profits as it increases transaction costs. The lack of market information reduces the viability of the project because there is no guarantee that all broilers will be sold on time [36].
Further, we analysed the factors that influence the profitability and technical efficiency of the government-funded small-scale broiler enterprises in Northern KZN. Our findings show that the producer demographics with the exception of the gender variable were little or not related to profitability. It may seem as though profitability depends more on farm-related factors than on the personal characteristics of the producers. In that regard, the study found that farmgate price, access to market information, and access to extension services significantly influenced the gross margin. The results show a gender disparity in broiler production in Northern KZN, where males dominate this sector, except for the King Cetshwayo District. This gender disparity presents an important opportunity for comparison and generation of gender-sensitive poultry production and management practices. Research [38] showed that women perform well in broiler production in terms of record-keeping and tracking business profitability. The regression results, however, suggest otherwise, i.e., male small-scale broiler producers are more profitable than female small-scale broiler producers. This finding is in contrast with those of other studies, for example, [39] postulated that women in small businesses are more likely to be profitable than men. However, this finding could be explained as men tend to be more resourceful in terms of access to resources, infrastructure, land, and credit, all of which could act as a prerequisite for sustainable production. A strong case can be made for taking full account of socio-cultural issues, including gender-based aspects, in the design of capacity building and support schemes in poultry production [40]. Consistent with our prior expectation, the influence of farmgate price on the profitability of the broiler enterprise is a positive and a statistically significant one. The regression model predicts that a higher market price of the broiler would translate to an increased gross margin. This finding agrees with those of previous research [41], which also found that the farmgate price is positively associated with the gross margin. Surprisingly, the regression model shows that access to market information is statistically significant, but negatively correlated with gross margin. This finding disagrees with our prior expectation and is in contrast with those of many studies, for example, [42] indicated that access to market information is positively correlated to gross margin. This finding could be explained by descriptive results that reveal that the total allocable costs by the small-scale broiler producers were higher than those of a large-scale broiler producer (Commercial Chicken Farm). Small-scale broiler producers struggle to access market information, and this has a detrimental effect on their returns. This, in turn, translates to a lower gross margin given the fact that they do not conduct value-adding processes to their products to attract a lucrative market. Again, information asymmetry tends to affect production decisions because of the uncertainty of a guaranteed market and prices. Also, poultry traders in informal markets can often collude in setting prices, leaving small-scale producers at a disadvantage. Extension plays a crucial role in empowering farmers with farming knowledge, techniques, and skills [36]. Consistent with our expectation, we found that the variable access to extension services was statistically significant and positively influenced the gross margin.
The indication of the importance of flock size, feed cost, and labour in determining the technical efficiency of small-scale broiler production confirms a priori assumptions and further validates the OLS model, which reveals that production/farm-related factors are more influential than the socio-demographic characteristics. The importance of these production/farm-related factor in broiler production in South Africa was forcefully demonstrated in 2023 with by the crisis that the sector has faced, featuring the most devastating losses that the sector has ever experienced. In a few short months, the sector lost as many as 7.5 million birds and the country virtually ran out of eggs; as recently as October 2023, many shops had not sold a single egg for weeks, while others introduced a rationing system. In the sections where eggs were usually kept, shops now display milk and other beef products, an irony that is not missed, as a great bovine revenge in the epic conflict between red and white meat. While the exact causes of this disaster could still be subject of investigation, a popular view is that the frequent power outages, known as “loadshedding”, may have raised costs of routine poultry site activities, leading to the production environment being compromised [43,44]. It is often said that “poultry diseases are a sign of the lazy farmer”[45].
The component of the SFA that explains the technical inefficiency of the broiler production system, on the other hand, confirms the importance of a set of socio-demographic characteristics that mirror the results of the OLS. The crucial contribution of women in efficiently executing tasks that call for tender care is clearly demonstrated in the results, in a way validating the findings of the OLS model. A clear path for implementing a remedial intervention is therefore afforded by the results in terms of the technical and socio-economic changes that are necessary.

5. Conclusions

Livestock production, especially in developing countries, generally requires simultaneous interventions to promote less competitive producers to access markets and be more viable. The sampled government-funded small-scale broiler enterprises in Northern KZN in South Africa were generally found to be profitable. Nonetheless, when compared to the small-scale producers that suppy a large-scale broiler enterprise, as expected, the government-funded small-scale broiler enterprises performed relatively lower in terms of gross margin and gross profit margin. The government-funded small-scale broiler enterprises in Northern KZN can perform better if both the production and marketing challenges constraining them can be minimized. These include a lack of necessary infrastructure, such as abattoirs/refrigeration, and marketing challenges that include a lack of access to formal markets, limited market information, high costs of transport, and lack of their own transport. All these challenges can affect the viability of broiler enterprises.
For a sustainable broiler development support programme, the government through extension services should emphasize the capacity building of the producers since broiler production is dynamic and also a knowledge-intensive sector. Relevant broiler production, marketing, and financial knowledge are critical elements for efficient and sustainable broiler enterprises. Concerning high transport costs and lack of their own transport, small-scale broiler producers can take advantage of collective action and economies of scale in terms of bulk output marketing, including shared transport costs. However, more government support for these initiatives in terms of infrastructure provision (abattoirs and refrigeration) would certainly be paramount. Strategies seeking to address market information asymmetries cannot be overemphasized. These can be either through promoting the use of cheaper sources of information, for example, strengthening the already existing government extension services, and the use of Information Communication Technology (ICT) could reduce the cost of marketing, thus making the sector competitive.
Access to cheaper market information can promote the participation of small-scale broiler producers in high-end markets, thus increasing their profitability. These strategies could potentially be developed and tested for replication on a wider scale. Although this study established the sampled government-funded small-scale broiler enterprises in Northern KZN as economically viable, the socio-economic impact it has on the small-scale broiler producers was not investigated. A more systematic comparison with non-scheme broiler producers would yield important insights as well. Even for the scheme farmers investigated, a more detailed inspection of their operations, including access to their accounting documents, would be helpful. Future research should focus on those aspects and further assess the socio-economic impact of the government-funded small-scale broiler enterprises on producers and the broader community at large.

Author Contributions

S.T.C.M. and A.O. jointly conceptualized, formulated, and implemented the research investigation under the supervision of A.O. Data analysis was again conducted jointly by S.T.C.M. and A.O. The initial writing was conducted by S.T.C.M., while A.O. reviewed the draft, and both A.O. and S.T.C.M. produced final manuscript for submission. All authors have read and agreed to the published version of the manuscript.

Funding

This research received no external funding.

Institutional Review Board Statement

This study was conducted in accordance with the Declaration of Helsinki and approved by the University of Fort Hare Research Ethics Committee on 29 July 2021. The Committee subsequenty issued the Ethics Clearance Certificate REC-270710-028-RA Level 01.

Data Availability Statement

The data presented in this study are available on request from the corresponding authors. They are not placed in a public respository because the Government Department associated with the support scheme may not be conformtable with publicity that it does not control.

Acknowledgments

The authors extend their gratitude to the KZN Department of Agriculture and Environmental Affairs, especially the Specialist Agriculture and Advisory Services (SAAS) sections in the King Cetshwayo, uMkhanyakude, and Zululand Districts for organizing and helping with data collection. A special mention is also owed to the government-funded small-scale broiler producers who participated in the study for their valuable time.

Conflicts of Interest

The authors declare no conflict of interest.

References

  1. Alene, A.D.; Manyong, V.M.; Omanya, G.; Mignouna, H.D.; Bokanga, M.; Odhiambo, G. Smallholder market participation under transactions costs: Maize supply and fertilizer demand in Kenya. Food Policy 2008, 33, 318–328. [Google Scholar] [CrossRef]
  2. Bagamba, F.; Ssenyonga, J.W.; Tushemereirwe, W.K.; Gold, C.S. Performance and profitability of the banana sub-sector in Uganda farming systems, Kampala, Uganda. In Bananas and Food Security; Picq, C., Fouré, E., Frison, E.A., Eds.; INIBAP: Montpellier, France, 1998; pp. 729–739. [Google Scholar]
  3. United Nations. World Population Prospects 2022; United Nations: New York, NY, USA, 2022. [Google Scholar]
  4. Roser, M.; Ritchie, H.; Ortiz-Ospina, E. World Population Growth. Available online: https://ourworldindata.org/world-population-growth (accessed on 12 January 2020).
  5. Chetroiu, R.; Lurchevici, L. Standard gross margin for poultry. In Proceedings of the 3rd International Symposium “Agrarian Economy and Rural Development—Realities and perspectives for Romania”, Bucharest, Romania, 11–13 October 2012; Available online: http://hdl.handle.net/10419/76865 (accessed on 15 July 2023).
  6. Makweya, F.L.; Oluwatayo, I.B. Consumers’ preference and willingness to pay for graded beef in Polokwane municipality, South Africa. Ital. J. Food Saf. 2019, 8, 7654. [Google Scholar] [CrossRef] [PubMed]
  7. Dlamini, B.R.; Rampedi, I.T.; Ifegbesan, A.P. Community Resident’s Opinions and Perceptions on the Effectiveness of Waste Management and Recycling Potential in the Umkhanyakude and Zululand District Municipalities in the KwaZulu-Natal Province of South Africa. Sustainability 2017, 9, 1835. [Google Scholar] [CrossRef]
  8. South African Poulty Association, 2023 Industry-Profile. Available online: https://www.sapoultry.co.za/wp-content/uploads/2023/01/2021-Industry-Profile.pdf (accessed on 12 August 2023).
  9. Natalie, C. Production Volume of Chicken Meat in South Africa from 2010 to 2020. 2023. Available online: https://www.statista.com/aboutus/our-research-commitment/3664/natalie-cowling (accessed on 22 October 2023).
  10. Statista. Per Capita Consumption of Meat in South Africa from 2010 to 2017. 2021. Available online: https://Www.Statista.Com/Statistics/963216/per-Capita-Consumption-of-Meat-by-Type-SouthAfrica/ (accessed on 20 October 2023).
  11. Larkin, P. Importing Chicken Will Not Save the Day”, Independent Online 2023. Available online: https://www.iol.co.za/business-report/economy/importing-chicken-will-not-save-the-day-say-experts-df552a66-a27f-4ee5-9342-a10c7dbecd11 (accessed on 30 October 2023).
  12. Botha, L. Chicken Import Tariffs: It’s Only Fair. Farmers Weekly. Available online: https://www.farmersweekly.co.za/agri-news/south-africa/chicken-import-tariffs-its-only-fair/ (accessed on 30 October 2023).
  13. Schepina, I.; Gogoleva, T.; Charykova, O. Import substitution trends in agriculture of the Russian regions. In IOP Conference Series: Earth and Environmental Science; IOP Publishing: Bristol, UK, 2019; Volume 274, p. 012015. [Google Scholar] [CrossRef]
  14. Department of Agriculture, Fisheries and Forestry (DAFF). A Profile of the South African Broiler Market Value Chain. Available online: https://www.daff.gov.za/docs/AMCP/BroilerMVCP11-12.pdf (accessed on 12 January 2020).
  15. Birhanu, M.Y.; Osei-Amponsah, R.; Obese, F.Y.; Dessie, T. Smallholder poultry production in the context of increasing global food prices: Roles in poverty reduction and food security. Anim. Front. 2023, 13, 17–25. [Google Scholar] [CrossRef] [PubMed]
  16. National Agricultural Marketing Council (NAMC). Baseline Report—The Case for Smallholder Broiler Production in South Africa; NAMC: Pretoria, South Africa, 2020. [Google Scholar]
  17. Kwazulu-Natal Municipalities. Municipal Directories and Reports; Government of South Africa. 2023. Available online: https://www.gov.za/about-government/contact-directory (accessed on 30 October 2023).
  18. Mulaudzi, V. Gross Margin Analysis and Determinants of Savings among Small-Scale Broiler Producers in Vhembe District of Limpopo Province, South Africa. Master’s Thesis, University of Limpopo, Polokwane, South Africa.
  19. Zulu, E. Profitability of Smallholder Cowpea Production in Zambia. Bachelor’s Thesis, University of Zambia, Lusaka, Zambia, 2011. [Google Scholar]
  20. Ramukhithi, T.F.; Nephawe, K.A.; Mpofu, T.J.; Raphuku, T.; Munhuweyi, K.; Ramukhithi, F.V.; Mtileni, B. An Assessment of Economic Sustainability and Efficiency in Small-Scale Broiler Farms in Limpopo: A Review. Sustainability 2023, 15, 2030. [Google Scholar] [CrossRef]
  21. Phiri, P.T.; Ruzhani, F.; Madzokere, F.; Madududu, P. Factors affecting the profitability of smallholder broiler production in Mutare district, Manicaland Province, Zimbabwe: A Quantile Regression Approach. Cogent Econ. 2023, 11, 221660. [Google Scholar] [CrossRef]
  22. South Australian Farm Gross Margin and Enterprise Planning Guide. 2022. Available online: https://www.google.com/search?q=19.22.+South+Australian+Farm+Gross+Margin+and+Enterprise+Planning+Guide+2022&rlz=1C1GCEA_enZA1080ZA1080&oq=19.22.%09South+Australian+Farm+Gross+Margin+and+Enterprise+Planning+Guide+2022&gs_lcrp=EgZjaHJvbWUyBggAEEUYOdIBCTU1OTBqMGoxNagCALACAA&sourceid=chrome&ie=UTF-8 (accessed on 19 November 2023).
  23. Greene, W.H. Econometric Analysis; Pearson: Upper Saddle River, NJ, USA, 2008. [Google Scholar]
  24. Ullah, S.; Zaefarian, G.; Ulla, F. How to use instrumental variables in addressing endogeneity: A step-by-step procedure for non-specialists. Ind. Mark. Manag. 2020, 96, A1–A6. [Google Scholar] [CrossRef]
  25. Stock, J.H.; Yogo, M. Testing for weak instruments in linear IV regression, National Bureau of Economic Research & Harvard University (Prepared for the Festschrift in honour of Thomas Rothenberg), February 2003. Available online: https://scholar.harvard.edu/files/stock/files/testing_for_weak_instruments_in_linear_iv_regression.pdf (accessed on 19 November 2023).
  26. Parente, P.M.D.C.; Santos Silva, J.M.C. A cautionary note on tests of overidentifying restrictions. Econ. Lett. 2012, 115, 314–317. [Google Scholar] [CrossRef]
  27. Battese, G.E.; Coelli, T.J. Frontier production functions, technical efficiency and panel data: With application to paddy farmers in India. J. Product. Anal. 1992, 3, 153–169. [Google Scholar] [CrossRef]
  28. Bruce, A.K.K.; Donkoh, S.A.; Ayamga, M. Improved Rice Variety Adoption and its Effects on Farmers’ Output in Ghana. J. Dev. Agric. Econ. 2014, 6, 242–248. [Google Scholar] [CrossRef]
  29. Nata, J.T.; Mjelde, J.W.; Boadu, F.O. Household adoption of soil-improving practices and food insecurity in Ghana. Agric. Food Secur. 2014, 3, 17. [Google Scholar] [CrossRef]
  30. Dessale, M. Analysis of technical efficiency of smallholder wheat growing farmers of Jamma district, Ethiopia. J. Agric. Food Secur. 2019, 8, 1–8. [Google Scholar] [CrossRef]
  31. Alabi, R.A.; Aruna, M.B. Technical efficiency of family poultry production in the Niger Delta, Nigeria. J. Cent. Eur. Agric. 2005, 531–538. [Google Scholar]
  32. Mbanasor, J.; Kalu, K. Economic efficiency of commercial vegetable production system in Akwa Ibom State, Nigeria: A translog Stochastic Frontier Cost Function Approach. Trop. Sub-Trop. Agroecosystems 2008, 8, 313–318. [Google Scholar]
  33. Ahiale, E.D.; Abunyuwah, I.; Yenibehit, N.Y. Technical efficiency analysis of broiler production in the Mampong Municipality of Ghana. J. Econ. Sustain. Dev. 2019, 10, 152–158. [Google Scholar]
  34. Nkukwana, T.T. Global poultry production: Current impact and future outlook on the South African poultry industry. S. Afr. J. Anim. Sci. 2018, 48, 869–884. [Google Scholar] [CrossRef]
  35. Selaledi, L.A. The Impact of Supply Chain on Sustainability of Small-Scale Poultry Farmers in Ratlou Local Municipality, North West Province. Master’s Thesis, University of South Africa, Pretoria, South Africa, 2017. [Google Scholar]
  36. Gabre-Madhin, E. Market Institutions, Transaction Costs, and Social Capital in the Ethiopian Grain Market; International Food Policy Research Institute (IFPRI) Research Report; International Food Policy Research Institute (IFPRI): Washington, DC, USA, 2001. [Google Scholar]
  37. Manona, S.S. Smallholder Agriculture as Local Economic Development (LED) Strategy in Rural South Africa: Exploring Prospects in Pondoland, Eastern Cape. Master’s Thesis, University of Western Cape, Cape Town, South Africa, 2005. [Google Scholar]
  38. Nassar, M.K.; Lyu, S.; Zentek, J.; Brockmann, G.A. Dietary fiber content affects growth, body composition, and feed intake and their associations with a major growth locus in growing male chickens of an advanced intercross population. Livest. Sci. 2019, 227, 135–142. [Google Scholar] [CrossRef]
  39. Guèye, E.F. Gender issues in family poultry production systems in low-income food-deficit countries. Am. J. Altern. Agric. 2003, 18, 185–195. [Google Scholar] [CrossRef]
  40. Hoverstadt, P. The Fractal Organization: Creating Sustainable Organizations with the Viable System Model; Wiley: Chichester, UK, 2008. [Google Scholar]
  41. Food and Agriculture Organization (FAO). Globalization of Food Systems in Developing Countries: Impact on Food Security and Nutrition; FAO food and nutrition paper 83; Food and Agriculture Organization: Rome, Italy, 2004. [Google Scholar]
  42. Kaliba, A.R.M.; Verkuijl, H.; Mwangi, W. Factors affecting adoption of improved maize seeds and use of inorganic fertilizer for maize production in the intermediate and lowland zones of Tanzania. J. Agric. Appl. Econ. 2000, 32, 35–47. [Google Scholar] [CrossRef]
  43. Poultry New. Poultry Crisis Deepens as South Africa Culls 7.5 Million Birds Amidst Worsening Bird Flu Outbreaks. 2023. Available online: https://www.poultryproducer.com/poultry-crisis-deepens-as-south-africa-culls-7-5-million-birds-amidst-worsening-bird-flu-outbreaks/# (accessed on 30 October 2023).
  44. Al Jazeera and News Agencies. Power Crisis, Bird Flu Trigger Imminent Chicken Shortage in South Africa. 2023. Available online: https://www.aljazeera.com/economy/2023/9/21/power-crisis-bird-flu-trigger-imminent-chicken-shortage-in-south-africa (accessed on 30 October 2023).
  45. BnetHub. Coccidiosis Disease of the Lazy Farmer. 2023. Available online: https://bnethub.com/coccidiosis-disease-of-the-lazy-farmer/ (accessed on 30 October 2023).
Figure 1. Map showing the location of the selected districts in the KwaZulu-Natal Province in South Africa. Source: KZN municipalities.co.za (2022) [17].
Agriculture 13 02269 g001
Figure 2. Illustration of the availability of and access to extension services by the small-scale broiler (source: data survey, 2021).
Agriculture 13 02269 g002
Figure 3. Availability and accessibility of small-scale broilers markets (Source: data survey, 2021).
Agriculture 13 02269 g003
Figure 4. Sources of market information for small-scale broiler producers.
Agriculture 13 02269 g004
Figure 5. Summary of the constraints faced by the sampled government-funded small-scale broiler producers in Northern KwaZulu-Natal.
Agriculture 13 02269 g005
Table 1. Explanatory variables used in the multiple regression model and their expected outcomes.
VariableDescriptionMeasurement TypePriori Expectation (+/−)
AgeActual years of the small-scale broiler producerContinuous
GenderThe sex of the small-scale broiler producer (male/female)Dummy+/−
Education
Years of schooling
Level of education attained
Number of years in school by the small-scale broiler producer
Dummy
Continuous
+
+
Farm production costsOperational costsContinuous
Farmgate pricePrice of the broiler at the farm levelContinuous+
Access to marketsAvailability of ready output markets for the broilers (yes/no)Dummy+
DistanceThe physical distance in km to the marketContinuous
Market InformationWhether the small-scale broiler producer has access to information on broiler marketing (yes/no)Dummy+
StorageWhether the small-scale broiler producer has access to storage facilities and refrigeration (yes/no)Dummy+
TransportWhether the small-scale broiler producer has access to their own transport (yes/no)Dummy+
ElectricityWhether the small-scale broiler producer has access to electricity (yes/no)Dummy+
ExtensionWhether the small-scale broiler producer has access to extension services (yes/no)Dummy+/−
+/− Denotes the expected relationship with the dependent variable.
Table 2. Demographic characteristics of the respondents (n = 75).
Demographic ParameterKing CetshwayouMkhanyakudeZululand
Age (years) 51 (12.29)49 (10.8)61 (13.97)
Age categories<30008
30–3951216
40–49202424
50–59253632
>60501620
GenderMale338080
Female672020
Level of educationNo Education91012
Primary526062
Secondary302820
Tertiary926
Figures in parentheses denote standard deviations.
Table 3. Average input costs, gross margin, and gross profit margin analyses.
Government-Funded Small-Scale ProducersSmall-Scale Producers that Supply the Commercial Chicken Farm
Allocable CostsAverage
Production
Cost Per
Unit/100
(ZAR)
Average Share of the Variable Production Cost (%)Average
Production
Cost Per
Unit/100
(ZAR)
Average Share of the Variable Production Cost (%)
Day-old chickens485.0018.9439.5920.0
Feed costs1479.8567.31567.1371.3
Vitamins and vaccinations25.110.9813.190.6
House sanitation/Maintenance8.440.3215.390.7
Shavings13.150.5137.361.7
Gas for brooder/Heating and electricity130.005.0672.533.3
Other costs427.9316.6552.752.4 a
Mean Total Allocable Costs2569.482197.94
Mean Total Gross Income4320.005248.00
Mean Gross Margin1750.523050.06
% Gross Profit Margin3157.7
a These are cost related to transport costs, labour costs (1.3%), catching costs (0.4%), etc.
Table 4. Factors that influence the profitability of the government-funded small-scale broiler enterprises in Northern KZN.
Unstandardized CoefficientsStandardized Coefficients
VariableβStd. ErrorβtSig.VIF
Constant−320.484143.637-−2.2310.029-
Age1.43013119.2570.0581.1190.2671.213
Gender−33.305870.6420.1011.8320.071 *1.360
Educational10.6733311.0440.0751.4010.1661.263
Price27.287351.6990.95116.0160.001 ***1.572
Market Distance−5.5236966.291−0.046−0.8170.4171.420
Information39.6795523.426−0.095−1.7390.087 *1.321
Electricity3.64827127.490−0.003−0.0580.9541.297
Extension−67.0964125.2960.1402.7220.008 **1.179
R-squared (Adjusted R-Squared)0.850 (0.832)
Durbin–Watson1.504
F-test41.310 (Prob > 0.000)
Akaike crit. (AIC)868.268 Bayesian crit (BIC) = 891.443
***, **, and * denote significance at the 1, 5, and 10% levels, respectively.
Table 5. Results of the instrumental variables’ (2SLS) regression to address endogeneity.
Gross MarginCoef.St.Err.t-Valuep-Value[95% Conf.Interval]
Education25.39418.391.380.167−10.64961.436
Gender−34.05120.212−1.680.092 *−73.6655.564
Age1.570.6542.400.016 **0.2882.852
Marital Status−9.60511.81−0.810.416−32.75213.541
Extension−73.70424.844−2.970.003 ***−122.397−25.011
Price27.121.63716.570.000 ***23.91330.328
Market Distance−4.896.033−0.810.418−16.7146.935
Information30.94723.8231.300.194−15.74677.64
Electricity9.77126.7530.370.715−42.66562.206
Constant−231.15123.535−1.870.061−473.27310.973
Mean dependent variable1747.020SD dependent variable180.445
R-squared0.848Number of obs.75
Chi-squared419.784Prob > chi20.000
***, **, and * denote significance at the 1%, 5%, and 10%, respectively.
Table 6. Tests and correction of endogeneity using the instrumental variable approach.
VariablesOLSIV2SLS
Gender−33.30587−34.05081−34.05081
Age1.4301311.570191.57019
Education10.6733325.3935725.39357
Ext. Access−67.09641−73.70401−73.70401
Farmgate Prices27.2873527.1204427.12044
Market Distance−5.523696−4.889636−4.889636
Market Information39.6795530.9470730.94707
Access to Electricity3.6482719.7709029.770902
Table 7. Maximum likelihood estimation (MLE) of broiler farmers.
Gross IncomeCoef.Std. Err.Zp > z[95% Conf.
Interval]
Frontier
Flock Size0.02536970.01296731.960.050 **−0.00004580.050785
Feeds0.08776130.03057642.870.004 ***0.02783280.14769
Labour13.8510.0978389141.570.000 ***13.6592414.04276
Medication0.00329960.01719710.190.848−0.03040610.037005
Constant−22.2411
Notes: ***, ** mean significant at the 1% and 5% levels, respectively. Source: The results from STATA (Version 14.2) were generated from the field survey, 2020.
Table 8. Determinants of technical inefficiency.
Inefficiency ModelCoef.Std. Err.Zp > z[95% Conf.
Interval]
Age4.1359370.342679212.070.000 ***3.4642984.807576
Gender−2.5544041.082274−2.360.018 **−4.675621−0.43319
Education−2.9558081.079291−2.740.006 ***−5.071179−0.84044
Extension1.3414141.5137590.890.376−1.6254994.308328
Constant−19.28456
Notes: ***, ** mean significant at the 1% and 5% levels, respectively. Source: The results from STATA (Version 14.2) were generated from the field survey, 2020.
Table 9. Test of heteroscedasticity on the deterministic error term (U).
Coef.Std. Err.Zp > z[95% Conf.
Interval]
U-Sigma
Age0.99379910.27137663.660.000 ***0.46191071.525688
Education1.4092720.42798243.290.001 ***0.57044232.248103
Extension0.49242080.8024420.610.539−1.0803372.065178
Constant−7.311918
Notes: *** means significant at 1% level. Source: The results from STATA (Version 14.2) were generated from the field survey, 2020.
Table 10. Test of heteroscedasticity on the stochastic error term (V).
V-SigmaCoef.Std. Err.Zp > z[95% Conf.
Interval]
Age−0.77768770.1170086−6.650.000 ***−1.00702−0.54836
Education0.14307050.45746640.310.754−0.75354711.039688
Extension−0.93916330.6854974−1.370.171−2.2827140.404387
Market Information−0.04293470.5843637−0.070.941−1.1882661.102397
Constant−2.786895
Notes: *** mean significant at 1% level. Source: The results from STATA (Version 14.2) were generated from the field survey, 2020.
Disclaimer/Publisher’s Note: The statements, opinions and data contained in all publications are solely those of the individual author(s) and contributor(s) and not of MDPI and/or the editor(s). MDPI and/or the editor(s) disclaim responsibility for any injury to people or property resulting from any ideas, methods, instructions or products referred to in the content.

