Application of Machine Learning Algorithms for On-Farm Monitoring and Prediction of Broilers’ Live Weight: A Quantitative Study Based on Body Weight Data


Abstract
1. Introduction
- Traditional growth curves and growth models based on fitting mathematical functions. For example, Topal et al. [1] studied the fitting and prediction of avian weight–age relationships and compared the goodness of fit between MMF, Weibull, logistic, Gompertz, and von Bertalanffy models. Moharrery et al. [2] proposed a methodology to study and predict the growth characteristics of commercial broilers and indigenous chickens using a nonlinear function, and they used several statistical methods to evaluate the fit of the function and differences in growth parameters. Rizzi et al. [3] investigated growth patterns and sex differences in poultry meat production by comparing different models, such as linear, logistic, Gompertz, and Richards models, and the effect of fit analysis revealed a flexible growth function. Mouffok et al. [4], for the Cobb500 strain of meat birds, found that the Gompertz model was more accurate in estimating body weights in the early stages when comparing and evaluating the fit and predictive effects of different models.
- Live weight estimation methods based on digital image processing. For example, Wet et al. [5] proposed a method to analyze images of broilers using commercial software and established a nonlinear regression equation to estimate the body weight of broilers by statistically analyzing the nonlinear relationship between their surface area, girth, and body weight, which was found to be less accurate compared to image analysis of pigs. Chedad et al. [6] proposed a method to estimate the body weight of chickens by image analysis, and the results of the study showed that the results of automated weighing systems tend to underestimate the actual body weight of chickens at the end stage of the growth period. Bazlur et al. [7] proposed a method to develop a linear equation for estimating the body weight of broilers by analyzing the digital images of their body surface area, validated using a random sample of 100 broilers, and the highest error between the manually measured weight and estimated weight was 16.47%, while the lowest error was 0.04%. Mortensen et al. [8] proposed a method for predicting the weight of broilers based on a 3D camera and image processing algorithms, where the average relative error between the predicted and true weight on the test dataset was 7.8%, and as the density of chickens increased, the absolute error of prediction became larger in the later stages of breeding. Amraei et al. [9] proposed a research method that includes the use of machine vision techniques to extract features related to body weight and the use of artificial neural network algorithms for predicting body weight, with prediction errors mainly centered on less than 50 g.
- Body weight monitoring methods based on audio analysis. For example, Aydin et al. [10] conducted a study to determine the feed intake of chickens by detecting the birds’ pecks and comparing them with feed intake measured by a weighing system. They discovered a linear correlation between the number of pecks and feed intake, with 93% of pecks being accurately identified. Fontana et al. [11] developed a tool that can automatically detect the growth status of broiler chickens at varying ages based on the frequency of calls emitted by the chickens. The results of the statistical analysis showed a significant correlation between the age and weight of the chickens and the maximum power frequency (PF) emitted in their calls. Fontana et al. [12] applied SAS 9.3 software programs, including PROC TTEST, PROC CORR, and PROC REG, to perform regression analyses and statistical tests. Statistical and regression analyses indicated a notable correlation between the sound frequency, age, and body weight of broilers. Fontana et al. [13] conducted a study on the use of sound analysis to predict the body weight of broilers and found a considerable correlation between age and body weight. Incidentally, they established that frequency analyses of chickens’ crowing may be disrupted by filters and ambient noise during the final stages of broiler growth. The study revealed that filters and environmental noise during the final stages of broiler growth may interfere with the frequency analysis of chicken calls. Abdel-Kafy et al. [14] utilized statistical analysis software and regression modeling to predict the body weight of turkeys by recording their vocalizations and corresponding body weights. The results demonstrated a decrease in the frequency of vocalizations with age.
- Direct predictive modeling based on other sensor data (nutritional intake, ventilation, temperature, humidity, etc.) or weight data. For example, Johansena et al. [15] proposed a research methodology to predict broiler weight utilizing a dynamic neural network model. The model was trained using an LM optimization algorithm, with input variables selected based on mutual information. Additionally, kernel density estimation was employed to estimate the joint probability density function. The system achieved an average root-mean-square error of prediction of 66.8 g. Lee et al. [16] developed an automated chicken weighing system composed of weighing scales and workstations. The weighing scale was built using an aluminum plate and a 5 kg load cell, and weight data were transmitted wirelessly to the workstation via a transmission module. The workstation collects data every 15 s and compares the average weight per day with a reference value to monitor the growth and development of the chickens. Weihong Ma et al. [17] introduced an effective method for extracting values using dynamic weighing. Their approach involves an improved amplitude-limited filtering algorithm and a BP neural network model to analyze data such as age, daily weight gain, average speed, and preprocessed weight values. The weighing error was reduced from 6% to less than 3% through a data-driven framework proposed by Chunyao Wang et al. [18] This framework employs Gaussian mixture modeling, self-sampling, and weighted averaging techniques to enhance the accuracy of monitoring and predicting live chicken weights. Birzniece et al. [19] suggested utilizing a long short-term memory (LSTM) artificial neural network for broiler weight prediction, based on environmental factors including temperature, gas concentration, humidity, broiler weight, and feed consumption.
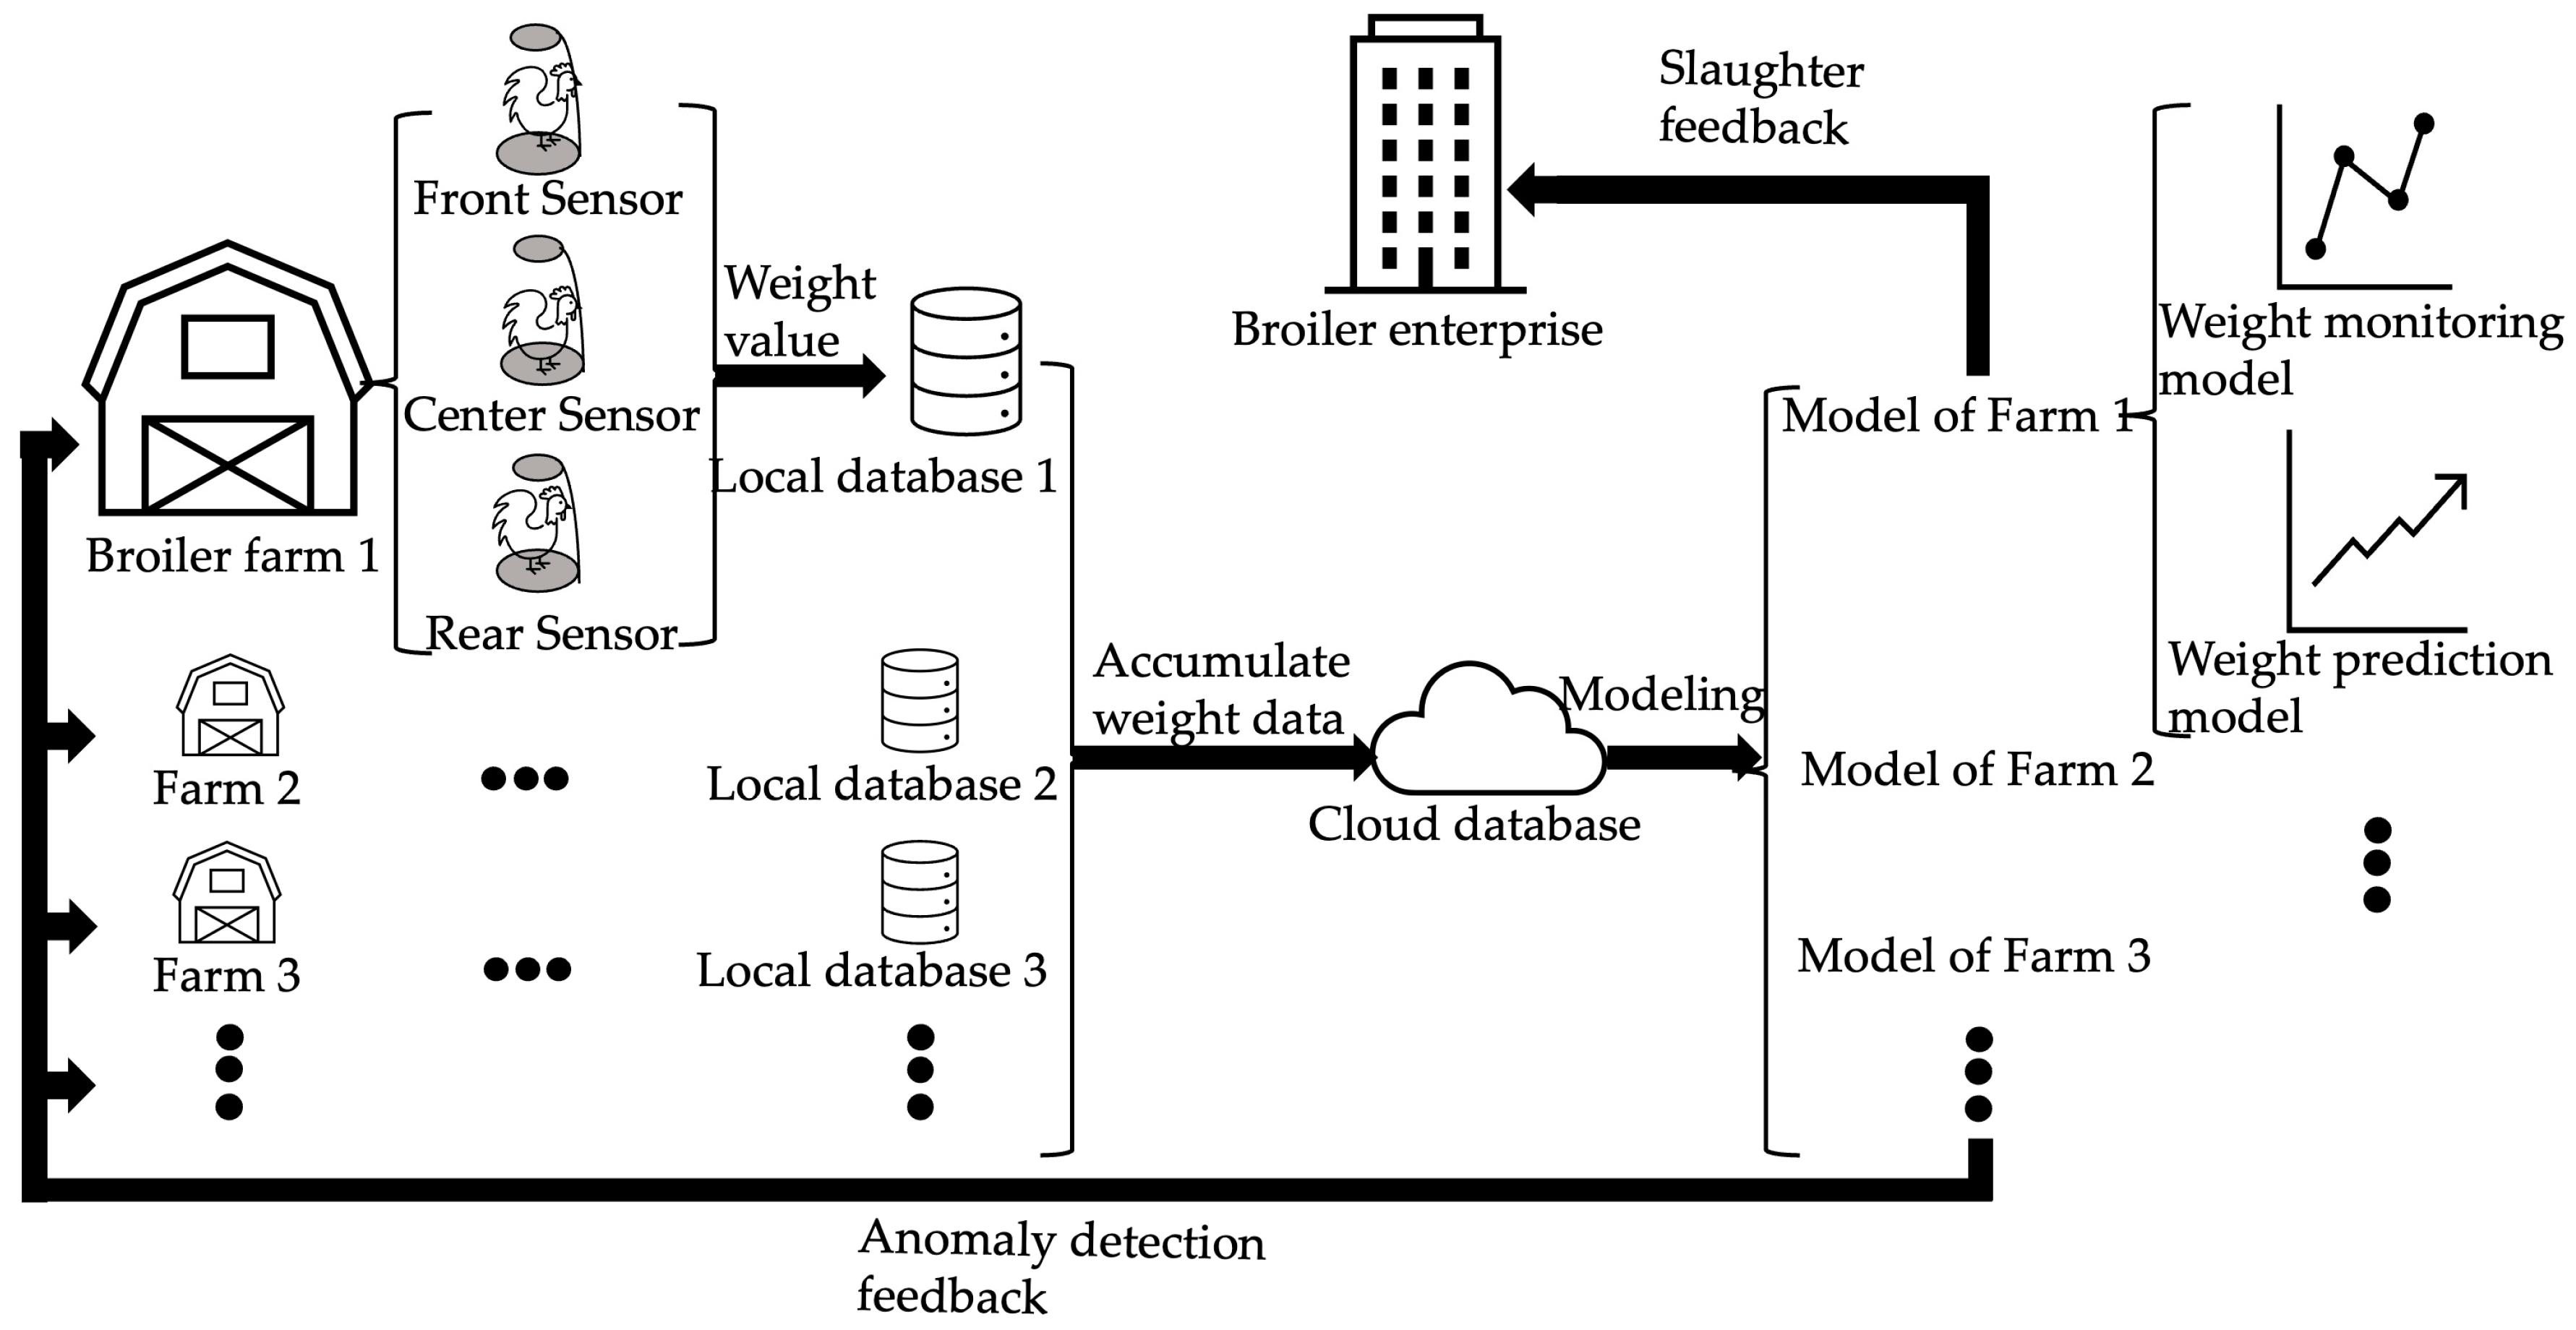
2. Materials and Methods
2.1. Broiler Sample and Live Weight Data Collection
2.2. Data Preparation and Preprocessing
2.2.1. Critical-Value-Based Data Processing for Noise Reduction
2.2.2. MissForest-Based Approach to Null-Filling
2.3. Time Interval Segmentation and Average Weight Calculation
2.3.1. Segmentation and Gaussian-Mixture-Model-Based Data Modeling
2.3.2. Isolation-Forest-Based Outlier Sieving
2.3.3. Average- and OPTICS-Based Multiple Clustering
2.4. Adaptive Forecasting Combining Multinomial Regression with Gray Models
2.4.1. Multinomial-Regression-Based Medium- and Long-Term Forecasting
2.4.2. Gray-Model-Based Short-Term Forecasting
3. Results and Discussion
3.1. Results of Data Pre-Processing
3.2. Analysis of Data Preprocessing
3.3. Results of the Calculation of the Average Live Weight of Individual Broilers
3.4. Analysis of the Calculation of the Average Live Weight of Individual Broilers
3.5. Results of the Prediction of the Average Live Weight of Individual Broilers
3.6. Analysis of the Prediction of the Average Live Weight of Individual Broilers
4. Conclusions
Author Contributions
Funding
Institutional Review Board Statement
Informed Consent Statement
Data Availability Statement
Acknowledgments
Conflicts of Interest
References
- Topal, M.; Bolukbasi, Ş.C. Comparison of Nonlinear Growth Curve Models in Broiler Chickens. J. Appl. Anim. Res. 2008, 34, 149–152. [Google Scholar] [CrossRef]
- Moharrery, A.; Mirzaei, M. Growth Characteristics of Commercial Broiler and Native Chickens as Predicted by Different Growth Functions. J. Anim. Feed Sci. 2014, 23, 82–89. [Google Scholar] [CrossRef][Green Version]
- Rizzi, C.; Contiero, B.; Cassandro, M. Growth Patterns of Italian Local Chicken Populations. Poult. Sci. 2013, 92, 2226–2235. [Google Scholar] [CrossRef] [PubMed]
- Mouffok, C.E.; Semara, L.; Belkasmi, F. Comparison of Some Nonlinear Functions for Describing Broiler Growth Curves of Cobb500 Strain. Poult. Sci. J. 2019, 7, 51–61. [Google Scholar]
- De Wet, L.; Vranken, E.; Chedad, A.; Aerts, J.-M.; Ceunen, J.; Berckmans, D. Computer-Assisted Image Analysis to Quantify Daily Growth Rates of Broiler Chickens. Br. Poult. Sci. 2003, 44, 524–532. [Google Scholar] [CrossRef]
- Chedad, A.; Aerts, J.-M.; Vranken, E.; Lippens, M.; Zoons, J.; Berckmans, D. Do Heavy Broiler Chickens Visit Automatic Weighing Systems Less than Lighter Birds? Br. Poult. Sci. 2003, 44, 663–668. [Google Scholar] [CrossRef] [PubMed]
- Mollah, M.B.R.; Hasan, M.A.; Salam, M.A.; Ali, M.A. Digital Image Analysis to Estimate the Live Weight of Broiler. Comput. Electron. Agric. 2010, 72, 48–52. [Google Scholar] [CrossRef]
- Mortensen, A.K.; Lisouski, P.; Ahrendt, P. Weight Prediction of Broiler Chickens Using 3D Computer Vision. Comput. Electron. Agric. 2016, 123, 319–326. [Google Scholar] [CrossRef]
- Amraei, S.; Abdanan Mehdizadeh, S.; Salari, S. Broiler Weight Estimation Based on Machine Vision and Artificial Neural Network. Br. Poult. Sci. 2017, 58, 200–205. [Google Scholar] [CrossRef]
- Aydin, A.; Bahr, C.; Viazzi, S.; Exadaktylos, V.; Buyse, J.; Berckmans, D. A Novel Method to Automatically Measure the Feed Intake of Broiler Chickens by Sound Technology. Comput. Electron. Agric. 2014, 101, 17–23. [Google Scholar] [CrossRef]
- Fontana, I.; Tullo, E.; Peña Fernández, A.; Berckmans, D.; Koenders, E.; Vranken, E.; Mckinstry, J.; Butterworth, A.; Guarino, M. Frequency Analysis of Vocalisation in Relation to Growth in Broiler Chicken. Precis. Livest. Farming 2015, 15, 174–182. [Google Scholar]
- Fontana, I.; Tullo, E.; Butterworth, A.; Guarino, M. An Innovative Approach to Predict the Growth in Intensive Poultry Farming. Comput. Electron. Agric. 2015, 119, 178–183. [Google Scholar] [CrossRef]
- Fontana, I.; Tullo, E.; Carpentier, L.; Berckmans, D.; Butterworth, A.; Vranken, E.; Norton, T.; Berckmans, D.; Guarino, M. Sound Analysis to Model Weight of Broiler Chickens. Poult. Sci. 2017, 96, 3938–3943. [Google Scholar] [CrossRef] [PubMed]
- Abdel-Kafy, E.-S.M.; Ibraheim, S.E.; Finzi, A.; Youssef, S.F.; Behiry, F.M.; Provolo, G. Sound Analysis to Predict the Growth of Turkeys. Animals 2020, 10, 866. [Google Scholar] [CrossRef]
- Johansen, S.V.; Bendtsen, J.D.; Jensen, M.R.; Mogensen, J. Broiler Weight Forecasting Using Dynamic Neural Network Models with Input Variable Selection. Comput. Electron. Agric. 2019, 159, 97–109. [Google Scholar] [CrossRef]
- Lee, C.C.; Adom, A.H.; Markom, M.A.; Tan, E.S.M.M. Automated Chicken Weighing System Using Wireless Sensor Network for Poultry Farmers. IOP Conf. Ser. Mater. Sci. Eng. 2019, 557, 012017. [Google Scholar] [CrossRef]
- Ma, W.; Li, Q.; Li, J.; Ding, L.; Yu, Q. A Method for Weighing Broiler Chickens Using Improved Amplitude-Limiting Filtering Algorithm and BP Neural Networks. Inf. Process. Agric. 2021, 8, 299–309. [Google Scholar] [CrossRef]
- Wang, C.-Y.; Chen, Y.-J.; Chien, C.-F. Industry 3.5 to Empower Smart Production for Poultry Farming and an Empirical Study for Broiler Live Weight Prediction. Comput. Ind. Eng. 2021, 151, 106931. [Google Scholar] [CrossRef]
- Birzniece, I.; Andersone, I.; Nikitenko, A.; Balina, S.; Kikans, A. Time Series Forecast Model Application for Broiler Weight Prediction Using Environmental Factors. In Proceedings of the 2022 International Conference on Electrical, Computer, Communications and Mechatronics Engineering (ICECCME), Maldives, 16–18 November 2022; pp. 1–7. [Google Scholar]
- Stekhoven, D.J.; Bühlmann, P. MissForest—Nonparametric Missing Value Imputation for Mixed-Type Data. Bioinformatics 2012, 28, 112–118. [Google Scholar] [CrossRef]
- Dempster, A.P.; Laird, N.M.; Rubin, D.B. Maximum Likelihood from Incomplete Data Via the EM Algorithm. J. R. Stat. Soc. Ser. B Methodol. 1977, 39, 1–22. [Google Scholar] [CrossRef]
- Liu, F.T.; Ting, K.M.; Zhou, Z.-H. Isolation Forest. In Proceedings of the 2008 Eighth IEEE International Conference on Data Mining, Pisa, Italy, 15–19 December 2008; pp. 413–422. [Google Scholar]
- Ankerst, M.; Breunig, M.M.; Kriegel, H.-P. OPTICS: Ordering Points to Identify the Clustering Structure. ACM Sigmod Rec. 1999, 28, 49–60. [Google Scholar] [CrossRef]
- Stigler, S.M. Gergonne’s 1815 Paper on the Design and Analysis of Polynomial Regression Experiments. Hist. Math. 1974, 1, 431–439. [Google Scholar] [CrossRef]
- Golub, G.H.; Loan, C.F.V. An Analysis of the Total Least Squares Problem. SIAM J. Numer. Anal. 1980, 17, 883–893. [Google Scholar] [CrossRef]
- Deng, J. Control Problems of Grey System, Systems and Control Letters. Syst. Control Lett. 1982, 1, 288–294. [Google Scholar]
- Dong, X.; Zhang, S. Impact Factor Dynamic Forecasting Model for Management Science Journals Based on Grey System Theory. Open J. Soc. Sci. 2015, 3, 22–25. [Google Scholar] [CrossRef][Green Version]


| Related Research | Author | Methods | Specifications | Evaluation Metrics and Error | Main Conclusions | |
|---|---|---|---|---|---|---|
| Research Approach | ||||||
| Growth patterns and function fitting | M. Topall, S.C. Bolukbasi et al. [1] | Nonlinear regression to estimate the parameters of different growth curve models in broiler chickens; 96 broiler chickens were weighed weekly from birth to 42 days of age. | Compared the predictive performance of different growth curve models, namely, Gompertz, logistic, Bertalanffy, Morgan–Mercer–Flodin (MMF), and Weibull. | The top performing MMF, Weibull, and Gompertz models had MAPE values of 0.0381, 0.0391, and 0.0385, respectively. | MMF, Weibull, and Gompertz models performed better compared to logistic and von Bertalanffy models. | |
| A. Moharrery and M. Mirzaei et al. [2] | Used nonlinear functions to describe the growth characteristics of commercial broiler and native chickens. Statistical procedures were used to analyze the data. | Compared the fitting performance of different equations: logistic, Gompertz, Richards, and Weibull. | The most successful Richards equation exhibited adjusted determination coefficient (R2) values of 99.51% for the commercial strain and 99.12% for native chickens. | The Richards function provided the best fit. Commercial birds grew faster and reached a higher final weight than native chickens. | ||
| C. Rizzi, B. Contiero, and M. Cassandro et al. [3] | Compared the growth of an Italian commercial hybrid (Berlanda) and a local Italian breed called Padovana (in two color varieties) and their crosses. The birds were reared from 1 day to 180 days of age in an environmentally controlled breeder house. | Male and female chicks from five different genotypes were used to compare growth patterns using linear, logistic, Gompertz, and Richards growth models. | The most successful Gompertz and Richards growth models exhibit adjusted determination coefficient (R2) values of 99.51% for the commercial strain and 99.12% for native chickens. | The growth rates of the studied genotypes were lower than those of the commercial hybrids. The Gompertz and Richards growth models gave better estimates of weight parameters than the logistic model. | ||
| Charef Eddine Mouffok, Semara L, and Farida Belkasmi et al. [4] | Describes the retrospective analysis of 50 broiler chicks and their division into three weight classes: light, middle, and heavy. Highlights the use of goodness-of-fit criteria to evaluate the accuracy of the models. | Discusses the comparison of six mathematical models: Gompertz, Richards, logistic, Weibull, von Bertalanffy, and exponential. | The total determination coefficient (R2) values of the Gompertz, logistic, von Bertalanffy, and WLS models at the three weight classes were all 0.954. | Concludes that the Gompertz model is the most suitable for describing the growth curve up to four weeks of age, while the logistic, von Bertalanffy, and WLS models accurately describe the growth curve after one month of age. | ||
| Image processing and computer vision | Lourens de Wet, Erik Vranken, Jean-Marie Aerts, and Daniel Berckmans et al. [5] | Use of commercial software to analyze captured images and determine body size based on surface area and peripheral pixel count. Nonlinear regression analysis was used to determine the relationship between body weight and image characteristics. | Used digital image processing techniques to estimate the live weight of broiler chickens and discussed the challenges and limitations of image analysis, such as variations in lighting, animal movement, occlusion, and background clutter. | The body weight of the chickens was estimated with an average relative error of about 11% from the image surface and 16% from the image periphery. | Suggested the possibility of using image sequences for behavioral characterization and real-time observation systems. | |
| Erik Vranken, Jean-Marie Aerts, and Daniel Berckmans et al. [6] | Individual broiler chickens’ weights are determined by analyzing their two-dimensional surface area (top view) under optimal lighting, with the integration of the Otsu adaptive threshold algorithm enhancing the system’s ability to distinguish between individual birds and the background. | Study conducted using three broiler houses to compare automatically recorded body weights with manually recorded body weights on days 36 and 42. | Automatically obtained body weights were comparable to manual recordings on day 36 in both House I (1445 ± 15 g vs. 1477 ± 20 g) and House II (2124 ± 27 g vs. 2142 ± 20 g), but on day 42 the automatic system underestimated the weights for House I (1839 ± 30 g vs. 2140 ± 25 g) and House II (2430 ± 18 g vs. 2555 ± 35 g). | The notion that bigger animals utilized the weighing equipment less frequently was confirmed. For example, statistical disparities in the area of broilers on and near the weighing system might be proven during week 5. | ||
| Md. Bazlur, R. Mollah, Md. A. Hasan, Md. A. Salam, and Md. A. Ali et al. [7] | Digital image analysis using raster image analysis software (IDRISI 32) to capture digital images of broilers. Determined broilers’ body surface area from the images and developed a linear equation to estimate broilers’ weight based on surface area pixels. | Reared 100 Arbor Acres broiler chicks under standard rearing conditions and captured 1200 digital images from 20 randomly selected broilers during the 7–42 day growing period for analysis. | Relative error in weight estimation of broiler chickens by image analysis: 0.04% to 16.47%. The overall value of the determination coefficient (R2) of the final linear equation was 0.999. | Although the precision of live weight estimation depends on many factors, the presented data indicate that the development of a practical imaging system for weighing broiler is feasible. | ||
| Anders Krogh Mortensen, Pavel Lisouski, Peter Ahrendt et al. [8] | Use of a low-cost 3D camera (Kinect) with its own infrared light source and image processing algorithm, along with a range-based watershed algorithm for segmentation, extraction of weight descriptors, and weight prediction using a Bayesian artificial neural network, and the comparison and evaluation of four other models for weight prediction. | Using a commercial broiler house of 48,000 broilers (Ross 308) during the last 20 days of the breeding period and a test set of 83 broilers, manually annotated images, and a traditional platform scale for reference weights to explore the different 1D, 2D and 3D features for weight prediction. | A relative mean error of 7.8% was achieved on a separate test set, and the range of absolute errors was 20–100 g in the first half of the period and 50–250 g in the last half. Larger errors were observed at the end of the rearing period as the broiler density increased. | The system shows promise as a non-intrusive, robust solution for weighing broilers in commercial production environments, with potential for additional applications. | ||
| S. Amraei, S. A. Mehdizadeh and S. Salari et al. [9] | Machine vision technology was used to extract six features from the captured image features: area, perimeter, convex area, major axis length, minor axis length, and eccentricity. Then, a variety of artificial neural network techniques were used (gradient descent algorithm, scaling conjugate gradient algorithm, Levenberg–Marquardt algorithm, Bayesian fitting algorithm, etc.) to predict the live weight of broilers. | Live weight estimation was performed on 30 one-day-old broiler chickens reared for 42 days and imaged twice a day. | Bayesian regression with an R2 value of 0.98 was the best network for predicting broiler weight, and its root-mean-square error (RMSE) value was 82.37. | The five remaining features (area, perimeter, convex area, major and minor axis length) showed a strong relationship with body weight. Computer vision systems provide a valuable alternative to manual weighing. | ||
| Audio processing and correlation exploration | A. Aydin, C. Bahr, S. Viazzi, V. Exadaktylos, J. Buyse, D. Berckmans et al. [10] | Sound recordings using a microphone attached to the feeding pen. Each hen was deprived of food for four hours before the experiment. Feed intake was automatically recorded using a weighing system, and feed wastage was manually collected and weighed. The results of the algorithm were compared with reference feed intake values obtained by weighing and video observation. | Twelve individual 28-day-old male broiler chickens (Ross-308) were used. Pecking sounds were recorded for 15 min during each trial. A total of 36 trials were performed, with three laboratory trials per broiler. | The algorithm correctly identified 93% of pecking sounds but had a false positive rate of 7%. The coefficient of determination (R2) between the number of pecks and the feed uptake was 0.995. The coefficient of determination (R2) between the feed intake and the number of pecks (pecking frequency) was 0.985. | Provided a non-invasive and automated method to measure feed intake in broiler chickens. The real-time data provided by this algorithm have potential applications in the study of broilers’ feeding behavior and welfare. | |
| Ilaria Fontana, Emanuela Tullo, Alberto Peña Fernández and Daniel Berckmans et al. [11] | Precision livestock farming (PLF) technologies were used to monitor the welfare and health status of broilers. Sound recordings were made at regular intervals throughout the broiler production cycle, and the sound data were compared with the weight of the birds, which was automatically measured using a ‘step-on scale’ placed on the floor of the broiler house. Regression analysis, t-tests, and correlation analysis were used to evaluate the relationship between PF, age, and bird weight. | Data collection on two farms: one in the UK and one in the Netherlands. Only 18 h of sound recordings from specific days was used for analysis, together with the bird weights collected on those days. Fast Fourier transform (FFT) was used for frequency analysis. | A t-test of the expected values and the observed ones resulted in a p-value of 0.8807. The correlation between the weight and age of the broilers was highly positive (0.97, p-value < 0.001). The correlation between the PF of the sounds and the age of the broilers was −0.96. The correlation between the PF and the weight was −0.92 (p-value < 0.001). | As broilers grow older and gain weight, the PF of their vocalizations decreases. Individual vocalizations and the whole audio file can be considered equivalent for PF analysis. These results have potential for the development of a weight prediction algorithm based on sound analysis in broiler production. | ||
| Ilaria Fontana, Emanuela Tullo, Andy Butterworth and Marcella Guarino et al. [12] | Used precision livestock farming (PLF) techniques to combine audio and video information for automated monitoring of broiler chickens. PROC TTEST, PROC CORR, and PROC REG were used to compare the peak frequencies (PFs) recorded in two trials, and to examine the correlation between the PF, age, and weight of chickens. The GLM procedure was used to estimate the effects influencing PF. The LSMEANS analysis was used to analyze the variation in PF with the age of the broilers. | Sound recordings were made at regular intervals throughout the life of the birds over a period of 38 days. A total of 55 h and 20 min of recordings was collected, and 600 birds were weighed; a total of 600 sounds (50 sounds per day), randomly selected from 12 days of recordings, were manually labeled and analyzed. | There was a strong positive correlation (0.97, p-value < 0.001) between the weight and age of the broilers, and a strong negative correlation (0.95, p-value < 0.001) between the PF of the sounds and the age of the broilers. There was a significant negative correlation (0.80; p-value < 0.001) between the frequency of the vocalizations and the weight of the broilers. | A strong positive correlation was observed between weight and age. PF showed significant negative correlations with both age and weight. PF could be used as an early warning or continuous monitoring system to assess the health and status of broiler chickens. | ||
| Ilaria Fontana, Emanuela Tullo, Lenn Carpentier, Dries Berckmans, Andy Butterworth, Erik Vranken, Tomas Norton, Daniel Berckmans, and Marcella Guarino et al. [13] | Sound analysis techniques were used to measure and analyze the frequency of broiler vocalizations. Peak frequencies (PFs) of vocalizations were manually processed to remove outliers and exclude sounds collected during dark periods with background noise. A polynomial regression model was estimated using PFs and weight data collected for each production cycle to predict weight. | Sounds and body weight were continuously recorded throughout the cycles. The chosen frequency interval was 1100 Hz to 3700 Hz. A final dataset was created by merging data from rounds 1 to 8. Data from laps 1 to 5 were used to predict weight. | The correlation coefficient between the expected and observed weights was high and positive (R2 = 0.96, p value ≤ 0.001). The regression model between the expected and observed weights was highly significant (R2 = 0.93, p value ≤ 0.001). | The identified model for predicting weight as a function of peak frequency confirmed that birds’ weight could be predicted by frequency analysis of sounds emitted at the farm level. | ||
| El-Sayed M. Abdel-Kafy, Samya E. Ibraheim, Alberto Finzi, Sabbah F. Youssef, Fatma M. Behiry, and Giorgio Provolo et al. [14] | SAS 9.3 software was used to estimate the relationships between age, weight, and PF. Regression models were developed to predict weight and PF from age and weight from PF. Pooled data were analyzed using ANOVA to test for differences between age, weight, and PF variables. Regression models based on pooled data were used to predict weight and PFs. | Four trials were conducted in Egypt to record sounds and weights of turkeys during an 11-day growth period. A total of 2200 sounds were manually analyzed and labeled using peak frequency (PF). | The correlation coefficient between turkeys’ weight and age was high and positive (R2 = 0.96, p < 0.0001). The correlation coefficient between the PF of turkey vocalizations and their age was high and negative (R2 = 0.97, p < 0.001). The correlation coefficient between the PF of the vocalizations and the weight of the turkeys was high and negative (R2 = 0.97, p < 0.001). The RMSE values during calibration and validation differed by 5.1%. | Audio monitoring provides a non-contact method of monitoring turkeys’ growth, eliminating manual handling. Potentially useful for farmers to automate turkey growth monitoring. | ||
| Direct live weight prediction for broilers using other sensors | Simon V. Johansen, Jan D. Bendtsen, Martin R.-Jensen, and Jesper Mogensen et al. [15] | Dynamic neural network (DNN) model with input variable selection (IVS). Mutual information-based input variable selection using kernel density estimation (KDE). DNN model training using the Levenberg–Marquardt optimization algorithm and cross-validation. Used ensemble predictions generated by training multiple sub-models with different initial weights. Calculation of prediction evaluation metrics such as root-mean-square error (RMSE). | Data collected from a broiler house over a period of 3 years and 4 months, consisting of 29 batches. Inputs to the model: environmental variables (i.e., temperature, humidity, light intensity, ventilation demand, heating demand). Outputs: broiler behavior indicators (i.e., weight, feed consumption, water consumption). | Mean forecasting RMSE of 66.8 g. | The dynamic influence of environmental conditions on broiler growth was found to be significant, showing the potential usefulness of the method in industry and as a basis for future research on broiler production optimization. | |
| C.C. Lee, A.H. Adom, M.A. Markom and E.S.M.M. Tan et al. [16] | The automated chicken weighing system uses a wireless sensor network (WSN) for data transmission. The system includes rugged aluminum plate scales and 5 kg load cells. The weight data are transmitted to a workstation via a wireless transceiver module. | The scales were designed to accurately measure the weight of the chickens. They were made of aluminum plates and equipped with 5 kg load cells to ensure robustness and accuracy, and they were placed inside the three pens for 38 days to record and monitor the development of the chickens from day to day. | From day 1 to day 12, the hens’ development rate was as planned. However, beginning on day 13, the development rate of the hens was 3.38% to 12.21% slower than projected, causing the animals to take 40–42 days to reach 1.8 kg. | The successful development of an automated chicken weighing system using a wireless sensor network (WSN) capable of collecting real-time weight data from broiler chickens. | ||
| Weihong Ma, Qifeng Li, Jiawei Li, Luyu Ding and Qinyang Yu et al. [17] | A sliding window technique was used to create a low-pass filter with continually updated samples. Valid data were extracted via dynamic weighing, which entails analyzing weight values, applying amplitude-limiting filtering, recording stable values, and comparing differences within an error range. Finally, the modeling and implementation of BP (backpropagation) neural networks using age (days), daily weight increase, average speed, and preprocessed weight as input variables. | Thirteen groups of Beijing fatty chickens ranging in weight from 500 to 1800 g were tested. Data were obtained from 200 of the 2000 sets. Three distinct weighing methods were used: no filtering algorithm or BP neural networks, just an enhanced amplitude-limiting filtering algorithm, and a hybrid of an improved amplitude-limiting filtering algorithm and BP neural networks. | The hybrid method decreased error from 6% (no filtering algorithm or BP neural networks) to less than 3%. | The hybrid technique of the increased amplitude-limiting filter algorithm and BP neural networks performed better in terms of minimizing error in weighing broiler chicks. It outperformed the other methods examined by lowering the error to less than 3%. | ||
| Chun-Yao Wang, Ying-Jen Chen, and Chen-Fu Chien et al. [18] | Proposed a data-driven framework for weight monitoring and prediction in the broiler industry. The weight monitoring module estimates live broiler body weight using a Gaussian mixture model (GMM). It employs a bootstrap resampling approach to decrease cluster noise, identify outliers, and compute the cluster-weighted mean as a single individual average weight. To model broiler growth and anticipate future weight, the weight prediction module employs mathematical growth functions, notably the Gompertz function. The cumulative mean absolute percentage error (Cu-MAPE) is used as a model fit indicator. | Empirical studies were carried out in six broiler farms to validate the proposed approach. For each batch, the estimated value was compared with manual weighing on four reference days, i.e., day 14, day 21, day 28, and the day of delivery. | For batch 165–1, the error on day 28 was greater than 8%; for batch 165–2, the error on day 21 was 7.55%, while that on day 28 was 11.2%; for batch 165–4, the error on day 14 was the highest of all, at about 16.34%; for batch 165–9, the error on day 14 was 5.2%, while that on day 21 was 7.75%. As regards the error on the day of delivery, several batches had an error of less than 3%, with some of them even less than 1%. | The proposed data-driven framework for weight monitoring and prediction in the broiler industry was successfully implemented and validated. The study demonstrated the practicality of the approach and highlighted the potential for Industry 3.5 solutions in the agricultural sector. | ||
| Ilze Birzniece, Signe Balina, Ilze Andersone, Andris Kikans, and Agris Nikitenko et al. [19] | Data from numerous production cycles, including environmental indicators and poultry growth data, were collected for the study. Data were preprocessed to account for mistakes and missing values. To enhance the sample size for broiler weight data, augmentation procedures were applied. The forecasting model’s accuracy was assessed by comparing it to the Gompertz model. Long short-term memory (LSTM) artificial neural networks were used to build the forecasting model. | Data on broiler raising were obtained for three independent rooms that had sensor systems installed. In each room, mixed-sex flocks of Ross 308 AP95 broilers were housed. The dataset contained manually gathered data, such as breeders’ notes on the number of broilers, age, feeding, and weight, along with sensor data such as temperature, humidity, carbon dioxide (CO2) levels, ammonium (NH3) levels, and so on. | The results obtained were evaluated at three different durations of the prediction step—1, 3, and 6 days. The highest accuracy was found for the 3-day forecast horizon, with an RMSE value of 0.295. | The LSTM model can effectively predict broiler weight in poultry production, considering relevant environmental factors. The research and development work demonstrates the potential of machine learning techniques to improve production quality and profitability in the poultry industry. | ||
Disclaimer/Publisher’s Note: The statements, opinions and data contained in all publications are solely those of the individual author(s) and contributor(s) and not of MDPI and/or the editor(s). MDPI and/or the editor(s) disclaim responsibility for any injury to people or property resulting from any ideas, methods, instructions or products referred to in the content. |
© 2023 by the authors. Licensee MDPI, Basel, Switzerland. This article is an open access article distributed under the terms and conditions of the Creative Commons Attribution (CC BY) license (https://creativecommons.org/licenses/by/4.0/).
Share and Cite
Lyu, P.; Min, J.; Song, J. Application of Machine Learning Algorithms for On-Farm Monitoring and Prediction of Broilers’ Live Weight: A Quantitative Study Based on Body Weight Data. Agriculture 2023, 13, 2193. https://doi.org/10.3390/agriculture13122193
Lyu P, Min J, Song J. Application of Machine Learning Algorithms for On-Farm Monitoring and Prediction of Broilers’ Live Weight: A Quantitative Study Based on Body Weight Data. Agriculture. 2023; 13(12):2193. https://doi.org/10.3390/agriculture13122193
Chicago/Turabian StyleLyu, Peng, Jeongik Min, and Juwhan Song. 2023. "Application of Machine Learning Algorithms for On-Farm Monitoring and Prediction of Broilers’ Live Weight: A Quantitative Study Based on Body Weight Data" Agriculture 13, no. 12: 2193. https://doi.org/10.3390/agriculture13122193
APA StyleLyu, P., Min, J., & Song, J. (2023). Application of Machine Learning Algorithms for On-Farm Monitoring and Prediction of Broilers’ Live Weight: A Quantitative Study Based on Body Weight Data. Agriculture, 13(12), 2193. https://doi.org/10.3390/agriculture13122193