Article

Winter Wheat Yield Estimation Based on Multi-Temporal and Multi-Sensor Remote Sensing Data Fusion

1
Key Laboratory of Agricultural Equipment Technology, Chinese Academy of Agricultural Mechanization Sciences Group Company Limited, Beijing 100083, China
2
School of Electromechanical and Vehicle Engineering, Weifang University, Weifang 261061, China
*
Author to whom correspondence should be addressed.
Agriculture 2023, 13(12), 2190; https://doi.org/10.3390/agriculture13122190
Submission received: 28 September 2023 / Revised: 9 November 2023 / Accepted: 9 November 2023 / Published: 23 November 2023
(This article belongs to the Special Issue Application of Machine Learning and Data Analysis in Agriculture)

Abstract

:
Accurate yield estimation before the wheat harvest is very important for precision management, maintaining grain market stability, and ensuring national food security. In this study, to further improve the accuracy of winter wheat yield estimation, machine learning models, including GPR, SVR, and DT, were employed to construct yield estimation models based on the single and multiple growth periods, incorporating the color and multispectral vegetation indexes. The results showed the following: (1) Overall, the performance and accuracy of the yield estimation models based on machine learning were ranked as follows: GPR, SVR, DT. (2) The combination of color indexes and multispectral vegetation indexes effectively improved the yield estimation accuracy of winter wheat compared with the multispectral vegetation indexes and color indexes alone. The accuracy of the yield estimation models based on the multiple growth periods was also higher than that of the single growth period models. The model with multiple growth periods and multiple characteristics had the highest accuracy, with an R2 of 0.83, an RMSE of 297.70 kg/hm2, and an rRMSE of 4.69%. (3) For the single growth period, the accuracy of the yield estimation models based on the color indexes was lower than that of the yield estimation models based on the multispectral vegetation indexes. For the multiple growth periods, the accuracy of the models constructed by the two types of indexes was very close, with R2 of 0.80 and 0.80, RMSE of 330.37 kg/hm2 and 328.95 kg/hm2, and rRMSE of 5.21% and 5.19%, respectively. This indicates that the low-cost RGB camera has good potential for crop yield estimation. Multi-temporal and multi-sensor remote sensing data fusion can further improve the accuracy of winter wheat yield estimation and provide methods and references for winter wheat yield estimation.

1. Introduction

Accurate yield estimation prior to the maturity of the wheat harvest is important for precision management, maintaining the stability of the grain market, and ensuring national food security. Micro unmanned aerial vehicles (UAVs) are UAVs that are less than 15 cm in size, have an endurance of 20 min to 2 h, and can carry a day/night camera. With the development of supporting technologies, micro unmanned aerial vehicles have exhibited improved maneuverability and decreased costs, offering advantages such as superior coverage compared with ground machinery for single remote sensing image acquisition. These UAVs possess high spatiotemporal resolution and efficiency [1]. Consequently, in recent years, the application scope of low-altitude remote sensing data acquisition techniques based on micro UAVs in the agricultural sector has gradually expanded, becoming one of the primary methods for the rapid acquisition of crop information in agricultural fields [2]. These technologies have been widely used for crop growth monitoring and yield estimation [3,4,5,6,7].
Typically, simple regression equations are used to estimate crop nitrogen content and yield [8]. One approach is to directly use remote sensing bands as independent variables, employing single or multiple bands as model driving factors to establish estimation models for nitrogen content and yield. This method was applied in the earlier stages of remote sensing applications. Another approach involves combining remote sensing bands into various forms of indexes, often formed by combining two bands. These indexes are used to create simple empirical models for estimating nitrogen content and yield and have become the primary method for estimating crop information [9]. Plant type, moisture content, and canopy characteristics have different effects on the reflected light in each spectral band [1]. Researchers from both domestic and international studies have conducted extensive research and have summarized various vegetation indexes and color indexes that exhibit strong correlations with crop nitrogen content and yield. Based on the UAV remote sensing platform, the use of resolved images to obtain vegetation indexes and the combination of machine learning algorithms can provide efficient and effective large-area yield estimation of crops to overcome the shortcomings of traditional methods. The literature [10,11] utilized UAVs carrying various sensors to construct yield estimation models based on different algorithms, and the machine learning algorithms improved the accuracy of yield estimation compared with the traditional regression methods. Machine learning has the capability to handle multi-source and multi-type data, including multi-type remote sensing images, weather data, soil data, crop data, irrigation data, and fertilization data [12,13]. It can also process a large number of variables and often exhibits robust performance when studying agricultural features through image analysis, making it a valuable tool in yield prediction and crop growth monitoring [13,14]. Presently, some studies have successfully employed machine learning for winter wheat yield estimation based on multi-sensor data fusion, such as combining color and texture features [15,16,17], as well as color, texture, and spectral features [18], all of which have yielded promising results. For instance, Song et al. [18] used machine learning to combine data from multispectral sensors and RGB cameras to estimate wheat yield at the filling stage. Their results demonstrated that the fusion of multi-source data could effectively enhance the accuracy of wheat yield estimation compared with the models based solely on single sensor data. Utilizing remote sensing information from multiple growth periods of crops for yield estimation can reflect crop growth dynamics and provide more useful information, subsequently improving yield estimation accuracy. Research by Cheng et al. [19] found that machine learning models built for multiple growth periods of winter wheat outperformed those constructed solely for a single growth period in terms of yield estimation accuracy. Han et al. [20] utilized vegetation indexes from multiple growth periods of maize for yield estimation, achieving higher accuracy compared with the yield estimation models based on the single growth period. Zhou et al. [21] constructed the rice yield estimation models based on visible color indexes and multispectral vegetation indexes for multiple growth periods, respectively, and the accuracy was higher than that in a single growth period. All the above studies estimated yields for multiple growth periods or multi-source data. The review of the literature [22,23] shows that the influence of multi-source data fusion with large areas and multiple time windows on winter wheat yield estimation has been studied and the importance of each prediction variable has been analyzed. Bian et al. [24] investigated the effect of color indexes and multispectral vegetation indexes on the yield estimation at five key growth stages of winter wheat at field scale and, finally, chose the color indexes, multispectral vegetation indexes, and growth periods that have a strong correlation with yield, ignoring the effects of multiple growth periods and other parameters on crop yield. For example, the accuracy of the full-parameter-based RF estimation model at the filling stage was higher than that of the RF estimation model based on the highly correlated vegetation indexes. Wan et al. [25] used visible and multispectral vegetation indexes, plant height, and cover of the multiple growth periods to construct the random forest-based rice yield prediction models, with higher accuracy than the yield estimation model constructed with the single growth period and single parameter.
However, up to now, there has been a lack of research on the interaction between RGB color indexes and multispectral vegetation indexes of winter wheat in multiple growth periods, and the method that can make low-cost RGB cameras achieve the maximum yield prediction effect needs to be further explored. In this study, a UAV remote sensing platform carrying the RGB camera and multispectral sensors was used to acquire RGB images and multispectral images of winter wheat at the multiple growth periods, and based on the machine learning methods, the yield estimation models based on the color indexes, multispectral vegetation indexes, and multispectral vegetation indexes + color indexes at the single growth period and multiple growth periods were constructed to compare the performances and accuracies of each model. The main objectives of this study are as follows: (1) to analyze the correlation and change of winter wheat RGB color indexes and multispectral vegetation indexes with yield among multiple growth periods, as well as the effect of combining features at single and multiple growth periods on the accuracy of yield estimation of winter wheat, to improve the accuracy of the yield estimation of winter wheat, and to provide a basis for decision-making for precision management; (2) to compare the accuracy of three machine learning-based yield estimation models for winter wheat and to determine the best model for winter wheat; and (3) to explore the capability of low-cost RGB cameras in crop yield estimation.

2. Materials and Methods

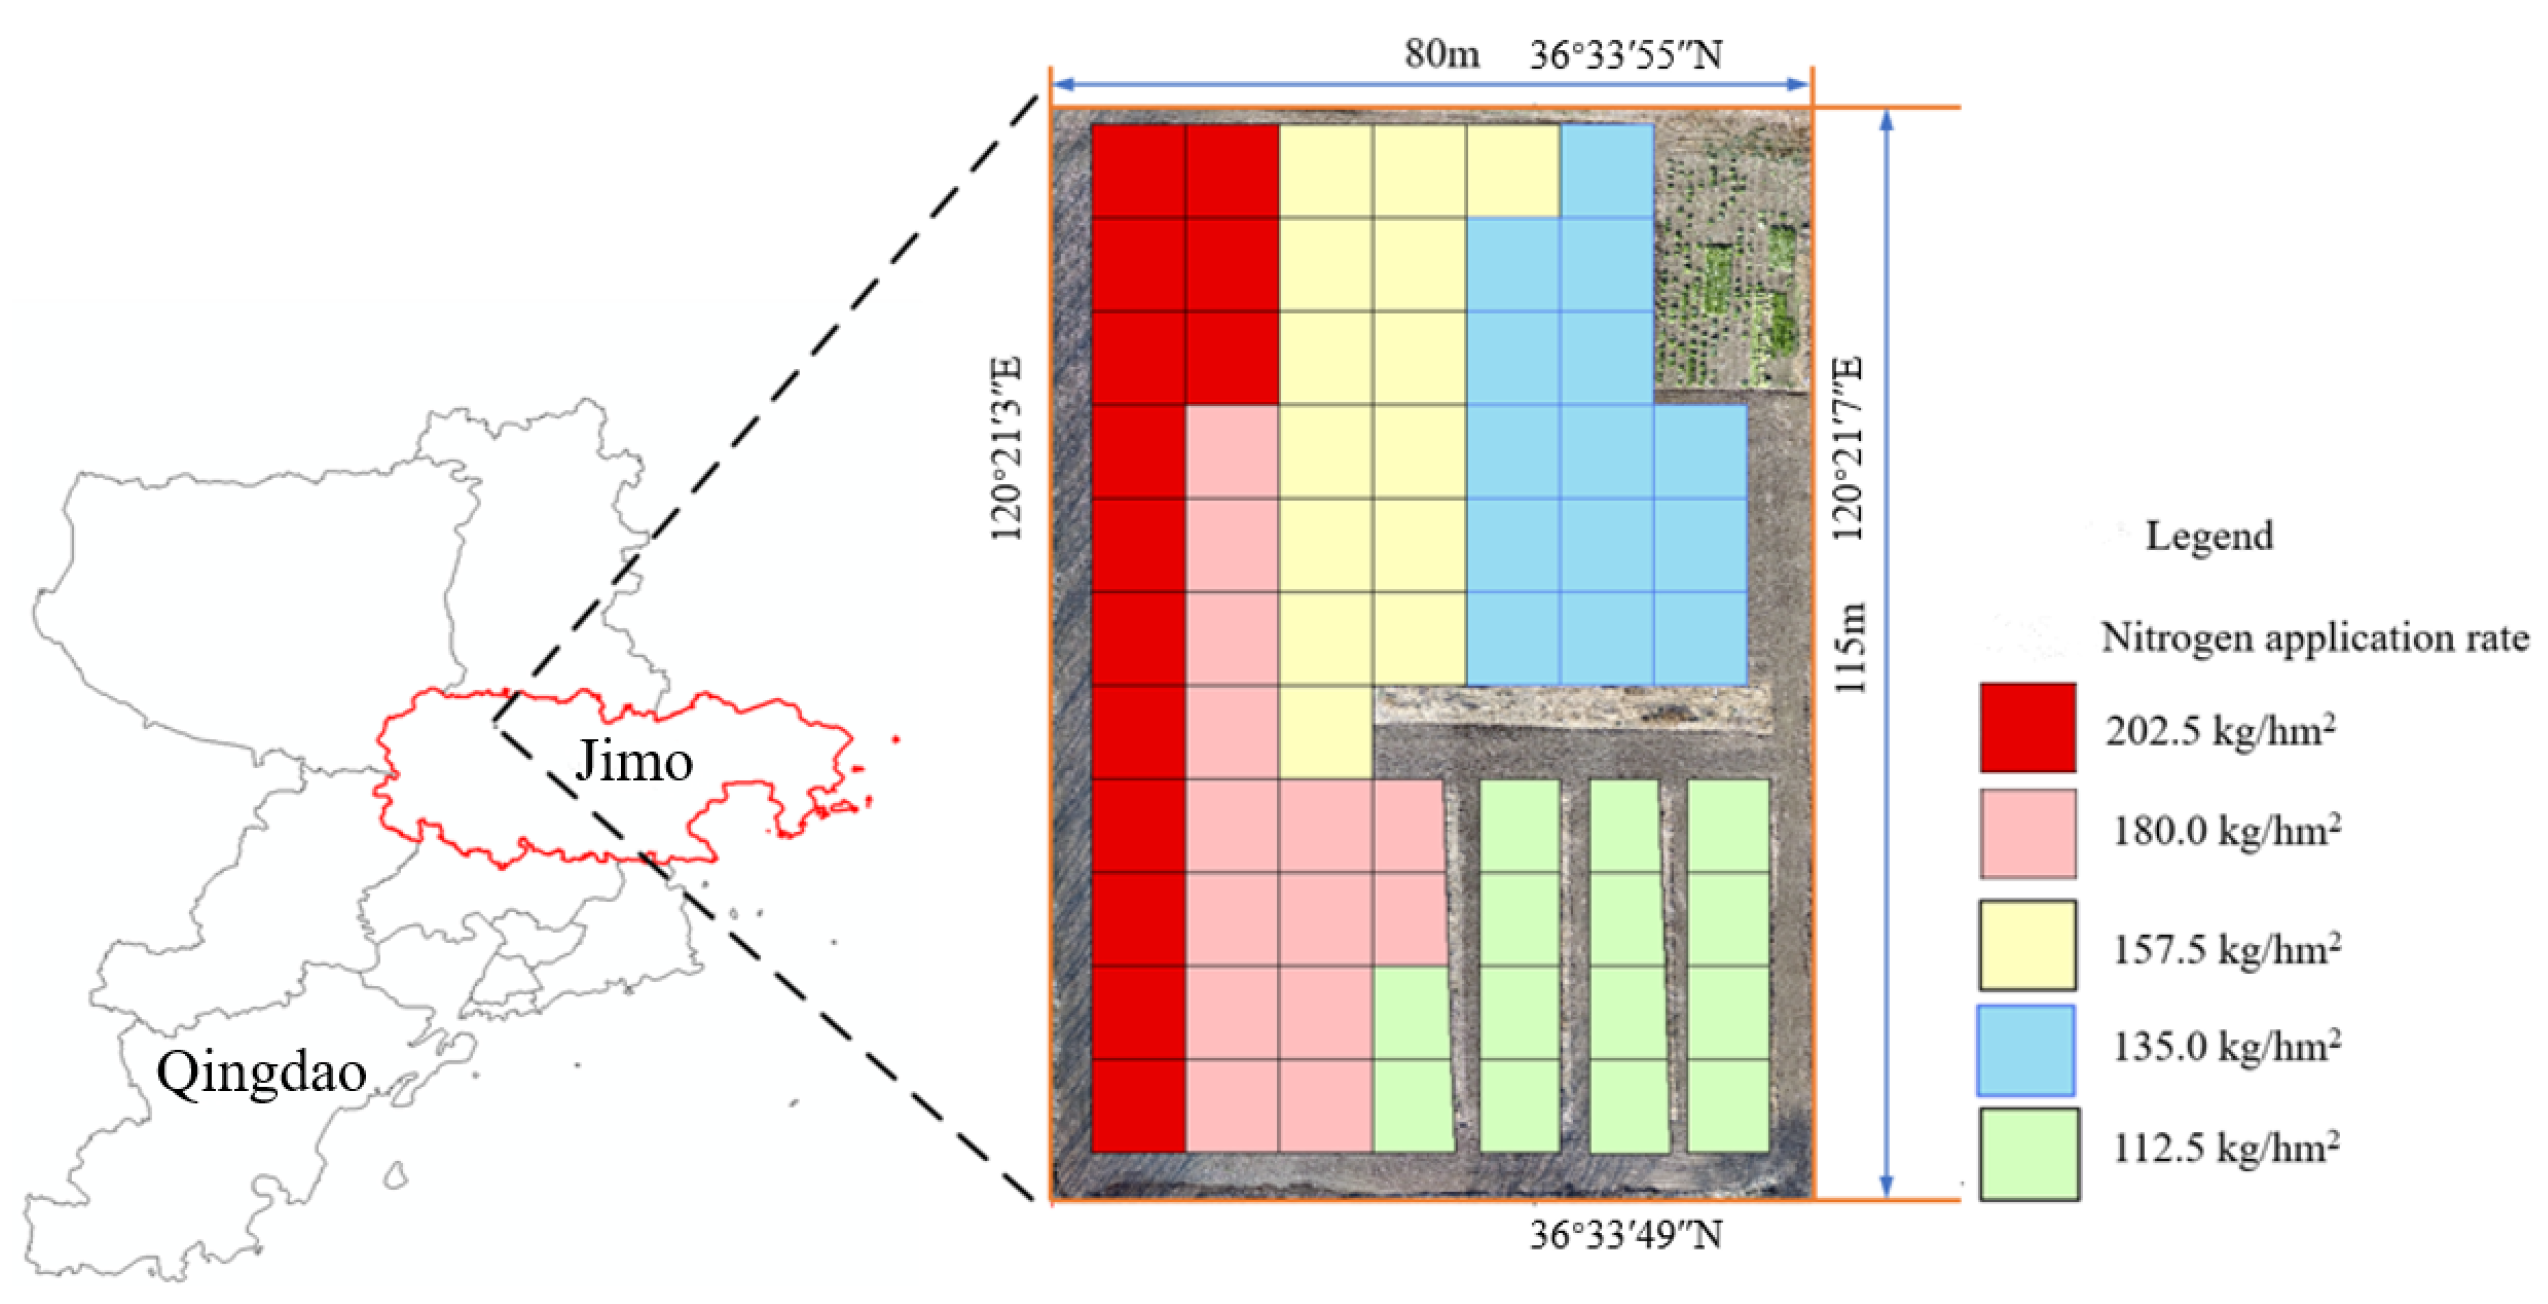
2.1. Study Area Overview

The study area is located in Jiangjiazhuang Village, Duanpolan Town, Jimo District, Qingdao City, China (longitude range: 120°14′ to 121°07′, latitude range: 36°31′ to 36°63′). This area falls within a warm-temperate continental monsoon climate zone. The wheat variety cultivated is Jimai 22, with sowing typically taking place in the middle to late October, and harvest occurring in late June of the following year. The experimental area size was approximately 0.92 ha, and the experimental area was divided into five nitrogen fertilizer levels: deficient nitrogen, appropriate nitrogen, and excessive nitrogen, while phosphorus and potassium fertilizers were applied at normal rates. Each fertilization plot measured 10 m × 10 m. The normal excessive nitrogen application rate used by farmers was 202.50 kg/ha (N5), while the appropriate nitrogen application rates were set at 180.00 kg/ha (N4), and the insufficient nitrogen application rates were set at 157.50 kg/ha (N3), 135.00 kg/ha (N2), 112.50 kg/ha (N1). Each treatment had 14 repetitions, resulting in a total of 70 plots (as shown in Figure 1), all of which were managed in accordance with standard field management practices.

2.2. Data Collection

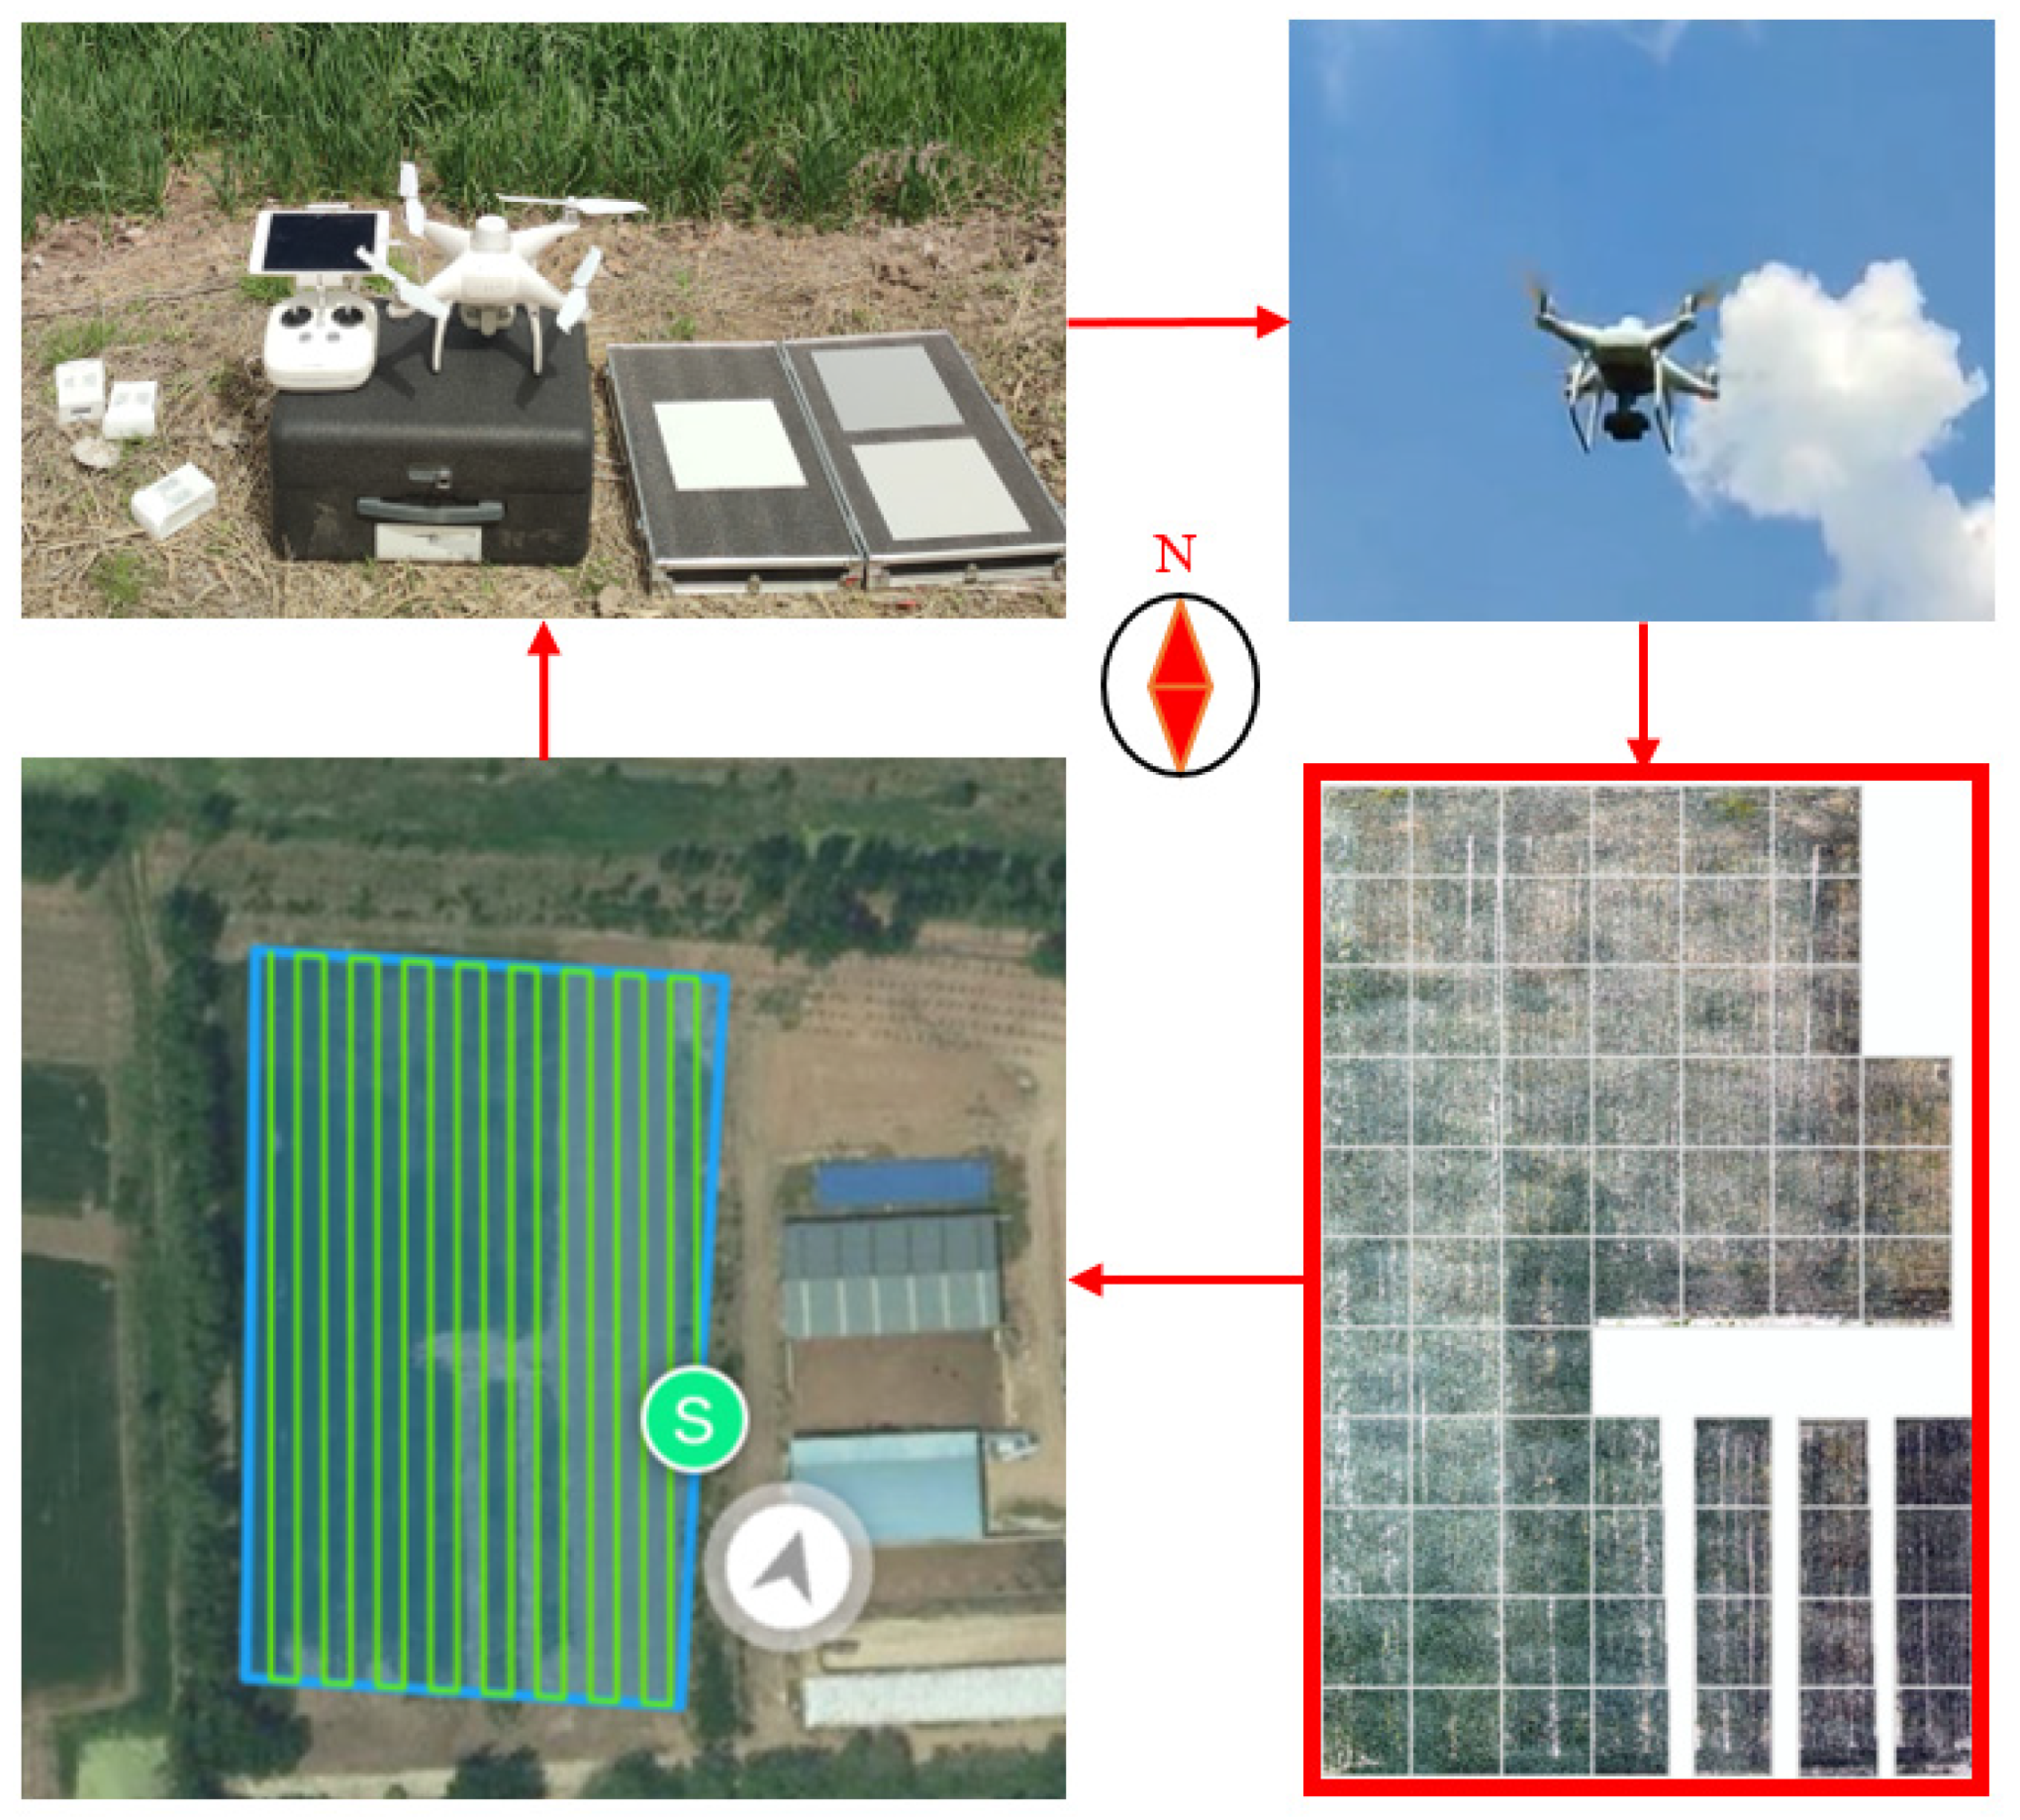
2.2.1. Remote Sensing Data Acquisition and Preprocessing

UAV remote sensing monitoring of wheat growth was conducted from 11:00 to 12:00 on 29 April 2021, at the heading stage; on 15 May 2021, at the filling stage; and on 30 May 2021, at the maturity stage. This monitoring aimed to obtain wheat growth trend information. The UAV used for this purpose was the DJI Phantom 4 (as shown in Figure 2), which was equipped with a top-mounted multispectral radiometric sensor. This sensor collected real-time solar irradiance data and performed reflectance calibration of the UAV remote sensing images using calibration boards. The flight path of the UAV was set in an S-shaped pattern, with a flight altitude of 80 m, a forward overlap rate of 70%, and a side overlap rate of 80%. The UAV was equipped with both a multispectral sensor and an RGB visible light sensor, capable of capturing crop information in blue (B, wavelength 450 ± 16 nm), green (G, wavelength 560 ± 16 nm), red (R, wavelength 650 ± 16 nm), red-edge (RE, wavelength 730 ± 16 nm), near-infrared (NIR, wavelength 840 ± 26 nm), and RGB visible light. The images were radiometrically calibrated, orthorectified, and stitched using DJI Terra 3.1.4 software (DJI Sky City, Shenzhen, China)to create a mosaic of the entire study area. Subsequently, ArcGIS 10.7 software (Esri, Redlands, CA, USA) was employed for image alignment, masking, cropping, segmentation, and calculation to obtain various color indexes and multispectral vegetation index information.

2.2.2. Winter Wheat Yield Determination

On 21 June 2021, winter wheat was harvested and yield was measured using a LOVOL 4LZ-8M combine harvester produced by WEI CHAI LOVOL HEAVY INDUSTRY CO.,LTD in Weifang City, Shandong Province, China, Which was equipped with an impact-type yield monitor system. During the harvesting process, the yield measurement sensor was calibrated to ensure accurate yield measurements for the entire field. The sensor had a sampling frequency of 1000 Hz, and the harvester had a working width of 2.75 m, with a maximum feeding rate of 8.0 kg/s.

2.3. Calculation and Selection of Color Indexes and Multispectral Vegetation Indexes

In this study, multiple vegetation indexes and color indexes were constructed for research purposes. These include the normalized difference vegetation index (NDVI), normalized difference red edge index (NDRE), optimal soil-adjusted vegetation index (OSAVI), green normalized difference vegetation index (GNDVI), as well as modified green-red vegetation index (MGRVI), extra green-red difference index (EXGR), extra red vegetation index (EXR), normalized difference index (NDI), visible light atmospherically resistant vegetation index (VARI), and other indexes. The formulas for calculating each index are provided in the Table 1.

2.4. Data Analysis Methods

Differences in fertilization levels can impact the growth and development of winter wheat, resulting in variations in growth trends that subsequently affect final yields. Mid-season multispectral vegetation indexes and color indexes can be used to characterize these growth differences in crops. In this study, a significance test was used to quantify the degree of correlation between various indexes and yield. Decision trees (DT), support vector regression (SVR), and Gaussian process regression (GPR) were employed to construct models for estimating winter wheat yield. Five-fold cross-validation was conducted to train and validate the models, and the coefficient of determination (R2), root-mean-square error (RMSE), and relative root-mean-square error (rRMSE) were used to evaluate the estimation accuracy of the different methods.

3. Results

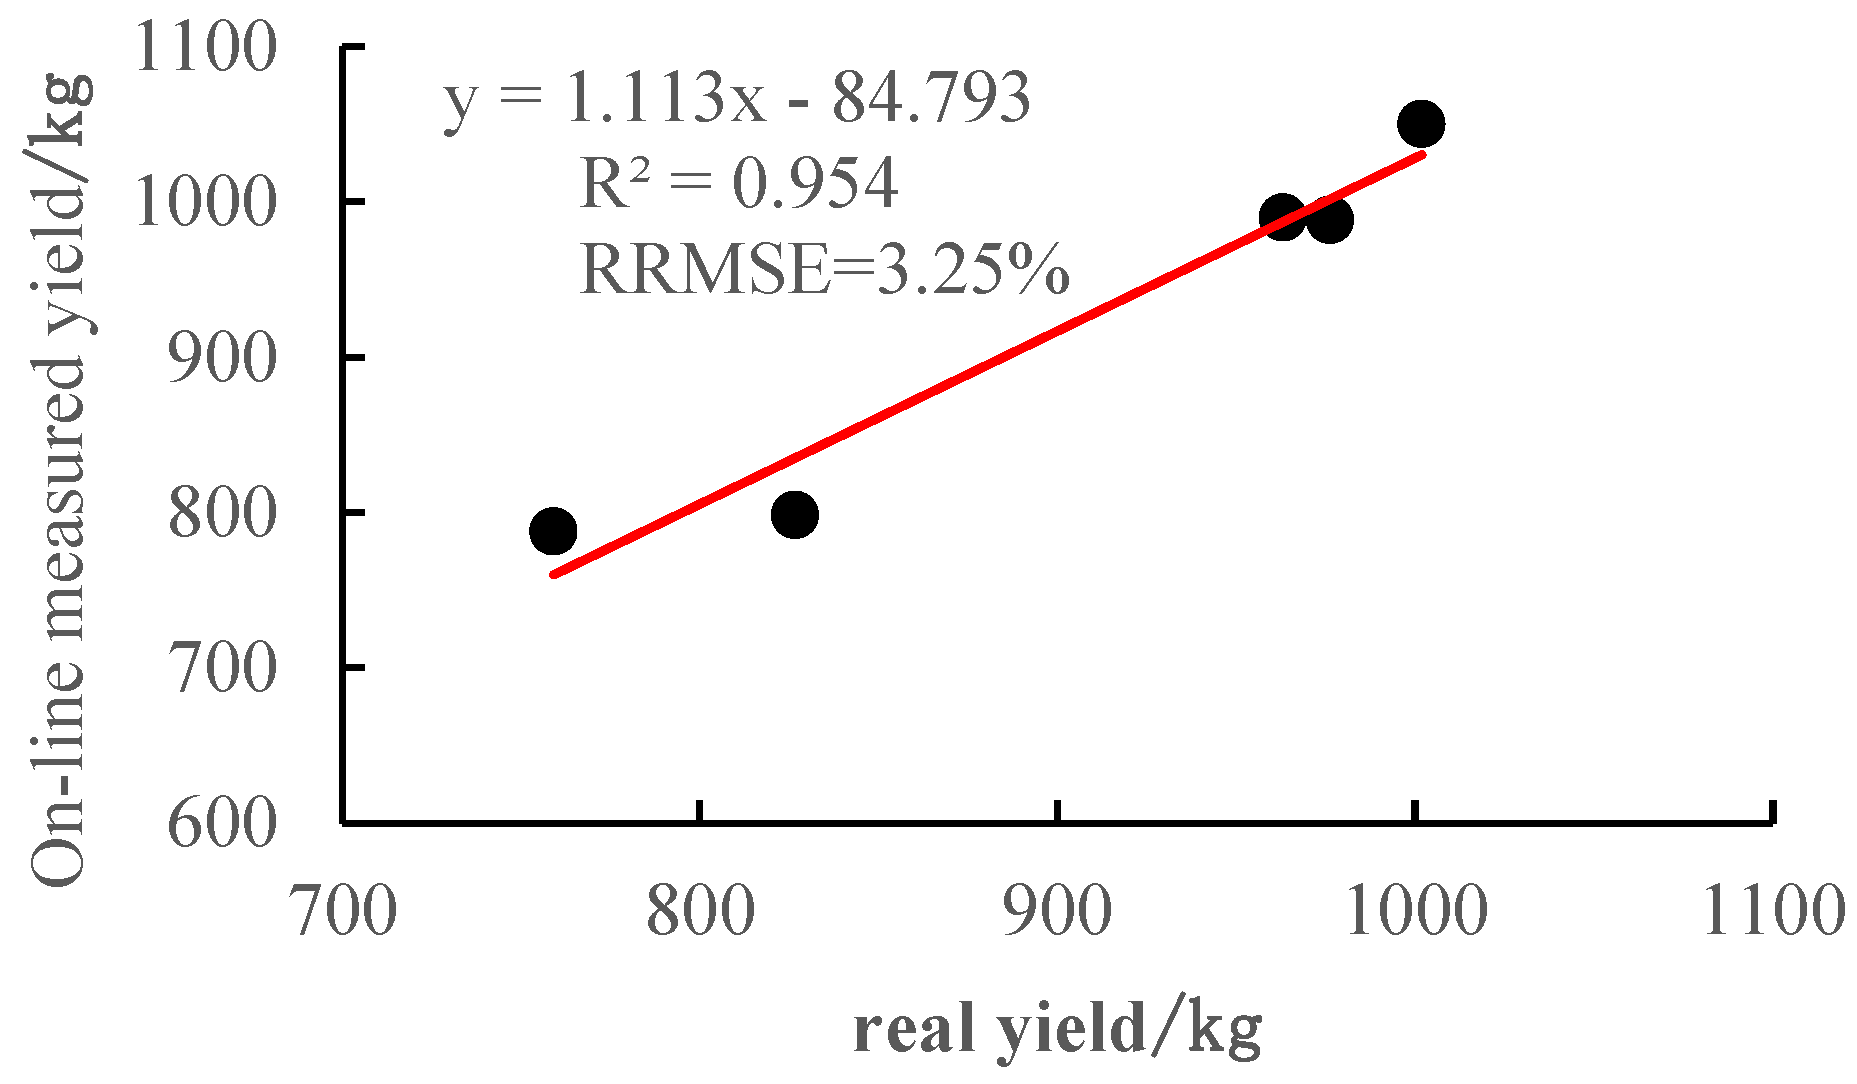
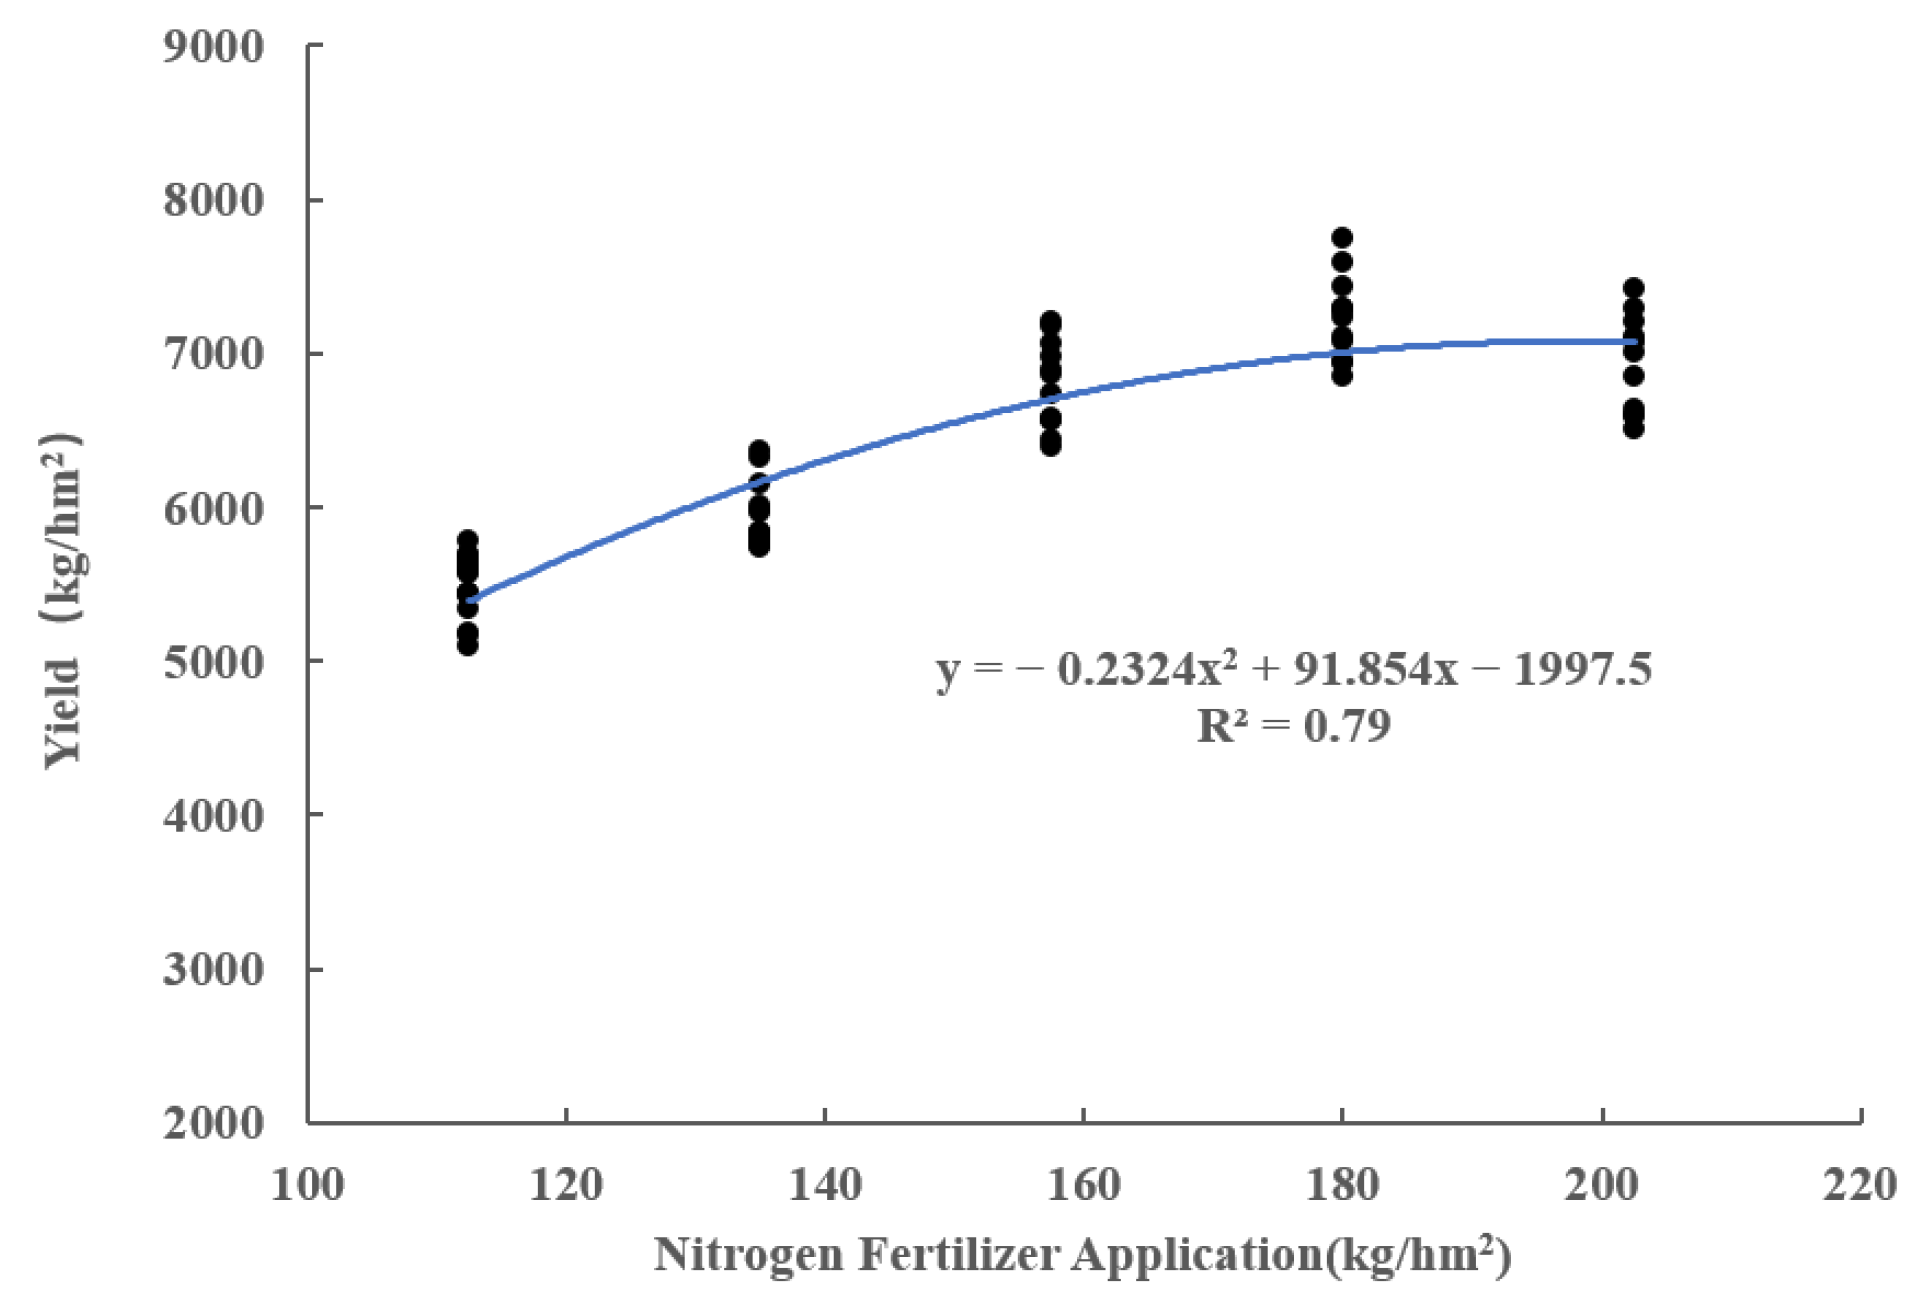
3.1. In-Field Measurement of Winter Wheat Yield

After calibration, the yield measurement sensor was used to harvest and measure the yield of winter wheat across the entire field. During the harvesting operation, centralized harvesting was performed in different areas, and the harvested yields were weighed. This analysis was conducted to assess the field environment yield measurement accuracy of the yield measurement sensor. Field yield measurement data are presented in Figure 3. The sensor’s yield measurement error was less than 5%, with a relative root-mean-square error of 3.25%, meeting the requirements for field yield measurement accuracy and field yield mapping of winter wheat.
The correspondence between different nitrogen application treatments and yield is shown in Figure 4, while linear, quadratic polynomial, power function, exponential, and logarithmic regression models of nitrogen application and yield were constructed, respectively, and the best model was the quadratic polynomial regression model (Figure 5), with R2 = 0.79, and RMSE = 339.31 kg/hm2. By constructing the model of yield estimation of winter wheat in the early season and based on the relationship between nitrogen application and yield model, it is possible to diagnose the nitrogen nutrition of winter wheat in mid-season and, thus, make nitrogen application decisions.

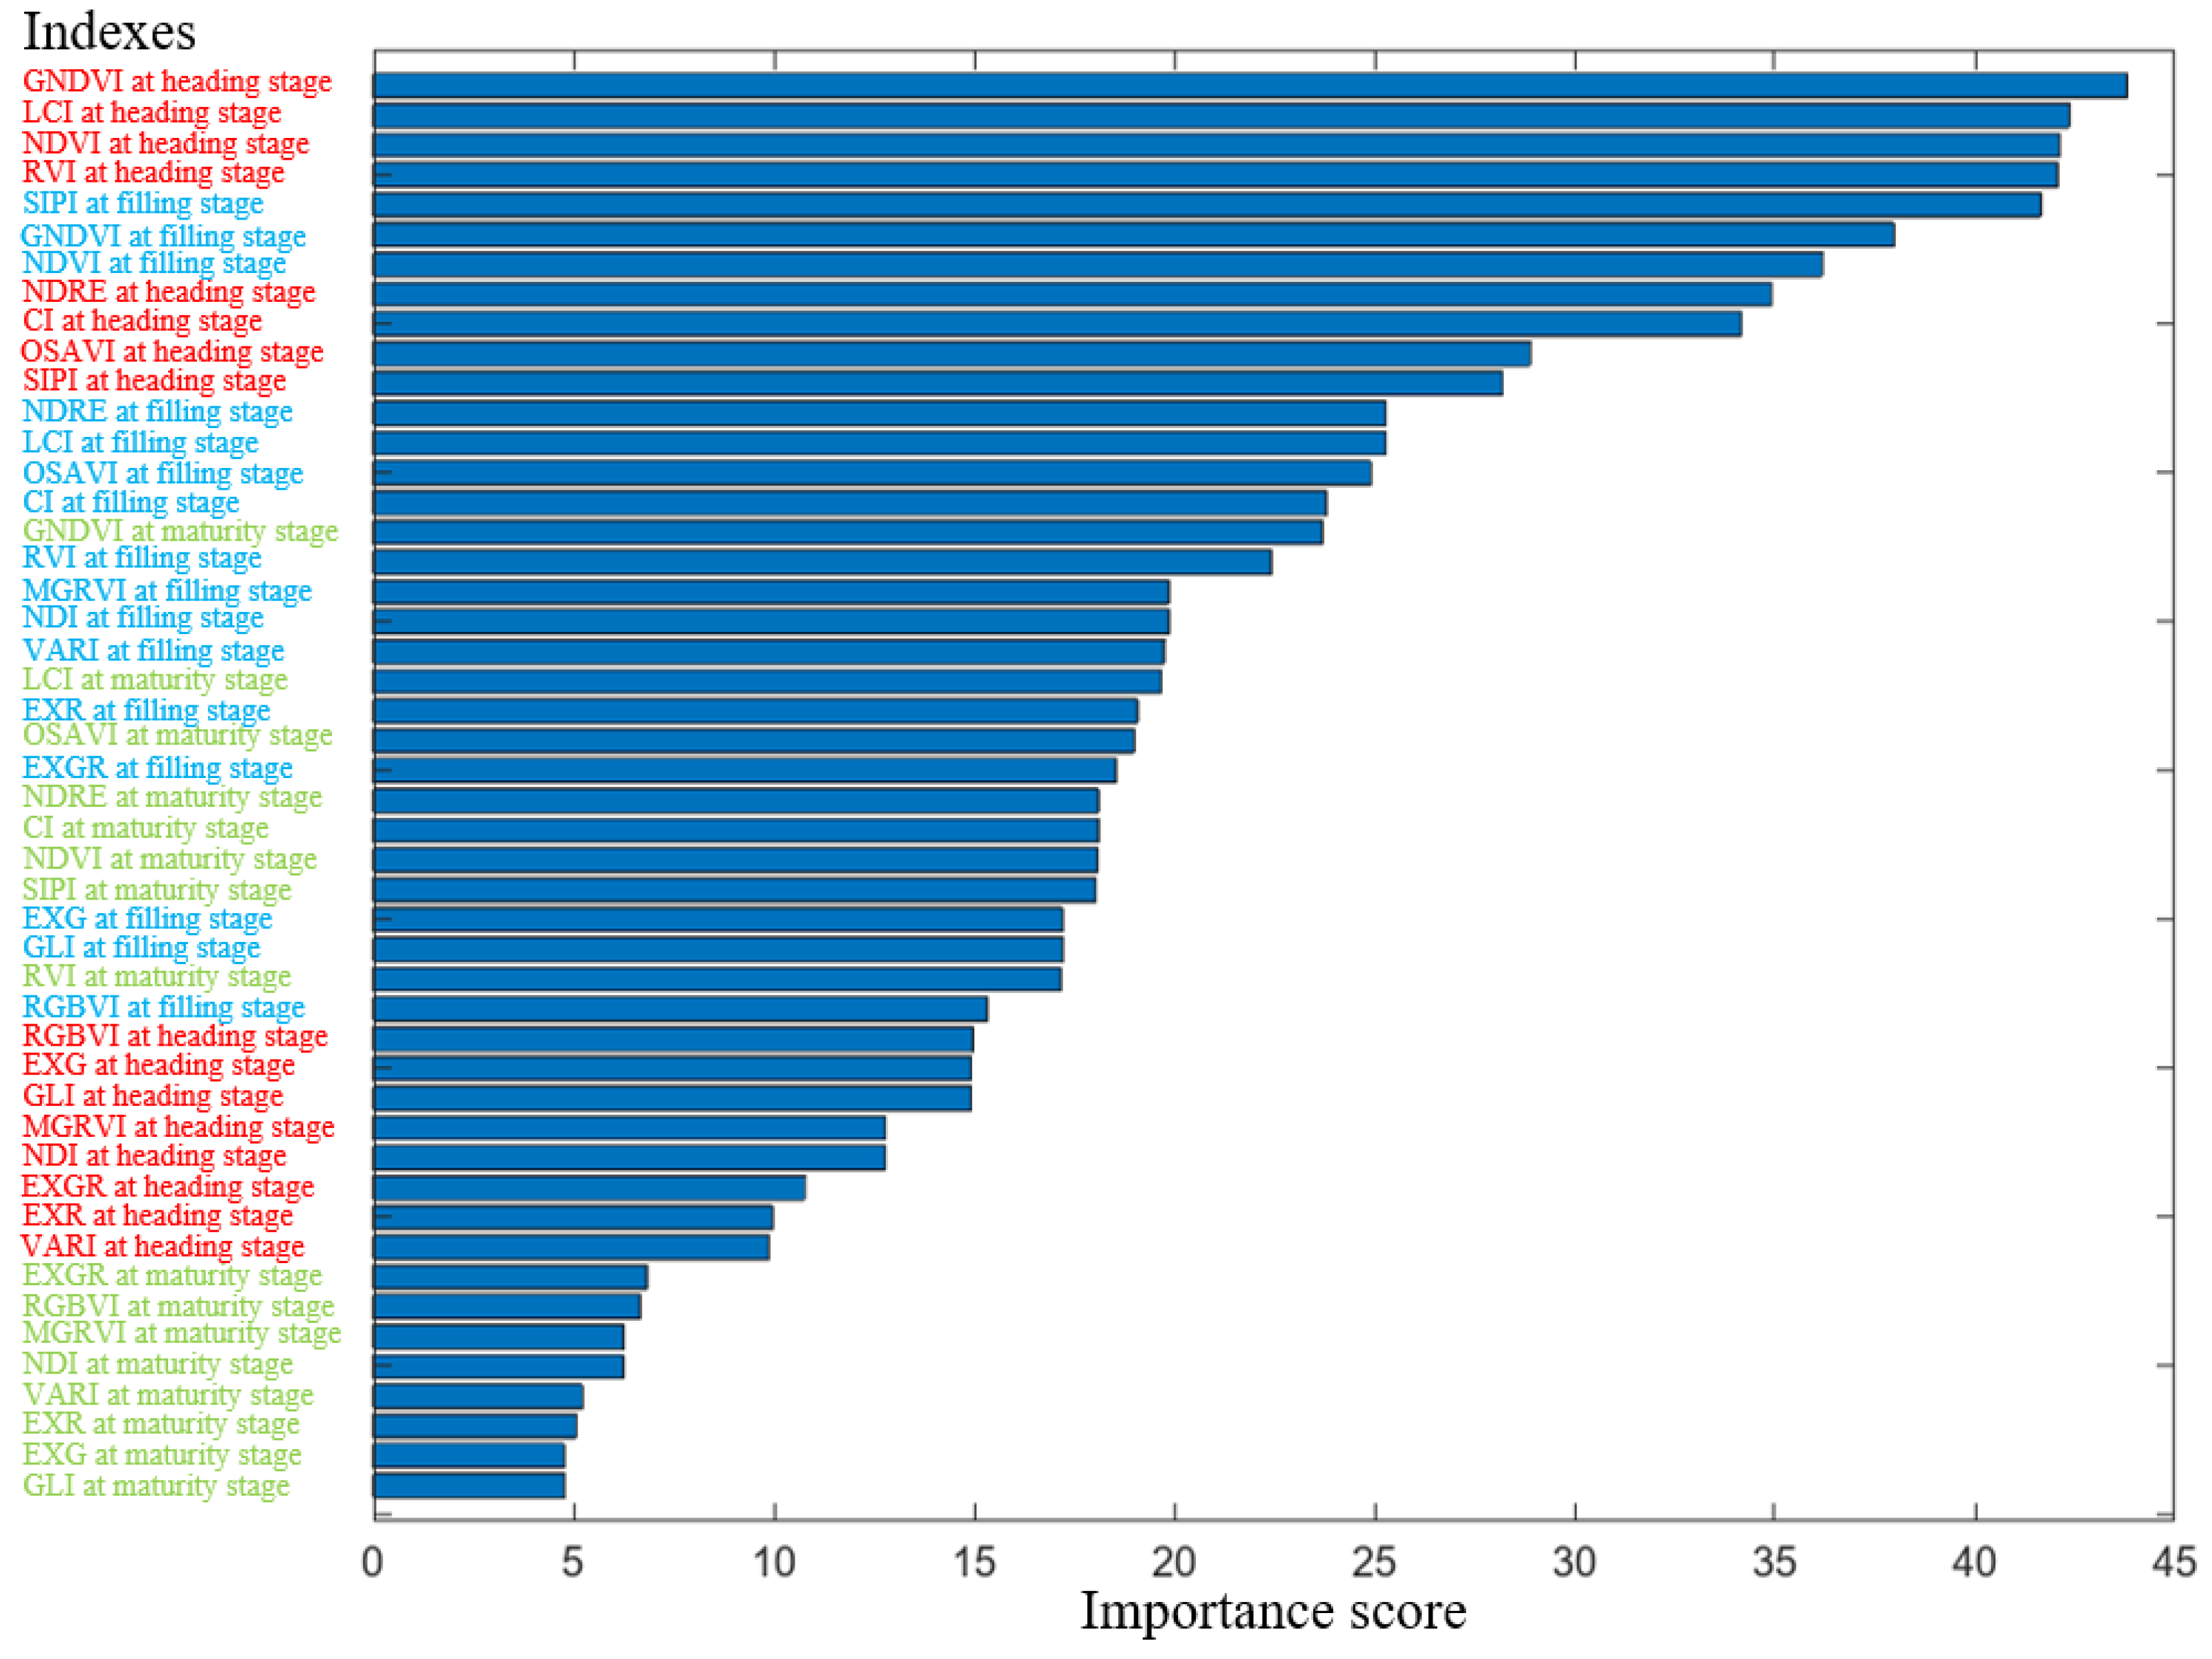
3.2. Significant Analysis of the Effect of Multispectral Vegetation Indexes and Color Indexes on Yield

The linear model and F-test were used to assess the significance of the effect of each predictor variable at different growth periods on the yield. From Table 2, it can be seen that there was a significant effect of different multispectral vegetation indexes and color indexes at different growth periods on the yield. The F-test was used to rank the importance of each index at different growth periods, and the importance ranking of each index is shown in Figure 6.
It can be seen that the importance of multispectral vegetation indexes for yield at different growth periods was greater than that of color indexes at the corresponding growth periods. Among them, except for SIPI, the importance of multispectral vegetation indexes based on near-infrared bands for yield gradually decreased between the three growth periods. In contrast, the RGB color indexes increased and then decreased in importance between the three growth stages. For the heading, filling, and maturity stage, the multispectral vegetation indexes and color indexes that had the greatest impact on yield were GNDVI and RGBVI, SIPI and MGRVI, and GNDVI and EXGR, respectively. The importance of the two types of indexes varied considerably at the heading stage and at the maturity stage, respectively. At the filling stage, the difference in the importance of each type of indexes for yield was relatively small. Meanwhile, it can be seen that the importance of partial multispectral vegetation indexes at the filling stage was higher than that of partial multispectral vegetation indexes at the heading stage, and the importance of partial multispectral vegetation indexes at the maturity stage was higher than that of partial multispectral vegetation indexes at the filling stage. The importance of partial color indexes at the filling stage was higher than that of partial multispectral vegetation indexes at the maturity stage. The importance of color indexes at the heading stage was higher than that of color indexes at the maturity stage.
These indexes can reflect the growth variations and yield characteristics of winter wheat to some extent. Moreover, different types of indexes at different growth stages are complementary and can be used to estimate winter wheat yield.

3.3. Yield Estimation Models Based on Multiple Growth Periods

Using the DT, SVR, and GPR methods and color indexes and multispectral vegetation indexes at different growth periods, winter wheat yield estimation models were constructed. Overall, the accuracy of the yield estimation models followed the order: GPR > SVR > DT. From Table 3, it can be observed that the accuracy of the yield estimation models based on multispectral vegetation indexes was the highest at the heading stage (R2 = 0.79), followed by the filling stage (R2 = 0.78), and the lowest at the maturity stage (R2 = 0.65). For the yield estimation models based on RGB color indexes, the models constructed using color indexes at the filling stage had the highest accuracy (R2 = 0.59), followed by the heading stage (R2 = 0.53), with the lowest accuracy at the maturity stage (R2 = 0.18). In terms of yield estimation models based on the single growth period using multispectral vegetation indexes and RGB color indexes, the accuracy of the models based on multispectral vegetation indexes was consistently higher than that of the models based on RGB color indexes.
The accuracy of yield estimation models based on the multiple growth periods was higher than that of the models based on the single growth period. Specifically, the yield estimation models based on RGB color indexes at multiple growth periods showed higher accuracy compared with the corresponding best estimation model at the single growth period, with R2 improving by 0.21. The yield estimation models based on multispectral vegetation indexes at multiple growth periods had a slight improvement of 0.01 compared with the corresponding best estimation model at the single growth period. The yield estimation models based on a combination of multispectral vegetation indexes and RGB color indexes at the multiple growth periods also showed a 0.01 improvement in accuracy compared with the corresponding best estimation model at the single growth period. The yield estimation models based on the various parameters and combinations at the multiple growth periods are illustrated in Figure 7.
The accuracy of yield estimation models based on a combination of RGB color indexes and multispectral vegetation indexes was consistently higher than that of the models using individual types of indexes. Specifically, the yield estimation model based on the multispectral vegetation indexes + RGB color indexes had a higher R2 of 0.03 than that of the model based on the multispectral vegetation indexes or RGB color indexes at the multiple growth periods, respectively. At the heading stage, R2 was increased by 0.03 and 0.29, respectively; at the filling stage, R2 was increased by 0.02 and 0.21, respectively. At the maturing stage, R2 was increased by 0.10 and 0.57, respectively.

4. Discussion

The accuracy of the yield estimation models based on the multispectral vegetation indexes + RGB color indexes in this study was higher than that of the yield estimation models with the corresponding single type of indexes, and the R2 was improved by 0.02–0.10 and 0.03–0.57 compared with that of the yield estimation models based on the multispectral vegetation indexes or RGB color indexes, respectively. The accuracy of yield estimation models based on RGB color indexes was lower than those based on multispectral vegetation indexes. The multispectral vegetation indexes contribute more to the models than the RGB color indexes. Near-infrared light is associated with crop structure, moisture content, and changes in dry matter content, and it contains information about crop physiology and structure, enabling accurate representation of crop biomass [39]. However, estimating crop information based on multispectral information from the crop canopy has certain phenomena such as saturation of multispectral information at the later stages of crop growth and development, and the accuracy decreases. The correlations between multispectral features, color features, and yield and their trends were different during the three growth periods of winter wheat. As the growth period progressed, the correlations between the multispectral vegetation indexes and yield were gradually smaller, except for SIPI. SIPI can minimize the confounding effects of the leaf surface and mesophyll structure [40]. The trend of correlations between color indexes and yield was consistent with the trend of correlation between SIPI and yield. Multiple examples in the literature [41,42] show good correlations between color indexes and the leaf area index in the late growing season of winter wheat. The results of this study showed that RGB color indexes at the filling stage had a strong correlation with yield, and models constructed based on RGB color indexes at this stage outperformed those built at the heading and maturity stages, which is consistent with previous research findings [43]. Studies on the topic in the literature [44] demonstrate that texture features and color features are effective in improving the saturation problem of vegetation indexes under high-density canopies. The research [17] has shown that combining wheat color indexes with texture features can improve the correlation between the combined features and wheat biomass and yield. Additionally, the research [18] has demonstrated that combining multiple sensors and parameters can enhance yield estimation accuracy. Multi-source mapping feature fusion can reduce the canopy structure effect and multispectral indexes saturation problem so as to retain more detailed information of the image and improve the ability of mapping data to be used for monitoring crop growth changes [39]. Xue et al. [26] reviewed over 100 vegetation indexes and emphasized the need to consider and analyze the advantages and limitations of existing vegetation indexes in practical applications, applying them selectively in specific environments.
Furthermore, yield estimation models based on multiple growth periods consistently outperformed those based on a single growth period, which aligns with the findings of previous studies [19,20]. In this study, the accuracy of the yield estimation model based on the RGB color indexes of the multiple growth periods improved more than the accuracy of the yield estimation models for the single growth period, and the R2 increased by 0.21 compared with the optimal single growth period yield estimation model, which indicated that the color characteristics of different growth periods of winter wheat were more complementary for the yield estimation. In contrast, the yield estimation model based on the multispectral vegetation indexes at the multiple growth periods had a smaller improvement in accuracy than the single growth period yield estimation model, with an increase of 0.01 in R2, which was due to the redundancy of information in multispectral vegetation indexes in different growth periods, and the complementarity was smaller. Moreover, the accuracy of the yield estimation model based on the multiple growth periods and RGB color indexes was similar to that of the yield estimation model based on the multispectral vegetation indexes with multiple growth periods, with R2 of 0.80 and 0.80, RMSE of 330.37 kg/hm2 and 328.95 kg/hm2, and rRMSE of 5.21% and 5.19%, respectively, which indicated that the low-cost RGB camera had a good potential for winter wheat yield estimation.
Numerous factors influence winter wheat yield, and complex nonlinear relationships exist among multispectral vegetation indexes, color indexes, and these factors. Machine learning is capable of handling multi-source and multi-type data, capturing the nonlinear relationships between crop yield and its influencing factors. Given the relatively small sample size in this study and the presence of multiple parameters for both single and multiple growth periods, GPR-based yield estimation models exhibited higher accuracy. GPR models are suitable for addressing small-sample, high-dimensional, nonlinear problems and can overcome issues associated with empirical algorithms. Unlike empirical models, Gaussian process regression does not require explicit assumptions about the relationships between yield and various modal parameters. Instead, it autonomously learns the function form from the data and offers high flexibility in feature selection [45]. It can effectively exploit high-dimensional features from input data and adapt well to multidimensional nonlinear relationships. Moreover, it has the ability to predict and analyze uncertainty in new data. In recent years, GPR has been proven to achieve high accuracy in small-sample feature research [44,46]. For example, the literature [24] describes utilizing six machine learning methods including GPR, SVR, and RFR to construct yield prediction models, and the results showed that the yield estimation model constructed based on GPR had the highest accuracy. SVR models exhibit good adaptability when handling issues such as collinearity, small samples, nonlinearity, and overfitting, which enhances the accuracy of yield estimation models. However, one limitation of SVR models is that the selection of kernel functions and relevant parameters is often based on empirical knowledge, limiting the constructed models to some extent [47]. DT models can represent complex nonlinear relationships and feature relationships, with strong interpretability. However, they are prone to overfitting, are sensitive to minor changes in input data, and exhibit model instability. In this study, the DT-based yield estimation model exhibited the lowest accuracy.
As high spatial and temporal resolution remote sensing data have presented obvious big data characteristics, crop growth monitoring and yield estimation based on deep learning have become one of the important means to guide agricultural production, and are superior to other traditional image processing techniques [48,49]. Field-scale high-resolution remote sensing images contain rich and complex detail features, and deep learning can extract both local and global spatially dependent features. Compared with traditional methods that can only capture local spatial correlation, deep learning can further improve the yield estimation accuracy. In the future, we will utilize the impulse yield measurement system to obtain high spatial resolution data of yield and combine it with remote sensing images to construct a yield estimation model using deep learning.

5. Conclusions

In this study, machine learning models, including GPR, SVR, and DT, were employed to construct yield estimation models based on the single and multiple growth periods, incorporating color and multispectral vegetation indexes. Overall, the performance and accuracy of the yield estimation models based on machine learning were ranked as follows: GPR, SVR, DT. The combination of color indexes and multispectral vegetation indexes effectively improved the yield estimation accuracy of winter wheat compared with the multispectral vegetation indexes and color indexes alone. The accuracy of the yield estimation models based on the multiple growth periods was also higher than that of the single growth period models. The model with multiple growth periods and multiple characteristics had the highest accuracy, with an R2 of 0.83, an RMSE of 297.70 kg/hm2, and an rRMSE of 4.69%. For the single growth period, the accuracy of the yield estimation models based on the color indexes was lower than that of the yield estimation models based on the multispectral vegetation indexes. For the multiple growth periods, the accuracy of the models constructed by the two types of indexes was very close, with R2 of 0.80, RMSE of 330.37 kg/hm2 and 328.95 kg/hm2, and rRMSE of 5.21% and 5.19%, respectively. This indicates that the low-cost RGB camera has good potential for crop yield estimation. Multi-temporal and multi-sensor remote sensing data fusion can further improve the accuracy of winter wheat yield estimation and provide methods and references for winter wheat yield estimation.

Author Contributions

Conceptualization, Y.L. (Yang Li), B.Z. and Y.Y.; investigation, Y.L. (Yang Li), Y.L. (Yanjun Li) and J.W.; writing-original draft preparation, Y.L. (Yang Li); writing—review and editing, Y.L. (Yang Li), B.Z. and Y.Y.; English language and style, Y.L. (Yanjun Li) and J.W. All authors have read and agreed to the published version of the manuscript.

Funding

This work was supported by the National Key R&D Program (2022YFD2001502).

Institutional Review Board Statement

Not applicable.

Data Availability Statement

The data presented in this study are available within the article.

Acknowledgments

The authors wish to thank the useful comments of the anonymous reviewers of this paper.

Conflicts of Interest

Author Y.L. (Yang Li), B.Z. and Y.Y. were employed by the company Chinese Academy of Agricultural Mechanization Sciences Group Company Limited. The remaining authors declare that the research was conducted in the absence of any commercial or financial relationships that could be construed as a potential conflict of interest.

References

  1. Sishodia, R.P.; Ray, R.L.; Singh, S.K. Applications of remote sensing in precision agriculture: A review. Remote Sens. 2020, 12, 3136. [Google Scholar] [CrossRef]
  2. Boursianis, A.D.; Papadopoulou, M.S.; Diamantoulakis, P.; Liopa-Tsakalidi, A.; Barouchas, P.; Salahas, G.; Karagiannidis, G.; Wan, S.; Goudos, S.K. Internet of things (IoT) and agricultural unmanned aerial vehicles (UAVs) in smart farming: A comprehensive review. Internet Things 2022, 18, 100187. [Google Scholar] [CrossRef]
  3. Yu, F.H.; Cao, Y.L.; Xu, T.Y.; Guo, Z.H.; Wang, D.K. Precision fertilization by UAV for rice at tillering stage in cold region based on hyperspectral remote sensing prescription map. Trans. CSAE. 2020, 36, 103–110. [Google Scholar]
  4. Zhou, M.G.; Shao, G.M.; Zhang, L.Y.; Yao, X.M.; Han, W. T Inversion of SPAD value of winter wheat by multispectral remote sensing of unmanned aerial vehicles. Trans. Chin. Soc. Agric. Eng. 2020, 36, 125–133. [Google Scholar]
  5. Corti, M.; Cavalli, D.; Cabassi, G.; Vigoni, A.; Degano, L.; Marino Gallina, P. Application of a low-cost camera on a UAV to estimate maize nitrogen-related variables. Precis. Agric. 2019, 20, 675–696. [Google Scholar] [CrossRef]
  6. Dai, J.G.; Jiang, N.; Xue, J.L.; Zhang, G.S.; He, X.L. Method for predicting cotton yield based on CNN-BiLSTM. Trans. CSAE 2021, 37, 152–159. [Google Scholar]
  7. Escalante, H.J.; Rodríguez-Sánchez, S.; Jiménez-Lizárraga, M.; Morales-Reyes, A.; De La Calleja, J.; Vazquez, R. Barley yield and fertilization analysis from UAV imagery: A deep learning approach. Int. J. Remote Sens. 2019, 40, 2493–2516. [Google Scholar] [CrossRef]
  8. Diacono, M.; Rubino, P.; Montemurro, F. Precision nitrogen management of wheat. A review. Agron. Sustain. Dev. 2013, 33, 219–241. [Google Scholar] [CrossRef]
  9. Camino, C.; González-Dugo, V.; Hernández, P.; Sillero, J.C.; Zarco-Tejada, P.J. Improved nitrogen retrievals with airborne-derived fluorescence and plant traits quantified from VNIR-SWIR hyperspectral imagery in the context of precision agriculture. Int. J. Appl. Earth Obs. Geoinf. 2018, 70, 105–117. [Google Scholar] [CrossRef]
  10. Tao, H.; Xu, L.; Feng, H.; Yang, G.J.; Yang, X.D.; Niu, Y.C. Winter wheat yield estimation based on UAV hyperspectral remote sensing data. Trans. Chin. Soc. Agric. Mach. 2020, 51, 146–155. [Google Scholar]
  11. Li, J.; Veeranampalayam-Sivakumar, A.N.; Bhatta, M.; Garst, N.D.; Stoll, H.; Stephen Baenziger, P.; Belamkar, V.; Howard, R.; Ge, Y.; Shi, Y. Principal variable selection to explain grain yield variation in winter wheat from features extracted from UAV imagery. Plant Methods 2019, 15, 123. [Google Scholar] [CrossRef] [PubMed]
  12. Song, X.; Zhang, G.; Liu, F.; Li, D.; Zhao, Y.; Yang, J. Modeling spatio-temporal distribution of soil moisture by deep learning-based cellular automata model. J. Arid. Land 2016, 8, 734–748. [Google Scholar] [CrossRef]
  13. Chlingaryan, A.; Sukkarieh, S.; Whelan, B. Machine learning approaches for crop yield prediction and nitrogen status estimation in precision agriculture: A review. Comput. Electron. Agric. 2018, 151, 61–69. [Google Scholar] [CrossRef]
  14. Van Klompenburg, T.; Kassahun, A.; Catal, C. Crop yield prediction using machine learning: A systematic literature review. Comput. Electron. Agric. 2020, 177, 105709. [Google Scholar] [CrossRef]
  15. Zhou, Y.; Wang, D.; Chen, C.; Li, R.; Li, D. Prediction of wheat yield based on color index and texture feature index of unmanned aerial vehicle rgb image. J. Yangzhou Univ. 2021, 42, 110–116. [Google Scholar]
  16. Liu, X.Y.; Zhong, X.C.; Chen, C.; Liu, T.; Sun, C.M.; Li, D.S. Prediction of wheat yield using color and texture feature data of UAV image at early growth stage. J. Triticeae Crop. 2020, 40, 1002–1007. [Google Scholar]
  17. Yang, J.; Ding, F.; Chen, C.; Liu, T.; Sun, C.M.; Ding, D.W.; Huo, Z.Y. Correlation of wheat biomass and yield with UAV image characteristic parameters. Trans. Chin. Soc. Agric. Eng. 2019, 35, 104–110. [Google Scholar]
  18. Song, C.Y.; Geng, H.W.; Fei, S.P.; Li, L.; Gan, T.; Zeng, C.W.; Xiao, Y.G.; Tao, Z.Q. Study on Yield Estimation of Wheat Varieties Based onMulti-Source Data. Spectrosc. Spectr. Anal. 2023, 43, 2210–2219. [Google Scholar]
  19. Cheng, Q.; Xu, H.; Cao, Y.; Duan, F.; Chen, Z. Grain Yield Prediction of Winter Wheat Using Multi-temporal UAV Based on Multispectral Vegetation Index. Trans. Chin. Soc. Agric. Mach. 2021, 52, 160–167. [Google Scholar]
  20. Han, W.; Peng, X.; Zhang, L.; Niu, Y. Summer maize yield estimation based on vegetation index derived from multi-temporal UAV remote sensing. Trans. Chin. Soc. Agric. Mach. 2020, 51, 149–155. [Google Scholar]
  21. Zhou, X.; Zheng, H.B.; Xu, X.Q.; He, J.Y.; Ge, X.K.; Yao, X.; Cheng, T.; Zhu, Y.; Cao, W.X.; Tian, Y.C. Predicting grain yield in rice using multi-temporal vegetation indices from UAV-based multispectral and digital imagery. ISPRS J. Photogramm. Remote Sens. 2017, 130, 246–255. [Google Scholar] [CrossRef]
  22. Zhou, J.; Wang, D.; Maroufpoor, S.; Band, S.S. Sensitivity analysis of wheat yield based on growing degree days in different growth stages: Application of machine learning approach enhanced by grey systems theory. Comput. Electron. Agric. 2023, 210, 107876. [Google Scholar] [CrossRef]
  23. Han, J.; Zhang, Z.; Cao, J.; Luo, Y.; Zhang, L.; Li, Z.; Zhang, J. Prediction of winter wheat yield based on multi-source data and machine learning in China. Remote Sens. 2020, 12, 236. [Google Scholar] [CrossRef]
  24. Bian, C.; Shi, H.; Wu, S.; Zhang, K.; Wei, M.; Zhao, Y.; Sun, Y.; Zhuang, H.; Zhang, X.; Chen, S. Prediction of field-scale wheat yield using machine learning method and multi-spectral UAV data. Remote Sens. 2022, 14, 1474. [Google Scholar] [CrossRef]
  25. Wan, L.; Cen, H.; Zhu, J.; Zhang, J.; Zhu, Y.; Sun, D.; Du, X.; Zhai, L.; Weng, H.; Li, Y.; et al. Grain yield prediction of rice using multi-temporal UAV-based RGB and multispectral images and model transfer–a case study of small farmlands in the South of China. Agric. For. Meteorol. 2020, 291, 108096. [Google Scholar] [CrossRef]
  26. Xue, J.; Su, B. Significant remote sensing vegetation indices: A review of developments and applications. J. Sens. 2017, 2017, 1353691. [Google Scholar] [CrossRef]
  27. Davidson, C.; Jaganathan, V.; Sivakumar, A.N.; Czarnecki, J.M.P.; Chowdhary, G. NDVI/NDRE prediction from standard RGB aerial imagery using deep learning. Comput. Electron. Agric. 2022, 203, 107396. [Google Scholar] [CrossRef]
  28. Shanmugapriya, P.; Rathika, S.; Ramesh, T.; Janaki, P. Applications of remote sensing in agriculture-A Review. Int. J. Curr. Microbiol. Appl. Sci. 2019, 8, 2270–2283. [Google Scholar] [CrossRef]
  29. Fern, R.R.; Foxley, E.A.; Bruno, A.; Morrison, M.L. Suitability of NDVI and OSAVI as estimators of green biomass and coverage in a semi-arid rangeland. Ecol. Indic. 2018, 94, 16–21. [Google Scholar] [CrossRef]
  30. Zhang, T.; Xiu, J.I.N.; Yuan, R.A.O. Inversing photosynthesis quantum yield of the soybean flag leaf using a UAV-carrying multispectral camera. Trans. CSAE. 2022, 38, 150–157. [Google Scholar]
  31. Pearson, R.L.; Miller, L.D. Remote mapping of standing crop biomass for estimation of the productivity of the shortgrass prairie. Remote Sens. Environ. 1972, VIII, 1355. [Google Scholar]
  32. Gitelson, A.A.; Viña, A.; Ciganda, V.; Rundquist, D.C.; Arkebauer, T.J. Remote estimation of canopy chlorophyll content in crops. Geophys. Res. Lett. 2005, 32. [Google Scholar] [CrossRef]
  33. Pen Uelas, J.; Filella, I.; Lloret, P.; Mun Oz, F.; Vilajeliu, M. Reflectance assessment of mite effects on apple trees. Int. J. Remote Sens. 1995, 16, 2727–2733. [Google Scholar] [CrossRef]
  34. Barbedo, J.G.A. Detection of nutrition deficiencies in plants using proximal images and machine learning: A review. Comput. Electron. Agric. 2019, 162, 482–492. [Google Scholar] [CrossRef]
  35. Woebbecke, D.M.; Meyer, G.E.; Von Bargen, K.; Mortensen, D.A. Plant Species Identification, Size, and Enumeration Using Machine Vision Techniques on Near-Binary Images. In Optics in Agriculture and Forestry; SPIE: Bellingham, WA, USA, 1993; Volume 1836, pp. 208–219. [Google Scholar]
  36. Mao, D.; Wu, X.; Deppong, C.; Friend, L.D.; Dolecki, G.; Nelson, D.M.; Molina, H. Negligible role of antibodies and C5 in pregnancy loss associated exclusively with C3-dependent mechanisms through complement alternative pathway. Immunity 2003, 19, 813–822. [Google Scholar] [CrossRef]
  37. Louhaichi, M.; Borman, M.M.; Johnson, D.E. Spatially located platform and aerial photography for documentation of grazing impacts on wheat. Geocarto Int. 2001, 16, 65–70. [Google Scholar] [CrossRef]
  38. Bendig, J.; Yu, K.; Aasen, H.; Bolten, A.; Bennertz, S.; Broscheit, J.; Gnyp, M.L.; Bareth, G. Combining UAV-based plant height from crop surface models, visible, and near infrared vegetation indices for biomass monitoring in barley. Int. J. Appl. Earth Obs. Geoinf. 2015, 39, 79–87. [Google Scholar] [CrossRef]
  39. Wan, L.; Du, X.; Chen, S.; Yu, F.; Zhu, J.; Xu, T.; He, Y.; Cen, H. Rice panicle phenotyping using UAV-based multi-source spectral image data fusion. Trans. Chin. Soc. Agric. Eng. 2022, 38, 162–170. [Google Scholar]
  40. Penuelas, J.; Baret, F.; Filella, I. Semi-empirical indices to assess carotenoids/chlorophyll a ratio from leaf spectral reflectance. Photosynthetica 1995, 31, 221–230. [Google Scholar]
  41. Zhou, K.; Zhou, T.; Ding, F.; Ding, D.W.; Wu, W.; Yao, Z.S.; Liu, T.; Huo, Z.Y.; Sun, C.M. Wheat LAI Estimation in Main Growth Period Based on UAV Images. J. Agric. Sci. Technol. 2021, 23, 89–97. [Google Scholar]
  42. Jiang, J.; Zhang, Z.Y.; Cao, Q.; Tian, Y.C.; Zhu, Y.; Cao, W.X.; Liu, X.J. Use of a digital camera mounted on a consumer-grade unmanned aerial vehicle to monitor the growth status of wheat. J. Nanjing Agric. Univ. 2019, 42, 622–631. [Google Scholar]
  43. Tao, H.; Feng, H.; Yang, G.; Yang, X.; Miao, M.; Wu, Z.; Zhai, L. Comparison of winter wheat yields estimated with UAV digital image and hyperspectral data. Trans. Chin. Soc. Agric. Eng. 2019, 35, 111–118. [Google Scholar]
  44. Fan, J.L.; Wang, H.; Liao, Z.Q.; Dai, Y.L.; Yu, J.; Feng, H.L. Winter Wheat Leaf Area Index Estimation Based on Texture-color Features and Vegetation Indices. Trans. Chin. Soc. Agric. Mach. 2023, 54, 347–359. [Google Scholar]
  45. Liu, C.B.; Xing, S.; Wang, D.D.; Li, P.C.; Chen, K.; Wu, L.T. Absorption Coefficients Inversion Model Based on Gaussian Process Regression. J. Geomat. Sci. Technol. 2021, 38, 384–390. [Google Scholar]
  46. Lou, S.; Yang, S.Q.; Liu, Y.; Zhang, W.F.; Lv, X.H. Effects of representative groundwater salinity and irrigation amount on the yield and quality of Lycium barbarum in the Hetao Irrigation areas. Trans. CSAE 2022, 38, 102–112. [Google Scholar]
  47. Liu, J.; He, X.; Wang, P.; Huang, J. Early prediction of winter wheat yield with long time series meteorological data and random forest method. Trans. CSAE 2019, 35, 158–166. [Google Scholar]
  48. Wang, P.; Tian, H.; Zhang, Y.; Han, D.; Wang, J.; Yin, M. Crop Growth monitoring and yield estimation based on deep learning: State of the art and beyond. Trans. Chin. Soc. Agric. Mach. 2022, 53, 1–14. [Google Scholar]
  49. Darwin, B.; Dharmaraj, P.; Prince, S.; Popescu, D.E.; Hemanth, D.J. Recognition of bloom/yield in crop images using deep learning models for smart agriculture: A review. Agronomy 2021, 11, 646. [Google Scholar] [CrossRef]
Figure 1. Location of experimental area.
Agriculture 13 02190 g001
Figure 2. UAV remote sensing system and flight path.
Agriculture 13 02190 g002
Figure 3. Data of field test.
Agriculture 13 02190 g003
Figure 4. Yield statistics based on different nitrogen fertilizer treatments.
Agriculture 13 02190 g004
Figure 5. Relationship model between nitrogen application rate and yield.
Agriculture 13 02190 g005
Figure 6. Importance scores for each index based on the F-test algorithm.
Agriculture 13 02190 g006
Figure 7. Yield estimation model based on the multiple growth periods: (a) yield estimation model based on the multiple growth periods and multispectral vegetation indexes; (b) yield estimation model based on the multiple growth periods and color indexes; (c) yield estimation model based on the multispectral vegetation indexes and color indexes of the multiple growth periods.
Agriculture 13 02190 g007
Table 1. Multispectral vegetation indexes and color indexes.
Serial NumberIndexFormulasReference
1NDVI(NIR − R)/(NIR + R)[26]
2NDRE(NIR − RE)/(NIR + RE)[27]
3GNDVI(NIR − G)/(NIR + G)[28]
4OSAVI(NIR − R)/(NIR + R + 0.16)[29]
5LCI(NIR − RE)/(NIR + R)[30]
6RVINIR/R[31]
7CIRENIR/RE − 1[32]
8SIPI(NIR − B)/(NIR − R)[33]
9MGRVI(g2 − r2)/(g2 + r2)[34]
10EXGRExG − ExR[35]
11EXR1.4r − g[36]
12NDI(g − r)/(g + r)[17]
13VARI(g − r)/(g + r − b)[18]
14ExG2g − b − r[35]
15GLI(2g − b − r)/(2g + b + r)[37]
16RGBVI(g2 − br)/(g2 + br)[38]
Note: B is the reflectivity in the blue band; G is the reflectivity in the green band; R is the reflectivity in the red band; RE is the reflectivity in the red edge band; NIR is the reflectivity in the near-infrared band; r is the normalized red index; g is the normalized green index; b is the normalized blue index.
Table 2. Significance test of multispectral vegetation indexes, color indexes, and yield.
ParametersHeading StageFilling StageMaturity Stage
F Valuep ValueF Valuep ValueF Valuep Value
Model/NDVI213.180<0.0001 **140.713<0.0001 **47.409<0.0001 **
Model/GNDVI216.379<0.0001 **146.275<0.0001 **55.111<0.0001 **
Model/NDRE176.709<0.0001 **119.775<0.0001 **51.462<0.0001 **
Model/LCI196.093<0.0001 **123.689<0.0001 **47.713<0.0001 **
Modell/OSAVI98.312<0.0001 **88.011<0.0001 **47.464<0.0001 **
Model/RVI185.758<0.0001 **86.690<0.0001 **23.820<0.0001 **
Model/SIPI104.440<0.0001 **186.709<0.0001 **72.952<0.0001 **
Model/CIRE159.583<0.0001 **104.977<0.0001 **43.072<0.0001 **
Model/MGRVI34.500<0.0001 **78.490<0.0001 **8.5710.005 **
Model/EXGR38.905<0.0001 **67.754<0.0001 **8.7430.004 **
Model/EXR30.283<0.0001 **80.210<0.0001 **8.2640.005 **
Model/NDI34.534<0.0001 **78.409<0.0001 **8.5290.005 **
Model/VARI28.617<0.0001**79.277<0.0001 **8.7550.004 **
Model/ExG17.728<0.0001 **50.837<0.0001 **8.8920.004 **
Model/GLI17.885<0.0001 **51.331<0.0001 **8.8850.004 **
Model/RGBVI12.6720.001 **43.256<0.0001 **8.8920.004 **
Note: ** indicates significant at the 0.01 level.
Table 3. Yield estimation models based on color indexes and multispectral vegetation indexes.
Index DT SVR GPR
R2RMSE (kg/hm2)rRMSE (%)R2RMSE (kg/hm2)rRMSE (%)R2RMSE (kg/hm2)rRMSE (%)
RGB color indexes at the multiple growth periods0.68412.116.500.79334.065.270.80330.375.21
RGB color indexes at the heading stage0.49521.098.220.53502.377.920.53496.897.84
RGB color indexes at the filling stage0.54491.757.760.57478.857.550.59463.677.31
RGB color indexes at the maturity stage0.10703.2211.090.16678.6110.700.18671.0310.58
Multispectral vegetation indexes at the multiple growth periods0.77347.055.470.79330.415.210.80328.955.19
Multispectral vegetation indexes at the heading stage0.76354.545.590.78337.325.320.79331.825.23
Multispectral vegetation indexes at the filling stage0.74372.535.880.77345.375.450.78343.475.42
Multispectral vegetation indexes at the maturity stage0.46534.798.430.61454.507.170.65432.566.82
Multispectral vegetation indexes + RGB color indexes at the multiple growth periods0.78336.905.310.82306.414.830.83297.704.69
Multispectral vegetation indexes + RGB color indexes at the heading stage0.77351.235.540.81314.804.960.82306.434.83
Multispectral vegetation indexes + RGB color indexes at the filling stage0.76354.995.600.78343.425.420.80321.175.07
Multispectral vegetation indexes + RGB color indexes at the maturity stage0.59462.277.290.72386.616.100.75363.925.74
Disclaimer/Publisher’s Note: The statements, opinions and data contained in all publications are solely those of the individual author(s) and contributor(s) and not of MDPI and/or the editor(s). MDPI and/or the editor(s) disclaim responsibility for any injury to people or property resulting from any ideas, methods, instructions or products referred to in the content.

