Article

Research on the Method of Identifying the Severity of Wheat Stripe Rust Based on Machine Vision

College of Geodesy and Geomatics, Shandong University of Science and Technology, Qingdao 266590, China
*
Author to whom correspondence should be addressed.
Agriculture 2023, 13(12), 2187; https://doi.org/10.3390/agriculture13122187
Submission received: 11 October 2023 / Revised: 18 November 2023 / Accepted: 21 November 2023 / Published: 22 November 2023
(This article belongs to the Special Issue Computer Vision and Sensor Networks in Agriculture)

Abstract

:
Wheat stripe rust poses a serious threat to the quality and yield of wheat crops. Typically, the occurrence data of wheat stripe rust is characterized by small sample sizes, and the current research on severity identification lacks high-precision methods for small sample data. Additionally, the irregular edges of wheat stripe rust lesions make it challenging to draw samples. In this study, we propose a method for wheat stripe rust severity identification that combines SLIC superpixel segmentation and a random forest algorithm. This method first employs SLIC to segment subregions of wheat stripe rust, automatically constructs and augments a dataset of wheat stripe rust samples based on the segmented patches. Then, a random forest model is used to classify the segmented subregion images, achieving fine-grained extraction of wheat stripe rust lesions. By merging the extracted subregion images and using pixel statistics, the percentage of lesion area is calculated, ultimately enabling the identification of the severity of wheat stripe rust. The results show that our method outperforms unsupervised classification algorithms such as watershed segmentation and K-Means clustering in terms of lesion extraction when using the segmented subregion dataset of wheat stripe rust. Compared to the K-Means segmentation method, the mean squared error is reduced by 1.2815, and compared to the watershed segmentation method, it is reduced by 2.0421. When compared to human visual inspection as the ground truth, the perceptual loss for lesion area extraction is 0.064. This method provides a new approach for the intelligent extraction of wheat stripe rust lesion areas and fading green areas, offering important theoretical reference for the precise prevention and control of wheat stripe rust.

1. Introduction

Wheat stripe rust is caused by the spores of the specialized wheat stripe rust pathogen (Puccinia striiformis f.sp.tritici), which belongs to low temperature, high humidity, and strong light-type fungal disease. It is also a cross-regional air-transmitted disease with a wide occurrence and strong prevalence [1]. Since the founding of the People’s Republic of China, an average of about 4 million hectares has been affected annually by wheat stripe rust. In epidemic years, the affected area exceeds 5.5 million hectares. The disease can cause a reduction of 20–30% in wheat yield in normal to moderately affected cases, and in severe cases, it can lead to a reduction of more than 60% [2]. This poses a serious threat to wheat production and quality. Therefore, the prevention and control of wheat stripe rust is particularly important for wheat production and the accurate recognition of wheat stripe rust severity is the key to accurate prevention and control of the disease and the accurate application of pesticides.
Traditional wheat stripe rust severity recognition depends on experts or farmers with relevant experience to enter the field for manual judgment. This method has the disadvantages of strong subjectivity, low efficiency, and low recognition accuracy, which can easily lead to untimely prevention and control and excessive use of pesticides. Compared with the traditional empirical recognition method, spectrum technology can provide more abundant information on crop disease, and some scholars have applied it to intelligent detection of crop disease [3,4,5], finding that this method is suitable for regional detection and early prevention of diseases. Inspired by this, many scholars have applied it to the recognition of wheat stripe rust severity. Li Xiaolong et al. [6] established a qualitative recognition model of wheat stripe rust on different severity leaves based on near-infrared spectrum technology and partial least squares regression. Wang Haiguang et al. [7] used an SVM algorithm to identify the severity of wheat stripe rust based on hyperspectral data of wheat stripe rust leaves with different severity levels. Jiang Xiaomin [8] used a series of algorithms based on the crown scale and the plot scale, to construct a wheat stripe rust severity estimation model based on the spectrometry data of wheat stripe rust. In these studies, all achieved significant results, providing technical support for wheat stripe rust grading and monitoring. However, these methods easily suffer from the “same spectrum, different diseases” phenomenon, are susceptible to weather and terrain effects, and lead to decreased detection accuracy [9]. In addition, these methods also require professional equipment with high costs and cannot be directly applied in the field by farmers.
With the development of deep learning, convolutional neural networks based on images have been widely used in the recognition and detection of crop diseases [10,11,12]. Compared with the spectrum technology-based method, this method does not require professional equipment to obtain data and has high recognition accuracy; therefore, some scholars have applied it to the recognition of wheat stripe rust severity. Guo Wei et al. [13] improved the convolutional network to achieve the recognition of wheat stripe rust severity levels. Mi Zhiwen [14] proposed a new deep learning network C-DenseNet for wheat stripe rust infestation level determination, showing that C-DenseNet has the highest testing accuracy and is superior to other comparative networks. Bao Wenxia et al. [15] proposed a convolutional neural network based on cyclic spatial transformation and conducted severity estimates of wheat stripe rust and powdery mildew on wheat leaves with high accuracy. However, this image-based method requires a large dataset and high-performance computer equipment as a basis for its implementation, as well as the creation of a large number of training samples, which is costly in terms of human and material resources.
In the recognition and detection of crop diseases, machine vision image processing methods have also been widely used [16,17,18,19]. There are few studies that have applied this method for the recognition of wheat stripe rust severity and research on severity grading based on the proportion of the lesion area is even less common. RN Singh et al. [20] estimated the severity of stripe rust through heat imaging and supervised image classification methods. Jiang Xiaomin [21] used clustering methods and OTUS methods based on leaf scale to propose a wheat stripe rust severity grading method based on pictures. These two scholars’ research shows that machine vision image processing methods have significant advantages in wheat stripe rust severity recognition for small data sets. Therefore, based on the idea of segmentation before classification using machine vision image processing methods, this study proposes a wheat stripe rust severity recognition method that combines the Simple Linear Iterative Clustering (SLIC) superpixel method with the random forest algorithm, based on a small-scale publicly available network dataset. The SLIC superpixel segmentation method effectively preserves the irregular edges of lesions, addressing the challenges of difficult and time-consuming manual delineation of disease lesions. Furthermore, by segmenting leaf images into multiple sub-images, there is an increase the sample size for training the random forest method, overcoming the limitation of a small sample size. The advantages of the random forest algorithm, including dual randomness, handling high-dimensional feature image sets, strong robustness to noise data, and resistance to overfitting, contribute to achieving excellent classification accuracy. The proposed method ultimately realizes the fine extraction of wheat stripe rust lesion areas, providing a strategy for determining severity levels based on lesion area. This approach aims to serve as a scientific basis for the precise prevention and accurate treatment of wheat stripe rust.
The following content is organized as follows: Section 2 introduces the dataset and its sources, as well as the methods and accuracy evaluation metrics used in this article; Section 3 describes the experimental process, presents the experimental results, and validates the model accuracy; finally, a summary of the methods proposed in this article is provided in Section 4.

2. Materials and Methods

2.1. Data Source

The wheat stripe rust image data used in this study come from the public dataset, Wheat Leaf Dataset [22], which was collected by Hawi Getachew in 2021 at the Holeta wheat farm in Ethiopia with the assistance of pathologists using a Canon EOS 5D Mark III camera. The dataset contains a total of 407 images, consisting of 102 healthy leaf images, 208 wheat leaf images with rust disease, and 97 wheat leaf images with leaf blight. The dataset used in this article includes 102 healthy leaf images and 208 wheat rust disease leaf images, without using wheat leaf blight data. The categories of the dataset are shown in Figure 1. In this study, pure color background images of wheat rust disease leaves in the dataset were selected as the research objects.

2.2. Wheat Leaf Segmentation Method

2.2.1. Principle of SLIC Superpixel Segmentation

The superpixel [23] refers to a visually meaningful irregular pixel block composed of adjacent pixels with similar textures, colors, brightness, and other features. Superpixel generation is often used as a pre-processing step in image segmentation and has become an important part in visual processing technology and has been applied in multiple computer vision tasks [24]. The SLIC (Simple Linear Iterative Clustering) algorithm is a gradient descent-based and simple linear iterative clustering algorithm proposed by Achanta et al. [25]. Compared to other segmentation algorithms, it has the advantages of high edge adherence and controllable quantity. Moreover, it improves the convergence speed by modifying the search range [26]. Therefore, in this study, the SLIC algorithm is used for wheat leaf segmentation. The algorithm converts the color space of the color image into a 5-dimensional feature vector in the CIELAB color space and the XY coordinate space. Based on the color and space features of the image, the algorithm performs local clustering of each pixel in the color image, grouping pixels with similar visual features into superpixel blocks that have consistent local structures and ideal boundary contours. The specific implementation process of the algorithm is as follows:
(1) The first step is to initialize the seed points (cluster centers). According to the pre-set number of superpixels K, seed point positions are evenly distributed on the image. Assuming the image has N pixels, the size of the segmented superpixels is N K , and the distance between adjacent seed points is approximately S = N K .
(2) In the 3 × 3 neighborhood of a seed point, seed points are selected to avoid being assigned to regions with high gradients near the image edges, thereby preventing potential influence on the subsequent clustering results.
(3) For each seed point, assign a unique label and associate the search area of each pixel with its corresponding seed point. To reduce computation and enhance the algorithm’s convergence speed, the search area is restricted 2S × 2S as shown in Figure 2.
(4) Next, calculate the similarity D between each seed point and the pixels in its search range neighborhood. Since a pixel can be searched by multiple seed points, the seed point with the closest distance to the pixel is used to calculate the similarity, and the label of the most similar seed point is assigned to the pixel. The similarity calculation formula is as follows:
D = d c 2 + d s S 2 m 2
where dc represents the color distance between the seed point and the pixel in the search neighborhood, ds represents the spatial distance between the seed point and the pixel in the search neighborhood, m can be used as a weight to measure the importance of color similarity and spatial proximity. When m is large, the weight of spatial proximity is large and the resulting superpixel is more compact. When m is small, the resulting superpixel is more closely aligned with the image boundary, and its size and shape are less regular.
(5) Then, update the clustering center iteratively by taking the mean of the x and y coordinates of the pixels with the same labels as the new x and y coordinates of the clustering center.
(6) Finally, repeat steps (3), (4), and (5) for iterative optimization until the error converges, i.e., the clustering center no longer changes. The final superpixel segmentation result is generated.

2.2.2. SLIC Segmentation Parameters

The SLIC algorithm used in this study was implemented in the Python language using PyCharm as the IDE. It was developed using the Scikit-image framework (version 0.20.0) along with NumPy (version 1.23.4).
To apply the SLIC superpixel segmentation algorithm to wheat leaf images infected with wheat stripe rust, the first step is to determine the number of superpixels for pre-segmentation. In order to ensure that the segmentation method is adaptable to images of different sizes, a fixed number of pre-segmentations is not used in this study. Instead, the number of pre-segmentations for each image is determined by considering the size of the image. This is achieved by determining a “size” parameter that adapts to different image sizes. The calculation formula is as follows:
n u m s e g m e n t s = i n t w h / s i z e
where numsegments is the number of superpixels for pre-segmentation, w is the width of the image, h is the height of the image, and size is the given parameter. The int function is a calculation function that rounds the result.

2.3. Wheat Stripe Rust Lesion Classification Method

2.3.1. Principles of Random Forest Classification Algorithm

The random forest algorithm [27] is a bagging ensemble classifier constructed by multiple decision trees as base classifiers, which is a variant of bagging based on bootstrap sampling of samples and randomly selecting feature subsets. It constructs multiple decision trees to form a “forest” and obtains the final classification result through the voting results or averaging of each tree. Many studies [28,29,30,31] have shown that the random forest algorithm is less susceptible to outliers and image noise in samples, has good classification accuracy and stability, and is difficult to overfit. It has broad applicability in the field of pest and disease identification. Therefore, this study constructs a random forest model to classify and identify wheat leaf disease lesions and healthy areas. The model construction method is as follows:
(1) Random sampling by taking a training dataset with N samples, performing N random withdrawals with replacement, and using the resulting subsets as root node samples for decision tree construction.
(2) When splitting each node in a decision tree, we needed to randomly select m attributes (where m = l o g 2 M , rounded up) without replacement from the available M attributes. Then, we used a certain strategy (such as information gain) to choose one attribute as the splitting criterion for the node. Starting from the root node, we generate a complete decision tree layer by layer from top to bottom.
(3) Then construct a random forest by repeating steps (1) and (2) n times to build n decision trees and combine them to form a random forest.
(4) The next step is decision tree classification, I For each sample in the test set, perform decision-making for each decision tree, and use majority voting to determine the final classification result.
(5) Finally, repeat step (4) multiple times until the test set completes classification.
The classification flowchart is shown in Figure 3.

2.3.2. Experimental Parameters Setting

The method for classifying diseased regions and its comparative models were implemented using the Scikit-learn framework (version 1.1.1) combined with NumPy (version 1.23.4).
The training dataset for this method was created based on a sample dataset of 2284 images obtained through the SLIC segmentation method applied to leaf images. This dataset comprises 1142 images of healthy leaf portions and 1142 images of diseased regions. The dataset was randomly split into training and testing sets with an 80:20 ratio, resulting in a set of 1827 images for training and 457 images for testing. During the training process, the random forest classifier utilized interpretable variables such as the grayscale histogram features, color features, and texture features of the images. The number of base estimators (n_estimators) was set to 200, and out-of-bag sample estimation (oob_score) was enabled with a setting of True. All other parameters were kept at their default values.

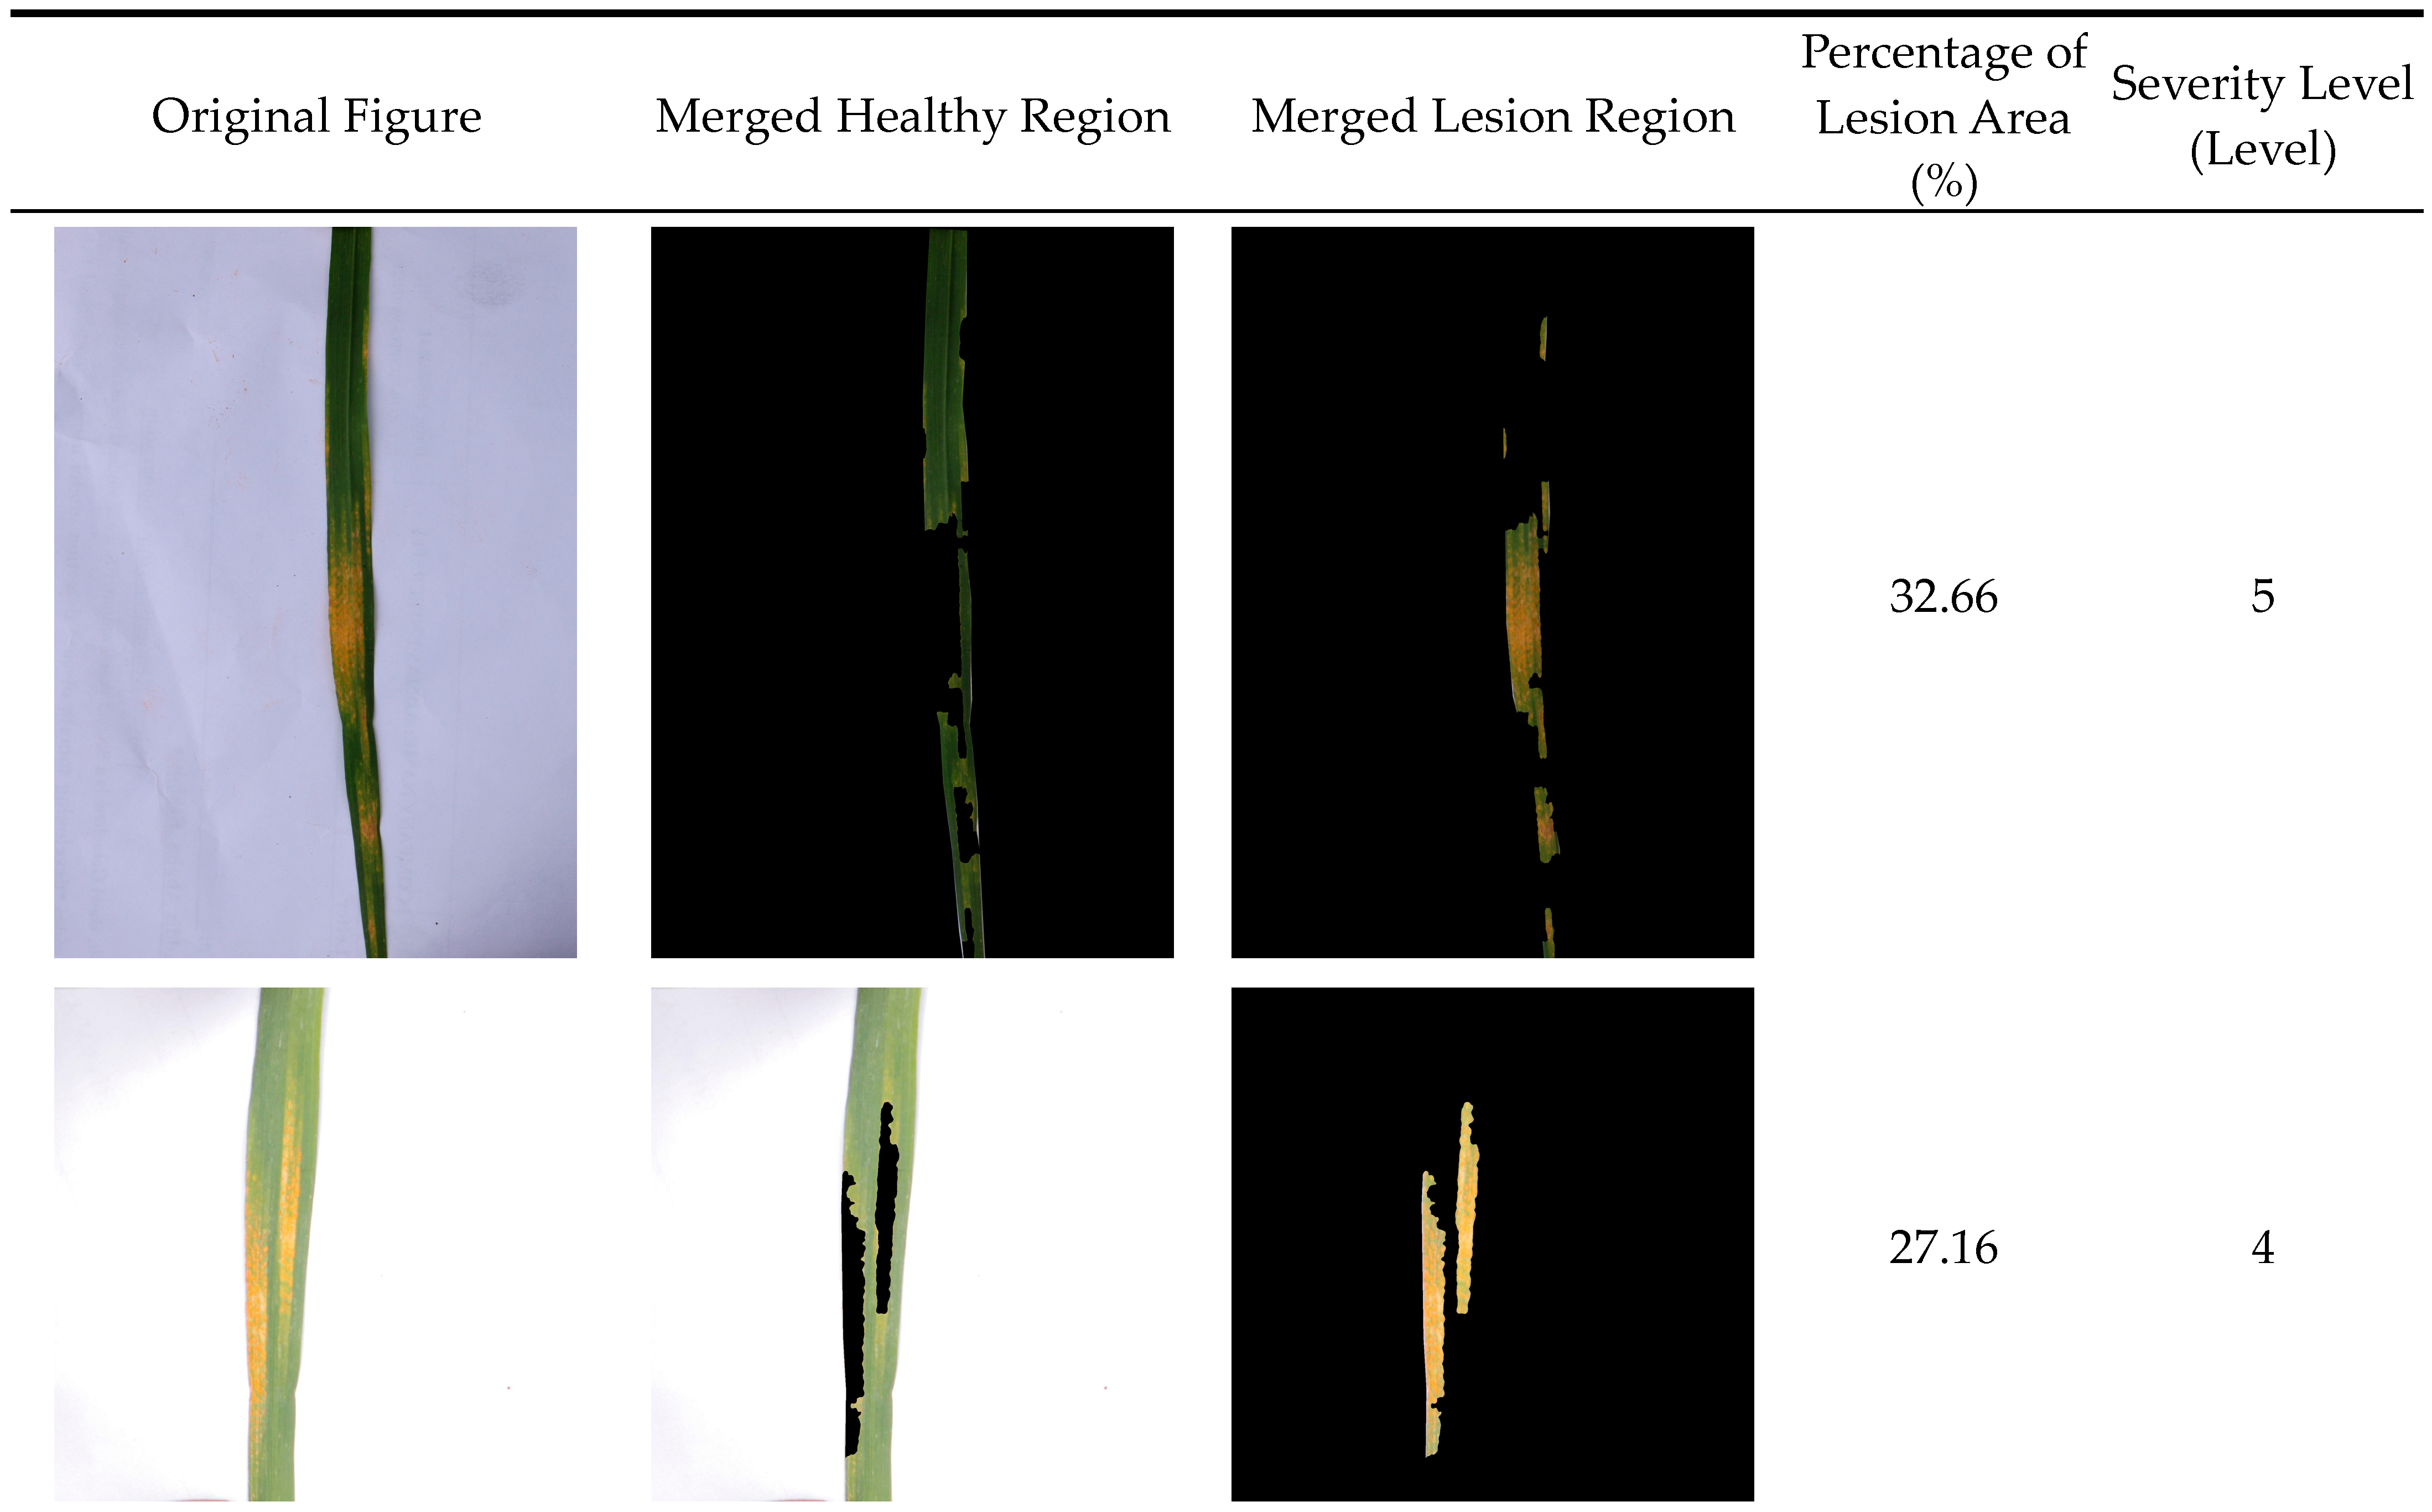
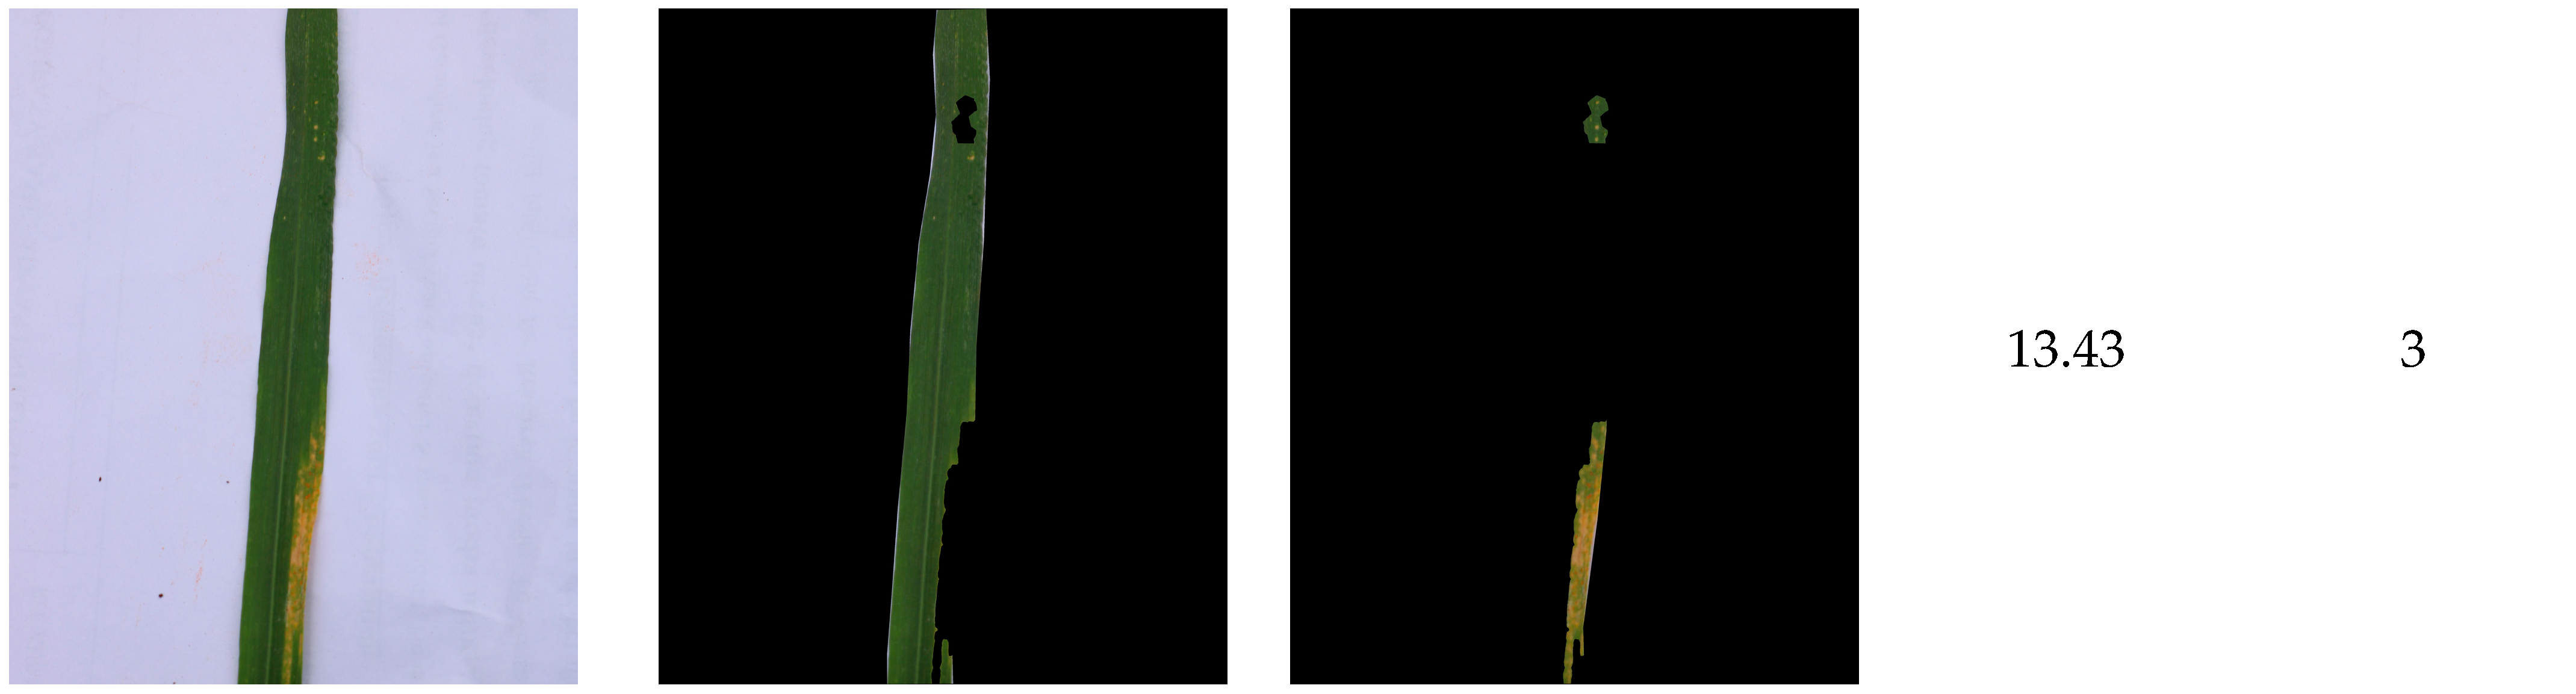
2.4. Wheat Stripe Rust Severity Determination Method

2.4.1. Wheat Stripe Rust Severity Grading Standard

According to the Chinese national standard “Rules for monitoring and forecast of the wheat stripe rust” (GB/T 15795-2011) [32], which has been implemented since 2011, the severity of wheat stripe rust on a single leaf is determined based on the percentage of the diseased area on the leaf affected by wheat stripe rust relative to the total leaf area. This severity is expressed using a grading system ranging from 1 to 8, as outlined in Table 1. For cases falling between grades, the nearest whole number is assigned. If the severity is below 1% despite the presence of the disease, it is recorded as 1%.

2.4.2. Wheat Stripe Rust Severity Identification Method

As mentioned above, the severity of wheat stripe rust disease is measured based on the proportion of lesion area to total leaf area. In digital images, since pixels are the basic building blocks of the image, we can use pixel statistics to calculate the number of pixels in the lesion region and the leaf region after segmentation. Then, calculate the ratio of the number of pixels of the two regions, and finally obtain the percentage of the lesion area in the total leaf area in the image, represented by s. Based on Table 1, we can determine the severity level of wheat leaf rust disease. Based on the wheat stripe rust severity grading standard in Table 1, the severity of wheat stripe rust can be determined. Therefore, this study uses the percentage s to determine the severity of wheat stripe rust, and the calculation formula [33] is as follows:
s = A d A l × 100 % = p x , y R d 1 p x , y R l 1 × 100 % = x , y R d 1 x , y R l 1 × 100 %
where s is the percentage of wheat stripe rust lesion area to total leaf area; Ad is the area of the lesion area; Al is the area of the leaf area; p is the area of a unit pixel; Rd is the lesion area; Rl is the leaf area.
In summary, this study constructs a wheat stripe rust severity identification method based on the combination of the SLIC superpixel segmentation method and the random forest algorithm. First, the pixel-level image segmentation of wheat leaves was achieved through unsupervised SLIC superpixel segmentation, dividing the image into sub-regions with similar features. Second, a random forest model was constructed to train the classified sub-region images, achieving precise extraction of wheat stripe rust disease lesions and healthy leaf areas. Finally, the number of extracted lesion and leaf pixels was counted and the ratio of lesion area was computed to determine the severity of wheat stripe rust according to the severity grading standard of wheat stripe rust. The overall flowchart is shown in Figure 4.

2.5. Comparison Methods

2.5.1. Methods for Wheat Stripe Rust Lesion Sub-Region Identification

This experiment employs a comparative experimental strategy to investigate the advantages of the proposed model. The comparative models include the currently popular and well-performing XG Boost [34] (eXtreme Gradient Boosting) and Ada Boost [35] (Adaptive Boosting). XG Boost is a gradient boosting tree model that combines many CART tree models to construct a strong classifier by continuously adding trees and performing feature splitting. Ada Boost is an iterative algorithm that trains different classifiers (weak classifiers) using the same training set. By increasing the weights of misclassified samples and decreasing the weights of correctly classified samples in the previous round, these weak classifiers are combined to form a stronger final classifier (strong classifier). They share a similar principle as ensemble learning methods but differ in their boosting strategies and weight adjustments. XG Boost and AdaBoost represent weak learning and strong learning methods, respectively, based on tree models. By comparing these two methods with random forests, a better assessment of the performance of random forests in various learning tasks can be achieved.
In terms of method implementation and parameter settings, consistent with the random forest algorithm, grayscale co-occurrence matrix features, color features, and texture features are employed as interpretable variables. In the XG Boost algorithm, the number of classes (num_class) and the maximum depth (max_depth) are set to 2 and 150, respectively. For the AdaBoost algorithm, max_depth and n_estimators are set to 150 and 200, respectively. The remaining parameters for both algorithms are set to their default values.

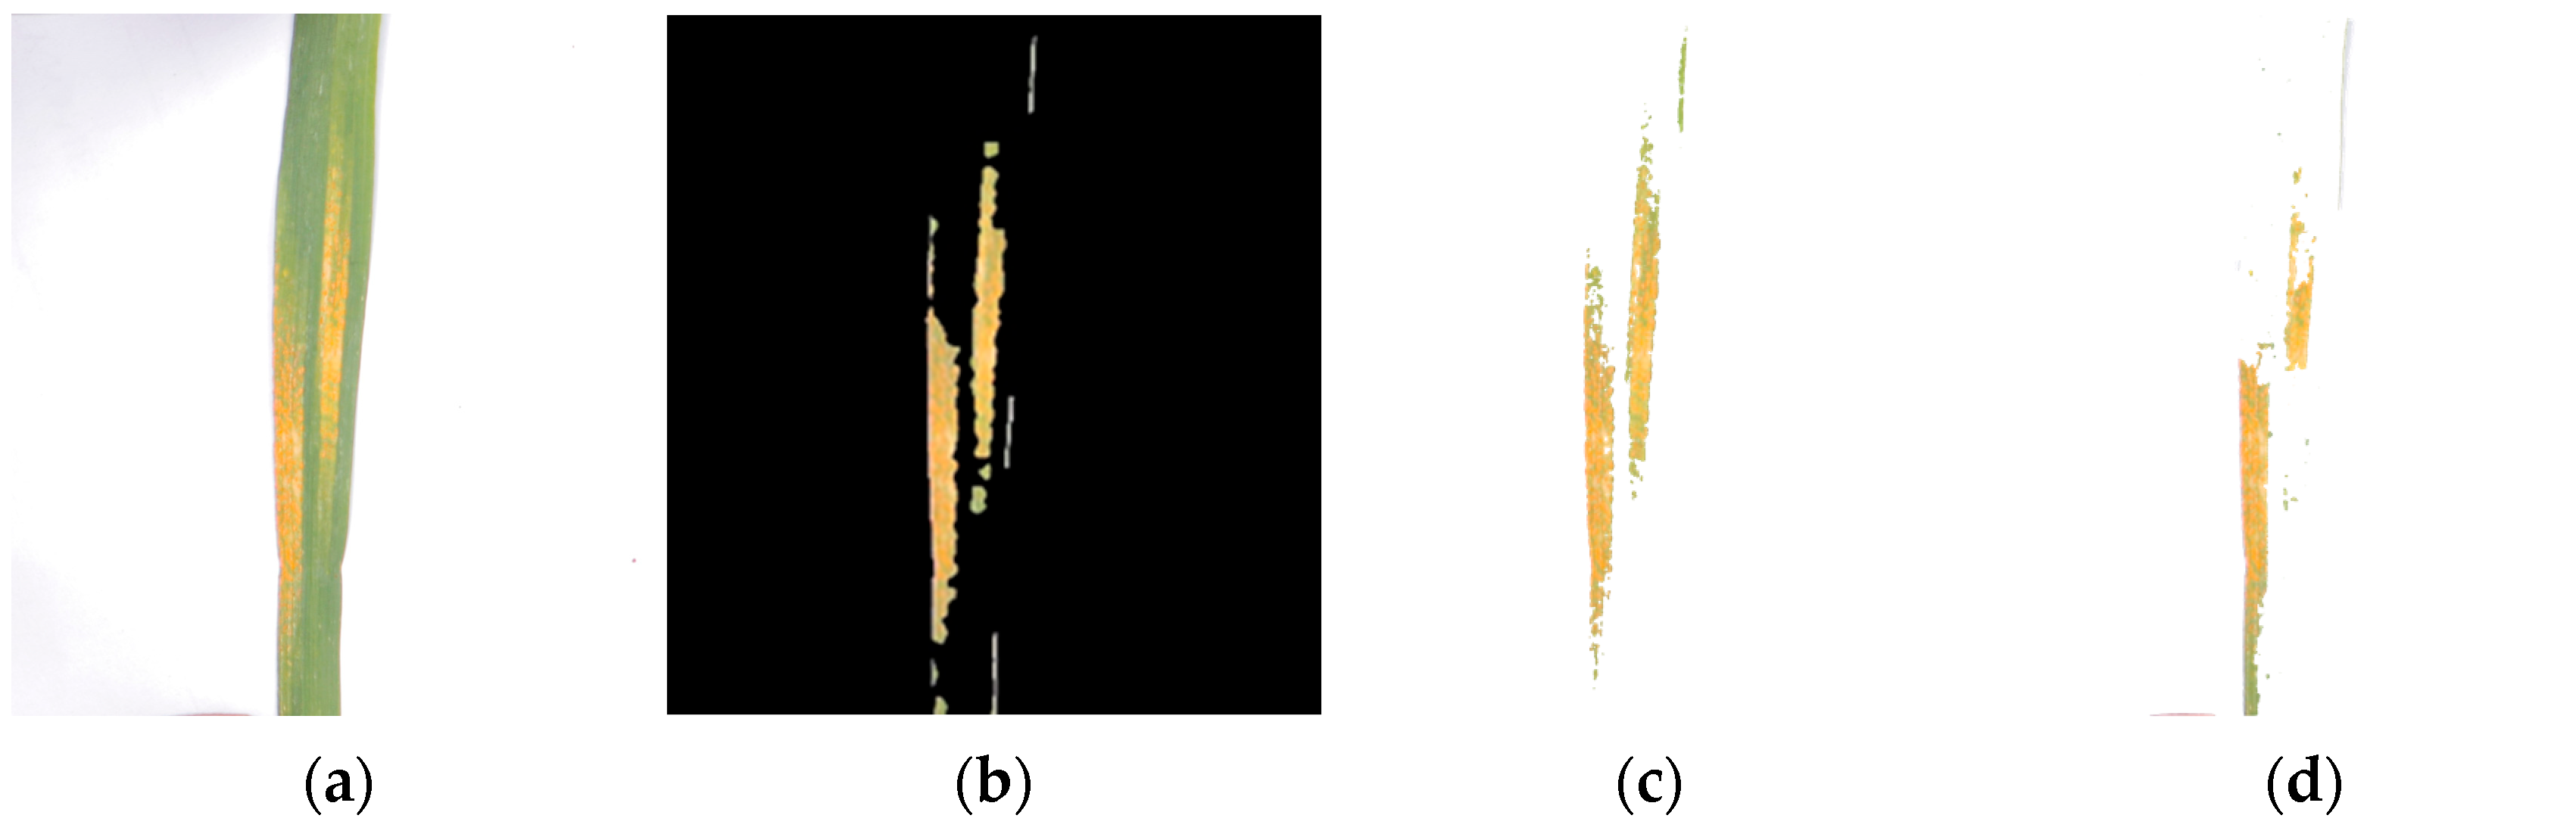
2.5.2. Methods for Wheat Stripe Rust Lesion Extraction

To verify the advantages of the proposed lesion extraction method, the Watershed Segmentation [36] and K-means [37] clustering algorithm were used for comparison. The Watershed Segmentation is an image segmentation algorithm based on geographical morphological analysis, which classifies different objects by mimicking the geographical structures (such as ridges and valleys) on the Earth’s surface. The watershed segmentation method is effective in handling complex image features, exhibiting excellent recognition capabilities for features such as edges and corners. It provides accurate localization and high stability. However, it is associated with a large computational burden, prolonged processing times, and a tendency to produce over-segmentation phenomena. The K-means algorithm is a distance-based clustering algorithm that assigns similar samples to the same cluster by comparing the similarity between samples. The K-means algorithm is simple to implement, fast in terms of speed, and yields intuitive results. However, it is sensitive to the initial cluster centers and can be influenced by outliers and noise.
The recognition using the aforementioned two algorithms is implemented utilizing the Scikit-image framework (version 0.20.0), in combination with Scikit-learn framework (version 1.1.1) and leveraging NumPy (version 1.23.4). For the K-means algorithm, the number of clusters (n_clusters) was set to 5. As for the watershed algorithm, the parameters and other settings were left at their default values.

2.6. Accuracy Evaluation Metrics

2.6.1. Accuracy Evaluation Metrics for the Identification Model

To evaluate the performance of the wheat stripe rust disease lesion recognition model, select precision, recall, F1 score, accuracy, and ten-fold cross-validation evaluation score were chosen as the evaluation indicators. Precision represents the proportion of true positive samples among all samples predicted as positive. Recall represents the proportion of correctly classified positive samples among all positive samples. F1 score is the harmonic mean of precision and recall. Accuracy is the percentage of correctly predicted samples among the total number of samples, indicating the overall prediction accuracy. Ten-fold cross-validation is a method used to evaluate the accuracy of a model. It involves dividing the dataset into 10 equal parts, using 9 parts for training and the remaining 1 part for testing. This process was repeated 10 times, with each iteration using a different subset as the testing data. The final cross-validation evaluation score is obtained by averaging the predictions from the 10 tests. The formulas for calculating precision, recall, F1 score, and accuracy are shown in Equations (4)–(7).
p r e c i s i o n = T P T P + F P
r e c a l l = T P T P + F N
F 1 = 2 × p r e c i s i o n × r e c a l l p r e c i s i o n + r e c a l l
a c c u r a c y = T P + T N T P + F P + F N + T N
In the formulas, TP represents true positives (samples predicted as positive and actually positive), FP represents false positives (samples predicted as positive but actually negative), FN represents false negatives (samples predicted as negative but actually positive), and TN represents true negatives (samples predicted as negative and actually negative).

2.6.2. Accuracy Evaluation Metrics for Prediction Results

To assess the accuracy of the model’s prediction results, the Structural Similarity Index (SSIM), Learned Perceptual Image Patch Similarity (LPIPS), and Mean Square Error (MSE) were selected as evaluation metrics. SSIM is a metric for quantifying the structural similarity between two images. The SSIM value ranges from 0 to 1, where a higher value indicates higher similarity between the images. If two images are exactly the same, the SSIM value is 1. Perceptual loss is used to measure the difference between two images. This metric learns the inverse mapping from generated images to ground truth, forcing the generator to learn the inverse mapping from fake images to reconstruct real images, giving priority to the perception similarity between them. LPIPS measures the difference between two images by learning the perceptual similarity between them. It simulates human perception of image differences through the learning of a neural network. Its objective is to provide a better measure of image similarity that aligns with human subjective perception. By calculating the similarity of image blocks and paying more attention to the details between these blocks, it achieves greater accuracy and objectivity compared to human visual inspection. A lower LPIPS value indicates higher similarity between the images. Mean Square Error (MSE) is used to compare the images of lesions extracted by algorithms with those manually extracted through visual inspection. It measures the differences between algorithmic and manual interpretations to assess the image quality of lesion extraction results based on the algorithm. The average is computed for each pair of pixel values between manually inspected results and algorithmic results, where the difference for each pixel is squared, summed, and then averaged to obtain the MSE value. The range is [0, +∞), with a value of 0 indicating a perfect match between predicted and actual values. The larger the value, the greater the error. The formulas for calculating SSIM, LPIPS, and MSE are shown in Equations (8)–(10).
S S I M x , y = 2 μ x μ y + c 1 2 σ x y + c 2 μ x 2 + μ y 2 + c 1 σ x 2 + σ y 2 + c 2
d x , x 0 = l 1 H l W l h , w w l y ^ h w l y ^ 0 h w l 2 2
M S E = 1 n i = 1 n ( y i y ^ i ) 2
In Equation (8), x and y are input images, μ x and μ y are the mean values of x and y, σ x 2 and σ y 2 are the variances of x and y, σ x y is the covariance between x and y, and c 1 and c 2 are constants. In Equation (9), d x , x 0 is the metric for LPIPS, where d represents the distance between x 0 and x, the feature maps are extracted at the L layer and normalized along the channel dimension, and the L 2 distance is computed after scaling the activation channels with the vector w l , followed by spatial averaging and channel summation. In Equation (10), n is the number of samples, y i represents the true value, and y ^ i represents the predicted value.

3. Results and Discussion

3.1. Results of the SLIC Superpixel Segmentation

In order to determine the appropriate size, based on the existing experimental segmentation experience, parameter settings were established through comparative experiments to observe the segmentation results under different parameters. This comparative experiment used multiple wheat stripe rust images of different sizes and set the parameter size to 5000, 4500, 4000, 3500, 3000, 2500, 2000, 1500, and 1000, and the SLIC algorithm was used for image segmentation. The partial segmentation results for different size parameters are shown in Figure 5.
From Figure 5, it can be observed that the segmentation results are generally good for the leaf edges and lesion areas. When the segmentation parameter size is set to 5000, some lesion areas are not well separated from the healthy regions, and some leaf edges are connected to the background, resulting in poor segmentation results. When the size is set to 4500, the segmentation results for the lesion areas are more detailed compared to the size parameter of 5000, but there are still a few small lesions that are not well separated. When the size parameter is set to 4000, it shows good segmentation results on smaller-sized leaves but poor results on larger-sized leaves. When the size parameters are set to 3000, 2500, 2000, 1500, and 1000, the segmentation results are good for different-sized images, but there is over-segmentation in some cases. When the size parameter is set to 3500, it achieves good segmentation results for leaf edges and background in different-sized images. Therefore, based on the experimental results, the size parameter of 3500 was selected for image segmentation. The segmented subregion images with the optimal parameters are shown in Figure 6.

3.2. Results of the Sub-Region Classification

3.2.1. Results of the Classification Model Training

After determining the segmentation parameters, the wheat leaf images were divided into subregions using the SLIC superpixel segmentation algorithm. A total of 2284 subregion images were obtained, including 1142 images of lesion areas and 1142 images of healthy regions. The dataset was randomly divided into a training set (1827 images) and a testing set (457 images) with an 8:2 ratio. Using training samples for training, precision, recall, F1 score, and accuracy were selected as evaluation metrics for the test set. The evaluation metrics values for the Random Forest, XG Boost, and Ada Boost models were calculated separately. Additionally, ten-fold cross-validation was performed on the training set to validate the training results of the models. The experimental results are shown in Table 2.
From Table 2, it can be seen that compared to XG Boost, the recognition accuracy in the lesion area of the random forest algorithm is improved, with an increase of 2.4% in accuracy and 0.52% in F1 score, but a decrease of 1.31% in recall. In the healthy area recognition, the recall and F1 score increase by 2.62% and 0.79%, respectively, while the accuracy decreases by 1%. Overall, the accuracy, recall, and F1 score of the random forest are better than those of XG Boost, with an accuracy increase of 0.66% and a cross-validation score increase of 1.04%. Compared to Ada Boost, the random forest improves the accuracy, recall, and F1 score in the lesion area by 12.11%, 9.21%, and 10.64%, respectively, and the improvements in the healthy area are 9.42%, 12.23%, and 10.8%. Overall, the classification accuracy of the random forest is superior to that of Ada Boost in terms of accuracy, recall, and F1 score, with an accuracy increase of 11.16% and a cross-validation score increase of 6.95%. The results indicate that the random forest classifier performs best in the sub-region image classification task, has high accuracy and stability in recognizing lesion areas, and has better generalization ability than the other two classifiers, making it suitable for the classification task in this study.

3.2.2. Results of the Classification Model Predictions

To evaluate the prediction results of the three models, the Structural Similarity Index (SSIM), Learned Perceptual Image Patch Similarity (LPIPS), and Mean Square Error (MSE) were used as evaluation metrics. The model’s lesion area prediction results were compared using these metrics, and the results are shown in Figure 7 and Table 3.
From Figure 7 and Table 3, it can be seen that among the three models, the Random Forest algorithm performs best in predicting the classification of wheat stripe rust disease lesions and healthy areas with artificial visual inspection as the true value. Compared to XG Boost and Ada Boost, the LPIPS of Random Forest decreases by 0.00175 and 0.02225, and the SSIM increases by 0.004425 and 0.015125, while the MSE decreases by 0.424575 and 1.3892. This indicates that the results of the Random Forest have the best image quality and are the closest to the artificial visual interpretation, verifying the superiority of the Random Forest model. In summary, among the three models, the Random Forest algorithm is most suitable for classification of wheat stripe rust disease lesions and healthy areas, with high classification accuracy and good prediction effect. Therefore, this study selects the Random Forest algorithm to implement the identification of wheat stripe rust disease lesions.

3.3. Results of the Wheat Stripe Rust Lesion Extraction

To explore the advantages of the proposed lesion extraction method, a comparative experiment was conducted using the Watershed Segmentation and K-means clustering algorithms for lesion segmentation and extraction. The results were evaluated using the Structural Similarity Index (SSIM), Learned Perceptual Image Patch Similarity (LPIPS), and Mean Square Error (MSE) metrics. The results are shown in Figure 8 and Table 4.
From the segmentation results, it can be observed that the Watershed Segmentation method had poor lesion extraction results, with some lesion areas not being properly extracted. The K-means segmentation method achieved good extraction results but failed to extract some faded lesion areas. According to Table 4, using manual evaluation as the ground truth, the proposed lesion extraction method achieved the best results. Compared to the K-means segmentation method, the proposed method showed a decrease of 0.03 in LPIPS, an increase of 0.0282 in SSIM, and a decrease of 1.2815 in MSE. Compared to the Watershed Segmentation method, the proposed method showed a decrease of 0.036 in LPIPS, an increase of 0.0585 in SSIM, and a decrease of 2.0421 in MSE. These results indicate that the proposed method has the best performance for lesion extraction in wheat stripe rust, providing advantages in terms of accuracy and objectivity by reducing the influence of human factors.

3.4. Results of the Wheat Stripe Rust Severity Identification

After obtaining complete wheat stripe rust leaf images, the images were segmented into visually similar superpixel blocks using the SLIC superpixel segmentation algorithm. Then, the random forest model was used to predict the categories of the superpixel blocks, and the lesion areas and healthy regions were merged based on the classification results. Next, the pixel counting method was used to count the number of pixels in the merged lesion area and the healthy region. The severity percentage s, representing the lesion area as a percentage of the total leaf area, was calculated using Equation (3). Finally, based on the severity percentage, the severity level of wheat stripe rust could be determined. The merged image results and severity level determination are shown in Figure 9.

4. Conclusions

In response to the current status of wheat stripe rust severity recognition research, there is a lack of high-precision severity recognition methods for small-sample data and the irregular edge of wheat stripe rust lesions is difficult to outline and extract. Based on a small-volume public dataset “Wheat Leaf Dataset”, this study conducts research on the detailed segmentation and extraction of wheat stripe rust lesion areas and proposes a wheat stripe rust severity recognition method that combines the SLIC superpixel segmentation method with the random forest algorithm. The main conclusions are as follows:
(1) Based on the idea of segmenting images before merging them, the SLIC superpixel segmentation method realizes pixel-level sub-regional image segmentation of wheat leaves by determining the optimal segmentation parameters of the image. Without manual intervention, the edge of the lesion area can be well outlined and extracted, achieving good segmentation results. Furthermore, the segmented images can be used as samples to expand the dataset, making it highly practical.
(2) To achieve refined extraction of wheat stripe rust lesions, a sample set was constructed based on segmented subregion images. Random Forest, XGBoost, and AdaBoost models were separately established for accuracy comparison. The results indicate that the Random Forest model performs the best, with a classification accuracy of 93.22% and a cross-validation score of 90.47%. It shows a significant improvement compared to the two contrasting models, demonstrating the Random Forest classification algorithm as the most suitable for this study. The model’s classification results can serve as the basis for merging various lesion subregions, thereby achieving the segmentation of leaf lesions and healthy regions. The proposed lesion extraction method in this paper reduces the impact of human factors, enhancing the objectivity and reliability of the research results.
(3) Taking the manually observed results as ground truth, the proposed method was compared with the K-Means clustering method and the watershed segmentation method. The results show that the proposed method achieves the best image quality in lesion extraction, with the smallest image differences and the closest resemblance to the structure and integrity of the real lesions. Therefore, the proposed method demonstrates the best intelligent extraction performance for wheat stripe rust lesions. Based on this, the area proportion of the lesion region is calculated using pixel statistics, enabling the classification and identification of the severity of wheat stripe rust. The proposed method provides an accurate method for severity identification based on area proportion at the leaf scale, allowing for finer disease recognition and providing a scientific basis for green prevention and precise medication. Furthermore, the method can be integrated and developed into a mobile application for farmers and grassroots agricultural technicians, providing scientific guidance for the prevention and control of wheat stripe rust for farmers.

Author Contributions

Conceptualization, R.G. and M.J.; methodology, investigation, formal analysis, R.G., M.J., Y.Z. and F.J.; writing—original draft preparation, R.G.; writing—review and editing, F.J., M.J. and Y.Z.; funding acquisition, M.J. All authors have read and agreed to the published version of the manuscript.

Funding

This work was supported by the Shandong Provincial Natural Science Foundation under Grant [ZR2023MD065].

Institutional Review Board Statement

Not applicable.

Data Availability Statement

The data presented in this study are openly available in Mendeley Data at 10.17632/WGD66F8N6H.1.

Conflicts of Interest

The authors declare that they have no known competing financial interests or personal relationships that could have appeared to influence the work reported in this paper.

References

  1. Liu, W.; Wang, B.; Zhao, Z.; Li, Y.; Kang, Z. A historical review and suggestions for countermeasures against successive epidemics of wheat stripe rust in China. China Plant Prot. 2022, 42, 21–27. (In Chinese) [Google Scholar]
  2. Ma, Z. Researches and control of wheat stripe rust in China. J. Plant Prot. 2018, 45, 1–6. (In Chinese) [Google Scholar]
  3. Zhao, Y.; Jing, X.; Huang, W.; Dong, Y.; Li, C. Comparison of Sun-Induced Chlorophyll Fluorescence and Reflectance Data on Estimating Severity of Wheat Stripe Rust. Spectrosc. Spectr. Anal. 2019, 39, 2739–2745. (In Chinese) [Google Scholar]
  4. Zhao, Y.; Li, X.; Yu, K.; Cheng, F.; He, Y. Hyperspectral Imaging for Determining Pigment Contents in Cucumber Leaves in Response to Angular Leaf Lesion Disease. Sci. Rep. 2016, 6, 27790. [Google Scholar] [CrossRef]
  5. Bohnenkamp, D.; Behmann, J.; Mahlein, A.-K. In-Field Detection of Yellow Rust in Wheat on the Ground Canopy and UAV Scale. Remote Sens. 2019, 11, 2495. [Google Scholar] [CrossRef]
  6. Li, X.; Qin, F.; Zhao, L.; Li, J.; Ma, Z.; Wang, H. Grading identification of wheat stripe rust severity using near-infrared spectroscopy. Spectrosc. Spectr. Anal. 2015, 35, 367–371. (In Chinese) [Google Scholar]
  7. Wang, H.; Ma, Z.; Wang, T.; Cai, C.; An, H.; Zhang, L. Application of hyperspectral imaging in grading identification of wheat stripe rust severity. Spectrosc. Spectr. Anal. 2007, 9, 1811–1814. (In Chinese) [Google Scholar]
  8. Jiang, X. Study on the Estimation Method of the Severity of Wheat Stripe Rust by Near-Ground Remote Sensing. Master’s Thesis, An Hui University of Science and Technology, Huainan, China, 2023. (In Chinese). [Google Scholar]
  9. Zhang, N.; Yang, G.; Zhao, C.; Zhang, J.; Yang, X.; Pan, Y.; Huang, W.; Xu, B.; Li, M.; Zhu, X.; et al. Progress and prospect of hyperspectral remote sensing technology for crop diseases and pests. Natl. Remote Sens. Bull. 2021, 25, 403–422. (In Chinese) [Google Scholar] [CrossRef]
  10. Sladojevic, S.; Arsenovic, M.; Anderla, A.; Culibrk, D.; Stefanovic, D. Deep Neural Networks Based Recognition of Plant Diseases by Leaf Image Classification. Comput. Intell. Neurosci. 2016, 2016, 3289801. [Google Scholar] [CrossRef]
  11. Yuan, H.; Zhu, J.; Wang, Q.; Cheng, M.; Cai, Z. An Improved DeepLab v3+ Deep Learning Network Applied to the Segmentation of Grape Leaf Black Rot Spots. Front. Plant Sci. 2022, 13, 795410. [Google Scholar] [CrossRef]
  12. Wang, C.; Du, P.; Wu, H.-R.; Li, J.; Zhao, C.; Zhu, H. A cucumber leaf disease severity classification method based on the fusion of DeepLabV3+ and U-Net. Comput. Electron. Agric. 2021, 189, 106373. [Google Scholar] [CrossRef]
  13. Guo, W.; Dang, M.; Jia, X.; He, Q.; Gao, C.; Dong, P. Wheat stripe rust disease severity identification based on deep learning. J. South China Agri. Univ. 2023, 44, 604–612. (In Chinese) [Google Scholar]
  14. Mi, Z. Study on Judging Method of Wheat Stripe Rust Infection Level Based on Machine Vision. Master’s Thesis, Northwest A&F University, Xianyang, China, 2022. (In Chinese). [Google Scholar]
  15. Bao, W.; Lin, Z.; Hu, G.; Liang, D.; Huang, L.; Yang, X. Severity Estimation of Wheat Leaf Diseases Based on RSTCNN. Trans. Chin. Soc. Agric. Mach. 2021, 52, 242–252. (In Chinese) [Google Scholar]
  16. Yu, X.; Xu, C.; Wang, D.; Zhang, W.; Qu, W.; Song, H. Identification of Wheat Leaf Diseases Based on SVM Method. J. Agric. Mech. Res. 2014, 36, 151–155. (In Chinese) [Google Scholar]
  17. Pulido Rojas, C.; Solaque Guzmán, L.; Velasco Toledo, N. Weed recognition by SVM texture feature classification in outdoor vegetable crops images. Ing. Investig. 2017, 37, 68–74. [Google Scholar] [CrossRef]
  18. Padol, P.B.; Yadav, A.A. SVM classifier based grape leaf disease detection. In Proceedings of the 2016 Conference on Advances in Signal Processing (CASP), Pune, India, 9–11 June 2016; pp. 175–179. [Google Scholar]
  19. Zhu, J.; Wu, A.; Wang, X.; Zhang, H. Identification of grape diseases using image analysis and BP neural networks. Multimed. Tools Appl. 2019, 79, 14539–14551. [Google Scholar] [CrossRef]
  20. Singh, R.N.; Krishnan, P.; Singh, V.K.; Banerjee, K. Application of thermal and visible imaging to estimate stripe rust disease severity in wheat using supervised image classification methods. Ecol. Inform. 2022, 71, 101774. [Google Scholar] [CrossRef]
  21. Jiang, X.; Feng, H.; Chang, H.; Yang, G.; Yang, X. Classification method of wheat stripe rust disease degree based on digital image. Jiangsu Agric. Sci. 2021, 49, 109–115. (In Chinese) [Google Scholar]
  22. Getachew, H.; Hawi, T. Wheat Leaf Dataset. Mendeley Data, V1.2021. Available online: https://data.mendeley.com/datasets/wgd66f8n6h/1 (accessed on 17 June 2023).
  23. Wang, C.; Chen, J.; Li, W. Review on superpixel segmentation algorithms. Appl. Res. Comput. 2014, 31, 6–12. (In Chinese) [Google Scholar]
  24. Song, X.; Zhou, L.; Li, Z.; Chen, J.; Zeng, L.; Yan, B. Review on superpixel methods in image segmentation. J. Image Graph. 2015, 20, 599–608. (In Chinese) [Google Scholar]
  25. Achanta, R.; Shaji, A.; Smith, K.; Lucchi, A.; Fua, P.; Süsstrunk, S. SLIC Superpixels Compared to State-of-the-Art Superpixel Methods. IEEE Trans. Pattern Anal. Mach. Intell. 2012, 34, 2274–2281. [Google Scholar] [CrossRef]
  26. Achanta, R.; Shaji, A.; Smith, K.; Lucchi, A.; Fua, P.; Süsstrunk, S. SLIC Superpixels; Technical Report; EPFL: Lausanne, Switzerland, 2010. [Google Scholar]
  27. Breiman, L. Random Forests. Mach Learn. 2001, 45, 5–32. [Google Scholar] [CrossRef]
  28. Man, W.; Ji, Y.; Zhang, Z. Image classification based on improved random forest algorithm. In Proceedings of the 2018 IEEE 3rd International Conference on Cloud Computing and Big Data Analysis (ICCCBDA), Chengdu, China, 20–22 April 2018; pp. 346–350. [Google Scholar]
  29. Zhang, Z.; Li, S. Polarimetric SAR image classification based on AdaBoost improved random forest and SVM. J. Univ. Chin. Acad. Sci. 2022, 39, 776–782. (In Chinese) [Google Scholar]
  30. Xu, B.; Ye, Y.; Nie, L. An improved random forest classifier for image classification. In Proceedings of the 2012 IEEE International Conference on Information and Automation, Shenyang, China, 6–8 June 2012; pp. 795–800. [Google Scholar]
  31. Chaudhary, A.; Kolhe, S.; Kamal, R. An improved random forest classifier for multi-class classification. Inf. Process. Agric. 2016, 3, 215–222. [Google Scholar] [CrossRef]
  32. GB/T 15795-2011; Rules for monitoring and forecast of the wheat stripe rust. National Agro-Tech Extension and Service Center; Northwest A&F University: Xianyang, China, 2011.
  33. Li, C.; Li, Y.; Tan, H.; Wang, X.; Zhai, C. Grading Detection Method of Grape Downy Mildew Based on K-means Clustering and Random Forest Algorithm. Trans. Chin. Soc. Agric. Mach. 2022, 53, 225–236. (In Chinese) [Google Scholar]
  34. Chen, T.; Guestrin, C. XG Boost: A Scalable Tree Boosting System. In Proceedings of the 22nd ACM SIGKDD International Conference on Knowledge Discovery and Data Mining, San Francisco, CA, USA, 13–17 August 2016. [Google Scholar]
  35. Freund, Y.; Schapire, R.E. A Decision-Theoretic Generalization of On-Line Learning and an Application to Boosting. J. Comput. Syst. Sci. 1997, 55, 119–139. [Google Scholar] [CrossRef]
  36. Meyer, F. Color image segmentation. In Proceedings of the 1992 International Conference on Image Processing and its Applications, Maastricht, The Netherlands, 7–9 April 1992; pp. 303–306. [Google Scholar]
  37. Chinrungrueng, C.; Séquin, C.H. Optimal adaptive k-means algorithm with dynamic adjustment of learning rate. In IJCNN-91-Seattle International Joint Conference on Neural Networks; IEEE: New York, NY, USA, 1991; Volume 851, pp. 855–862. [Google Scholar]
Figure 1. Partial dataset image. (a) Image of wheat stripe rust leaf; (b) image of healthy leaf; (c) image of septoria disease leaf.
Agriculture 13 02187 g001
Figure 2. Comparison of search scope. (a) Searching globally; (b) searching within limits.
Agriculture 13 02187 g002
Figure 3. Flowchart of image merging after decomposition based on random forest algorithm.
Agriculture 13 02187 g003
Figure 4. Flowchart for wheat stripe rust severity identification.
Agriculture 13 02187 g004
Figure 5. The segmentation results of the images under different given parameters.
Agriculture 13 02187 g005aAgriculture 13 02187 g005b
Figure 6. Partial image segmentation results with optimal parameters.
Agriculture 13 02187 g006
Figure 7. Combined prediction results of different models.
Agriculture 13 02187 g007
Figure 8. Comparison of the extracted lesion results using different methods. (a) original figure; (b) result of the method in this study; (c) result of the k-means method; (d) result of the watershed segmentation method.
Agriculture 13 02187 g008
Figure 9. Results of lesion extraction and severity identification.
Agriculture 13 02187 g009aAgriculture 13 02187 g009b
Table 1. Wheat stripe rust severity grading table.
Disease Severity0 Level1 Level2 Level3 Level4 Level5 Level6 Level7 Level8 Level
Percentage of diseased area relative to total leaf area (%)0151020406080100
Table 2. Comparison of accuracy among different models.
ModelLabelPrecision (%)Recall (%)F1 Score (%)Accuracy (%)Cross-Validation Score
(%)
Random forestDisease94.5791.6793.1093.2290.47
Healthy91.9594.7693.33
Overall93.2693.2293.21
XG BoostDisease92.1792.9892.5892.5689.43
Healthy92.9592.1492.54
Overall92.5692.5692.56
Ada BoostDisease82.4682.4682.4682.0683.52
Healthy82.5382.5382.53
Overall82.4982.4982.49
Table 3. Comparison of similarity between prediction results of different models.
MetricImageModel
RFXG BoostAda Boost
Learned Perceptual Image Patch Similarity (LPIPS)10.0460.0540.086
20.0100.0140.027
30.0100.0140.042
40.0060.0290.038
Average0.0260.027750.04825
Structural Similarity Index (SSIM)10.98400.97970.9629
20.99400.99210.9863
30.99480.99210.9819
40.99730.98850.9785
Average0.9925250.98810.9774
Mean Square Error (MSE)11.38981.77933.3205
20.62570.8191.3649
30.57350.82411.7484
40.23681.10171.9488
Average0.706451.1310252.09565
Table 4. Comparison of similarity in extracted lesion results using different methods.
MetricMethod
Method of This StudyK-MeansWatershed Segmentation
Learned Perceptual Image Patch Similarity (LPIPS)0.0460.0760.082
Structural Similarity Index (SSIM)0.98400.95580.9255
Mean Square Error (MSE)1.38982.67133.4319
Disclaimer/Publisher’s Note: The statements, opinions and data contained in all publications are solely those of the individual author(s) and contributor(s) and not of MDPI and/or the editor(s). MDPI and/or the editor(s) disclaim responsibility for any injury to people or property resulting from any ideas, methods, instructions or products referred to in the content.

