Article

Changes in Soil Organic Matter and Biological Parameters as a Result of Long-Term Strip-Till Cultivation

by
Iwona Jaskulska
1,
Joanna Lemanowicz
2,*,
Bożena Dębska
2,
Dariusz Jaskulski
1 and
Barbara Breza-Boruta
3
1
Department of Agronomy, Bydgoszcz University of Science and Technology in Bydgoszcz, 7 Prof. S. Kaliskiego Street, 85-796 Bydgoszcz, Poland
2
Department of Biogeochemistry and Soil Science, Bydgoszcz University of Science and Technology in Bydgoszcz, 6/8 Bernardyńska Street, 85-029 Bydgoszcz, Poland
3
Department of Microbiology and Food Technology, Bydgoszcz University of Science and Technology, 6 Bernardyńska Street, 85-029 Bydgoszcz, Poland
*
Author to whom correspondence should be addressed.
Agriculture 2023, 13(12), 2188; https://doi.org/10.3390/agriculture13122188
Submission received: 31 October 2023 / Revised: 15 November 2023 / Accepted: 21 November 2023 / Published: 23 November 2023

Abstract

:
The aim of the study was to determine the impact that three cultivation systems—conventional till (CT), reduced till (RT), and strip-till one-pass (ST-OP)—had on the biological parameters of the soil and their relationships with organic matter properties in the row zone (R) and inter-row zone (IR). For this purpose, a long-term static field experiment was carried out, from which soil samples were taken from a depth of 0–20 cm and the following were determined: TOC; TN content and fractional composition of organic matter; activity of dehydrogenases (DEHs), catalase (CAT), alkaline (AlP), and acid phosphatase (AcP); and the abundances of heterotophic bacteria (B), filamentous fungi (F), actinobacteria (Ac), and cellulolytic microorganisms (Ce). Soil samples for biological parameter tests were collected in summer (July) and autumn (October). RT and ST-OP increase the content of TOC, TN, carbon, and nitrogen in the humic and fulvic acid fractions. For the studied groups of microorganisms, the conditions for development were least favourable under CT cultivation. The results show that in July, the activities of DEH and CAT were the highest in ST-OP, whereas in October, they were the highest under CT. AlP and AcP activity were markedly the highest under ST-OP in both months. Enzyme activity was significantly the highest in the IR zone. The results indicate that, of the calculated multiparametric indicators, (AlP/AcP, GMea, BIF, BA12, and TEI), BA12 is a sensitive biological indicator of soil quality.

1. Introduction

Tillage is a practice of agricultural management. It has a significant impact on agroecosystems, crop production, and the environment [1]. Soil inversion may directly and indirectly lead to changes in the soil environment [2]. It affects physicochemical soil properties, nutrient circulation, and microbial activity [3].
Reducing conventional plough cultivation is a key element of conservation agriculture [4,5], which reduces the adverse environmental impacts of field plant production [6]. One technique that extensively reduces soil tillage is zonal tilling, including strip-till. It relies essentially on the deep tilling of strips of soil for growing plants and an unloosened inter-row zone covered with plant residues [7,8,9].
Strip tillage, especially when performed simultaneously with the application of fertilizers and the sowing of seeds (i.e., strip-till one-pass), is growing in popularity globally [10], including in Europe [11,12] and Poland [13].
Strip tillage significantly differentiates the environmental conditions of loosened rows from those of uncultivated inter-rows. The loosened soil warms quickly and allows water to infiltrate, while the unloosened, mulched soil is wetter, retains water longer, and warms more slowly [14,15].
According to Campbell et al. [16], no-till and strip-till leave most of the crop residue on the undisturbed surface, while conventional tillage introduces the residue into the soil. This increases soil contact with the residue, which promotes its rapid decomposition into organic matter through oxidation. Reducing the intensity of soil tillage increases the organic carbon content in the soil, especially its upper layers, and increases its biological activity [17,18,19,20].
One factor shaped by the farming system consists of the chemical and biological parameters of soil. They should be taken into account when assessing soil condition [21]. Due to the sequestration process, soils constitute the largest store of carbon resources [22,23]. Therefore, the mineralisation of soil organic matter (SOC) and the concomitant carbon release and humification processes may have a huge impact on climate change and, consequently, on global warming [24]. Therefore, organic carbon content (TOC) is a fundamental indicator of soil quality.
The physical, chemical, and biological properties of soils are determined by the content of organic matter and its composition. Humic substances (HSs) are the fraction of OM most resistant to decomposition. The composition of HSs includes, among others humic acids (HAs) and fulvic acids (FAs)
One of the most important parameters that indicate the “humus quality” is the ratio of the C content of humic acids to the C content of fulvic acids (CHAs/CFAs). It is assumed that higher ratio values characterise more fertile soils. The values of the CHA/CFA ratio may change as humification progresses and indicate the potential mobility of organic carbon in the soil [25,26]. As reported by, among others, Chantigny [27], Kalbitz [28], Debska et al. [29,30], Si et al. [20], and Debska et al. [31], in agricultural soils, the factor that significantly differentiates the content of humic and fulvic acids and humin fractions, especially in the top layer, is agrotechnical treatments.
Soil microbiota are of fundamental importance for the functionality of agroecosystems and ecological processes in the soil; they regulate the transfer of mineral and organic compounds and participate in the response to environmental changes and anthropogenic disturbances [32,33]. The composition and functionality of the soil microbiome are controlled by abiotic soil properties, including pH, texture, and availability of nutrients and moisture [34], which in turn depend on the agrotechnical treatments applied in agricultural soils. The resource-heavy intensification of agriculture of low crop diversity may impact soil microbial composition and a range of processes, including the circulation of nutrients, degradation of organic matter, stabilisation of soil aggregates, and both symbiotic and pathogenic interactions with plants [35,36]. As new cultivation technologies, including simplified, no-plough, strip cultivation systems come into more widespread usage, the study of their impact on microbial communities is increasingly warranted. Research to date has mainly compared the effects of conventional and organic farming [37,38], while our knowledge about the impact that no-till farming systems have on the soil microbiome is minimal.
Soil contains free extracellular enzymes, adsorbed enzymes stabilised by minerals, and intracellular enzymes found in the living and reproducing cells of microorganisms. Soil enzymes are catalysts for many important soil processes, such as the biosynthetic pathway, decomposition of soil humus, and phosphorus mineralisation, and they determine the quality and health of soils [39,40]. Soil enzymatic activity reflects the degree of environmental pollution and is an early indicator of soil degradation or improvement. This property is also a measure of soil fertility and productivity.
According to Niewiadomska et al. [41] and Niewiadomska et al. [42], cultivation systems determine soil biochemical activity. The adoption of continuous simplified cultivation and no ploughing for several years may increase the TOC content compared to a ploughing system and, thus, the abundance of microorganisms and the level of enzymatic activity in the soil [22,43,44]. Research by Pérez-Brandán et al. [44] has shown that agricultural intensification can change soil biochemical indices more quickly than it changes indicators of soil microbial diversity. Many researchers believe that combining several indices into one would provide a better perception of soil condition than individual parameters [45].
The aim of this study was to compare OM contents, OM compositions, and biological soil properties among three cultivation systems: conventional tillage (plough), ploughless, and strip-till, distinguishing between plant rows and inter-rows. It was also assessed whether biological properties and their related enzymatic fertility indices (AlP/AcP, GMea, BIF, BA12, and TEI) are quick and valuable indicators of soil stress conditions caused by the cultivation system. It was assumed that, in strip cultivation, the intense loosening of rows adjacent to unloosened inter-rows would be a factor shaping the content (and thus quality) of OM and the biological properties of the soil.

2. Materials and Methods

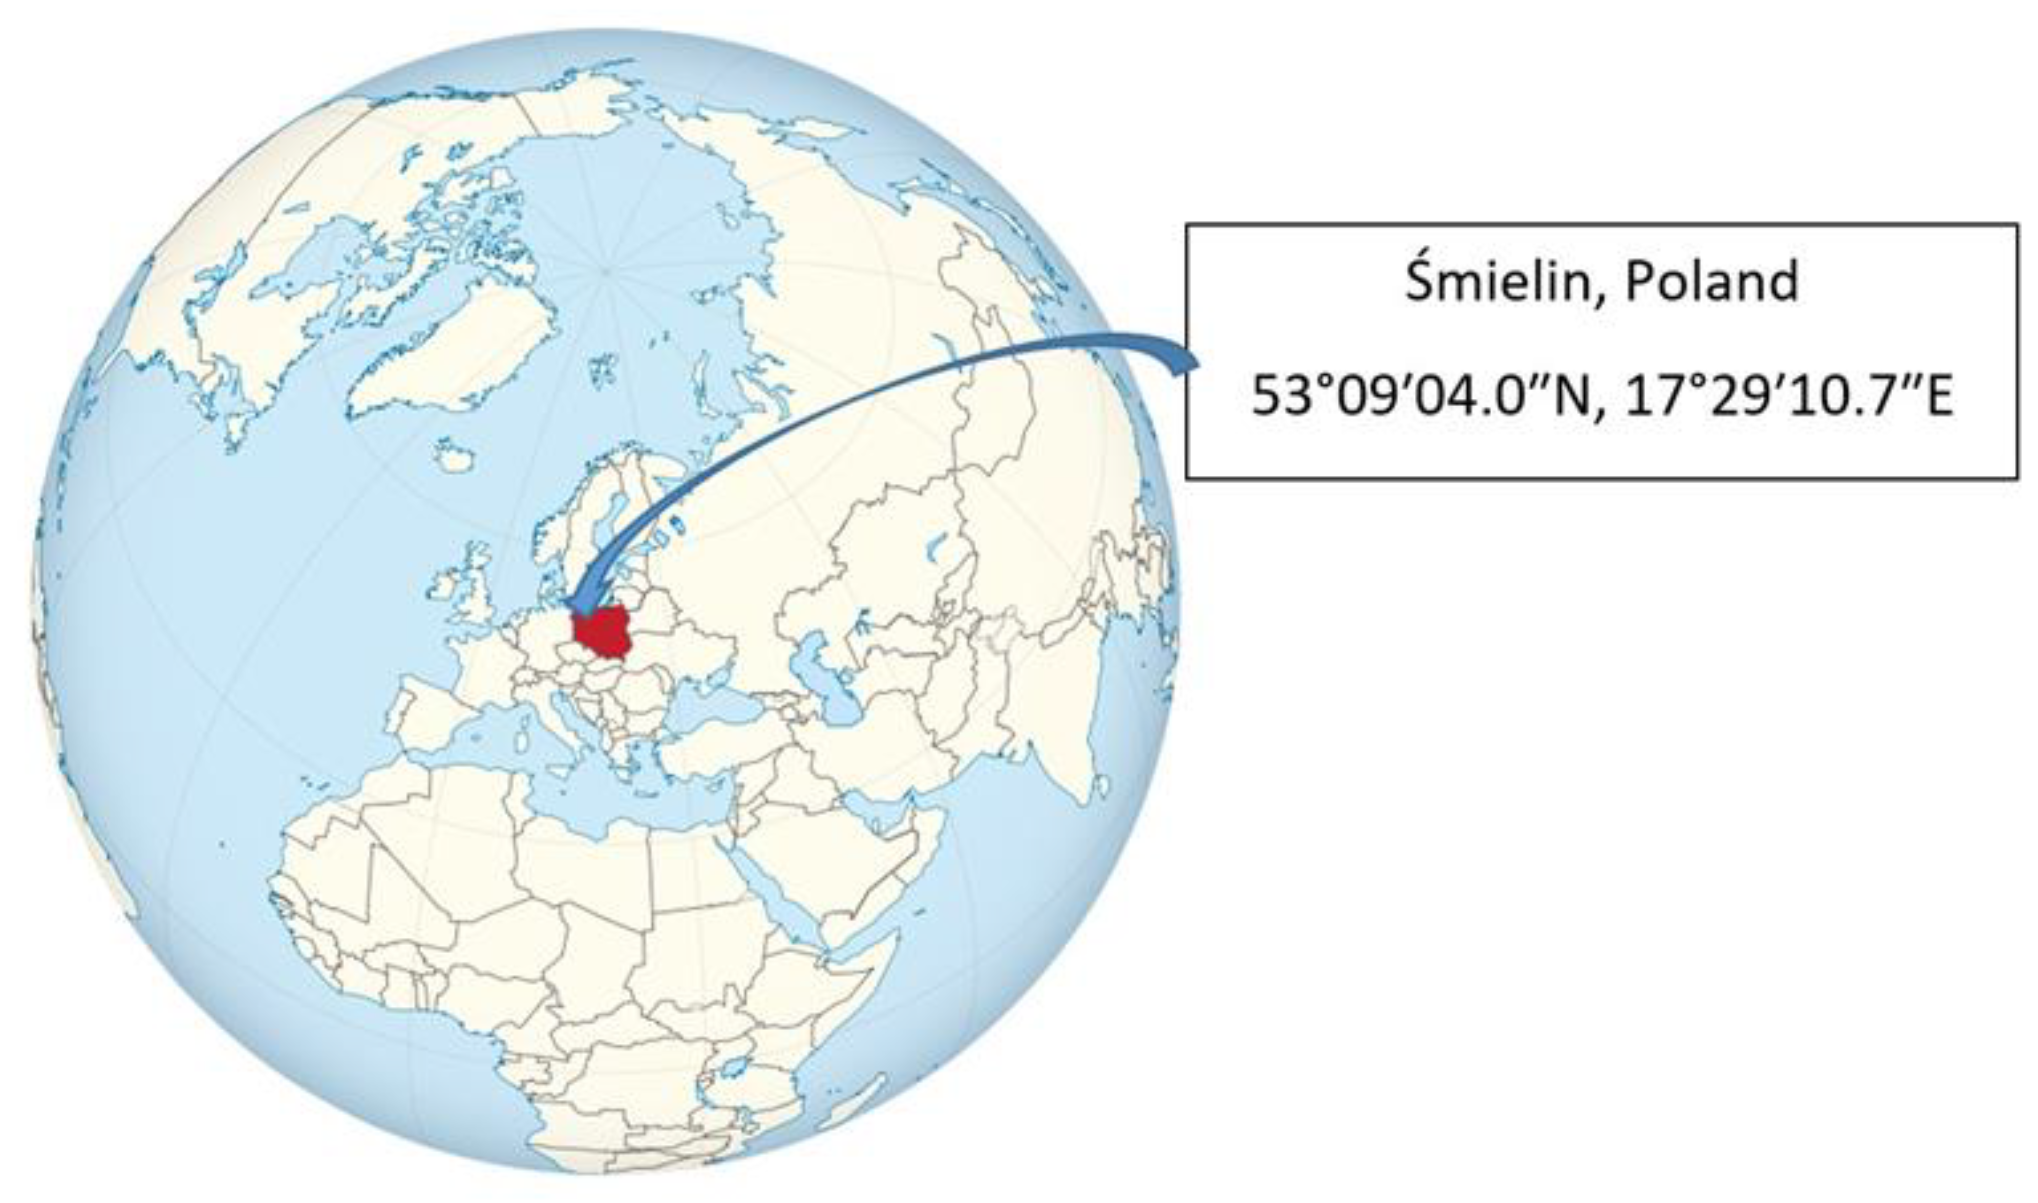
2.1. Experiment Design

The subject of the research was soil samples collected during a long-term field experiment with various soil tillage systems. The experiment was set up in 2012 on Luvisol soils in Śmielin (53°09′04.0″ N, 17°29′10.7″ E; 93.8 m a.s.l.) in the Kuyavian-Pomeranian Voivodeship of Poland (Figure 1).
There were three treatments in the experiment:
conventional tillage, mouldboard plough (CT);
reduced tillage, ploughless cultivation (RT);
strip cultivation, strip-till one-pass (ST-OP).
The soil properties in the research period at the research location, as well as agrotechnical practices performed within individual experimental treatments, have been thoroughly characterised in a previous work [46], and meteorological conditions are shown in Table 1. In the years 2018–2020, crops were grown in a rotation of winter rapeseed–winter wheat. After harvesting winter rapeseed (July) and after sowing winter wheat (October), within each experimental treatment, plots measuring 12 m × 25 m were designated (the same locations in both crops), from which soil samples were taken.

2.2. Methods

2.2.1. Content and Fractional Composition of Organic Matter

Soil samples for the determined organic matter properties were taken immediately after harvest. The samples were dried at room temperature and sieved, and the content of total organic carbon (TOC) and total nitrogen (TN) was determined with the Vario Max CN analyser (Elementar, Germany). The content of carbon and nitrogen in humus fractions: Cd (Nd)—carbon (nitrogen) in solutions after decalcification;
C(HAs + FAs) (N(HAs + FAs)—sum of carbon (nitrogen) of HAs and FAs in extracts obtained with 0.5 M NaOH; and CFAs (NFAs)—carbon (nitrogen) of fulvic acids following humic acid precipitation were assayed with Multi N/C 3100 Analityk Jena (Jena, Germany).
The content of carbon (nitrogen) of humic acids CHAs (NHAs) and humins (C(N)hs was calculated [31]:
C N H A s = C N H A s + F A s C N F A s
C N h = T O C T N C T N H A s + F A s C N d

2.2.2. Microbial Analyses

The total count of heterotrophic bacteria (B), actinobacteria (Ac), filamentous fungi (F), and cellulolytic microorganisms (Ce) was determined using microbiological analyses of soil samples. Ringer’s solution was mixed with ten grams of each soil sample. After homogenisation for 30 min, tenfold serial dilutions were made (10−1–10−6). The soil solutions were then inoculated on appropriate culture media. Total heterotrophic bacteria were isolated on standard nutrient agar, and filamentous fungi were determined on Rose Bengal agar with 0.03 mg mL−1 of streptomycin [47]. The yeast extract–glucose medium (YGA) containing 0.1 mg mL−1 of nystatin was used for isolation of actinobacteria [48]. The cellulolytic microorganisms were determined on the selective agar medium containing 0.1% sodium carboxymethylcellulose and using 0.1% Congo red [49]. Incubation was conducted at 25–28 °C—for 4–5 days for microorganisms and for 10 days for actinobacteria. All determinations were carried out in four replicates. The colony-forming units (CFUs) were quantified per gram of soil dry matter (CFU g−1 d.m. of soil).

2.2.3. Activity of Enzymes in the Soil

Soils for testing the activity of selected enzymes were collected in summer (July) and autumn (October), the same as for microbiological assessment. The activities of selected redox and hydrolytic enzymes were tested in fresh, sieved (<2 mm) soils that had been stored for 2 weeks at 4 °C.
The activity of dehydrogenases (DEHs) (EC 1.1.1) was determined by the method of Thalmann [50];
Catalase activity (CAT) (EC 1.11.1.6) was determined by the method of Johnson and Temple [51];
Alkaline (AlP) (EC 3.1.3.1) and acid (AcP) (3.1.3.2) activity was determined by the method of Tabatabai and Bremner [52].
Based on the enzyme activity results, the following multiparametric indices were calculated:
enzymatic pH indicator [53]:
A l P / A c P
geometric mean GMea [54]:
G M e a = D E H × C A T × A l P × A c P 4
biological index of fertility BIF [55]:
B I F = 1.5 D E H + 100 k C A T 2
where: k is a factor proportionality equal to 0.01.
to assess the total level of enzyme activity (TEI), the following was calculated [56]:
T E I = X i X i ¯
where Xi is the activity of soil enzyme i and is the mean activity of enzyme i in all samples.
biochemical soil activity (BA12) [57] was proposed based on the activities of soil enzymes and the content of the total organic carbon:
B A 12 = l o g 10 T O C D E H + C A T + A l P + A c P

2.3. Statistical Analyses

Based on the results, a two-way analysis of variance (ANOVA) was performed for a split-plot design (random subblocks) using STATISTICA 13 software (Stat Soft Polska 13.3) in order to determine the impact that each tillage system (I factor) and zone (II factor) and interactions between tillage system and plant growth zone had on the content of TOC and TN, fractional composition of organic matter, and soil biological variability (enzyme activity and microbial counts). Tukey’s post hoc test was used to identify significant differences between means. The results of enzyme activity and microbial counts are presented for two terms (July and October). In order to better understand the relationship between the studied parameters, a multidimensional statistical method was used, the principal component analysis (PCA); this allows the number of variables describing a given object to be reduced and also allows the impact that primary variables have on the principal components and the mutual correlations among principal variables to be determined. The results of this analysis are presented as a diagram presenting the features in the system of the first two principal components (PC1 and PC2), which synthetically represent mutually correlated variables. PCA was also used to present correlations between the measured parameters. The work also used cluster analysis (CA). CA allows groups of objects (tillage systems and zones) to be distinguished based on the diversity of variables. Multidimensional cluster analyses are represented graphically using dendrograms. Ward’s method [58] was used to calculate the distance between individual clusters.

3. Results and Discussion

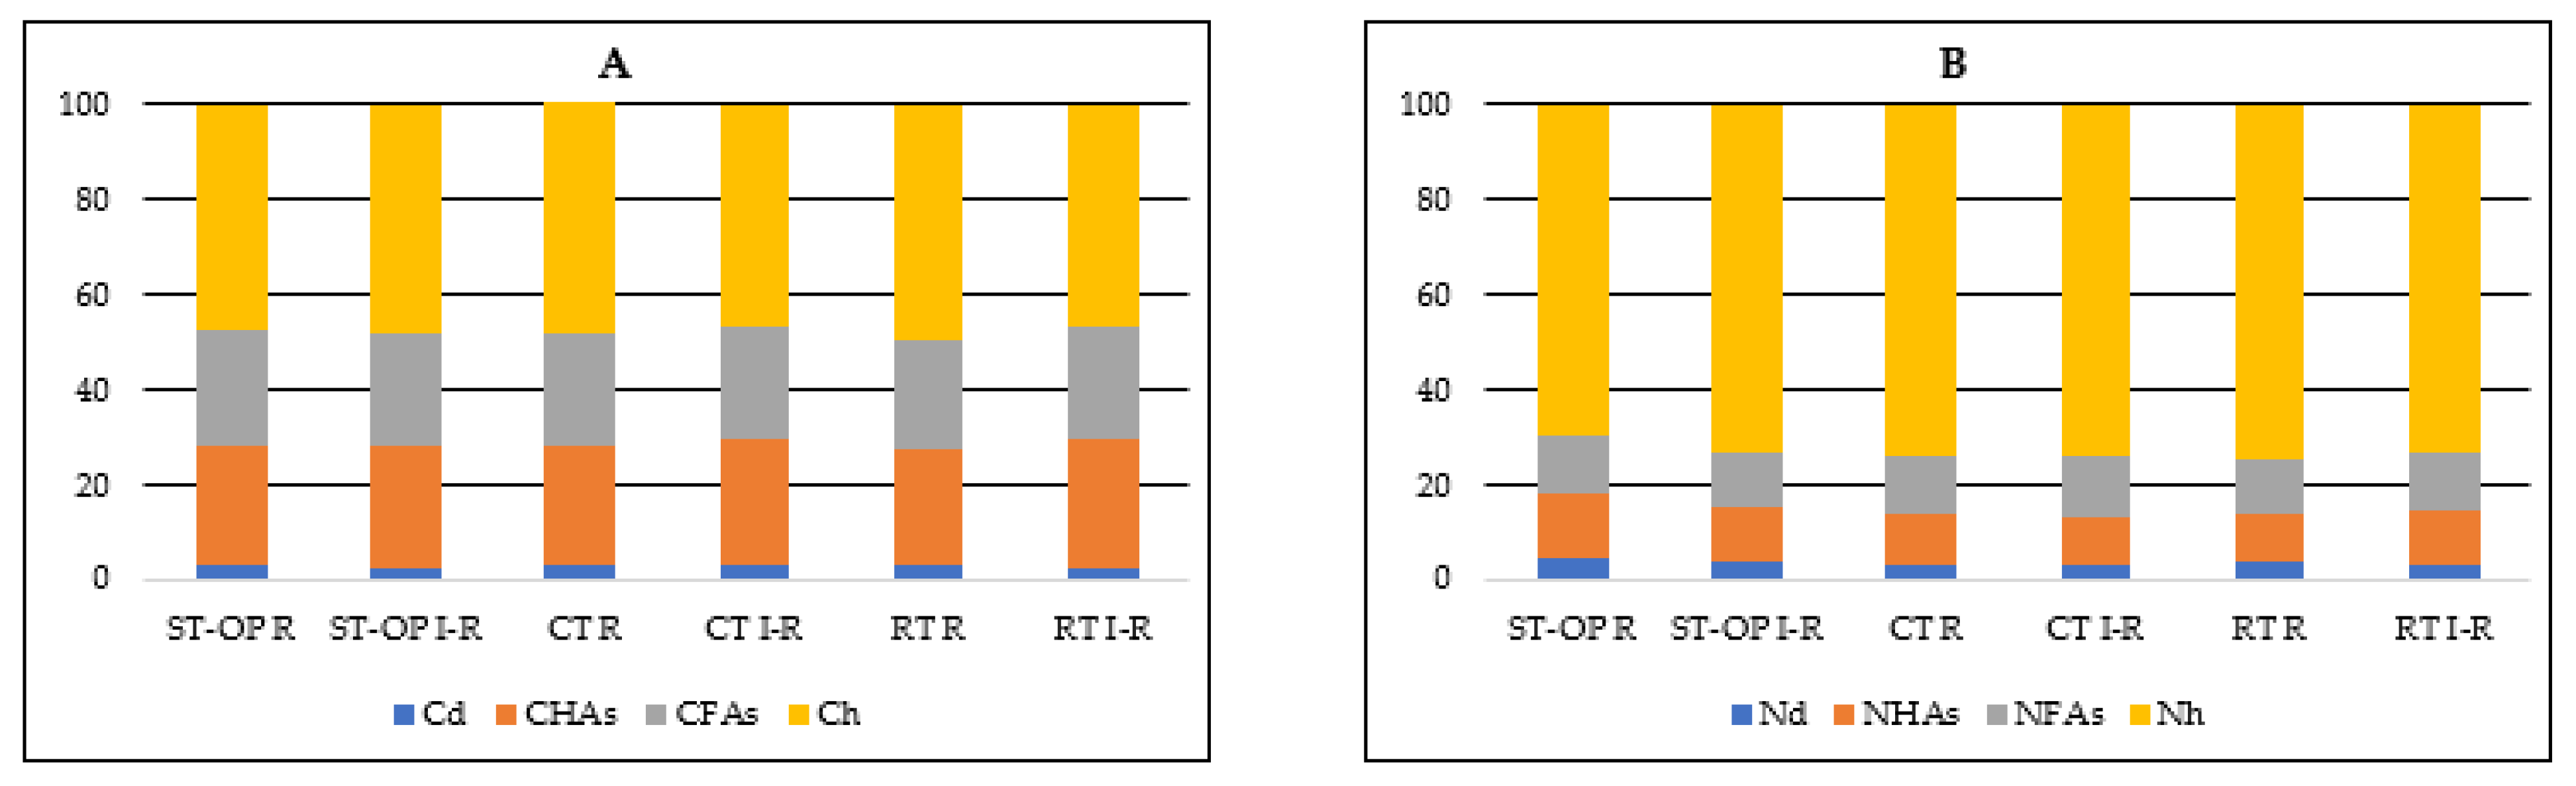
3.1. Content and Fractional Composition of Organic Matter

The organic carbon (TOC) content ranged from 9.36 (CT plough tillage) to 13.08 g kg−1 (ST-OP strip tillage). For ST-OP, samples from (IR) (13.70 g kg−1) had a significantly higher TOC content than samples taken from (R) (Table 2). The TN content ranged on average from 1.11 (CT) to 1.50 g kg−1 (ST-OP). Similar to the TOC content, the only significant difference in TN content between IR and R occurred under ST-OP. Moreover, there were no significant differences in TOC and TN content between RT and ST-OP crops for samples taken from rows. The TOC/TN ratios were similar, and on average, were in the range from 8.44 (CT; ST-OP) to 8.87 (RT). The TOC/TN ratio is the main factor determining the mineralisation of carbon and nitrogen compounds in soil organic matter [59].
In the organic matter fractionation process, the first stage is decalcitation, as a result of which low-molecular-weight organic compounds, which constitute the most labile part of OM, pass into the solution. A significantly higher Cd content was found in soil samples taken under no-plough and ST-OP compared to RT (Table 3). The carbon content in the humic acid (CHA) fraction was significantly higher for RT and ST-OP than for CT. Moreover, significant differences in CHA content were recorded between samples taken from rows and inter-rows. The content of CHAs was higher for the IR variant than for the R variant (in RT and ST-OP variants). The only factor determining the carbon content in the fulvic acid fraction was the tillage system. Similar to the aforementioned Cd and CHA fractions, the content of the CFA fraction was significantly lower for ploughed tillage than for RT and ST-OP. One of the most important indicators of the soil organic matter quality is the ratio of humic acid carbon to fulvic acid carbon (CHA/CFA). Despite differences in the content of CHA and CFA, the ratio values did not differ significantly (mean 1.1). The content of Cd, CHAs, and CFAs significantly and positively correlated with the TOC content being r = 0.493; r = 0.675; and r = 0.993, respectively. This direct relationship between TOC and the content of individual fractions is confirmed by reports in the literature [31,60]. In order to obtain a full picture of the quality of OM, the shares of these fractions should be taken into account (Figure 2A). The share of the Cd fraction ranged from 2.6 (RT) to 3.1% (CT). The shares of CHAs, CFAs, and CHs were on average 26.1, 23.3, and 47.8%. The shares of the CHA, CFA, and CH fractions were not determined by tillage system (factor I) nor by place of sampling (factor II). Because the quality of humus is a characteristic element of the soil in specific habitat conditions, it is of great importance that the agrotechnical treatments used, including tillage systems, do not disturb the balance of the soil system.
The nitrogen content was also determined in isolated OM fractions (Table 4). The nitrogen content of the humic and fulvic acid fractions was determined exclusively by the tillage system. The highest significant content of Nd, NHAs, and NFAs was found in ST-OP samples, and the lowest in samples from RT. The N content in individual fractions correlated significantly and positively with the nitrogen content (Figure 3). The share of nitrogen in the Nd, NHA, and NFA fractions was small and amounted on average to 3.9, 11.7, and 12.0%, respectively. The highest level of nitrogen was determined in the humin fraction. The nitrogen in this OM fraction constituted from 71.51% to 72.4% of total nitrogen (Figure 2B).

3.2. Occurrence of Soil Microorganisms

The results of microbiological tests for the number of total bacteria and filamentous fungi are presented in Table 5, and the results of actinobacteria and cellulolytic microorganisms are in Table 6. The obtained data clearly indicate that the least favourable conditions for the development of soil microorganisms occurred under CT. In soil samples taken from this tillage system, the numbers of total bacteria, filamentous fungi, actinobacteria, and cellulolytic microorganisms were lower than under either RT or ST-OP. Statistical analysis confirmed a significantly higher number of the tested microbial groups in the soil under RT both in the summer period after the rapeseed harvest and in the autumn period under winter wheat cultivation. The greatest differences between RT and CT cultivation were observed in the case of actinobacteria, the abundance of which was 41.3 × 10⁵ cfu dm of soil for CT, 93.5 for RT, and 88.38 for ST-OP. The plant growth zone (factor II) had less influence on the abundance of soil microorganisms; only for bacteria and cellulolytic microorganisms (in autumn) and for actinobacteria (in summer) were there statistically significant differences in their occurrence between Rand IR of the compared tillage systems.
The abundance of soil microorganisms was also influenced by the timing of soil sampling, which was probably due to the significantly higher temperature in July (by about 10 °C) than in October and humidity conditions. Relatively more microorganisms (B, F, and Ce) were isolated in October than in July, with the exception of actinomycetes (As), for which the greatest number were obtained in the summer in the cultivation of CT and RT. It should be added that the greatest differences were noted for the occurrence of filamentous fungi, as there were significantly more of them in the autumn period (on average by about 41%) than in the summer in each of the compared cultivation systems (CT, RT, and ST-OP).
The literature yields few research results on the effects of long-term reduced tillage systems on the soil environment and its biological properties. Seven-year static experiments conducted by Małecka et al. [61] showed that simplified tillage and direct sowing contributed to an increase in the content of TOC and TN and available forms of K and Mg in the surface soil layer, an increase in moisture and bulk density, and a decrease in capillary water capacity. In turn, conventional tillage based on ploughing and other mechanical tillage treatments destroys the natural structure of the soil, causing it to dry out and accelerating the mineralisation of organic matter [46,62,63]. A loss of organic matter destabilizes the soil structure and reduces the water capacity and microbiological activity of the soil. The effects of such a phenomenon were observed in our own research. The results of microbiological analyses showed a significantly lower abundance of the tested groups of microorganisms in CT soil compared to RT, which was statistically confirmed. The results for the abundance of actinobacteria are noteworthy, as they exhibited the greatest differences between the systems, because in the RT system, they were 43% more numerous than under ST-OP and 45% more than under CT. From the phytosanitary perspective, the development of actinobacteria in the soil is very beneficial; their presence can protect against the multiplication of pathogenic fungi [64,65]. The timing of the analyses also influenced the levels of microorganism abundance. Relatively more heterotrophic bacteria, fungi, and microorganisms hydrolysing cellulose were isolated in autumn than in summer, which could be due to a greater influx of organic matter from, among others, accumulated crop residues and fertilizers applied in the cultivation of winter wheat [35,38].

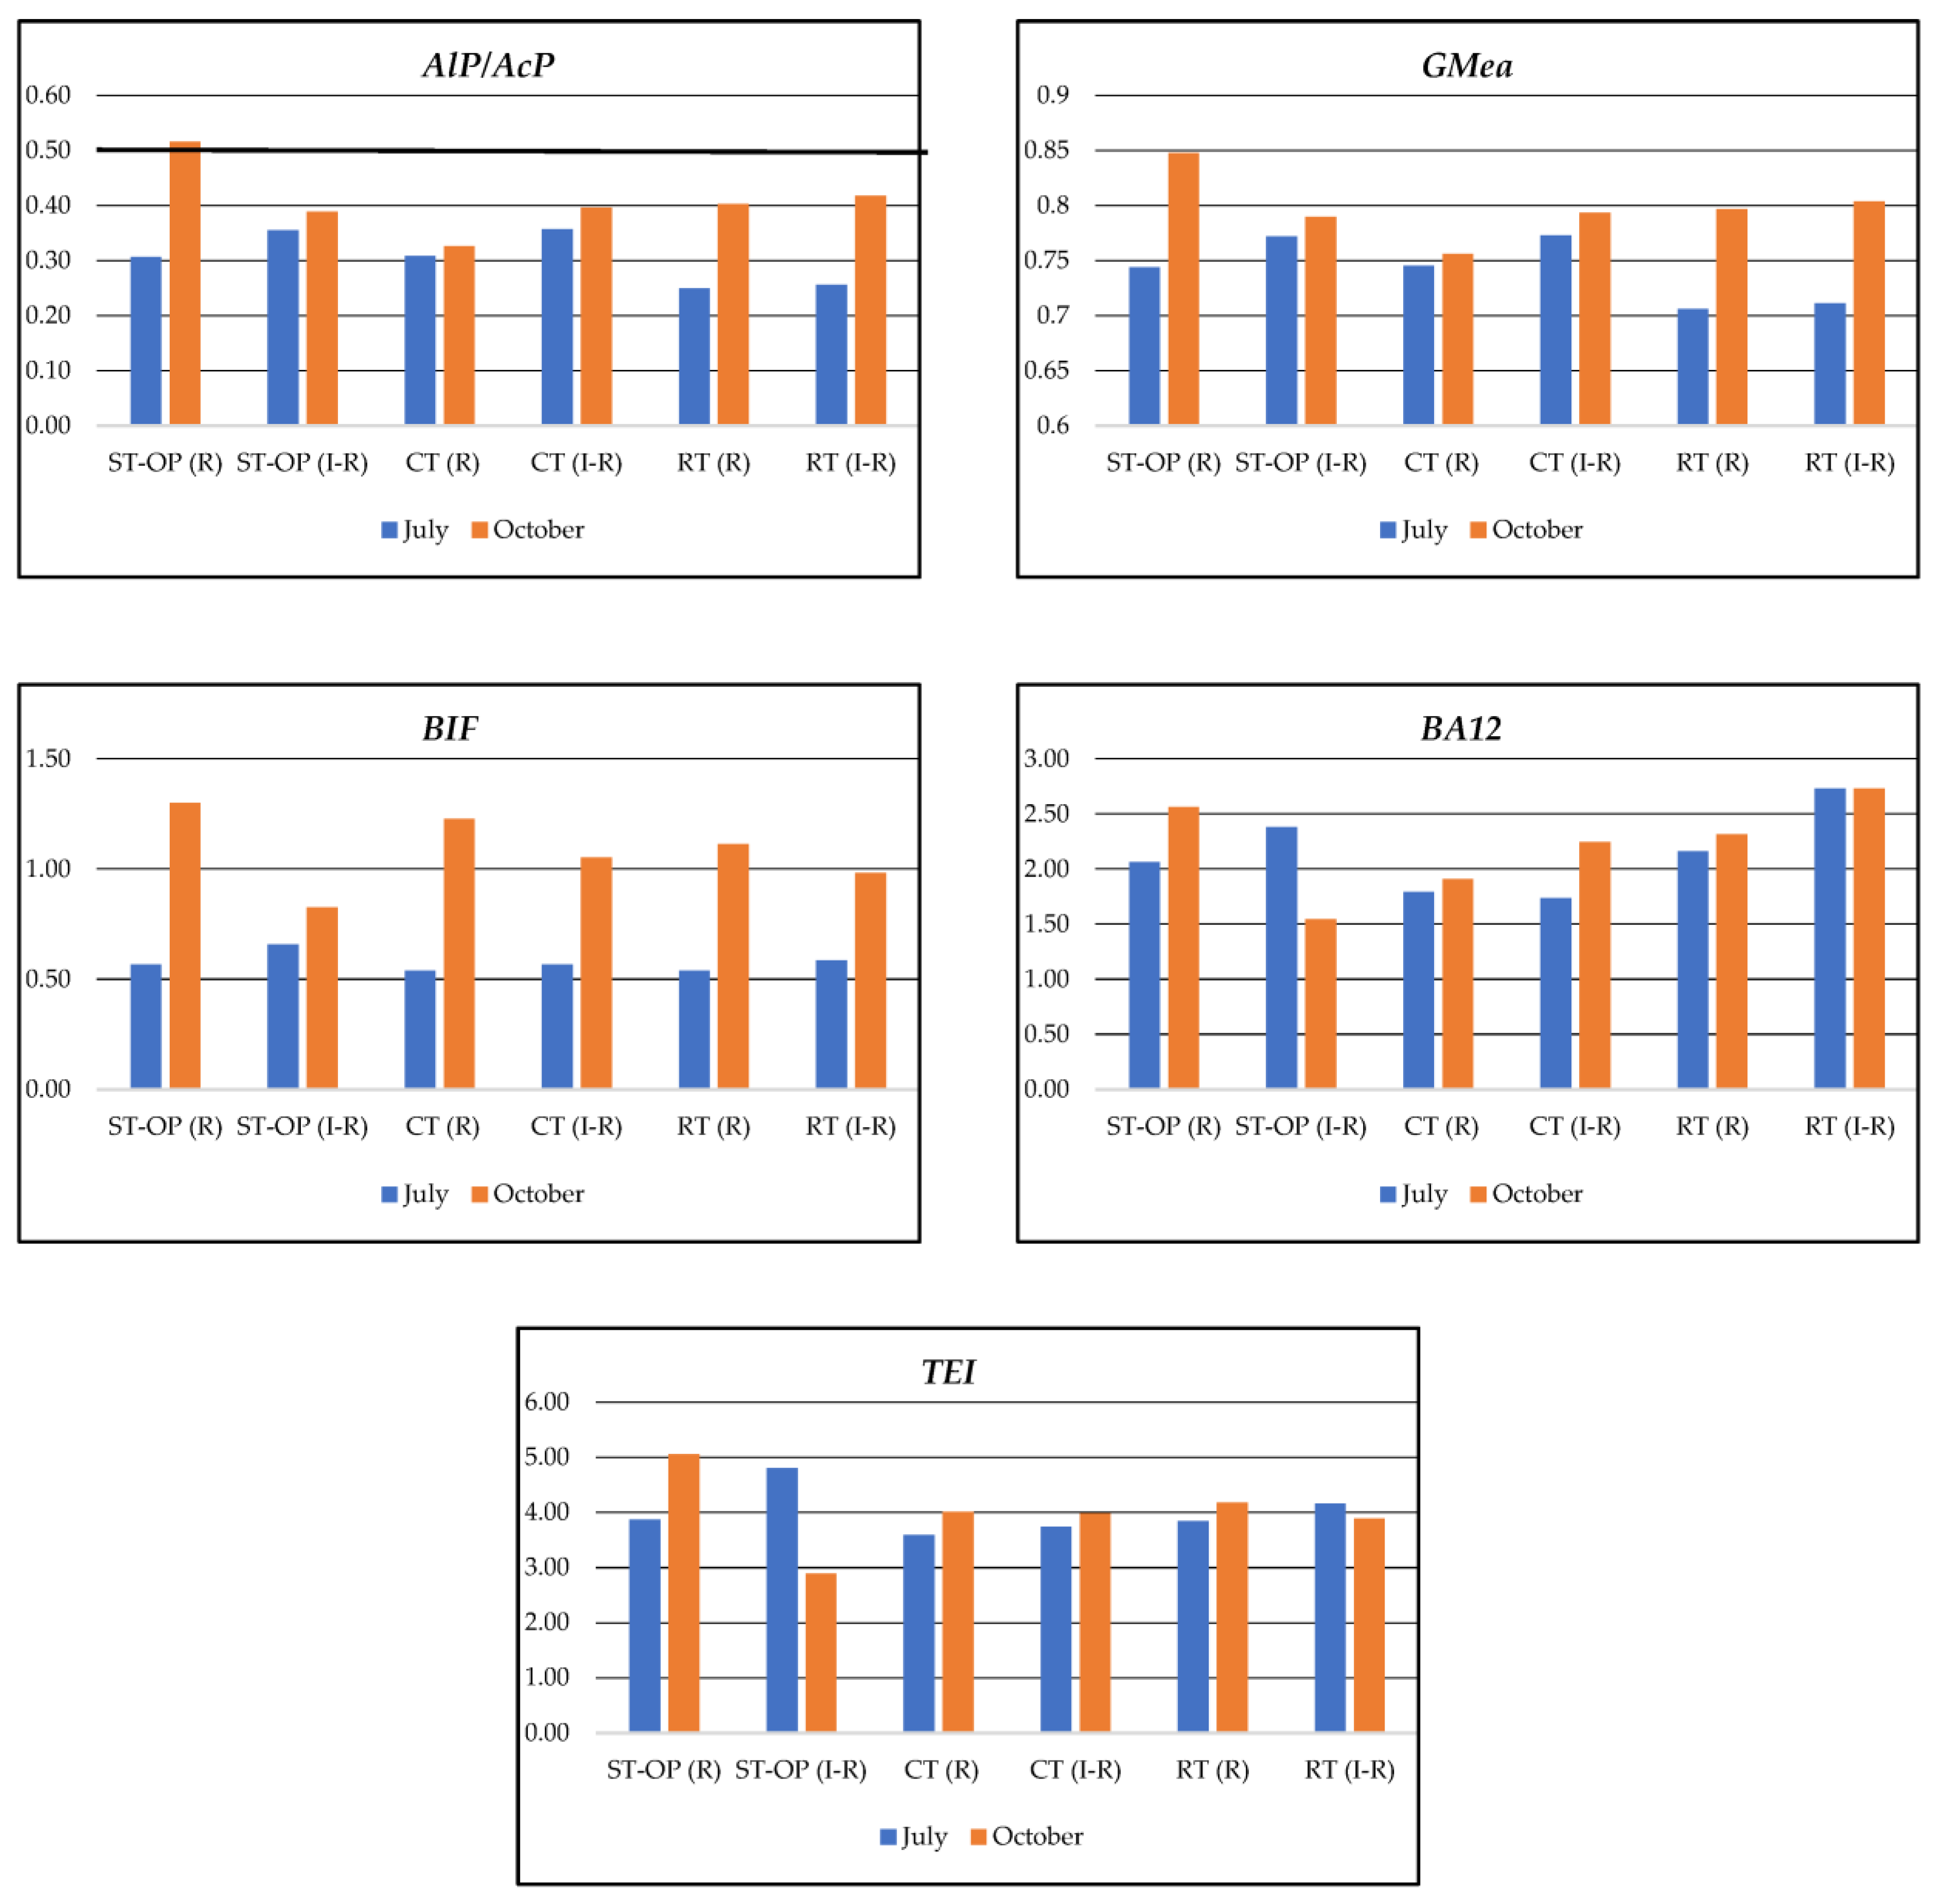
3.3. Activity of Enzymes in the Soil

The test results and the conducted ANOVA indicate a varied response of selected redox and hydrolytic enzymes to the experimental factors used (Table 7 and Table 8). The tillage systems and the crop growth zone were found to significantly affect DEH activity. The highest activity of this enzyme was found under ST-OP in July (average 0.574 mg TPF kg−1 24 h−1). It is believed that ST-OP combines the positive aspects of CT and RT. Long-term studies by Ghosh et al. [66] showed that the practice of double no-till increased the activity of dehydrogenases by 70.75% compared to conventional tillage. CAT activity was markedly the highest under ST-OP (average 0.363 mg H2O2 kg−1 h−1) in July and under CT (average 0.678 mg H2O2 kg−1 h−1) in October. Strip-till is a crop protection system that, among other things, retains moisture in the soil [67]. The long-term maintenance of soil moisture leads to the accumulation of large amounts of hydrogen peroxide, which is decomposed by catalase into water and oxygen, making soil catalase more active. The released oxygen promotes the vital activity of aerobic microorganisms in the soil, thereby increasing the intensity of soil humification and increasing SOC content. CT, such as ST-OP, increased enzyme activity in the soil while increasing organic matter [68,69]. The statistical analysis showed significant (positive) correlations between DEH activity and TOC content (r = 0.561), CHA content (r = 0.634), and CFA content (r = 0.607) and the CHA/CFA ratio (r = 0.627). CAT activity was significantly and positively correlated with the CHA fraction content (r = 0.679) (Figure 4). The relationships obtained confirm the importance of the above-mentioned enzymes in the humification process, which leads to the formation of humus acid resistant to decomposition. This lends further importance to the value of soil in carbon sequestration.
The tested tillage systems differed significantly in the activity of alkaline and acid phosphatase and indicators of phosphorus mineralisation. The highest AlP activity was obtained under ST-OP both in July (average 0.875 mM pNP kg−1h−1) and in October (average 1.152 mM pNP kg−1h−1) (Table 8). The highest AcP activity was obtained under RT in July (average 2.798 mM pNP kg−1h−1) and under ST-OP in October (average 2.462 mM pNP kg−1h−1) (Table 8). Research by Holatko et al. [70] showed that ST-OP combined with the addition of digestate at three different depths (10, 15, and 20 cm) improved the biological properties of the soil. According to Bielińska and Mocek-Płóciniak [43], soil enzymatic activity (dehydrogenases, alkaline and acid phosphatase, and urease and protease) was clearly lower in soils under conventional tillage than in soils under reduced tillage. According to Swędrzyńska et al. [2], differences in activity between tillage systems can be attributed to differences in the distribution of organic matter in the soil and in the water and air conditions within the soil. It should be emphasised that a particularly strong correlation was obtained between AcP and the content of TOC, TN, CHAs, CFAs, NHAs, and NFAs: r = 0.934, r = 0.905, r = 0.535, r = 0.914, r = 0.753, and r = 0.863 (Figure 4). Intensive cultivation practices disturb the soil, and regular removal of the mulch layer reduces the supply of substrate for microorganisms, thereby reducing enzyme activity [71].
According to He et al. [72] and Zuber and Villami [73], no-till (ploughless) and straw return are conservation tillage practices that increase the activity of soil enzymes. The statistical analysis showed significant (positive) correlations between DEH activity and TOC content (r = 0.561), CHA content (r = 0.634) and CFAs (r = 0.607), and the CHA/CFA ratio (r = 0.627). CAT activity was significantly and positively correlated with the CHA fraction content (r = 0.679) (Figure 4). The relationships obtained confirm the importance of the above-mentioned enzymes in the humification process, which leads to the formation of humus acids resistant to decomposition. This lends further importance to the value of soil in carbon sequestration and enzymes in the soil. This is due to the reduction in soil disturbance of the no-till method and its inclusion of straw. This results in a more stable pool of extracellular enzymes in the soil environment. Conditions that ensure that microorganisms are continuously and sufficiently supplied with energy also favour increased enzyme secretion. CT has a negative effect on the niches of soil microorganisms and thus also on the inhibition of enzymatic activity [74]. CT is a cultivation system that increases OM degradation and reduces enzymatic activity; as a result, the soil’s ability to sequester C decreases [75]. In the experiment presented in this study, the TOC content in soil was approximately 37% higher under strip-till and no-plough cultivation than under CT (Table 2).
The activities of DEH, CAT, AlP, and AcP were significantly higher in IR compared to R in July (0.566 mg TPF kg−1 24 h−1, 0.358 mg H2O2 kg−1 24 h−1, 0.831 mM pNP kg−1 24 h−1, and 2.599 mM pNP kg−1 24 h−1, respectively) and in October (1.165 mg TPF kg−1 24 h−1, 0.678 mg H2O2 kg−1 24 h−1, 0.996 mM pNP kg−1 24 h−1, and 2.369 mM pNP kg−1 24 h−1, respectively) in all tested tillage systems. Research by Williams et al. [76] showed that the activity of enzymes (1.4-β-cellobiohydrolase, β-N-acetylglucosaminidase, and acid phosphatase) was higher in rows under ridge-till compared to inter-rows. However, Si and Qiao [77] showed differences in the activity of enzymes (alkaline phosphatase, β-fructofuranosidase, catalase, and cellulase) between the soil in rows and inter-rows, and this difference depended on the enzymes. Usually, inter-rows are left untilled. They are a buffer zone for the changes in soil conditions that frequently occur immediately adjacent to crops. Thus, R and IR are separate functional zones [78]. According to Hatfield et al. [79], under ridge-till, rows are tilled in early spring and the remains of the previous crop are transferred to the surface of the inter-rows. As the summer progresses, these residues are sequestered and gradually converted into SOM. As the data in Table 2 show, the use of ST-OP increased the TOC content in samples taken from IR by approximately 10%, compared to the TOC content in R. It should also be emphasised that the soil OM in IR for the RT and ST variant OP was characterised by approximately 8 and 12% higher CHA content compared to the soil in R. Statistical analysis showed significant positive correlations between the biological parameters of the soil and the TOC content, these being activity of AlP (r = 0.501), AcP (r = 0.934), and DEH (r = 0.560) and abundance of F (r = 0.960), Ac (r = 0.503), and Cf (r = 0.671) (Figure 4). Research by Ghosh et al. [66] showed a higher level of carbon in soil microbe biomass under no-till, as well as higher DEH activity and earthworm population, which in turn increased yields. According to Datta et al. [80], a higher OC content increases the rate of mineralisation by microorganisms, which results in increased enzymatic activity. Soil organic carbon increases the concentration of available substrate in the soil. Increased soil C content often leads to increased water retention, which can increase the diffusion of the substrate and enzymes. A significant positive correlation coefficient was found between the abundance of B and AcP activity (r = 0.697); the abundance of F and AcP (r = 0.877) and DEH (r = 0.525) activities; and the abundance of Ac and AcP activity (r = 0.665). The abundance of Cf was significantly and positively correlated with all the tested enzymes: AlP (r = 0.751), AcP (r = 0.821), DEH (r = 0.732), and CAT (r = 0.635). According to Dantas et al. [81], fungi are the main producers of soil enzymes and may therefore be responsible for the increase in enzyme activity. In the process of catalysing the decomposition of hydrogen peroxide, soil CAT releases oxygen, which promotes the vital activity of aerobic microorganisms in the soil, thereby increasing the intensity of soil humification and OC content.
Seasonal changes in enzyme activity result from hydrothermal conditions, such as precipitation and temperature distributions. These are the factors that most affect the life of microorganisms and related soil enzymatic activity [82]. The activities of DEH, CAT, and AlP were higher in October than in July by 103%, 89%, and 20%, respectively. Research conducted by Stone et al. [83] and Jing et al. [84] showed that higher soil temperatures can increase the activity of soil enzymes. However, in incubation studies, Qi et al. [85] showed a decrease in soil enzymatic activity with increasing temperature. This was attributed to higher rates of SOC decomposition at higher temperatures. There are some differences in temperature sensitivity between different soil enzyme ecosystems [86]. Enzymatic activity may also be influenced by soil water concentrations by changing rates of substrate diffusion. According to German et al. [87], temperature may be more influential than humidity in changing enzyme activity. The key to understanding the seasonality of enzyme activity may lie in the factors regulating various enzyme systems [84]. Enzymes can be regulated by microclimate and soil chemical factors or by substrate availability.
The enzyme activities and selected physicochemical properties together reflect the dynamics of processes occurring in the soil and thus provide information about soil fertility [88,89]. Fertility indicators calculated based on enzyme activity (Figure 3) should result from diverse soil properties and thus should indicate the directions and changes occurring in the soil environment [56,89]. The enzymatic soil pH level index (AlP/AcP) was calculated based on alkaline and acid phosphatase activity results [53]. The value of AlP/AcP was highest in October under ST-OP (R) (0.52). In all other cases, the AlP/AcP value was below 0.5. According to Dick et al. [53], an AlP/AcP value below 0.5 (<0.5) indicates an acid soil reaction. The value of the GMea index ranged from 0.706 (RT, R) to 0.772 (ST-OP, IR) in July and from 0.755 (CT, R) to 0.847 (ST-OP, R) in October. The GMea value was higher in soil in the IR zone than in the R zone. According to Paz-Ferreiro et al. [90], higher GMea values indicate better soil quality. The BIF (Biological Index Fertility) calculated based on the activity of two redox enzymes (DEH and CAT) was higher in October than in July. The highest BIF value was obtained under ST-OP (IR) in July (0.658) and under ST-OP (R) in October (1.299). The BIF is becoming increasingly important in soil assessments [91]. Higher BIF values indicate more fertile soil [55]. The BA12 index calculated based on the TOC content and the activity of the tested enzymes were the highest under RT (IR) in both July and October. To assess the total level of soil enzymatic activity, we calculated the total enzyme activity index (TEI). TEI index values varied depending on tillage system and zone. The TEI was highest under ST-OP (IR) in July (4.80) and under ST-OP (R) in October (5.05). TEI facilitates a simple comparison of the total enzymatic activity and quality of each soil sample [92]. Soil enzymes are parameters that are sensitive to environmental factors, so they are used to assess soil quality [40,93,94].
To demonstrate the relationship among the AlP/AcP, GMea, BIF, BA12, and TEI indicators and TOC content and parameters determining the quality of organic matter and microbiological soil parameters, a Pearson correlation analysis was performed (Table 9). The correlation analysis showed that only BA12 correlated significantly (positively) with both the content and quality parameters of OM as well as microbiological parameters. According to Wyszkowska et al. [57], the activity of BA12 depends primarily on the activity of dehydrogenases and organic carbon content. This confirms the importance of the TOC content in shaping soil biodiversity. According to Mierzwa-Hersztek et al. [92], TEI is usually positively correlated with the content of carbon and nitrogen, which our study also found (r = 0.773, r = 0.780). Moreover, a significant (positive) correlation with the fractional composition of OM was demonstrated (Table 9) though no such clear correlation was obtained for individual enzymes. Research by Nurzhan et al. [95] has shown GM (geometric mean) and WM (weighted mean) and TEI to correlate more highly with selected physicochemical properties of the soil than with the activity of a single enzyme. Our own research shows GMea to correlate more positively with organic carbon (r = 0.652), TN (r = 0.661) and with the carbon and nitrogen content in the humic and fulvic acid fractions. Tan et al. [56] showed that changes in soil use strongly influence the activity of soil enzymes and that TEI was a more sensitive biological indicator of soil quality than GMea. According to García-Ruiz et al. [96], GMea is a good indicator for assessing soil quality because its values correlate with soil properties. The BIF value calculated based on DEH and CAT activity correlated significantly with CHAs/CFAs (r = 0.759), CHA% (r = 0.672), CFA% (r = 0.612), and CH% (r = 0.767). These parameters are basic indicators of the quality (fertility) of OM. Moreover, the shares of individual OM fractions determine its susceptibility to decomposition and thus its importance in the carbon sequestration process. As Bach et al. [97] find, enzymes belonging to the class of oxidoreductases mediate in, among others, lignin degradation processes, humification, and mineralisation of OM into dissolved organic carbon (DOC). Thus, the activity of oxidative enzymes mediate both the degradation and formation of the most resistant components of detrital OM and is therefore closely linked to soil C sequestration.
To explain the diversity of the tested organic matter’s microbiological and enzymatic parameters in terms of the experimental factors used, a multidimensional principal component analysis (PCA) was used, in which the two main components were distinguished that accounted for 72.21% of total variance. Most of the variance was explained by PC1—51.30%, while PC2 explained 20.91% (Figure 4). Properties characterising organic matter had the highest PC1 loads. This component was significantly negatively related with the content of TOC (−0.973), TN (−0.968), CHAs (−0.751), CFAs (−0983), CHAs/CFAs (−0.827), CHAs% (0.518), Nd (−0.806), NHAs (−0.961), NFAs (−0.960), NHAs/NFAs (−0.871), NHAs% (0.641), and NFAs% (−0.762) and the activities of AlP (−0.631), AcP (−0.885), DEH (−0.697), and CAT (−0.599) and F count (−0.954). The load values for the parameters that determine enzymatic activity were lower than those for the quantitative and qualitative parameters of organic matter. Loadings with values >0.75, 0.75–0.5, and 0.5–0.3 can be defined as “strong”, “moderate”, and “weak”, respectively, as per Liu et al. [98]. The second component, PC2, can be interpreted as describing the abundances of microorganisms, because PC2 was significantly and positively related to the numbers of B (0.871) and Ac (0.866) and negatively related to the shares of C and N in the fractions of humic and fulvic acids.
A cluster analysis (CA) performed on the parameters determined similarities and differences between the tillage systems used and the places of sampling (R and IR). The dendrogram (Figure 5), prepared using the method of Ward [58], used the squared Euclidean distance as a measure of similarity. The chart shows two main clusters. Cluster 1 was found to include soils from ST-OP (R), RT (R), RT (IR), and ST-OP (IR). The soil on which conventional tillage was used (CT (R) and CT (IR)) was included in Cluster 2. Cluster 1 group soils were characterised by, among other things, a high content of TOC, CHAs, and CFAs; high enzyme activity (DEH, CAT, AlP, and AcP); and the abundances of the tested groups of microorganisms (B, F, Ac, and Ce). However, the soil included in Cluster 2 had a lower content of TOC, CHAs, and CFAs; lower enzyme activity; and lower numbers of microorganisms.

4. Conclusions

The use of no-till cultivation and strip-till systems increases the content of TOC, TN, carbon, and nitrogen in the fractions of humic and fulvic acids and hydrolytic enzymes (oxidoreducing only in summer) in the soil, as compared to conventional cultivation (CT). CT is the tillage system that creates the least favourable conditions for the development of soil microorganisms.
Strip-till is a tillage system for the values of many tested parameters (e.g., TOC, TN, CHAs, CFAs, DEH, CAT, AlP, and AcP), and they differed significantly between soil samples taken from rows and those from inter-rows. The differences in parameters for strip-till result from differences in soil conditions in the loosened soil. This is particularly important for determining the methodology for collecting soil samples; physical, chemical and biological testing; and, consequently, for interpreting the results.
Among the enzymatic indices presented (AlP/AcP, GMea, BIF, BA12, and TEI), BA12 and TEI correlated most strongly with organic matter properties. Moreover, BA12 correlated strongly with the number of soil microorganisms. The results indicate that soil use strongly influences the activity of soil enzymes, and BA12 is a sensitive biological indicator of soil quality. From the point of view of soil fertility and the quality of organic matter, and thus its role in carbon sequestration, BIF, too, is a very important biochemical indicator. BIF correlated significantly and positively with the basic parameters determining the quality of organic matter: CHAs/CFAs and the participation of carbon of humic and fulvic acids.

Author Contributions

Conceptualisation, I.J. and D.J.; methodology, I.J., D.J., J.L., B.D. and B.B.-B.; formal analysis, J.L., B.D. and B.B.-B.; investigation—performed the field experiments, D.J., I.J., J.L. and B.B.-B.; data curation, J.L., B.D. and B.B.-B.; writing—original draft preparation, I.J., D.J., J.L., B.D. and B.B.-B.; writing—review and editing, I.J., D.J., J.L., B.D. and B.B.-B.; visualisation, J.L. All authors have read and agreed to the published version of the manuscript.

Funding

This research was supported by the National Centre for Research and Development—project POIR.01.01.01-00-0910/17 BZ 218/2018 (Research and development work on an innovative method of strip tillage leading to the development of a highly advanced solution adapted to the conditions prevailing in Central and Eastern Europe).

Institutional Review Board Statement

Not applicable.

Data Availability Statement

Data are contained within the article.

Acknowledgments

The authors thank the company Agro-Land Marek Różniak in Śmielin, Poland, for allowing experimentation in their production field with the use of the strip-till hybrid machine. The authors would like to thank the Faculty of Agriculture and Biotechnology, Bydgoszcz University of Science and Technology for their support in this research work.

Conflicts of Interest

The authors declare no conflict of interest.

References

  1. Hassan, W.; Li, Y.; Saba, T.; Jabbi, F.; Wang, B.; Cai, A.; Wu, J. Improved and sustainable agroecosystem, food security and environmental resilience through zero tillage with emphasis on soils of temperate and subtropical climate regions: A review. Int. Soil Water Conserv. Res. 2022, 10, 530–545. [Google Scholar] [CrossRef]
  2. Swędzyńska, D.; Małecka, I.; Blecharczyk, A.; Swędrzyńskki, A.; Starzyk, J. Effects of various long-term tillage systems on some chemical and biological properties of soil. Pol. J. Environ. Stud. 2013, 22, 1835–1844. [Google Scholar]
  3. Salinas-Garcia, J.R.; Velázquez-García, J.d.J.; Gallardo-Valdez, M.; Díaz-Mederos, P.; Caballero-Hernández, F.; Tapia-Vargas, L.M.; Rosales-Robles, E. Tillage effects on microbial biomass and nutrient distribution in soils under rain-fed corn production in central-western Mexico. Soil Tillage Res. 2002, 66, 143–152. [Google Scholar] [CrossRef]
  4. Reicosky, D.C. Conservation tillage is not conservation agriculture. J. Soil Water Conserv. 2015, 70, 103A–108A. [Google Scholar] [CrossRef]
  5. Kassam, A.; Friedrich, T.; Derpsch, R. Global spread of conservation agriculture. Int. J. Environ. Stud. 2019, 76, 29–51. [Google Scholar] [CrossRef]
  6. Wittwer, R.A.; Bender, S.F.; Hartman, K.; Hydbom, S.; Lima, R.A.A.; Loaiza, V.; Nemecek, T.; Oehl, F.; Olsson, P.A.; Petchey, O.; et al. Organic and conservation agriculture promote ecosystem multifunctionality. Sci. Adv. 2021, 7, eabg6995. [Google Scholar] [CrossRef]
  7. Morris, N.L.; Miller, P.C.H.; Orson, J.H.; Froud-Williams, R.J. The adoption of noninversion tillage systems in the United Kingdom and the agronomic impact on soil, crops and the environment—A review. Soil Tillage Res. 2010, 108, 1–15. [Google Scholar] [CrossRef]
  8. Jaskulska, I.; Jaskulski, D.; Różniak, M.; Radziemska, M.; Gałęzewski, L. Zonal tillage as innovative element of the technology of growing winter wheat: A field experiment under low rainfall conditions. Agriculture 2020, 10, 105. [Google Scholar] [CrossRef]
  9. Li, K.; Hao, Z.; Chen, L.; Sha, Y.; Wang, E.; Sui, X.; Mi, G. Conservation strip-till modifies rhizosphere ammonia-oxidizing archaea and bacteria, increases nitrate accumulation and promotes maize growth at grain filling stage. Soil Tillage Res. 2023, 234, 105821. [Google Scholar] [CrossRef]
  10. Morrison, J.E. Strip tillage for “no-till” row crop production. Appl. Eng. Agric. 2002, 18, 277–284. [Google Scholar] [CrossRef]
  11. Townsend, T.J.; Ramsden, S.J.; Wilson, P. How do we cultivate in England? Tillage practices in crop production systems. Soil Use Manag. 2016, 32, 106–117. [Google Scholar] [CrossRef] [PubMed]
  12. Jaskulska, I.; Jaskulski, D. Strip-Till One-Pass Technology in Central and Eastern Europe: A MZURI Pro-Til Hybrid Machine Case Study. Agronomy 2020, 10, 925. [Google Scholar] [CrossRef]
  13. Różewicz, M. Review of current knowledge on strip-till cultivation and possibilities of its popularization in Poland. Pol. J. Agron. 2022, 49, 20–30. [Google Scholar] [CrossRef]
  14. Tabatabaeekoloor, R. Soil characteristics at the in-row and inter-row zones after strip-tillage. Afr. J. Agric. Res. 2011, 6, 6598–6603. [Google Scholar] [CrossRef]
  15. Williams, A.; Davis, A.S.; Ewing, P.M.; Grandy, A.S.; Kane, D.A.; Koide, R.T.; Mortensen, D.A.; Smith, R.G.; Snapp, S.S.; Spokas, K.A.; et al. A comparison of soil hydrothermal properties in zonal and uniform tillage systems across the US Corn Belt. Geoderma 2016, 273, 12–19. [Google Scholar] [CrossRef]
  16. Campbell, C.A.; McConkey, B.G.; Zentner, R.P.; Selles, F.; Curtin, D. Long-term effects of tillage and crop rotations on soil organic C and total N in a clay soil in southwestern Saskatchewan. Can. J. Soil Sci. 1996, 76, 395–401. [Google Scholar] [CrossRef]
  17. Islam, A.K.M.S.; Saleque, M.A.; Hossain, M.M.; Islam, A.K.M.A. Effect of conservation tillage on soil chemical properties in rice-maize cropping system. Agriculturists 2015, 13, 62–73. [Google Scholar] [CrossRef]
  18. Strickland, T.C.; Scully, B.T.; Hubbard, R.K.; Sullivan, D.G.; Abdo, Z.; Savabi, M.R.; Lee, R.D.; Olson, D.M.; Hawkins, G.L. Effect of conservation practices on soil carbon and nitrogen accretion and crop yield in a corn production system in the southeastern coastal plain, United States. J. Soil Water Conserv. 2015, 70, 170–181. [Google Scholar] [CrossRef]
  19. Haddaway, N.R.; Hedlund, K.; Jackson, L.E.; Kätterer, T.; Lugato, E.; Thomsen, I.K.; Jørgensen, H.B.; Isberg, P.-E. How does tillage intensity affect soil organic carbon? A systematic review protocol. Environ. Evid. 2017, 6, 30. [Google Scholar] [CrossRef]
  20. Si, P.; Liu, E.; He, W.; Sun, Z.; Dong, W.; Yan, C.; Zhang, Y. Effect of no-tillage with straw mulch and conventional tillage on soil organic carbon pools in Northern China. Arch. Agron. Soil Sci. 2018, 64, 398–408. [Google Scholar] [CrossRef]
  21. Bhardwaj, A.K.; Jasrotia, P.; Hamilton, S.K.; Robertson, G.P. Ecological management of intensively cropped agro-ecosystems improves soil quality with sustained productivity. Agric. Ecosyst. Environ. 2011, 140, 419–429. [Google Scholar] [CrossRef]
  22. Scharlemann, J.P.W.; Tanner, E.V.J.; Hiederer, R.; Kapos, V. Global soil carbon: Understanding and managing the largest terrestrial carbon pool. Carbon Manag. 2014, 5, 81–91. [Google Scholar] [CrossRef]
  23. Mayer, M.; Prescott, C.E.; Abaker, W.E.A.; Augusto, L.; Cécillon, L.; Ferreira, G.W.D.; James, J.; Jandl, R.; Katzensteiner, K.; Laclau, J.-P.; et al. Tamm Review: Influence of forest management activities on soil organic carbon stocks: A knowledge synthesis. For. Ecol. Manag. 2020, 466, 118127. [Google Scholar] [CrossRef]
  24. Stockmann, U.; Adams, M.A.; Crawford, J.W.; Field, D.J.; Henakaarchchi, N.; Jenkins, M.; Minasny, B.; McBratney, A.B.; Courcelles, V.R.; Singh, K.; et al. The knowns, known unknowns and unknowns of sequestration of soil organic carbon. Agr. Ecosyst. Environ. 2013, 164, 80–99. [Google Scholar] [CrossRef]
  25. Yang, Z.H.; Singh, B.R.; Sitaula, B.K. Soil organic carbon fractions under different land uses in Mardi Watershed of Nepal. Commun. Soil Sci. Plant Anal. 2006, 35, 615–629. [Google Scholar] [CrossRef]
  26. Cao, Z.; Wang, Y.; Li, J.; Zhang, J.; He, N. Soil organic carbon contents, aggregate stability, and humic acid composition in different alpine grasslands in Qinghai-Tibet Plateau. J. Mt. Sci. 2016, 13, 2015–2027. [Google Scholar] [CrossRef]
  27. Chantigny, M.H. Dissolved and water-extractable organic matter in soils: A review on the influence of land use and management practice. Geoderma 2003, 113, 357–380. [Google Scholar] [CrossRef]
  28. Kalbitz, K.; Geyer, S. Different effects of peat degradation on dissolved organic carbon and nitrogen. Org. Geochem. 2002, 33, 319–326. [Google Scholar] [CrossRef]
  29. Debska, B.; Drag, M.; Tobiasova, E. Effect of post-harvest residue of maize, rapeseed, and unflower on humic acids properties in various soils. Pol. J. Environ. Stud. 2012, 21, 603–613. [Google Scholar]
  30. Debska, B.; Dlugosz, J.; Piotrowska-Dlugosz, A.; Banach-Szott, M. The impact of a bio- fertilizer on the soil organic matter status and carbon sequestration—Results from a field-scale study. J. Soils Sediments 2016, 16, 2335–2343. [Google Scholar] [CrossRef]
  31. Debska, B.; Jaskulska, I.; Jaskulski, D. Method of tillage with the factor determining the quality of organic matter. Agronomy 2020, 10, 1250. [Google Scholar] [CrossRef]
  32. Fierer, N. Embracing the unknown: Disentangling the complexities of the soil microbiome. Nat. Rev. Microbiol. 2017, 15, 579–590. [Google Scholar] [CrossRef] [PubMed]
  33. Delgado-Baquerizo, M.; Maestre, F.T.; Reich, P.B.; Jeffries, T.C.; Gaitan, J.J.; Encinar, D.; Berdugo, M.; Campbell, C.D.; Singh, B.K. Microbial diversity drives multifunctionality in terrestrial ecosystems. Nat. Commun. 2016, 7, 10541. [Google Scholar] [CrossRef] [PubMed]
  34. Qiu, L.; Zhang, Q.; Zhu, H.; Reich, P.B.; Banerjee, S.; van der Heijden, M.G.; Sadowsky, M.J.; Ishii, S.; Jia, X.; Shao, M.; et al. Erosion reduces soil microbial diversity, network complexity and multifunctionality. ISME J. 2021, 15, 2474–2489. [Google Scholar] [CrossRef] [PubMed]
  35. Banerjee, S.; Walder, F.; Büchi, L.; Meyer, M.; Held, A.Y.; Gattinger, A.; Keller, T.; Charles, R.; van der Heijden, M.G.A. Agricultural intensification reduces microbial network complexity and the abundance of keystone taxa in roots. ISME J. 2019, 13, 1722–1736. [Google Scholar] [CrossRef] [PubMed]
  36. Laufer, D.; Loibl, B.; Märländer, B.; Koch, H.J. Soil erosion and surface runoff under strip tillage for sugar beet (Beta vulgaris L.) in Central Europe. Soil Tillage Res. 2016, 162, 1–7. [Google Scholar] [CrossRef]
  37. Schmidt, R.; Gravuer, K.; Bossange, A.V.; Mitchell, J.; Scow, K. Long-term use of cover crops and no-till shift soil microbial community life strategies in agricultural soil. PLoS ONE 2018, 13, e0192953. [Google Scholar] [CrossRef]
  38. Martínez-García, L.B.; Korthals, G.; Brussaard, L.; Jørgensen, H.B.; De Deyn, G.B. Organic management and cover crop species steer soil microbial community structure and functionality along with soil organic matter properties. Agric. Ecosyst. Environ. 2018, 263, 7–17. [Google Scholar] [CrossRef]
  39. Lemanowicz, J.; Bartkowiak, A.; Lamparski, R.; Wojewódzki, P.; Pobereżny, J.; Wszelaczyńska, E.; Szczepanek, M. Physicochemical and enzymatic soil properties influenced by cropping of primary wheat under organic and conventional farming systems. Agronomy 2020, 10, 1652. [Google Scholar] [CrossRef]
  40. Lemanowicz, J.; Bartkowiak, A.; Zielińska, A.; Jaskulska, I.; Rydlewska, M.; Klunek, K.; Polkowska, M. The Effect of Enzyme activity on carbon sequestration and the cycle of available macro- (P, K, Mg) and microelements (Zn, Cu) in Phaeozems. Agriculture 2023, 13, 172. [Google Scholar] [CrossRef]
  41. Niewiadomska, A.; Gaj, R.; Przybył, J.; Budka, A.; Mioduszewska, N.; Wolna-Maruwka, A. Analysis of microbial parameters of soil in different tillage systems under sugar beets (Beta vulgaris L.). Pol. J. Environ. Stud. 2016, 25, 1803–1812. [Google Scholar] [CrossRef] [PubMed]
  42. Niewiadomska, A.; Majchrzak, L.; Borowiak, K.; Wolna-Maruwka, A.; Waraczewska, Z.; Budka, A.; Gaj, R. The influence of tillage and cover cropping on soil microbial parameters and spring wheat physiology. Agronomy 2020, 10, 200. [Google Scholar] [CrossRef]
  43. Bielińska, J.; Mocek-Płóciniak, A. Impact of the tillage system on the soil enzymatic activity. Arch. Environ. Prot. 2012, 38, 75–82. [Google Scholar] [CrossRef]
  44. Pérez-Brandán, C.; Huidobro, J.; Galván, M.; Vargas-Gil, S.; Meriles, J.M. Relationship between microbial functions and community structure following agricultural intensification in South American Chaco. Plant Soil Environ. 2016, 62, 321–328. [Google Scholar] [CrossRef]
  45. Sharma, K.L.; Mandal, U.K.; Srinivas, K.; Vittal, K.P.R.; Mandal, B.; Grace, J.K.; Ramesh, V. Long-term soil management effects on crop yields and soil quality in a dryland Alfisol. Soil Tillage Res. 2005, 83, 246–259. [Google Scholar] [CrossRef]
  46. Jaskulska, I.; Romaneckas, K.; Jaskulski, D.; Gałęzewski, L.; Breza-Boruta, B.; Dębska, B.; Lemanowicz, J. Soil Properties after Eight Years of the Use of Strip-Till One-Pass Technology. Agronomy 2020, 10, 1596. [Google Scholar] [CrossRef]
  47. Atlas, R.M. Handbook of Microbiological Media; CRC Press: Boca Raton, FL, USA, 2010; ISBN 978-0-429-13049-6. [Google Scholar]
  48. Crawford, D.L.; Lynch, J.M.; Whipps, J.M.; Ousley, M.A. Isolation and Characterization of Actinomycete Antagonists of a Fungal Root Pathogen. Appl. Environ. Microbiol. 1993, 59, 3899–3905. [Google Scholar] [CrossRef]
  49. Gupta, P.; Samant, K.; Sahu, A. Isolation of cellulose-degrading bacteria and determination of their cellulolytic potential. Int. J. Microbiol. 2012, 2012, 578925. [Google Scholar] [CrossRef]
  50. Thalmann, A. Zur Methodik der Bestimung der Dehydrogenaseaktivität im Boden mittels Triphenyltetrazoliumchlorid (TTC). Landwirtsch. Forsch. 1968, 21, 249–258. [Google Scholar]
  51. Johnson, J.I.; Temple, K.I. Some variables affecting the measurements of catalase activity in soil. Soil Sci. Soc. Am. 1964, 28, 207–209. [Google Scholar] [CrossRef]
  52. Tabatabai, M.A.; Bremner, J.M. Use of p–nitrophenol phosphate for assay of soil phosphatase activity. Soil Biol. Biochem. 1969, 1, 301–307. [Google Scholar] [CrossRef]
  53. Dick, W.A.; Cheng, L.; Wang, P. Soil acid alkaline phosphatase activity as pH adjustment indicators. Soil Biol. Biochem. 2000, 32, 1915–1919. [Google Scholar] [CrossRef]
  54. Hinojosa, M.B.; Garcia-Ruiz, R.; Viñegla, B.; Carreira, J.A. Microbiological rates and enzyme activities as indicators of functionality in soils affected by the Aznalcóllar toxic spill. Soil Biol. Biochem. 2004, 36, 1637–1644. [Google Scholar] [CrossRef]
  55. Stefanic, F.; Ellade, G.; Chirnageanu, J. Researches concerning a biological index of soil fertility. In Proceeding of the Fifth Symposium of Soil Biology; Nemes, M.P., Kiss, S., Papacostea, P., Stefanic, C., Rusan, M., Eds.; Romanian National Society of Soil Science: Bucharest, Romania, 1984; pp. 35–45. [Google Scholar]
  56. Tan, X.; Xie, B.; Wang, J.; He, W.; Wang, X.; Wei, G. County-scale spatial distribution of soil enzyme activities and enzyme activity indices in agricultural land: Implications for soil quality assessment. Sci. World J. 2014, 2014, 535768. [Google Scholar] [CrossRef] [PubMed]
  57. Wyszkowska, J.; Borowik, A.; Kucharski, M.; Kucharski, J. Applicability of biochemical indices to quality assessment of soil polluted with heavy metals. J. Elemen. 2013, 18, 733–756. [Google Scholar] [CrossRef]
  58. Ward, J.H. Hierarchical grouping to optimize an objective function. J. Am. Stat. Ass. 1963, 58, 236–244. [Google Scholar] [CrossRef]
  59. Geisseler, D.; Horwath, W.R. Relationship between carbon and nitrogen availability and extracellular enzyme activities in soil. Pedobiologia 2009, 53, 87–98. [Google Scholar] [CrossRef]
  60. Debska, B.; Kotwica, K.; Banach-Szott, M.; Spychaj-Fabisiak, E.; Tobiašová, E. Soil fertility improvement and carbon sequestration through exogenous organic matter and biostimulant application. Agriculture 2022, 12, 1478. [Google Scholar] [CrossRef]
  61. Małecka, I.; Blecharczyk, A.; Dobrzeniecki, T. The productivity and environmental consequences of long-term ploughless tillage systems in field pea. Fragm. Agron. 2009, 26, 118–127. [Google Scholar]
  62. Jaskulska, I.; Romaneckas, K.; Jaskulski, D.; Wojewódzki, P. A Strip-till one-pass system as a component of conservation agriculture. Agronomy 2020, 10, 2015. [Google Scholar] [CrossRef]
  63. Rożewicz, M.; Grabiński, J.; Wyzińska, M. Effect of the strip-till method on the yield and quality of winter wheat grain depending on the cultivar and scope of post-harvest cultivation. Part I. Yield. Agron. Sci. 2023, 78, 21–28. [Google Scholar] [CrossRef]
  64. Breza Boruta, B.; Paluszak, Z. The antagonistic activity of actinomycetes of Streptomyces genus in relation to Trichoderma koningii. J. Ecol. Eng. 2016, 17, 106–113. [Google Scholar] [CrossRef] [PubMed]
  65. Pengproh, R.; Thanyasiriwat, T.; Sangdee, K.; Kawicha, P.; Sangdee, A. Antagonistic ability and genome mining of soil Streptomyces spp. against Fusarium oxysporum f. sp. lycopersici. Eur. J. Plant Pathol. 2023, 167, 251–270. [Google Scholar] [CrossRef]
  66. Ghosh, P.K.; Das, A.; Saha, R.; Kharkrang, E.; Tripathy, A.K.; Mundu, G.C.; Ngachan, S.V. Conservation agriculture towards achieving food security in noth east India. Curr. Sci. 2010, 99, 915–921. [Google Scholar]
  67. Godsey, C.; Kochenower, R.; Taylor, R. Strip-till considerations in Oklahoma. Okla. Coop. Ext. Serv. 2017, 2, PSS-2134. [Google Scholar]
  68. Lv, L.; Gao, Z.; Liao, K.; Zhu, Q.; Zhu, J. Impact of conservation tillage on the distribution of soil nutrients with depth. Soil Tillage Res. 2023, 225, 105527. [Google Scholar] [CrossRef]
  69. Wen, L.; Peng, Y.; Zhou, Y.; Cai, G.; Lin, Y.; Li, B. Effects of conservation tillage on soil enzyme activities of global cultivated land: A meta-analysis. J. Environ. Manag. 2023, 345, 118904. [Google Scholar] [CrossRef] [PubMed]
  70. Holatko, J.; Hammerschmiedt, T.; Kintl, A.; Kucerik, J.; Malicek, O.; Latal, O.; Baltazar, T.; Brtnicky, M. Effects of strip-till and simultaneous fertilization at three soil depths on soil biochemical and biological properties. Agronomy 2022, 12, 2597. [Google Scholar] [CrossRef]
  71. Meena, A.; Rao, K.S. Assessment of soil microbial and enzyme activity in the rhizosphere zone under different land use/cover of a semiarid region, India. Ecol. Process. 2021, 10, 16. [Google Scholar] [CrossRef]
  72. He, L.; Lu, S.; Wang, C.; Mu, J.; Zhang, Y.; Wang, X. Changes in soil organic carbon fractions and enzyme activities in response to tillage practices in the Loess Plateau of China. Soil Tillage Res. 2021, 209, 104940. [Google Scholar] [CrossRef]
  73. Zuber, S.M.; Villamil, M.B. Meta-analysis approach to assess effect of tillage on microbial biomass and enzyme activities. Soil Biol. Biochem. 2016, 97, 176–187. [Google Scholar] [CrossRef]
  74. Piazza, G.; Ercoli, L.; Nuti, M.; Pellegrino, E. Interaction between conservation tillage and nitrogen fertilization shapes prokaryotic and fungal diversity at different soil depths: Evidence from a 23-year field experiment in the mediterranean area. Front. Microbiol. 2019, 10, 2047. [Google Scholar] [CrossRef] [PubMed]
  75. Mohammadi, K.; Heidari, G.; Nezhad, M.T.K.; Ghamari, S.; Sohrabi, Y. Contrasting soil microbial responses to fertilization and tillage systems in canola rhizosphere. Saudi J. Biol. Sci. 2012, 19, 377–383. [Google Scholar] [CrossRef] [PubMed]
  76. Williams, A.; Davis, A.S.; Jilling, A.; Grandy, A.S.; Koide, R.T.; Mortensen, D.A.; Smith, R.G.; Snapp, S.S.; Spokas, K.A.; Yannarell, A.C.; et al. Reconciling opposing soil processes in row-crop agroecosystems via soil functional zone management. Agric. Ecosyst. Environ. 2017, 236, 99–107. [Google Scholar] [CrossRef]
  77. Si, P.; Qiao, X.S. Effect of clean and sod cultivation on soil enzyme activity in sandy vineyard. J. Fruit Sci. 2014, 31, 238–244. [Google Scholar]
  78. Williams, A.; Kane, D.A.; Ewing, P.M.; Atwood, L.W.; Jilling, A.; Li, M.; Lou, Y.; Davis, A.S.; Grandy, A.S.; Huerd, S.C.; et al. Soil functional zone management: A vehicle for enhancing production and soil ecosystem services in row-crop agroecosystems. Front. Plant Sci. 2016, 7, 65. [Google Scholar] [CrossRef] [PubMed]
  79. Hatfield, J.L.; Allmaras, R.R.; Rehm, G.W.; Lowery, B. Ridge tillage for corn and soybean production: Environmental quality impacts. Soil Tillage Res. 1998, 48, 145–154. [Google Scholar] [CrossRef]
  80. Datta, A.; Gujre, N.; Gupta, D.; Agnihotri, R.; Mitra, S. Application of enzymes as a diagnostic tool for soils as affected by municipal solid wastes. J. Environ. Managem. 2021, 286, 112169. [Google Scholar] [CrossRef]
  81. Dantas, G.; Sommer, M.O.A.; Oluwasegun, R.D.; Church, G.M. Bacterial subsisting on antibiotics. Science 2008, 320, 100–103. [Google Scholar] [CrossRef]
  82. Criquet, S.; Ferre, E.; Farnet, A.M.; Petit, J.L. Annual dynamics of phosphatase activities in an evergreen oak litter: Influence of biotic and abiotic factors. Soil Biol. Biochem. 2004, 36, 1111–1118. [Google Scholar] [CrossRef]
  83. Stone, M.M.; Weiss, M.S.; Goodale, C.L.; Adams, M.B.; Fernandez, I.J.; German, D.P.; Allison, S.D. Temperature sensitivity of soil enzyme kinetics under N-fertilization in two temperate forests. Glob. Chang. Biol. 2012, 18, 1173–1184. [Google Scholar] [CrossRef]
  84. Jing, X.; Wang, Y.; Chung, H.; Mi, Z.; Wang, S.; Zeng, H.; He, J.-S. No temperature acclimation of soil extracellular enzymes to experimental warming in an alpine grassland ecosystem on the Tibetan Plateau. Biogeochemistry 2014, 117, 39–54. [Google Scholar] [CrossRef]
  85. Qi, R.; Li, J.; Lin, Z.; Li, Z.; Li, Y.; Yang, X.; Zhang, J.; Zhao, B. Temperature effects on soil organic carbon, soil labile organic carbon fractions, and soil enzyme activities under long-term fertilization regimes. Appl. Soil Ecol. 2016, 102, 36–45. [Google Scholar] [CrossRef]
  86. Brzostek, E.R.; Adrien, C.F. Seasonal variation in the temperature sensitivity of proteolytic enzyme activity in temperate forest soils. J. Geophys. Res. Biogeosci. 2012, 117. [Google Scholar] [CrossRef]
  87. German, D.P.; Marcelo, K.R.B.; Stone, M.M.; Allison, S.D. The Michaelis–Menten kinetics of soil extracellular enzymes in response to temperature: A cross-latitudinal study. Glob. Chang. Biol. 2012, 18, 1468–1479. [Google Scholar] [CrossRef]
  88. Gil-Sotres, F.; Trasar-Cepeda, C.; Leiros, M.C.; Seoane, S. Different approaches to evaluating soil quality using biochemical properties. Soil Biol. Biochem. 2005, 37, 877–887. [Google Scholar] [CrossRef]
  89. Lemanowicz, J. Activity of selected enzymes as markers of ecotoxicity in technogenic salinization soils. Environ. Sci. Pollut. Res. 2019, 26, 13014–13024. [Google Scholar] [CrossRef]
  90. Paz-Ferreiro, J.; Gascó, G.; Gutierrez, B.; Mendez, A. Soil biochemical activities and geometric mean of enzyme activities after application of sewage sludge and sewage sludge biochar to soil. Biol. Fertil. Soils 2012, 48, 511–517. [Google Scholar] [CrossRef]
  91. Górski, R.; Rosa, R.; Niewiadomska, A.; Wolna-Maruwka, A.; Płaza, A. Innovative spring barley cultivation technology based on the use of microbial products together with living mulch in organic farming. Agronomy 2023, 13, 1914. [Google Scholar] [CrossRef]
  92. Mierzwa-Hersztek, M.; Gondek, K.; Klimkowicz-Pawlas, A.; Chmiel, M.J.; Dziedzic, K.; Taras, H. Assessment of soil quality after biochar application based on enzymatic activity and microbial composition. Int. Agrophys. 2019, 33, 331–336. [Google Scholar] [CrossRef]
  93. Picariello, E.; Baldantoni, D.; Muniategui-Lorenzo, S.; Concha-Granã, E.; De Nicola, F. A synthetic quality index to evaluate the functional stability of soil microbial communities after perturbations. Ecol. Indic. 2021, 128, 107844. [Google Scholar] [CrossRef]
  94. Wojewódzki, P.; Lemanowicz, J.; Debska, B.; Haddad, S.A.; Tobiasova, E. The application of biochar from waste biomass to improve soil fertility and soil enzyme activity and increase aarbon sequestration. Energies 2023, 16, 380. [Google Scholar] [CrossRef]
  95. Nurzhan, A.; Tian, H.; Nuralykyzy, B.; He, W. Soil enzyme activities and enzyme activity indices in long-term arsenic-contaminated soils. Eurasian Soil Sci. 2022, 55, 1425–1435. [Google Scholar] [CrossRef]
  96. García-Ruiz, R.; Ochoa, V.; Hinojosa, M.B.; Carreira, J.A. Suitability of enzyme activities for the monitoring of soil quality improvement in organic agricultural systems. Soil Biol. Biochem. 2008, 40, 2137–2145. [Google Scholar] [CrossRef]
  97. Bach, C.E.; Warnock, D.D.; Van Horn, D.J.; Weintraub, M.N.; Sinsabaugh, R.L.; Allison, S.D.; German, D.P. Measuring phenol oxidase and peroxidase activities with pyrogallol, l-DOPA, and ABTS: Effect of assay conditions and soil type. Soil Biol. Biochem. 2013, 67, 183–191. [Google Scholar] [CrossRef]
  98. Liu, C.W.; Lin, K.H.; Kuo, Y.M. Application of factor analysis in the assessment of groundwater quality in a blackfoot disease area in Taiwan. Sci. Total Environ. 2003, 313, 77–89. [Google Scholar] [CrossRef]
Figure 1. Location of study area (https://upload.wikimedia.org/wikipedia/commons/0/08/Poland_on_the_globe_%28Europe_centered%29.svg) (accessed on 20 November 2023).
Agriculture 13 02188 g001
Figure 2. Share of carbon (A) and nitrogen (B) in organic matter fractions. CT—conventional tillage; RT—reduced tillage; ST-OP—strip-till one-pass, R—row; IR—inter-row. Cd—carbon in solutions after decalcification, CHAs—carbon of the fraction of humic acids, CFAs—carbon of the fraction of fulvic acids, Ch—carbon of the humin fraction; Nd—nitrogen in solutions after decalcification, NHAs—nitrogen of the fraction of humic acids, NFAs—nitrogen of the fraction of fulvic acids, Nh—nitrogen of the humin fraction.
Agriculture 13 02188 g002
Figure 3. Index of soil enzymes: AlP/AcP, GMea, BIF, BA12, and TEI.
Agriculture 13 02188 g003
Figure 4. Principal component analysis derived from the studied soil properties and plot of the first two principal components PC1 and PC2.
Agriculture 13 02188 g004
Figure 5. Cluster analysis.
Agriculture 13 02188 g005
Table 1. Meteorological conditions in the research area.
MonthYear1981–2010Year1981–2010
201820192020201820192020
Air Temperature (°C)Precipitation (mm)
January 0.8−0.72.6−1.846.332.637.726.8
February −3.22.63.6−0.95.818.136.020.7
March −0.25.43.92.516.428.826.131.9
April 12.09.38.27.940.41.50.727.0
May 16.912.111.213.314.289.234.249.3
June 18.421.917.916.126.417.7142.052.8
July 20.518.618.318.686.022.467.269.8
August 19.919.719.917.923.737.7114.462.6
September 15.613.515.113.117.098.566.746.0
October 9.89.810.58.234.135.972.931.5
November 4.55.56.02.97.269.612.432.4
December 2.02.71.8−0.650.321.133.834.0
Average9.810.017.98.1367.8473.1142.0484.8
Table 2. Content (g kg−1) of total organic carbon (TOC) and total nitrogen (TN).
Tillage Systems
I Factor *
TOC (g kg−1)TN (g kg−1)TOC/TN
Zone II Factor
RIRMeanRIRMeanRIRMean
CT9.629.119.361.151.081.118.408.488.44
RT 12.4412.7812.611.431.421.428.709.038.87
ST-OP 12.4713.7013.081.451.561.508.638.288.45
Mean11.5111.8611.671.341.351.348.588.608.59
LSD0.05I 0.12; II n.s.;
I/II 0.69; II/I 0.78
I 0.040; II n.s.;
I/II 0.048; II/I 0.059
I 0.22; II n.s.;
I/II 0.38; II/I 0.35
* CT—conventional tillage; RT—reduced tillage; ST-OP—strip-till one-pass, R—row; IR—inter-row; n.s.—not significant.
Table 3. Content (mg kg−1) of carbon in humus fraction.
Tillage Systems
I Factor *
Cd (mg kg−1)CHAs (mg kg−1)CFAs (mg kg−1)CHAs/CFAs
Zone II Factor
RIRMeanRIRMeanRIRMeanRIRMean
CT2713052882447247024582240220022201.11.11.1
RT 3553103333203346533342767293828521.21.21.2
ST-OP 3752983363164353933523001319830991.01.11.1
Mean3333043192938315830482669277827241.11.11.1
LSD0.05I 38.6; II n.s.;
I/II n.s.; II/I n.s.
I 363.7; II 163.8;
I/II n.s.; II/I n.s.
I 143.6; II n.s.;
I/II n.s.; II/I n.s.
I n.s.; II n.s.;
I/II n.s.; II/I n.s.
* CT—conventional tillage; RT—reduced tillage; ST-OP—strip-till one-pass, R—row; IR—inter-row; n.s.—not significant; Cd—carbon in solutions after decalcification, CHAs—carbon of the fraction of humic acids, CFAs—carbon of the fraction of fulvic acids
Table 4. Content (mg kg−1) of nitrogen in humus fraction.
Tillage Systems
I Factor *
NdNHAsNFAsNHAs/NFAs
Zone II Factor
RIRMeanRIRMeanRIRMeanRIRMean
CT4548471121141131401451430.80.80.8
RT 4946471771751761611611611.11.11.1
ST-OP 6359621991801891781721751.11.01.1
Mean5251521621561591601591601.01.01.0
LSD0.05I 1.5; II 2.4;
I/II n.s.; II/I n.s.
I 52.1; II n.s.;
I/II n.s.; II/I n.s.
I 15.0; II n.s.;
I/II n.s.; II/I n.s.
I n.s.; II n.s.;
I/II n.s.; II/I n.s.
* CT—conventional tillage; RT—reduced tillage; ST-OP—strip-till one-pass, R—row; IR—inter-row; n.s.—not significant; Nd—nitrogen in solutions after decalcification, NHAs—nitrogen of the fraction of humic acids, NFAs—nitrogen of the fraction of fulvic acids.
Table 5. Number of heterotrophic bacteria (B) and filamentous fungi (F) in the soil in July and October.
Tillage Systems
I Factor *
B (106 cfu g−1 d.m. of Soil)F (104 cfu g−1 d.m. of Soil)
JulyOctoberJulyOctober
Zone II FactorZone II Factor
RIRMeanRIRMeanRIRMeanRIRMean
CT27.828.528.1327.033.630.3128.927.828.3136.344.340.25
RT 49.837.143.4442.550.546.5042.351.346.7581.969.475.63
ST-OP 25.337.931.6066.734.550.6046.146.846.47108.868.488.57
Mean34.2834.5134.3945.4039.5442.4739.0841.9440.5175.6360.6768.15
LSD0.05I 13.41; II n.s.
I/II n.s.; II/I n.s.
I 19.98; II n.s.;
I/II 28.26; II/I 23.27
I 17.81; II n.s
I/II n.s.; II/I n.s.
I 27.50; II n.s.
I/II n.s.; II/I n.s.
* CT—conventional tillage; RT—reduced tillage; ST-OP—strip-till one-pass, R—row; IR—inter-row; n.s.—not significant.
Table 6. Number the actinobacteria (Ac) and cellulolytic microorganisms (Ce) in the soil in July and October.
Tillage Systems
I Factor *
Ac (105 cfu g−1 d.m. of Soil)Ce (106 cfu g−1 d.m. of Soil)
JulyOctoberJulyOctober
Zone II FactorZone II Factor
RIRMeanRIRMeanRIRMeanRIRMean
CT59.658.659.1338.943.841.3113.813.313.5018.514.016.25
RT 116.895.8106.395.491.693.5017.316.316.7828.526.127.31
ST-OP 47.772.860.25104.572.388.3812.520.616.5532.120.026.04
Mean74.6975.7375.2179.5869.2174.4014.5316.6915.6126.3720.0323.20
LSD0.05I 12.29; II n.s
I/II 17.39; II/I 14.31
I 24.31; II n.s.
I/II n.s.; II/I n.s.
I n.s.; II n.s.
I/II n.s.; II/I n.s.
I 3.65; II 2.46;
I/II 5.16.; II/I 4.25
* CT—conventional tillage; RT—reduced tillage; ST-OP—strip-till one-pass, R—row; IR—inter-row; n.s.—not significant.
Table 7. Activity of dehydrogenases (DEHs) and catalase (CAT) in soil in July and October.
Tillage Systems
I Factor *
DEH (mg TPF kg−1 24 h−1)CAT (mg H2O2 kg−1 h−1)
JulyOctoberJulyOctober
Zone II FactorZone II Factor
RIRMeanRIRMeanRIRMeanRIRMean
CT0.5090.5280.5181.1211.1551.1380.3110.3400.3260.6320.7200.678
RT 0.5100.5530.5321.0101.0661.0380.3110.3420.3260.5880.6260.607
ST-OP 0.5320.6160.5740.9671.2731.1200.3340.3920.3630.5860.6890.638
Mean0.5170.5660.5411.0331.1651.0990.3190.3580.3380.6030.6780.641
LSD0.05I 0.09.; II 0.10;
I/II n.s.; II/I n.s.
I 0.08.; II 0.11;
I/II n.s.; II/I n.s.
I 0.011; II 0.019;
I/II n.s.; II/I n.s.
I 0.015; II 0.028;
I/II n.s.; II/I n.s.
* CT—conventional tillage; RT—reduced tillage; ST-OP—strip-till one-pass, R—row; IR—inter-row; n.s.—not significant.
Table 8. Activity of alkaline (AlP) and acid phosphatase (AcP) in soil in July and October.
Tillage Systems
I Factor *
AlPAcP
JulyOctoberJulyOctober
Zone II FactorZone II Factor
RIRMeanRIRMeanRIRMeanRIRMean
CT0.6580.7290.6920.6510.6860.6692.1462.0242.0851.9962.1032.050
RT 0.6750.7390.7070.9060.9470.9272.7112.8852.7982.2882.3782.333
ST-OP 0.7241.0260.8750.9511.3531.1522.3642.8892.6262.2982.6262.462
Mean0.6860.8310.7580.8360.9960.9162.4072.5992.5032.1942.3692.281
LSD0.05I 0.08; II 0.10;
I/II n.s.; II/I n.s.
I 0.386; II 0.135;
I/II n.s.; II/I n.s.
I 0.699; II 0.186;
I/II 0.754; II/I 0.323
I 0.267; II 0.156;
I/II n.s.; II/I n.s.
* CT—conventional tillage; RT—reduced tillage; ST-OP—strip-till one-pass, R—row; IR—inter-row; n.s.—not significant.
Table 9. Relations between the activity of selected enzyme soil quality indices and microbial and organic matter parameters.
AlP/AcPGMeaBIFBA12TEI
TOC0.6420.652n.s.0.8710.773
TN0.6510.661n.s.0.9040.780
CHAs0.6380.648n.s.0.9170.774
CFAs0.6320.644n.s.0.9540.774
CHA/CFAn.s.n.s.0.7590.7660.836
CHAs%n.s.n.s.0.6720.8350.758
CFAs%n.s.n.s.0.6120.8160.677
CH%n.s.n.s.0.7670.5730.792
Nd0.7010.723n.s.0.872n.s.
NHAs0.5750.592n.s.0.9780.573
NFAs0.5080.520n.s.0.9620.702
NHA/NFAn.s.n.s.n.s.0.9820.668
Nd%0.5070.526n.s.0.846n.s.
NFAs%n.s.n.s.0.5600.6990.562
Bn.s.n.s.n.s.0.707n.s.
Fn.s.n.s.n.s.0.817n.s.
Acn.s.n.s.n.s.0.766n.s.
Cen.s.n.s.n.s.0.639n.s.
AlP/AcP—Enzymatic pH indicator; GMea—geometric mean; BIF—biological index of fertility, BA13—biochemical soil activity; TEI—total enzyme activity index; TOC—total organic carbon; TN—total nitrogen; Cd—carbon in solutions after decalcification; CHAs—carbon of humic acids, CFAs—carbon of fulvic acids; Nd—nitrogen in solutions after decalcification; NHAs—nitrogen of humic acids, NFAs—nitrogen of fulvic acids; B—number of heterotrophic bacteria; F—filamentous fungi; Ac—actinobacteria; Ce—cellulolytic microorganisms; n.s.—not significant.
Disclaimer/Publisher’s Note: The statements, opinions and data contained in all publications are solely those of the individual author(s) and contributor(s) and not of MDPI and/or the editor(s). MDPI and/or the editor(s) disclaim responsibility for any injury to people or property resulting from any ideas, methods, instructions or products referred to in the content.

