

The Impact of Family Life Cycle on Farmers’ Living Clean Energy Adoption Behavior—Based on 1382 Farmer Survey Data in Jiangxi Province

(This article belongs to the Section Agricultural Economics, Policies and Rural Management)
Abstract
:1. Introduction
2. Literature Review
3. Theoretical Analysis
3.1. Concept Definition
3.1.1. Living Clean Energy
3.1.2. Family Life Cycle and Its Division
3.2. Theoretical Analysis and Research Hypothesis
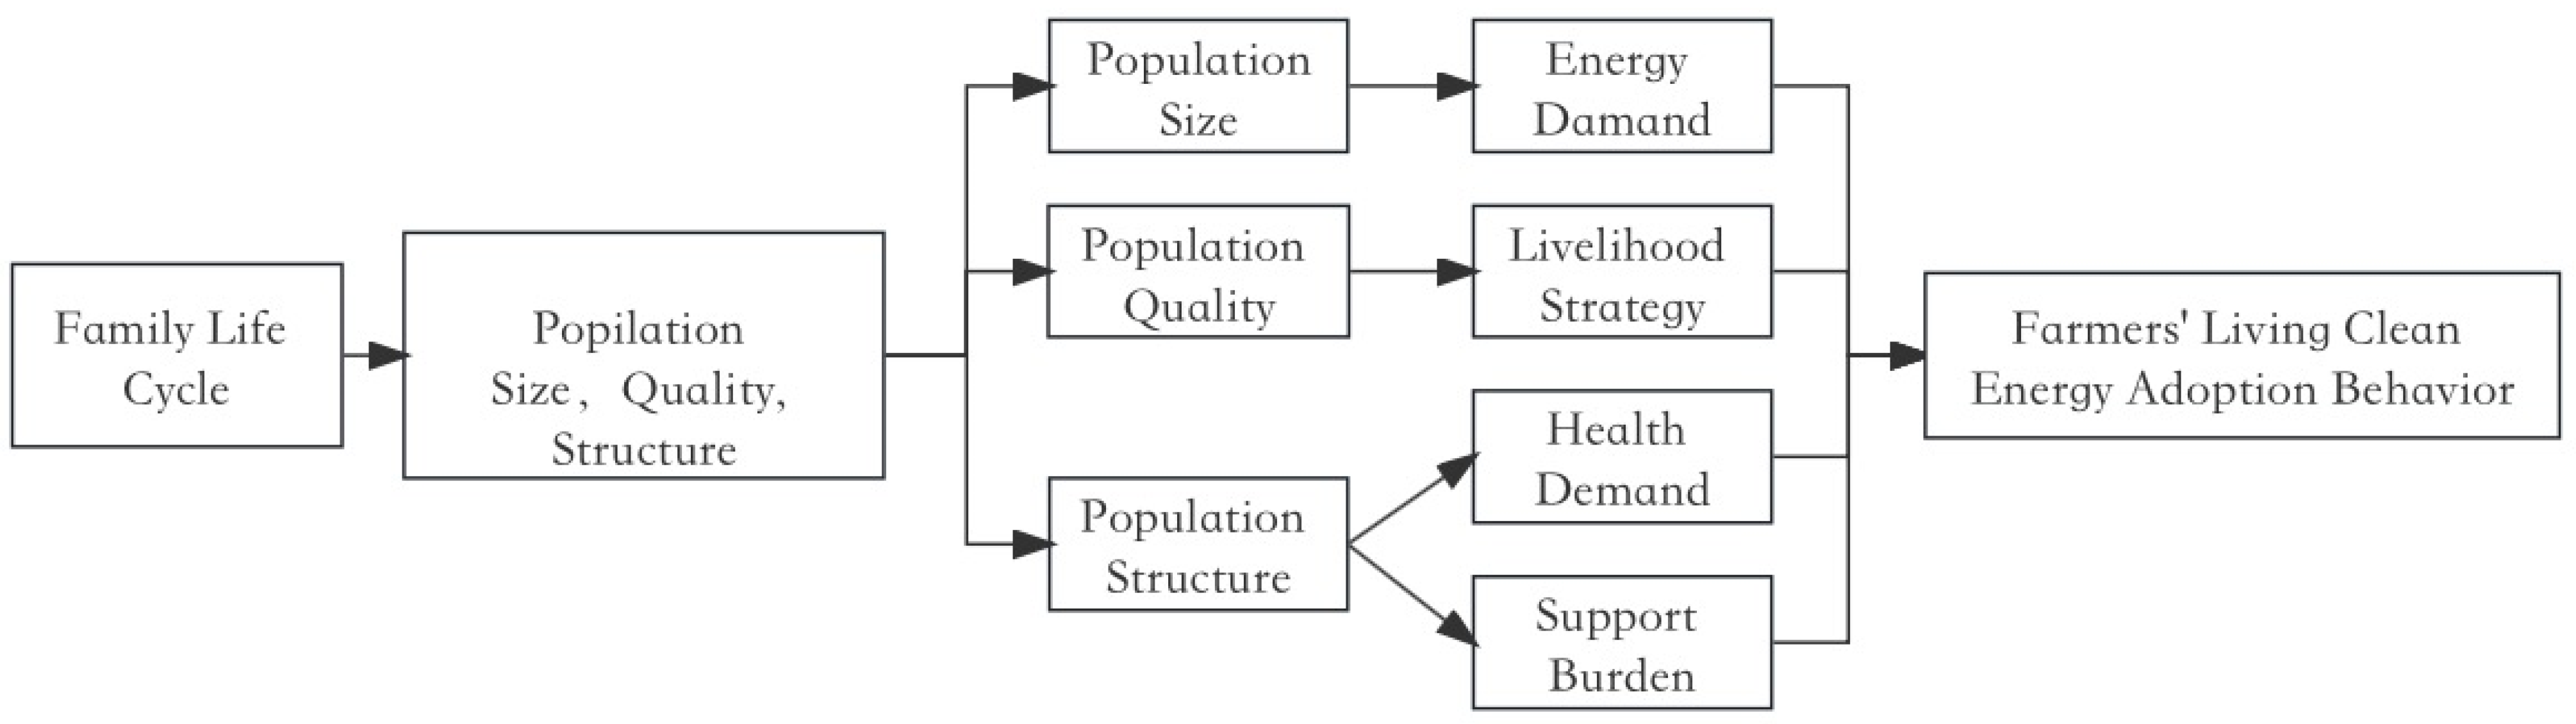
3.2.1. The Impact Mechanism of Family Life Cycle on Farmers’ Living Clean Energy Adoption Behavior
3.2.2. Specific Characterizations of Different Family Life Cycle Stages and Analysis of Farmers’ Living Clean Energy Adoption Behavior
- (1)
- Initial stage. In this stage, family members are generally young couples who have recently separated from their original family and have not yet had any children. Families do not have children or elderly people to support, so the support burden is relatively light. However, non-farm employment has become the primary choice of occupation for most families. Hence, although the family size is small and the energy demand is low, their choice of non-farm employment makes them spend much less time collecting traditional solid fuels. In order to meet the daily energy needs of the family, farmers may choose cleaner modern energy.
- (2)
- Raising stage. The demographic characteristics of the family in this stage are having children or grandchildren under the age of 18, and there are no elderly people aged 65 or above. With the birth of children and the growth in family size, the core task of families in this stage shifts to raising offspring. The responsibility for raising minors limits the full utilization of the female and paternal labor force. However, the average age of the core labor force is relatively low, and the level of human capital is relatively high. Non-farm employment remains the preferred option for most families. Due to the high cost of working outside and the many obstacles for children or grandchildren to study in different places, many families at this stage tend to implement vertical intergenerational division of labor or horizontal marital division of labor [54]. As a result, the whole family shows the characteristics of part-time employment. Compared with families in the initial stage, raising-stage families have accumulated a certain amount of economic capital and have the ability to support their adoption of clean energy. In addition, an increase in the size of families leads to an overall increase in energy demand. In order to provide a more comfortable and healthier growth environment for minors, farmers will be more inclined to use living clean energy.
- (3)
- Burdening stage. The demographic characteristics of families in this stage are that the youngest child or grandchild is under 18 years old and there is an elderly person aged 65. With the birth of children and aging parents, families bear the responsibility of raising children and supporting the elderly and are in an “elderly at the top, young at the bottom” stage. Most families usually opt for part-time or non-farm employment as their primary livelihood strategy. At this stage, the support burden and economic pressure gradually increase, and farmers will be more inclined to control the cost of living, which will suppress the farmers’ living clean energy adoption behavior.
- (4)
- Stable stage. The demographic characteristics of families in this stage are that the youngest child or grandchild is over 18 years old, and there are no elderly people over 65 years old. At this stage, the economic burden of farmers is relatively light, and the level of human capital is relatively high. Young and middle-aged people go out to work more, while their parents stay at home to continue agricultural production. Therefore, the people who stay in rural areas are older, their health level begins to decline, and the demand for health increases. At the same time, farmers have sufficient capital to use clean energy, so they are more inclined to use living clean energy.
- (5)
- Supported stage. The demographic characteristics of families in this stage are that all children and grandchildren are over 18 years old, and there are elderly people over 65 years old. Compared to the stable stage, the support burden of the family increases during this stage, the level of human capital decreases, and the livelihood strategy of families gradually leans towards being agriculture-oriented [55]. At this stage, as family members age, the demand for health also increases, which will encourage farmers to adopt living clean energy. But at the same time, the support burden of the family increases during this stage, and the economic level will decrease because the livelihood strategy will gradually focus on agriculture. This in turn will inhibit farmers from using clean energy, so there is uncertainty about whether such farmers will adopt living clean energy.
- (6)
- Empty-nest stage. The demographic characteristics of families in this stage are that all family members are over 65 years old. At this stage, households possess a comparatively low level of human capital. Although there is a high demand for health, the economic level is relatively low. Therefore, the farmers’ adoption of living clean energy for daily use will be impeded by economic capital. And at this stage, most family members have experienced energy scarcity, so they will be more economical in energy use and reduce energy demand [56]. Overall, during empty-nest stage, the probability of farmers implementing living clean energy adoption behavior is relatively low.
4. Model Construction, Variable Selection, and Data Sources
4.1. Model Construction
4.2. Variable Selection
4.2.1. Dependent Variable
4.2.2. Core Independent Variable
4.2.3. Control Variables
4.3. Data Sources and Basic Characteristics of Samples
5. Empirical Analysis
5.1. The Impact of Family Life Cycle on Farmers’ Living Clean Energy Adoption Behavior
5.2. Analysis of Factors Influencing Farmers’ Living Clean Energy Adoption Behavior at Different Family Life Cycle Stages
6. Conclusions
- (1)
- From the perspective of composite variables of the family life cycle, the raising stage, stable stage, and supported stage all have a significant positive impact on farmers’ living clean energy adoption behavior, while the burdening stage has a significant negative impact on farmers’ living clean energy adoption behavior;
- (2)
- From the perspective of specific variables of the family life cycle, energy demand, non-farm employment, and health demand all have a significant positive impact on farmers’ living clean energy adoption behavior, whereas support burden has a significant negative impact on farmers’ living daily clean energy adoption behavior;
- (3)
- Among the control variables, farmers’ awareness of the surrounding environment and the frequency of government promotion of clean energy have a significant positive impact on their living clean energy adoption behavior. Gender has a significant negative impact on farmers’ living clean energy adoption behavior;
- (4)
- At different stages of the family life cycle, there are both common and different factors that affect farmers’ living clean energy adoption behavior. Regardless of the stage, the frequency of government promotion of clean energy can positively affect the farmers’ living clean energy adoption behavior.
7. Discussion
Author Contributions
Funding
Institutional Review Board Statement
Informed Consent Statement
Data Availability Statement
Conflicts of Interest
References
- Zhou, S.H.; Wang, J.; Liang, Y. Development of China’s natural gas industry during the 14th Five-Year Plan in the background of carbon neutrality. Nat. Gas Ind. 2021, 41, 171–182. [Google Scholar]
- Deng, H.H.; Yu, Y.H. Research on the Green Transformation of China’s Rural Energy System: Based on Data from Chinese Rural Household Energy Survey. Zhejiang Soc. Sci. 2018, 1, 10. [Google Scholar]
- Zhou, F.F. Study on Evaluation and Optimization Models of Comprehensive Utilization of Renewable Energy in Rural Areas. Master’s Thesis, Zhengzhou University, Zhengzhou, China, 2012. [Google Scholar] [CrossRef]
- Department of Energy Statistics, National Bureau of Statistics. China Energy Statistical Yearbook; China Statistics Press: Beijing, China, 2021. [Google Scholar]
- Li, F.L.; He, K.; Chang, H.Y.; Zhang, J.B. Health, Non-Farm Employment and Clean Energy Use in Rural Households Based on Data from Three Provinces in the Central Part of China. Resour. Environ. Yangtze Basin 2021, 30, 14. [Google Scholar]
- Friedrich, M.J. Reducing Indoor Air Pollution. JAMA J. Am. Med. Assoc. 2011, 306, 2553. [Google Scholar] [CrossRef]
- Sharma, D.; Jain, S. Impact of intervention of biomass cookstove technologies and kitchen characteristics on indoor air quality and human exposure in rural settings of India. Environ. Int. 2019, 123, 240–255. [Google Scholar] [CrossRef]
- Alexander, D.; Northcross, A.; Wilson, N.; Dutta, A.; Pandya, R.; Ibigbami, T.; Adu, D.; Olamijulo, J.; Morhason-Bello, O.; Karrison, T.; et al. Randomized Controlled Ethanol Cookstove Intervention and Blood Pressure in Pregnant Nigerian Women. Am. J. Respir. Crit. Care Med. 2017, 195, 1629–1639. [Google Scholar] [CrossRef]
- Yao, Z.; Kang, K.; Cong, H.; Jia, J.; Huo, L.; Deng, Y.; Xie, T.; Zhao, L. Demonstration and multi-perspective analysis of industrial-scale co-pyrolysis of biomass, waste agricultural film, and bituminous coal. J. Clean. Prod. 2021, 290, 125819. [Google Scholar] [CrossRef]
- Ding, Y.; Qu, W.; Niu, S.; Liang, M.; Qiang, W.; Hong, Z. Factors Influencing the Spatial Difference in Household Energy Consumption in China. Sustainability 2016, 8, 1285. [Google Scholar] [CrossRef]
- Liu, C.J.; Teng, Y.H.; Zhang, Y.Z. Study on the consistency of the willingness and behavior of rural residents’ clean energy application: Based on the survey data in Jiangxi. J. Hunan Agric. Univ. Soc. Sci. 2017, 18, 13–19. [Google Scholar]
- Borozan, D. Regional-level household energy consumption determinants: The european perspective. Renew. Sustain. Energy Rev. 2018, 90, 347–355. [Google Scholar] [CrossRef]
- Li, J.J. Study on Rural Residents’ Willingness to Pay for Heating with Clean Energy in Shanxi Province. Energy Energy Conserv. 2021, 15–18. [Google Scholar] [CrossRef]
- Shi, X.; Heerink, N.; Qu, F. Choices between different off-farm employment sub-categories: An empirical analysis for Jiangxi Province, China. China Econ. Rev. 2007, 18, 438–455. [Google Scholar] [CrossRef]
- Liang, Y.T.; Fan, J.; Sun, W.; Han, X.; Sheng, K.; Ma, H.; Xu, Y.; Wang, C. The Influencing Factors of Rural Household Energy Consumption Structure in Mountainous Areas of Southwest China: A Case Study of Zhaotong City of Yunnan Province. ACTA Geogr. Sin. 2012, 67, 221–229. [Google Scholar]
- Zhao, X.Y. The impact of livelihood strategy on the farmer’ s living energy consumption pattern: A case of Gannan Plateau. Acta Ecol. Sin. 2015, 35, 1610–1619. [Google Scholar] [CrossRef]
- Dong, M.; Xu, Z.Y. Energy Consumption Structure of Rural Households and Influencing Factors: Based on 1303 Rural Households in Shaanxi. J. Agro For. Econ. Manag. 2018, 17, 45–53. [Google Scholar]
- Zhang, J.; Kotani, K. The determinants of household energy demand in rural Beijing: Can environmentally friendly technologies be effective? Energy Econ. 2012, 34, 381–388. [Google Scholar] [CrossRef]
- Liu, Z.F.; Zhang, T.W.; Hu, J. Influence of household endowments on the choice behavior of biogas in southwest mountainous areas: An empirical analysis based on data of 1102 farmers in Yunnan province. J. Hum. Agric. Univ. Soc. Sci. 2014, 15, 01–07. [Google Scholar]
- Zhai, Z.H.; Fu, J. Rural energy consumption characteristics in western minority regions in China based on surveys of residents in Sichuan Liangshan. Resour. Sci. 2016, 38, 622–630. [Google Scholar]
- Min, Q.W.; Zhang, Y.X.; Zhao, G.G. Energy Utilization by Guinan Households in a Resettlement Area of “Three-River-Source” and Its Effect on the Ecological Environment. Resour. Sci. 2012, 34, 2018–2025. [Google Scholar]
- Parag, Y.; Hamilton, J.; White, V.; Hogan, B. Network approach for local and community governance of energy: The case of Oxfordshire. Energy Policy 2013, 62, 1064–1077. [Google Scholar] [CrossRef]
- Teng, Y.H.; Zhang, Y.Z.; Gao, X.P. Study on Influencing Factors of the Willingness of Rural Residents to Use Clean Energy—Empirical Analysis Based on 695 Sample Data of Jiangxi Province. West Forum 2018, 28, 8. [Google Scholar] [CrossRef]
- Liang, M.; Wang, S.; Zhang, Y.; Zhang, L.X.; Sun, Y. Well-being of Rural Residents and the Choice of Green Cooking Energy Consumption: Empirical Analysis Based on the Date of China Family Panel Studies. Chin. J. Agric. Resour. Reg. Plan. 2021, 246–255. [Google Scholar]
- Li, G.Z.; Yu, G.; Lu, W.H.; Niu, S.W. Differences in Rural Household Energy Consumption Across the Loess Hilly Region of Gansu. Resour. Sci. 2012, 34, 1839–1844. [Google Scholar]
- Xiao, H.B.; Li, J.; Li, Z.T.; Han, F.; Li, H. Energy Consumption in Rural Beijing Current Situation and Major Influence Factors: Based on the Survey of 1866 Rural Households in Beijing. Chin. J. Agric. Resour. Reg. Plan. 2017, 38, 11. [Google Scholar] [CrossRef]
- Zhang, H.L.; Wang, F.F. Analysis on the influencing factors of non-agricultural transfer of returned labor forces in Henan rural areas from the perspective of family life. World Agric. 2020, 1, 64–71. [Google Scholar] [CrossRef]
- Wang, X.H.; Zhang, K.K. Research on China’s urban and rural population mobility from the perspective of family life cycle. Macroeconomics 2019, 3, 159–186. [Google Scholar]
- Fischer, H.; Burton, R.J.F. Understanding Farm Succession as Socially Constructed Endogenous Cycles. Sociol. Rural. 2015, 54, 417–438. [Google Scholar] [CrossRef]
- Liang, L.; Lin, S.; Zhang, Z. Effect of the family life cycle on the family farm scale in Southern China. Agric. Econ. 2015, 61, 429–440. [Google Scholar] [CrossRef]
- Perz, S.G. Household Demographic Factors as Life Cycle Determinants of Land Use in the Amazon. Popul. Res. Policy Rev. 2001, 20, 159–186. [Google Scholar] [CrossRef]
- Zhu, P.X.; Yang, Z.; Rao, F.P. The effect of family life cycle on land-scale management. Chin. J. Popul. Sci. 2017, 6, 43–53. [Google Scholar]
- Lansing, J.B.; Kish, L. Family life cycle as an independent varialbe. Am. Sociol. Rev. 1957, 22, 512–519. [Google Scholar] [CrossRef]
- Zeng, Y.R.; Hu, Y.; Zeng, W.Z. The impact of land transfer on farmers’ household consumption from the perspective of life cycle. J. Sichuan Agric. Univ. 2022, 292–300. [Google Scholar] [CrossRef]
- Xiao, Y.L.; Gu, L.P.; Zhang, H.W. Poverty, Energy and Environment: Analysis on Factors Affecting Rural Cooking Energy Utilization in Poverty-Stricken Counties. J. Huazhong Agric. Univ. Soc. Sci. Ed. 2010, 36–42. [Google Scholar] [CrossRef]
- Jin, R.R.; Li, S.P.; Nan, L. Effects of capital endowment, perceived value, and government subsidies on farming households’ adoption behavior of clean heating. Resour. Sci. 2022, 44, 809–819. [Google Scholar] [CrossRef]
- Han, S. Study on Factors Household Clean Energy Consuming-Behavior: A Case Study of Handan City. Bachelor’s Thesis, Northwest Agriculture Forestry University, Xianyang, China, 2016. [Google Scholar]
- Rowntree, B.S. Poverty: A study of town life. Charity Organ. Rev. 1902, 11, 260–266. [Google Scholar]
- Cheng, X.Y.; Wang, K.M.; Ou, M.H. Research on Influencing Factors of Farmers’ Willingness of Rural Settlements Consolidation from the Perspective of Family Life Cycle. Chin. J. Agric. Resour. Reg. Plan. 2021, 42, 81–89. [Google Scholar]
- Glick, P.C. The family cycle. Am. Sociol. Rev. 1947, 12, 164–174. [Google Scholar] [CrossRef]
- Rodgers, R.H. Improvements in the Construction and Analysis of Family Life Cycle Categories. Ph.D. Thesis, University of Minnesota, Minneapolis, MN, USA, 1962. [Google Scholar]
- Wells, W.C.; Gubar, G. Life Cycle Concept in Marketing Research. J. Mark. Res. 1966, 23, 151–158. [Google Scholar]
- Duvall, E.M. Family Development; J.B. Lippincott Company: Philadelphia, PA, USA, 1971. [Google Scholar]
- Gilly, M.C.; Enis, B.M. Recycling the Family Life Cycle: A proposal for Redefinition. Adv. Consum. Res. 1982, 9, 271–276. [Google Scholar]
- Yang, J.H. A Study on Chinese Family Transition from the Perspective of Family Life Course. J. Soc. Sci. 2022, 12. [Google Scholar]
- Yao, G.L.; Wan, G.S. Family life cycle variation of migrant workers and its impact on their family consumption structure. Manag. World 2016, 14. [Google Scholar]
- Wu, F. Family Life Cycle Structure: A Theoretical Framework and Empirical Study Based on CHNS. Acad. Res. 2012, 42–49. [Google Scholar] [CrossRef]
- Ye, Z.; Cai, J.; Chen, Y.; Xia, X. Study on the Effect of Family Life Cycle on Farmers’ Farmland Transfer Behavior: An Empirical Analysis Based on Survey Data of Farmers in Qinba Mountain Area. Resour. Environ. Yangtze Basin 2019, 6, 1929–1937. [Google Scholar]
- Wang, W.; Wu, H.T. The Determinants of Rural Labor Transfer to Non-agricultural Sectors from the Perspective of Family Life Cycle: An Analysis Using Field Survey Data in Hubei Province. China Rural Surv. 2017, 14, 57–70. [Google Scholar]
- Tai, X.J. Analysis of influencing factors of fuelwood consumption of rural households in western mountainous areas. Chin. Rural Econ. 2011, 8. [Google Scholar]
- Wan, J.J.; Zhong, Z.B. An Empirical Study on the Impact of Non-farm Employment and Agricultural Productive Services Outsourcing on Farmers’ Behavior of Farmland Transfer. Resour. Environ. Yangtze Basin 2020, 29, 16. [Google Scholar]
- Higgins, M. Demography, national savings and international capital flows. Int. Econ. Rev. 1998, 39, 343–369. [Google Scholar] [CrossRef]
- Leff, N.H. Dependency Rates and Savings Rates. Am. Econ. Rev. 1969, 59, 886–896. [Google Scholar]
- Liu, K.; Qi, Z.H.; Huang, W.H.; Yang, C.Y. Influence Analysis of Family Life Cycle on Farmers’ Operation: Empirical Analysis Based on Rice Farmer in the Middle Area Yangzte River. J. China Agric. Univ. 2019, 24, 11. [Google Scholar] [CrossRef]
- Zhao, K.; Zhang, R.H.; Sun, P.F. The impacts of capital endowment on farmers’ adoption behaviors of agricultural socialization services: From the perspective of family life cycle. Res. Agric. Mod. 2022, 43, 121–133. [Google Scholar] [CrossRef]
- Ding, Z.; Jiang, X.; Liu, Z.; Long, R.; Xu, Z.; Cao, Q. Factors affecting low-carbon consumption behavior of urban residents: A comprehensive review. Resour. Conserv. Recycl. 2018, 132, 3–15. [Google Scholar]
- Guo, Q.H.; Li, S.P.; Nan, L. Farming households’ pro-evironmental behaviors from the perspective of environmental literacy. Resour. Sci. 2020, 42, 14. [Google Scholar]
- Zhang, Z.H. Family Life Cycle, Security Strategies, and Farmers’ Consumption Behavior. J. Agrotech. Econ. 2017, 132, 38–48. [Google Scholar] [CrossRef]
- Hu, S.X.; Liu, C.Q.; Qi, Z.H. Study on the influence of vegetable industry development on rural residents’ disposable income in Hubei Province. Stat. Decis. 2016, 4. [Google Scholar] [CrossRef]
- Huang, J.X.; Wang, L.G. Analysis of Farmers’ Willingness to Adopt Pro-Environmental Behaviors and Influencing Factors in Rural Tourism Areas: Taking Soil Testing and Formula Fertilization as an Example. Chin. J. Agric. Resour. Reg. Plan. 2021, 42, 60–68. [Google Scholar]
- Chen, H.T.; Yue, S.J.; Zhu, Y.T. A Study on Rebound Effect of Chinese Residents’ Energy Consumption from the Perspective of Per Capita Income and Gender Differences. Chin. J. Environ. Manag. 2019, 11, 7. [Google Scholar]

| Family Life Stage | Division Basis |
|---|---|
| Initial stage | Young couple without children |
| Raising stage | (Grand) Child born, youngest child under 18 years old, no elderly person over 65 years old |
| Burdening stage | (Grand) Child born, youngest child under 18 years old, elderly person over 65 years old |
| Stable stage | Children or grandchildren are all over 18 years old, and there are no elderly people aged 65 or above |
| Supported stage | Children or grandchildren are all 18 years old and have elderly people over 65 years old |
| Empty-nest stage | After separation, parents live alone |
| Variables | Variable Definition and Assignment | Mean Value | Standard Deviation | Expected Direction |
|---|---|---|---|---|
| Dependent variable | ||||
| Farmers’ living clean energy adoption behavior (B) | Farmers’ clean energy adoption behaviors—comprehensive value | 2.678 | 1.055 | |
| Core independent variable | ||||
| Family life cycle | ||||
| Raising stage (RS) | In the raising stage = 1; Others = 0 | 0.320 | 0.468 | + |
| Burdening stage (BS) | In the burdening stage = 1; Others = 0 | 0.380 | 0.487 | − |
| Stable stage (STS) | In the stable stage = 1; Others = 0 | 0.150 | 0.353 | + |
| Supported stage (SUS) | In the supported stage = 1; Others = 0 | 0.110 | 0.314 | ? |
| Empty-nest stage (reference group) (ES) | 0 | 0.030 | 0.166 | |
| Energy demand | ||||
| Energy consumption in last year (ED) | Very low = 1; Relatively low = 2; Generally = 3; Relatively high = 4; Very high = 5 | 3.630 | 0.979 | + |
| Livelihood strategy | ||||
| Non-farm employment (LS) | The proportion of non-farm workers to the total number of households. | 0.366 | 0.259 | + |
| Health demand | ||||
| Health status (HD) | Very good = 1; Good = 2; Generally = 3; Bad = 4; Very bad = 5 | 2.339 | 0.907 | + |
| Support burden | ||||
| Ratio of expenditure to income (SB) | The proportion of total annual household expenses to total income | 0.538 | 0.459 | − |
| Control variables | ||||
| Personal characteristics | ||||
| Gender (X1) | Male = 1; Female = 0 | 0.700 | 0.458 | − |
| Age (X2) | Unit: year | 45.32 | 12.199 | ? |
| Education level (X3) | Never go to school = 1; Primary school = 2; Middle school = 3; High school = 4; College or above = 5 | 3.480 | 1.000 | + |
| Cognitive factors | ||||
| Awareness of environmental ecology (X4) | Very ignorant = 1; Basic ignorance = 2; Generally = 3; Basic understanding = 4; Well understood = 5 | 3.560 | 1.126 | + |
| Awareness of clean energy (X5) | Very ignorant = 1; Basic ignorance = 2; Generally = 3; Basic understanding = 4; Well understood = 5 | 3.940 | 0.877 | + |
| Policy factors | ||||
| Frequency of government promotion of clean energy (X6) | Never = 1; Less frequently = 2; Generally = 3; Relatively frequent = 5; Always = 5 | 3.180 | 0.941 | + |
| Satisfaction of farmers with existing clean energy promotion policies (X7) | Very dissatisfied = 1; Dissatisfied = 2; Generally = 3; Satisfied = 4; Very satisfied = 5 | 4.020 | 0.983 | + |
| Characteristics | Description | Frequency | Percentage (%) | Kurtosis | Skewness | Characteristics | Description | Frequency | Percentage (%) | Kurtosis | Skewness |
|---|---|---|---|---|---|---|---|---|---|---|---|
| Gender | Male | 968 | 70.043 | −1.234 | −0.876 | Age | Age 35 and under | 311 | 22.504 | −0.500 | 0.014 |
| Female | 414 | 29.957 | 36–50 years old | 603 | 43.632 | ||||||
| Education level | Never go to school | 30 | 2.171 | −0.541 | −0.034 | 51–65 years old | 405 | 29.305 | |||
| Primary school | 157 | 11.360 | Age 66 and older | 63 | 4.559 | ||||||
| Middle school | 580 | 41.968 | Family size | 1–2 people | 56 | 4.052 | 2.622 | 0.828 | |||
| High school | 344 | 24.891 | 3–4 people | 486 | 45.166 | ||||||
| College or above | 271 | 19.609 | 5–6 people | 599 | 43.343 | ||||||
| Only engaged in agricultural work | Yes | 746 | 53.980 | −1.980 | −1.151 | 7 people and above | 241 | 17.438 | |||
| No | 636 | 46.020 |
| Family Characteristics | Initial Stage | Raising Stage | Burdening Stage | Stable Stage | Supported Stage | Empty-Nest Stage |
|---|---|---|---|---|---|---|
| Frequency | 8 | 448 | 532 | 202 | 153 | 39 |
| Percentage (%) | 0.579 | 32.417 | 38.495 | 14.616 | 11.071 | 2.822 |
| Energy demand | 3.750 | 3.650 | 3.538 | 3.639 | 3.595 | 3.256 |
| Non-farm employment | 0.500 | 0.332 | 0.326 | 0.464 | 0.393 | 0.675 |
| Ratio of expenditure to income | 0.517 | 0.592 | 0.550 | 0.515 | 0.474 | 0.579 |
| Health demand | 1.875 | 2.292 | 2.248 | 2.381 | 2.582 | 2.923 |
| Gender | 0.875 | 0.665 | 0.720 | 0.678 | 0.745 | 0.744 |
| Age | 36.625 | 43.069 | 45.545 | 44.525 | 49.366 | 58.026 |
| Education level | 2.750 | 3.571 | 3.494 | 3.574 | 3.386 | 2.410 |
| Awareness of environmental ecology | 3.625 | 3.605 | 3.511 | 3.515 | 3.667 | 3.462 |
| Awareness of clean energy | 4.000 | 3.920 | 4.006 | 3.787 | 4.033 | 3.769 |
| Frequency of government promotion of clean energy | 3.125 | 3.192 | 3.102 | 3.168 | 3.268 | 2.769 |
| Satisfaction of farmers with existing clean energy promotion policies | 4.125 | 3.998 | 4.118 | 3.946 | 3.941 | 3.538 |
| Farmers’ living clean energy adoption behavior | 2.541 | 3.046 | 2.045 | 3.324 | 3.003 | 2.487 |
| RS | BS | STS | SUS | ED | LS | HD | SB | X1 | X2 | X3 | X4 | X5 | X6 | X7 | |
|---|---|---|---|---|---|---|---|---|---|---|---|---|---|---|---|
| RS | 1 | −0.548 ** | −0.287 ** | −0.244 ** | 0.015 | −0.092 ** | −0.036 | 0.081 ** | −0.053 * | −0.128 ** | 0.061 * | 0.025 | −0.018 | 0.008 | −0.014 |
| BS | −0.548 ** | 1 | −0.327 ** | −0.279 ** | 0.010 | −0.124 ** | −0.071 ** | −0.035 | 0.034 | 0.015 | 0.008 | −0.028 | 0.057 * | 0.001 | 0.081 ** |
| STS | −0.287 ** | −0.327 ** | 1 | −0.146 ** | 0.004 | 0.156 ** | 0.019 | −0.022 | −0.020 | −0.027 | 0.037 | −0.018 | −0.073 ** | −0.006 | −0.031 |
| SUS | −0.244 ** | −0.279 ** | −0.146 ** | 1 | −0.012 | 0.036 | 0.094 ** | −0.050 | 0.034 | 0.117 ** | −0.035 | 0.032 | 0.036 | 0.033 | −0.028 |
| ED | 0.015 | 0.010 | 0.004 | −0.012 | 1 | −0.140 ** | −0.066 * | −0.030 | −0.018 | −0.106 ** | 0.134 ** | 0.095 ** | 0.364 ** | 0.236 ** | 0.215 ** |
| LS | −0.092 ** | −0.124 ** | 0.156 ** | 0.036 | −0.140 ** | 1 | 0.043 | −0.082 ** | 0.092 ** | 0.161 ** | −0.166 ** | −0.055 * | −0.086 ** | −0.088 ** | −0.083 ** |
| HD | −0.036 | −0.071 ** | 0.019 | 0.094 ** | −0.066 * | 0.043 | 1 | −0.032 | −0.036 | 0.314 ** | −0.358 ** | 0.051 | −0.058 * | −0.018 | −0.065 * |
| SB | 0.081 ** | −0.035 | −0.022 | −0.050 | −0.030 | −0.082 ** | −0.032 | 1 | −0.006 | −0.030 | 0.011 | −0.023 | −0.073 ** | −0.088 ** | −0.060 * |
| X1 | −0.053 * | 0.034 | −0.020 | 0.034 | −0.018 | 0.092 ** | −0.036 | −0.006 | 1 | 0.023 ** | 0.007 | 0.001 | 0.033 | −0.056 * | −0.004 |
| X2 | −0.128 ** | 0.015 | −0.027 | 0.117 ** | −0.106 ** | 0.161 ** | 0.314 ** | −0.030 | 0.023 ** | 1 | −0.458 ** | 0.009 | −0.080 ** | −0.092 ** | −0.052 |
| X3 | 0.061 * | 0.008 | 0.037 | −0.035 | 0.134 ** | −0.166 ** | −0.358 ** | 0.011 | 0.007 | −0.458 ** | 1 | −0.065 * | 0.113 ** | 0.175 ** | 0.109 ** |
| X4 | 0.025 | −0.028 | −0.018 | 0.032 | 0.095 ** | −0.055 * | 0.051 | −0.023 | 0.001 | 0.009 | −0.065 * | 1 | 0.139 ** | 0.177 ** | 0.313 ** |
| X5 | −0.018 | 0.057 * | −0.073 ** | 0.036 | 0.364 ** | −0.086 ** | −0.058 * | −0.073 ** | 0.033 | −0.080 ** | 0.113 ** | 0.139 ** | 1 | 0.371 ** | 0.321 ** |
| X6 | 0.008 | 0.001 | −0.006 | 0.033 | 0.236 ** | −0.088 ** | −0.018 | −0.088 ** | −0.056 * | −0.092 ** | 0.175 ** | 0.177 ** | 0.371 ** | 1 | 0.339 ** |
| X7 | −0.014 | 0.081 ** | −0.031 | −0.028 | 0.215 ** | −0.083 ** | −0.065 * | −0.060 * | −0.004 | −0.052 | 0.109 ** | 0.313 ** | 0.321 ** | 0.339 ** | 1 |
| Variable | Model 1 | Model 2 | Model 3 | Model 4 | ||||
|---|---|---|---|---|---|---|---|---|
| B | S.E. | B | S.E. | B | S.E. | B | S.E. | |
| RS | 0.660 *** | 0.141 | 0.602 *** | 0.142 | 0.599 *** | 0.14 | 0.573 *** | 0.136 |
| BS | −0.035 * | 0.14 | −0.395 ** | 0.141 | −0.398 ** | 0.139 | −0.413 ** | 0.135 |
| STS | 0.871 *** | 0.147 | 0.802 *** | 0.148 | 0.819 *** | 0.146 | 0.787 *** | 0.141 |
| SUS | 0.549 *** | 0.152 | 0.500 *** | 0.152 | 0.477 *** | 0.15 | 0.434 *** | 0.145 |
| ED | 0.140 *** | 0.025 | 0.134 *** | 0.025 | 0.089 *** | 0.026 | 0.070 ** | 0.026 |
| LS | 0.322 ** | 0.098 | 0.382 *** | 0.099 | 0.413 *** | 0.098 | 0.426 *** | 0.095 |
| HD | 0.105 *** | 0.027 | 0.123 *** | 0.029 | 0.120 *** | 0.029 | 0.105 *** | 0.028 |
| SB | −0.223 *** | 0.053 | −0.221 *** | 0.053 | −0.202 *** | 0.052 | −0.172 *** | 0.05 |
| X1 | −0.203 *** | 0.055 | −0.215 *** | 0.054 | −0.182 *** | 0.052 | ||
| X2 | 0.002 | 0.002 | 0.003 | 0.002 | 0.002 | 0.002 | ||
| X3 | 0.081 ** | 0.029 | 0.087 ** | 0.028 | 0.052 | 0.028 | ||
| X4 | 0.101 *** | 0.021 | 0.083 *** | 0.022 | ||||
| X5 | 0.107 *** | 0.029 | 0.032 | 0.03 | ||||
| X6 | 0.270 *** | 0.028 | ||||||
| X7 | −0.051 | 0.027 | ||||||
| Constant term | 1.657 *** | 0.193 | 1.430 *** | 0.251 | 0.769 ** | 0.27 | 0.681 ** | 0.263 |
| Adjusted R2 | 0.279 | 0.288 | 0.307 | 0.352 | ||||
| P | 0 | 0 | 0 | 0 | ||||
| Variable | Model 5 | Model 6 | Model 7 | |||
|---|---|---|---|---|---|---|
| B | S.E. | B | S.E. | B | S.E. | |
| RS | 0.556 *** | 0.143 | 0.503 *** | 0.150 | 0.610 *** | 0.147 |
| BS | −0.356 * | 0.142 | −0.374 * | 0.149 | −0.278 | 0.146 |
| STS | 0.678 *** | 0.149 | 0.679 *** | 0.156 | 0.722 *** | 0.153 |
| SUS | 0.407 ** | 0.153 | 0.343 * | 0.160 | 0.518 *** | 0.157 |
| ED | 0.083 ** | 0.027 | 0.032 | 0.028 | 0.056 * | 0.028 |
| LS | 0.455 *** | 0.100 | 0.504 *** | 0.105 | 0.411 *** | 0.102 |
| HD | 0.068 * | 0.029 | 0.088 * | 0.031 | 0.067 * | 0.030 |
| SB | −0.113 * | 0.053 | −0.181 *** | 0.056 | −0.195 *** | 0.055 |
| X1 | −0.159 ** | 0.055 | −0.166 ** | 0.058 | −0.166 ** | 0.057 |
| X2 | 0.002 | 0.002 | 0.002 | 0.002 | 0.003 | 0.002 |
| X3 | 0.036 | 0.029 | 0.040 | 0.031 | 0.051 | 0.030 |
| X4 | 0.063 ** | 0.023 | 0.082 *** | 0.024 | 0.124 *** | 0.023 |
| X5 | 0.037 | 0.032 | 0.023 | 0.033 | 0.084 ** | 0.033 |
| X6 | 0.255 *** | 0.029 | 0.327 *** | 0.031 | 0.267 *** | 0.030 |
| X7 | −0.029 | 0.028 | −0.055 | 0.029 | −0.079 ** | 0.029 |
| Constant term | 0.786 ** | 0.277 | 0.747 ** | 0.291 | 0.559 | 0.285 |
| Adjusted R2 | 0.285 | 0.286 | 0.289 | |||
| P | 0.000 | 0.000 | 0.000 | |||
| Variable | Raising Stage | Burdening Stage | Stable Stage | Supported Stage | ||||
|---|---|---|---|---|---|---|---|---|
| B | S.E. | B | S.E. | B | S.E. | B | S.E. | |
| ED | 0.135 ** | 0.051 | 0.035 | 0.030 | 0.189 * | 0.080 | 0.070 | 0.082 |
| LS | 0.540 ** | 0.173 | 0.198 | 0.176 | 0.739 *** | 0.219 | 0.293 | 0.332 |
| HB | 0.169 *** | 0.050 | 0.071 | 0.037 | 0.105 | 0.083 | 0.030 | 0.087 |
| SB | −0.144 * | 0.068 | −0.272 *** | 0.075 | −0.052 | 0.233 | −0.401 | 0.316 |
| X1 | −0.249 ** | 0.094 | −0.011 | 0.068 | −0.446 ** | 0.154 | 0.049 | 0.184 |
| X2 | 0.006 | 0.005 | −0.002 | 0.003 | 0.009 | 0.008 | 0.000 | 0.007 |
| X3 | 0.090 | 0.052 | 0.005 | 0.035 | 0.063 | 0.089 | 0.059 | 0.094 |
| X4 | 0.141 *** | 0.040 | 0.015 | 0.026 | 0.120 | 0.071 | 0.248 ** | 0.079 |
| X5 | 0.095 | 0.060 | −0.070 | 0.037 | −0.021 | 0.091 | 0.064 | 0.098 |
| X6 | 0.413 *** | 0.053 | 0.124 *** | 0.033 | 0.373 *** | 0.094 | 0.470 *** | 0.088 |
| X7 | −0.099 * | 0.047 | −0.040 | 0.033 | −0.115 | 0.099 | −0.155 | 0.095 |
| Constant term | −0.131 | 0.429 | 1.947 *** | 0.303 | 0.687 | 0.786 | 0.406 | 0.767 |
| N | 448 | 532 | 202 | 153 | ||||
| Adjusted R2 | 0.278 | 0.051 | 0.200 | 0.239 | ||||
| P | 0.000 | 0.000 | 0.000 | 0.000 | ||||
Disclaimer/Publisher’s Note: The statements, opinions and data contained in all publications are solely those of the individual author(s) and contributor(s) and not of MDPI and/or the editor(s). MDPI and/or the editor(s) disclaim responsibility for any injury to people or property resulting from any ideas, methods, instructions or products referred to in the content. |
© 2023 by the authors. Licensee MDPI, Basel, Switzerland. This article is an open access article distributed under the terms and conditions of the Creative Commons Attribution (CC BY) license (https://creativecommons.org/licenses/by/4.0/).
Share and Cite
Ding, X.; Wang, J.; Li, S. The Impact of Family Life Cycle on Farmers’ Living Clean Energy Adoption Behavior—Based on 1382 Farmer Survey Data in Jiangxi Province. Agriculture 2023, 13, 2084. https://doi.org/10.3390/agriculture13112084
Ding X, Wang J, Li S. The Impact of Family Life Cycle on Farmers’ Living Clean Energy Adoption Behavior—Based on 1382 Farmer Survey Data in Jiangxi Province. Agriculture. 2023; 13(11):2084. https://doi.org/10.3390/agriculture13112084
Chicago/Turabian StyleDing, Xiang, Jing Wang, and Shiping Li. 2023. "The Impact of Family Life Cycle on Farmers’ Living Clean Energy Adoption Behavior—Based on 1382 Farmer Survey Data in Jiangxi Province" Agriculture 13, no. 11: 2084. https://doi.org/10.3390/agriculture13112084
APA StyleDing, X., Wang, J., & Li, S. (2023). The Impact of Family Life Cycle on Farmers’ Living Clean Energy Adoption Behavior—Based on 1382 Farmer Survey Data in Jiangxi Province. Agriculture, 13(11), 2084. https://doi.org/10.3390/agriculture13112084