Abstract
Remote sensing, the Internet, the Internet of Things (IoT), artificial intelligence, and other technologies have become the core elements of modern agriculture and smart farming. Agricultural production and management modes guided by data and services have become a cutting-edge carrier of agricultural information monitoring, which promotes the transformation of the intelligent computing of remote sensing big data and agricultural intensive management from theory to practical applications. In this paper, the main research objective is to construct a new high-frequency agricultural production monitoring and intensive sharing service and management mode, based on the three dimensions of space, time, and attributes, that includes crop recognition, growth monitoring, yield estimation, crop disease or pest monitoring, variable-rate prescription, agricultural machinery operation, and other automatic agricultural intelligent computing applications. The platforms supported by this mode include a data management and agricultural information production subsystem, an agricultural monitoring and macro-management subsystem (province and county scales), and two mobile terminal applications (APPs). Taking Shandong as the study area of the application case, the technical framework of the system and its mobile terminals were systematically elaborated at the province and county levels, which represented macro-management and precise control of agricultural production, respectively. The automatic intelligent computing mode of satellite–air–ground spatiotemporal collaboration that we proposed fully couples data obtained from satellites, unmanned aerial vehicles (UAVs), and IoT technologies, which can provide the accurate and timely monitoring of agricultural conditions and real-time guidance for agricultural machinery scheduling throughout the entire process of agricultural cultivation, planting, management, and harvest; the area accuracy of all obtained agricultural information products is above 90%. This paper demonstrates the necessity of customizable product and service research in agricultural intelligent computing, and the proposed practical mode can provide support for governments to participate in agricultural macro-management and decision making, which is of great significance for smart farming development and food security.
1. Introduction
With the expansion of application scenarios and the reduction in satellite launch costs, remote sensing observation and application capabilities are rapidly developing, and information updating capabilities are greatly enhanced [1]. Remote sensing has the advantages of a wide coverage, fast observation cycle, and low cost. It is widely used in agriculture, ecology, oceanography, military, and other fields. It is an indispensable data source for current constructions of systems, such as smart agriculture and digital cities, and has significant economic and social value.
High resolution can refer to high spatial resolution, high temporal resolution, high spectral resolution, or high radiometric resolution, and the spatial resolution of high-resolution Earth observation satellites has entered the era of the sub-meter level. The WorldView-3 satellite of the United States has a resolution of 0.31 m [2,3], the commercial synthetic aperture radar satellite TerraSAR-X of Germany has a resolution of 0.25 m [4], and the SPOT [5] series of satellites of France have a spatial resolution of up to 0.25 m. With the increasing demand for the rapid revisiting of high-resolution satellites, Earth observation satellite constellations are rapidly developing. China uses remote sensing satellites as its main imaging resources, and an integrated observation platform for space and ground [6], including unmanned aerial vehicle systems and ground sensors, has been established [7]. Various high-resolution data acquisition methods have been gradually developed, greatly improving the self-sufficiency rate of spatial data and playing an important role in supporting major national and regional applications [8]. For example, China’s high-resolution remote sensing satellites include Jilin-1 and Gaojing-1, with a high spatial resolution that is better than 0.5 m [9]. Among them, the high-resolution series of satellites have achieved multiple types of coverage ranging from optics to radar, from panchromatic to hyperspectral imagery, and from solar synchronous orbit to Earth synchronous orbit, forming an Earth observation system with high spatiotemporal and spectral resolution capabilities [10].
In recent years, high-resolution remote sensing technology has greatly promoted the development of refined and quantitative agricultural environmental information extraction research, and agricultural remote sensing monitoring has also shifted to the extraction of agricultural information from fine-scale and high-frequency observations of land parcels, which is of great significance for the timely and accurate monitoring of crop growth status [11]. Remote sensing, as an effective means of obtaining macroscopic and rapid surface information, provides an efficient solution for crop growth monitoring, and satellites can achieve continuous observation with full coverage and multiple spatiotemporal resolutions. Through the fusion and feature transformation of multi-dimensional remote sensing spectral bands, spectral sequencing characterization of the composition and change process of surface elements can be achieved [12]. The Landsat series of satellites have provided important data resources for global and regional statuses and change monitoring by continuous observation over 50 years [13]. EO-1 is equipped with Hyperion, the first spaceborne spectral imager, which utilizes hyperspectral characteristics to provide rich spectral information for research, such as crop yield estimation and agricultural precision mapping [14].
Remote sensing satellites provide us with the ability to quickly obtain rich band information in a large range of images, while the development of UAV remote sensing technology and the ground Internet of Things technology can provide more flexible observation methods to obtain rich spatial details and high-accuracy ground information with a spatial resolution of up to the centimeter level [15,16,17]. Among them, sensors such as RGB, hyperspectral, and thermal imaging cameras can be used for all applications of drone remote sensing in precision agriculture research. In addition, there has been improvement in the performance of ground IoT devices, such as ground meteorological sensors, soil sensors, and spore collectors, which provide detailed crop morphology and parameter information for agricultural monitoring applications, such as drought stress monitoring, disease or pest monitoring, growth monitoring, and yield prediction [18]. These ground-station observations can provide absolute and true measurement values of discrete points in continuous time series, but it is difficult to achieve a large range of area with full coverage in space. Relying solely on any single data set for agricultural information monitoring will lead to difficulties in meeting the high standards of product accuracy, time frequency, reliability, and other practical application requirements. Therefore, coupling land parcels from satellite observations, surface features obtained from UAVs, and ground data obtained from IoT technology are effective ways to achieve high-frequency and high-accuracy monitoring of agricultural information [19,20].
With the development of modern information technologies such as cloud computing, the IoT, and artificial intelligence, the diversity of the spatiotemporal spectrum and the depth of information services in agricultural remote sensing have significantly improved [21]. These technologies have been widely applied in fields such as crop mapping, agricultural parameter inversion, growth monitoring, yield estimation, pest or disease prediction, irrigation, pesticide and fertilizer prescription mapping, and agricultural machinery-assisted operations. Crop spatial distribution mapping and planting area estimation are fundamental elements of crop growth monitoring and play an important role in agricultural production management and policy formulation [22]. Multisource data fusion and deep learning algorithms are currently the main development directions of crop mapping. Many scholars have continuously improved the accuracy of crop mapping by utilizing high-resolution remote sensing data [23,24], multisource feature sets [25], and advanced classification algorithms [26,27]. In terms of crop growth monitoring [28,29] and yield estimation [30,31,32], various types of data from different sensor platforms, such as satellites, UAVs, and the IoT on the ground, have become the main data sources [33]. On this basis, the combination of crop growth models and deep learning models is the development direction of crop growth monitoring and yield estimation research at present and in the future. In addition, significant progress has been made in research in fields such as disease or pest prediction [34,35], irrigation, pesticide and fertilizer prescription mapping [36,37,38], and environmental parameter inversion [39,40]. Based on the above research, smart agriculture can utilize technologies such as the Internet of Things, cloud computing, big data, and artificial intelligence to gather, process, and analyze agricultural data. It also can utilize computer- and software-related technologies to integrate various algorithm models and application models, develop a complete agricultural decision-making management system, and conduct real-time monitoring and diagnosis of crop growth, disease or pest conditions, soil environmental and meteorological conditions, nutrient requirements, etc. Meanwhile, through the real-time adjustment and control of agricultural production equipment such as water–fertilizer-integrated machines, it can achieve precise fertilization and irrigation of crops, improve crop yield, and reduce production costs. In addition, with the help of navigation and positioning systems and automated unmanned driving technology, smart agricultural machinery such as intelligent harvesters and autonomous tractors that are suitable for different stages of cultivation, planting, management, and harvest, have been developed, which can improve the efficiency of agricultural machinery operations and farmers’ labor productivity, as well as provide comprehensive real-time and high-frequency monitoring and intensive sharing services for agricultural production.
In the current large-scale management of agricultural production in Shandong Province, due to factors such as insufficient manpower, lack of experience in agricultural production, and untimely access to farmland information, a series of problems have emerged, such as an unreasonable formulation of management measures, waste of agricultural resources, and insufficient utilization of farmland production potential. The traditional management model has mainly relied on human experience. To date, agricultural management requires using digital production technology to accurately monitor agricultural information and support decision-making services in a timely manner, which will help to reduce the demand for personnel and professional knowledge and guarantee the sustainable development of modern smart agriculture. In addition, agricultural socialization provides a series of services such as agricultural machinery leasing and crop pest control throughout the entire process of planting. It reasonably allocates agricultural resources, alleviates the constraints of agricultural labor and technology, increases agricultural income and profitability, and motivates farmers to further expand their management scale. Currently, remote sensing technology has been widely used in the agricultural field, which plays a key role in the multiscale assessment of planting status, macro-management, and decision making [41,42,43]. However, the high level of professionalism required of remote sensing information extraction and the gap between the accuracy of information extraction results and the needs of agricultural production have also constrained the further development of remote sensing technology in the agricultural production and management process, resulting in difficulties in achieving high-performance intelligent transformation from the use of remote sensing big data to refined services in agricultural scenario construction, accurate information extraction, and thematic product customization, which greatly limit the depth and breadth of agricultural remote sensing applications [44]. In response to the above issues, this study focused on the demand for information services in the process of agriculture production and management and integrated satellite–air–ground observation data with models of agricultural monitoring. It also constructed agricultural information production lines to support high-frequency monitoring and intensive sharing services and established a mutual assistance mechanism between remote sensing monitoring technology and agricultural analysis models that can help to improve the precise management and production in the agricultural field and promote the development of the rural digital economy.
2. Materials and Methods
2.1. Study Area
This study was conducted in Shandong Province, which lies in the coastal area of East China, bordering the Bohai Sea and the Yellow Sea, and extending from 34.38° N to 38.40° N and from 114.79° E to 122.71° E (Figure 1). This province belongs to the warm temperate monsoon climate, with an average annual temperature range of 11–14 °C, an average lighting hours range of 2290–2890 h, and an annual average precipitation range of approximately 550–950 mm. The planting area is 83,845.42 km2, accounting for 53.82% of the province’s area. Grain crops are planted in the summer and autumn, and wheat, corn, peanuts, soybeans, etc., are the main grain crops in Shandong. The demonstration county was selected to be in Feicheng, which is located in Tai’an City.
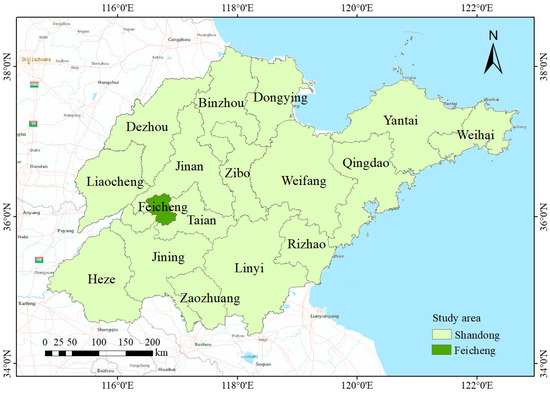
Figure 1.
Location of the study area.
2.2. Data Sources and Preprocessing
The basic data used to generate agricultural information can be divided into four parts: (1) satellite remote sensing data; (2) UAV remote sensing data; (3) IoT monitoring data; and (4) intelligent agricultural machinery collection data, ground manual survey data, basic background data, statistical data, and other data.
2.2.1. Satellite Data
The remote sensing images used in this study included Sentinel-2 and Gaofen (GF) series data from 2021 to 2023. Sentinel-2 images are freely available for users to download from the European Space Agency (ESA)’s scientific data hub portal (https://scihub.copernicus.eu/, accessed on 30 June 2023). GF-1 and GF-6 satellite images are provided freely by the China Centre for Resources Satellite Data and Application (CRESDA) (http://www.cresda.com, accessed on 17 July 2023). After preprocessing operations, such as radiometric calibration, atmospheric correction, geometric correction, fusion, and mosaic, multi-spectral remote sensing image sets with spatial resolutions of 8 m, 10 m, and 16 m, covering the entire province, were formed, and multi-spectral remote sensing images with a spatial resolution of 2 m at the county scale were obtained via these preprocessing operations. In addition, it was required that, after cloud removal, the area of all remote sensing images covered by clouds or dense fog should not exceed 20% of the total image area. Table 1 shows the satellite data set of the high-frequency monitoring and intensive sharing service system.

Table 1.
Satellite data set of the high-frequency monitoring and intensive sharing service system.
2.2.2. UAV Data
The UAVs were equipped with hyperspectral, synthetic aperture radar (SAR), and multispectral sensors, and their aerial products were mainly used for the inversion of agricultural information products at the county scale. This procedure required reflectance products or point cloud data that had been preprocessed, such as via spatiotemporal consistency processing and mosaic. The spatial resolution was better than 2 m, covering both summer and autumn crops.
2.2.3. IoT Data
The IoT data used in this study mainly included monitoring data obtained from ground IoT devices, such as meteorological sensors, soil sensors, and spore collectors. The IoT supported at least 1000 sensing terminal devices in Shandong Province and at least 10 types of monitoring elements, such as atmospheric temperature, atmospheric humidity, soil temperature, soil humidity, and spore quantity.
2.2.4. Other Auxiliary Data
Other multisource auxiliary data included basic data such as intelligent agricultural machinery data, manual ground survey data, basic background data, and agricultural statistical data. The intelligent agricultural machinery data referred to type (intelligent driving tractors, wheat harvesters, corn harvesters, and plant protection machines), quantity (200 units), working status (working and offline), real-time speed, operation duration, etc. The manual ground survey data included distribution, pests and diseases, and growth information of wheat and corn collected via mobile phones and GPS devices. The basic background data included soil type and attribute data (soil moisture and organic matter content), ecological zoning data, and digital elevation model (DEM) data with a resolution of 30 m in Shandong Province. The statistical data referred to information collected by the agricultural department, such as crop planting area, yield, and fertilizer application rates, which were used for comparative analysis and validation of result accuracy.
2.3. Methods
The high-frequency monitoring and intensive sharing service system was built around the specific needs of macro-management and fine-scale agricultural monitoring and information services in agricultural production. Based on the current hardware infrastructure and key technologies, we designed and developed a data management and agricultural information production subsystem and an agricultural monitoring and macro-management subsystem. We aim to provide an information-enabled agriculture service for various levels of agricultural management departments, scientific researchers, agricultural enterprises, farmers, and other users. This system will provide technical support for the development of regional agricultural intensive sharing operation mode and set an example for the application of the IoT, the Internet, and other technologies in the agricultural field. The system framework proposed in this study is presented in Figure 2 and Figure 3.
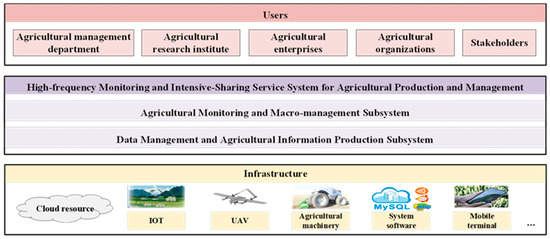
Figure 2.
The overall architecture of the high-frequency monitoring and intensive sharing service system mode.
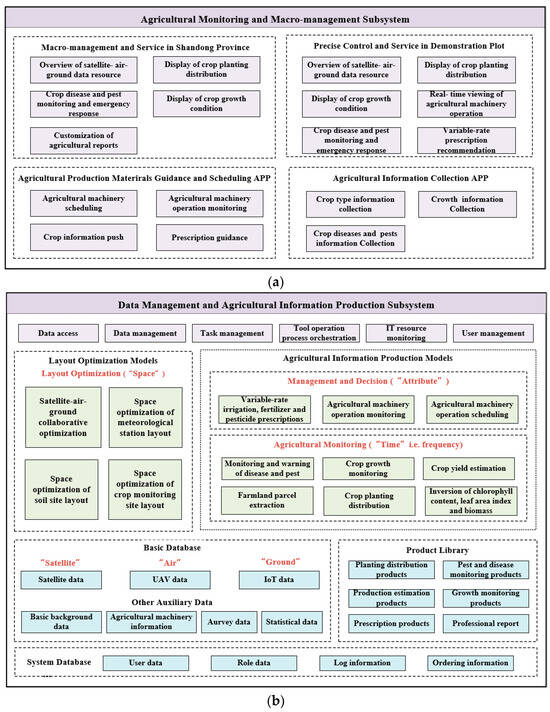
Figure 3.
Functional framework of the two subsystems: (a) functional framework of the agricultural monitoring and macro-management subsystem, and (b) functional framework of the data management and agricultural information production subsystem.
2.3.1. Access and Management of Satellite–Air–Ground Stereoscopic Monitoring Data
The data management and agricultural information production subsystem was developed aiming at fully tapping into various types of observation data, such as satellite, UAV, and IoT data, to achieve real-time access, management, and integration of remote sensing, field survey, meteorological, and soil data collected via a satellite–air–ground spatiotemporal collaboration network [45,46,47,48]. Figure 4 shows the satellite–air–ground monitoring network of this study.
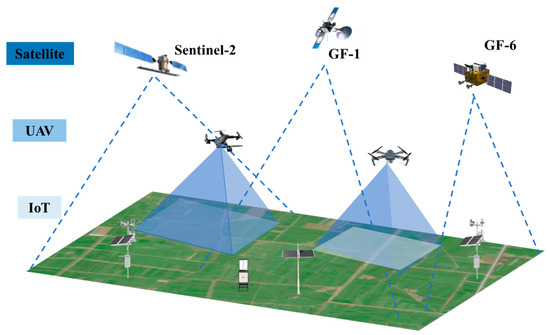
Figure 4.
Satellite–air–ground monitoring network.
This study established a database of satellites and onboard sensors, including satellite orbit parameters, sensor side-view angles, maximum imaging boundaries, imaging width, and other parameter files. By setting a time interval and overlaying the selected satellite sensors with the ground vector area, the transit access time and area coverage percentage report of the satellite sensors were obtained. Then, we deleted the imaging batches that repeatedly accessed the region and, ultimately, formed a networking solution with multiple satellites, sensors, and imaging modes. Then, based on crop growth monitoring indicators, we calculated the required range and time frequency, and developed a plan for the coverage range and frequency of UAV data based on satellite transit time and spatiotemporal spectral blind zone distribution, which can compensate for the problem of insufficient satellite data in some regions. In response to the spatiotemporal spectral blind spots that could not be covered by both satellites and UAVs, this study adopted a spatial data analysis method to design the layout plan of the ground IoT nodes. Through semi-variance function analysis of regular grids, q-value analysis of geographical detectors, and overlay analysis of existing partitions, the maximum value of different station numbers was taken as the final required number of stations. At the same time, spatial uniformity and attribute representativeness were considered in space, and temporal similarity of NDVI was considered in time. Using the average shortest distance, minimum estimation error, and uniform distribution of cumulative probability as the objective functions, the optimal spatial distribution of the stations was ultimately determined using multi-objective optimization algorithms. The IoT devices were connected to the system through interfaces to provide real-time monitoring data.
This subsystem can achieve multiscale integration of basic geographic information data, agricultural thematic products, and other agricultural resource data. It can establish resource archives and spatiotemporal data resource libraries for the main agricultural industries and achieve comprehensive management and coordinated utilization of various types of data. It stores and manages satellite–air–ground spatiotemporal collaboration data, basic data, agricultural data, thematic products, and other categories. The satellite–air–ground data include satellite, UAV, and IoT (related to meteorology, soil, pets, etc.) data, while the basic data mainly include administrative boundaries, terrain and geomorphological data, and basic background data (related to climate, ecology, etc.). The agricultural data mainly include various agricultural statistical data, such as planting area, yield, and fertilizer application rates of wheat and corn, provided by the agricultural department in recent years. The thematic products are various agricultural thematic information products and reports produced by the platform through intelligent computing. In the process of aggregating the above data, it is necessary to consider the management and cleaning of access data, forming a complete and unified standard of data and technical specifications so as to standardize the access data, ensure the quality and consistency of the data, and better provide data sharing services for subsequent production of various thematic products. At the same time, it is necessary to clarify the data organization method, storage format, attribute information, etc., and associate the originally isolated data with spatiotemporal and attribute benchmarks. By utilizing attribute information such as time, location, scale, and semantics, the relationship between multisource heterogeneous data and geographic patterns can be constructed, which can help to lay the data foundation for achieving spatiotemporal collaborative correlation analysis of subsequent agricultural information, expanding the dimension of data features, and enhancing the value of data utilization.
2.3.2. Integration of Multi-Dimensional Knowledge Models
This study integrated thematic information production and analysis models such as agricultural parameter inversion, agricultural information monitoring, pest or disease prediction, irrigation, pesticide and fertilizer prescriptions, and agricultural machinery scheduling to achieve the management of various models and service-oriented release of agricultural information products, thereby forming a knowledge base, a model base, and a product base for macro-management and agriculture information services in Shandong Province.
The remote sensing models involved in the subsystem can be generally divided into three categories in terms of time, space, and attribute dimensions. The first type is a monitoring network layout optimization model for “space” dimension, which optimizes the layout of UAV and IoT sensors based on multisource and multiscale remote sensing satellite data, determines the composition of satellite–air–ground data in the agricultural information network, and realizes the layout optimization of the sensor network for satellite, UAV, and ground IoT data. The second type is a remote sensing monitoring model for agricultural information that focuses on spatiotemporal collaboration in the “time” dimension, i.e., frequency. It carries out the extraction of wheat and corn planting distribution information and inversion of agricultural parameters, and quantitatively and automatically generates wheat and corn growth information every 7 days, as well as yield and pest or disease prediction based on the above patterns’ information. The third type includes agricultural production prescription decision-making models that are oriented toward the “attribute” dimension, which aggregate soil, irrigation, pesticide, fertilization, and intelligent agricultural machinery operation information on the basis of agricultural information patterns. Through multi-granularity attribute correlation analysis, this subsystem can fully perform specialized agricultural production application and decision-making analysis of irrigation, pesticide, and fertilizer prescriptions for wheat and corn, and agricultural machinery operations during the process of agricultural cultivation, planting, management, and harvest.
In the process of professional model integration, the model accuracy of some specific regional applications may be relatively low, or the supervised samples may be increased due to neglecting the complex characteristics of agricultural information inversion and the limited suitability and generalization ability of the model algorithms. To solve these problems, this study was guided by artificial cognitive mind and comprehensively analyzed the laws of similarity and heterogeneity in the distribution of geographical elements. Following a top-down approach, we constructed an integrated framework of the “zone-stratification” model [49]. To meet the needs of different regions, zoning rules were formulated with agricultural geographical zoning by integrating various types of multi-source, heterogeneous, and multiscale data, and we combined road networks, terrain lines, river networks, and other elements with the zoning range, image resolution, and interpretation unit size to divide the target area into several relatively independent interpretation task areas [50]. Within each geographical zone, based on the remote sensing features of the analyzed object, we developed processes of model operation and production and integrated different thematic information production models; then, various agricultural information was extracted by layer based on temporal, texture, and other features, which enabled the zone-stratification model to have the ability to automatically generate product information of full coverage (Figure 5).
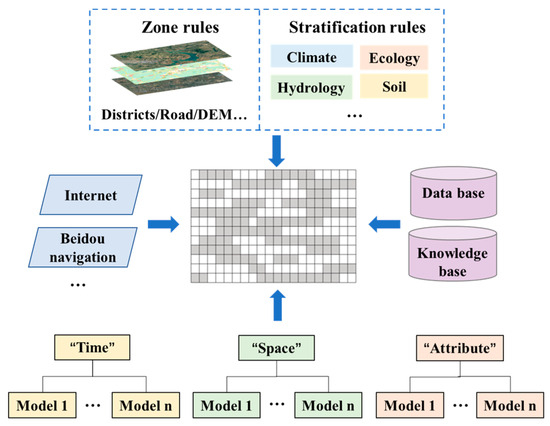
Figure 5.
Integration mechanism of multi-dimensional model.
2.3.3. Remote Sensing Monitoring and Intelligent Computing of Agricultural Information
The rapid development of high-resolution remote sensing technology has laid the big data foundation for the acquisition, rapid update, and sharing of large-scale agricultural information [51]. The data management and agricultural information production subsystem consists of functional modules such as parallel operation of intelligent computing models and production scheduling at the task level, and corresponding computing service APIs to support the customized development of thematic information production and application systems. This subsystem aims to achieve workflow-oriented operations and production, including the allocation and management of production tasks, parallel computing of information products, and quality testing and examination of products. Following the collaborative computing route of satellite–air–ground monitoring, this subsystem organically combines remote sensing models, agricultural mechanisms, and intelligent computing from the three dimensions of time, space, and attributes. The focus is on optimizing the layout of the spatial and temporal monitoring network, as well as customizing the software production line for important agricultural information, such as planting spatiotemporal distribution, growth monitoring, disease or pest warning, irrigation, and pesticide and fertilizer prescriptions for wheat and corn. Through customized information production task scheduling and production processes, rapid, regular, and dynamic updates of agricultural information for wheat and corn can be realized in Shandong Province. It can automatically monitor wheat and corn growth every 7 days at the province level and every 5 days at the county level, extract spatial distribution of planting area, estimate yield once a year, monitor pests and diseases, and produce variable prescriptions of pesticides, irrigation, and fertilizers for wheat and corn as needed. In addition, based on the requirements of the application service, the subsystem provides customized agricultural remote sensing monitoring and analysis report to offer support for the government’s macro-management of agricultural conditions and related agricultural decision making. Figure 6 presents the intelligent calculation process of yield estimation as an example to introduce the production of agricultural information by this subsystem.
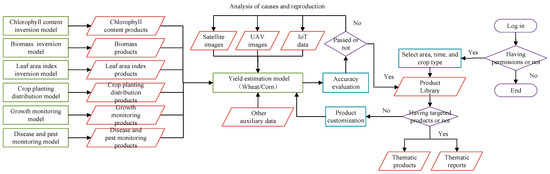
Figure 6.
Production process of agricultural information (taking the intelligent computing of yield estimation products as an example).
The yield estimation process includes three steps: mapping of crop planting distribution, growth monitoring, and yield estimation (Figure 7). In this study, crop planting distribution was calculated using a 3D convolutional neural network (CNN) deep learning algorithm. The convolutional layer adopts a three-dimensional convolutional kernel. The channel size used in the 3D convolutional kernel is smaller than the input image cube, so it can be used for sliding convolution in the spatial and spectral domains for feature extraction, thereby continuously capturing the changing feature information in both domains and generating a set of feature cubes. Specifically, in the three-dimensional convolutional mth layer, the value of the (x, y, z) position on the jth feature cube can be written as follows:
where Hm and Wm are the spatial size of the three-dimensional convolutional kernel, Dm is the channel length of the 3D kernel, i is the number of feature cubes in the previous layer, j is the number of cores in the mth layer, is the output of the (x, y, z) position calculated based on the convolution of the ith feature cube and the jth kernel in the previous layer, and is the (h, w, d)th value corresponding to the kernel of the ith feature cube in the previous layer.
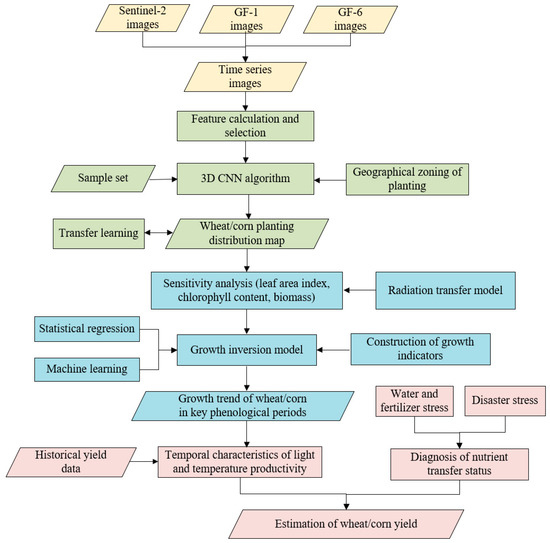
Figure 7.
Technology roadmap (taking yield estimation as an example).
During growth monitoring, the ground seedling condition is used as the truth value to analyze the temporal dynamic characteristics and synergistic changes of the three growth parameters (leaf area index (LAI), soil and plant analyzer development (SPAD), and biomass (Biom)) in the canopy spectrum during the critical growth period. The comprehensive condition index (CCI) is constructed, which integrates the abovementioned three growth parameters. Its calculation is as follows:
where is the comprehensive growth index of the crop in the dth stage of the growth period; , , and are the indexes of the three growth parameters in the dth stage of the growth period; and , , and are the weight coefficients of the corresponding three indicators.
Net primary productivity (NPP) is one of the important considerations for yield estimation, and its calculation formula is as follows:
where is the light and effective radiation absorbed by pixel x in month t, and is the actual light energy utilization rate of pixel x in month t.
where Y is the yield per unit area of crop; T is the conversion coefficient between plant carbon content and dry matter mass; P is the proportion of aboveground biomass of the crop in relation to the total biomass; HI is the crop harvest index, determined based on historical yield; and 10 is the conversion coefficient.
In the process of intelligent interpretation of geographical features in large regions, it is challenging to accurately extract thematic information based solely on image features and limited sample input. Therefore, on the basis of partition model integration, the subsystem focuses on object-oriented remote sensing intelligent computing and customization production with attribute migration and iterative optimization, and further integrates and utilizes external data from multiple sources. Meanwhile, through statistical learning, speculative computation, and other methods, it can gradually distinguish attributes from multiple sources of information and transfer external knowledge, thereby improving the accuracy of information analysis. Through inputting the validation data, the attribute information after transfer is revised and confirmed, and learning and iterative optimization are carried out using semi-supervised classification learning to update the interpretation units with low confidence. At the same time, new change features are recalculated based on high-confidence interpretation units for iterative training, ultimately achieving the goal of continuously improving and optimizing the products’ accuracy.
2.3.4. Agricultural Decision Making Based on Crop Growth Monitoring Information, Prescriptions, and Intelligent Terminals
The agricultural monitoring and macro-management subsystem was developed aiming at the macro-management and decision-making needs of the agricultural industry in Shandong Province. This subsystem displays the products calculated by the data management and agricultural information production subsystem through interfaces and then sends them to users. It is equipped with functions such as agricultural information visualization, macro-monitoring, expert consultation and decision-making assistance, and agricultural resource guidance, and regularly provides agricultural information analysis reports. In addition, the county-level agricultural management application not only provides more detailed agricultural information but also includes monitoring and scheduling of agricultural machinery operations, guidance on pesticide, and irrigation and fertilizer prescriptions obtained via the mobile intelligent terminals.
The web-based agricultural remote sensing monitoring and decision support service mainly aims at managers and decision makers of wheat and corn production in Shandong Province. With the support of the data management and agricultural information production subsystem and API computing service, the spatiotemporal distribution and growth status of wheat and corn in Shandong Province are comprehensively and intuitively displayed using map visualization, statistical charts, and other forms. Meanwhile, this service creates a business process of information query, analysis, and display that can provide users with interactive window settings, such as goal setting and parameter settings, as well as a display function of the results.
In addition, based on the shared service support of agricultural information and computing resources, this subsystem can carry out customized development of mobile APP terminals, forming a multi-terminal agricultural-information-sharing service mode. It also provides comprehensive information services for different needs of farmers, agricultural management departments, agricultural machinery operators, and other users, including ground survey collection, agricultural machinery operation scheduling, and agricultural resource guidance services. The Agricultural Information Collection APP can collect various types of agricultural information through crowdsourcing. Agricultural information collectors, plant protectors, and farmers can confirm the land information using maps and remote sensing images displayed in their mobile phone, and they can also upload information such as crop types and growth condition into the subsystem after verification. At the same time, the data collected by the mobile intelligent terminals can be analyzed and compared with the data verified manually in the field to further calibrate the terminal algorithm. This workflow can compensate for the shortcomings of maps/remote sensing images that can only reflect the natural attribute characteristics of land parcels. Figure 8 shows the workflow of the Agricultural Information Collection APP.
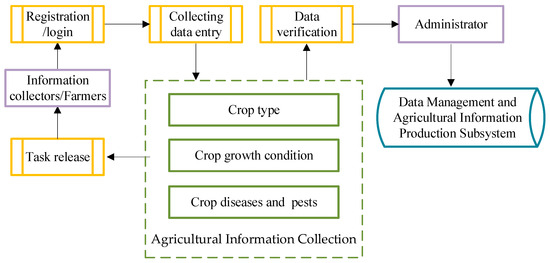
Figure 8.
The workflow of the Agricultural Information Collection APP.
The Agricultural Production Materials Guidance and Scheduling APP was mainly developed aiming at production cooperation organizations and farmers. By combining labor and agricultural production materials, it can efficiently manage and dispatch agricultural materials and machinery. This APP can register and integrate information on the location, status, and ownership of agricultural machinery within the region, and then automatically settle the service orders and calculate the service fees of agricultural machinery. This APP supports the formulation and recommendation of agricultural machinery scheduling plans and helps to make auxiliary decisions for cross-regional scheduling of agricultural machinery. Users can input their requirements, and the APP will dispatch orders nearby or across region based on the existing distribution and status of agricultural machinery, thereby achieving rapid response and large-scale scheduling and maximizing the advantages of a sharing economy. At the same time, through supply and demand analysis, this APP can share application guidance services, such as pesticide formulations for pests and crop diseases, irrigation, and fertilization prescriptions, with a large number of farmers. Figure 9 shows the workflow of the Agricultural Production Materials Guidance and Scheduling APP.
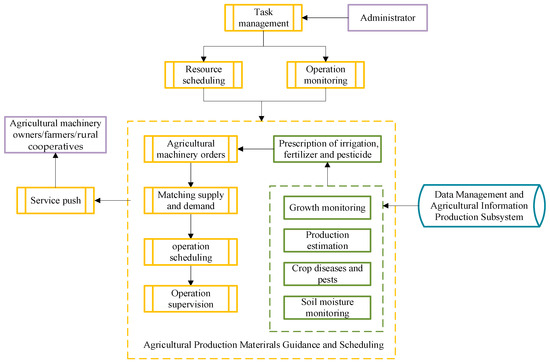
Figure 9.
The workflow of the Agricultural Production Materials Guidance and Scheduling APP.
3. Results
The workflow of the high-frequency monitoring and intensive sharing service system (the data management and agricultural information production subsystem is abbreviated as “Production Subsystem” and the agricultural monitoring and macro-management subsystem is abbreviated as “Management Subsystem”) and intelligent terminals (the Agricultural Information Collection APP is abbreviated as “Collection APP” and the Agricultural Production Materials Guidance and Scheduling APP is abbreviated as “Guidance and Scheduling APP”) is shown in Figure 10. This article provides a detailed introduction of the system’s functional design and implementation through the case of Shandong Province. Based on data obtained from satellites, UAVs, and ground IoT technologies, a remote sensing intelligent computing framework and intelligent terminals are connected for data product generation and services in the time, space, and attribute dimensions. This system presents a new model of intelligent agricultural services for smart farming management and services with quantitative, refined, and thematic innovation.
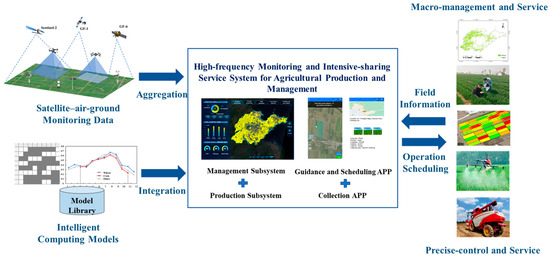
Figure 10.
The workflow of the high-frequency monitoring and intensive sharing service system.
3.1. Macro-Management and Service Interface in Shandong Province
The macro-management and service interface in Shandong Province is mainly aimed at provincial-level agricultural authorities for online display and auxiliary decision making based on the production of crop monitoring information. It focuses on the regular production and updating of important agricultural information, such as planting distribution, multiscale parameter inversion during a key growth period, growth monitoring, yield estimation, and disease or pest prediction for wheat and corn in Shandong Province, which breaks through the current perception and dynamic monitoring of multiscale and high-frequency farmland information and realizes precise and high-frequency monitoring of the agricultural production process. This system can automatically monitor the growth status of wheat and corn in Shandong province every 7 days and in Feicheng every 5 days. In addition, the results of crop recognition and yield estimation can be updated annually, and variable prescriptions of pesticide and fertilizer can be provided as needed.
Figure 11 shows the macro-management and service interface in Shandong (taking the system’s resource monitoring interface as an example). The system provides users with functions such as information query, comprehensive analysis, statistics and visual display by crop type, administrative division, and time. Meanwhile, it assists the government in the macro-management of agricultural conditions and provides business support for relevant agricultural decision making. At the same time, it provides services in terms of customized thematic analyses and reports for relevant users. If an agricultural pest or disaster is predicted, it would issue warnings to government departments to assist them in carrying out targeted emergency management decisions.
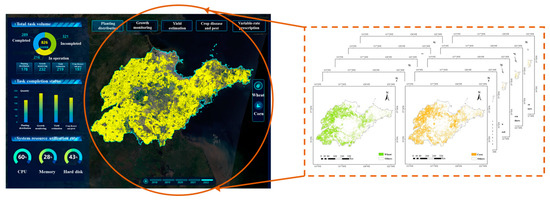
Figure 11.
Resource monitoring interface of the system in Shandong.
Figure 12 shows the comparison of the results (taking planting area and yield as examples). It was found that the extracted area of wheat and corn in Shandong was 3,845,562 ha and 3,828,026 ha, respectively, and the area accuracies of wheat and corn recognition in Shandong were both better than 95%. The estimated yield of wheat and corn was 27,134,101 ton and 24,573,130 ton, respectively, and the accuracies of wheat and corn yield estimation were both above 90%. Figure 13 shows the comparison of calculated planting area and yield with the statistical data for 16 cities in Shandong Province. The results obtained using intelligent computing in this paper are in good agreement with the statistics provided by the agricultural department.
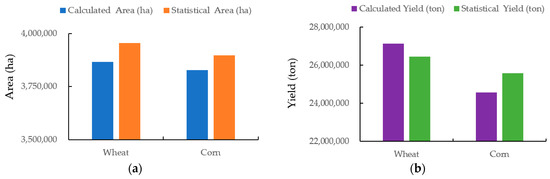
Figure 12.
Comparison of results regarding planting area and yield estimation in Shandong province: (a) comparison of calculated planting area with statistical data, and (b) comparison of calculated yield with statistical data.
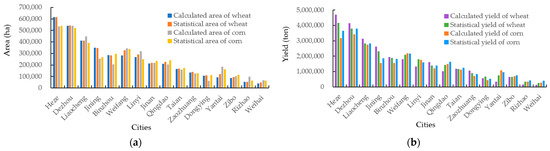
Figure 13.
Comparison of calculated results with statistical data in 16 cities of Shandong province: (a) comparison of calculated planting area with statistical data, and (b) comparison of calculated yield with statistical data.
3.2. Precise Control and Service Interface in Demonstration Plot (Feicheng)
The precise control and service interface in the demonstration plot (Feicheng) was designed to meet the refined management application needs of county-level agricultural authorities and decision makers. Based on the integration of the proposed models and customized business process, it realizes automatic crop growth monitoring every 5 days at the county level; farmland parcel extraction (Figure 14), crop extraction, and yield estimation once a year; pest or disease monitoring; and variable prescriptions as needed. Figure 15 shows the precise control and service interface of the system in Feicheng (taking the satellite–air–ground monitoring interface as an example). In addition, it utilizes Beidou satellite navigation services to provide precise positioning and navigation services for ground IoT and intelligent agricultural machinery, which breaks through the current optimization configuration and operation scheduling of regional agricultural production materials and realizes the autonomous operation of agricultural machinery and intensive allocation of production materials. It was developed with a terminal information access interface to monitor crop growth, disasters, crop yield, and other factors of crops in real time during the growth process, which can evaluate and warn about agricultural disasters in advance to achieve real-time ground monitoring and dynamic updates of operational status. This system also provides users with functions such as information query, comprehensive analysis, statistics, and a visual display of the agricultural environment and production process for different counties, towns, crops, and time, which provide support for the government’s precise management and production scheduling of county-level agricultural industries.
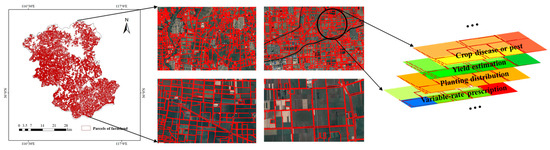
Figure 14.
Distribution of farmland parcels in Feicheng.
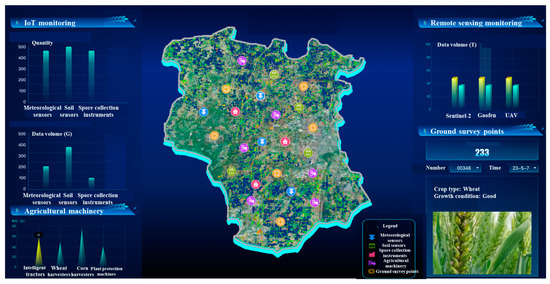
Figure 15.
Satellite–air–ground monitoring interface of the system in Feicheng.
3.3. APP for Agricultural Production Material Sharing
Figure 16a shows the interface of the Agricultural Information Collection APP (taking the agricultural information collection function as an example). The Agricultural Information Collection APP integrates the tasks of agricultural information collection and supports users in their query by providing details about crop type, time, and region. Users can select and manage the completion status of various tasks to know about the current collection situation and conveniently select tasks that can be undertaken. This APP can automatically navigate task allocation and plan the route after users select the collection tasks. During information collection, this APP can perform functions such as boundary drawing, uploading photography, and providing details on the type and status of crops. After users complete the data collection process, the data can be confirmed online and uploaded in real time, which can greatly improve the efficiency of information collection.
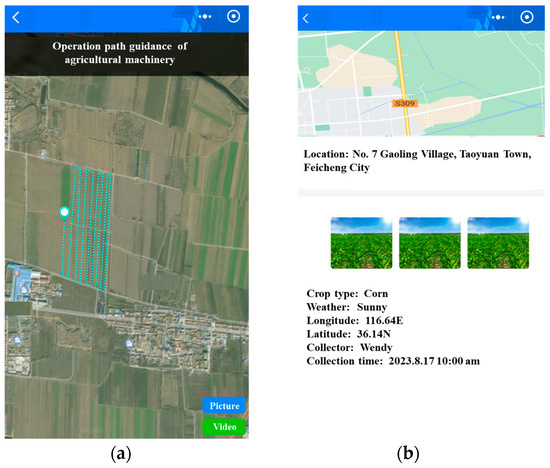
Figure 16.
Interface of APP: (a) agricultural information collection function of the Agricultural Information Collection APP, and (b) agricultural machinery operation function of the Agricultural Production Materials Guidance and Scheduling APP.
The Agricultural Production Materials Guidance and Scheduling APP uses knowledge models to issue planning suggestions and recommend suitable planting types based on the environment of the planting areas and the characteristics of crops. Also, by accessing agricultural and environmental monitoring information such as crop growth, nutritional status, pests or diseases, and soil moisture content, obtained from the subsystem of data management and agricultural information production, online reminder service can be provided for external risk factors such as extreme weather and pests, as well as internal risk factors such as severe drops in crop indicators below the normal levels. Meanwhile, based on irrigation, pesticide, and fertilizer prescription products, as well as the characteristics and dynamic changes of agricultural production in different periods, this APP can provide agricultural operation suggestions and professional agriculture guidance released in a timely manner. In addition, by providing services such as agricultural machinery service reservation and evaluation, as well as intelligent recommendation and online ordering fertilizers, it can connect the supply and demand chain between farmers, rural cooperatives, and agricultural machinery owners. This APP has access to at least 500 intelligent agricultural machines and can manage the status of agricultural machinery and service orders after they are registered by agricultural machinery operators or production cooperatives, and it can achieve effective integration of agricultural machinery information to provide services within the region. Figure 16b shows the interface of the Agricultural Production Materials Guidance and Scheduling APP (taking the agricultural machinery operation function as an example).
4. Discussion
In previous studies, smart agricultural systems usually had the problems of an information gap and application lag in the supply and demand of smart farming and agricultural remote sensing applications. It is rare for researchers to customize the agricultural full-chain service of the “platform + terminal” mode that directly caters to users’ needs and comprehensively utilizes various data resources and intelligent computing. This study innovatively proposed a verifiable, optimizable, and customizable agricultural management system in Shandong based on satellite–air–ground spatiotemporal collaborative monitoring. We constructed an overall data-product-and-service framework for remote sensing intelligent computing based on the time, space, and attribute dimensions, forming a comprehensive solution for regional agriculture management and application, based on a “system + terminal” software platform, that solves the problems of the limited spatiotemporal accuracy and stability of agricultural remote sensing monitoring and heavy reliance on manual labor in the entire chain of agricultural operations. It reduces the use of fertilizers and pesticides, reduces the demand for manual labor, improves the quality and efficiency of operations, and innovates the existing agricultural service mode.
Although the complete research framework could apply to agricultural monitoring during the entire process of agricultural cultivation, planting, management, and harvest, more work is needed to explore the optimal mode for agricultural information production and management. Under this intelligent computing framework, the production models and algorithms, such as crop identification, growth monitoring, yield estimation, and crop disease or pest monitoring, can be further optimized, or other deep learning algorithms can be tried to continuously improve computing performance. The intelligent computing and intensive sharing services proposed in this article mainly focus on the agricultural field, and future research in other fields, such as oceanography, ecology, and meteorology, can be conducted. In addition, the models for agricultural information products integrated on the proposed platform were mainly researched based on the regional characteristics of Shandong. For example, the models were proposed and calculated around the main bulk crops (wheat and corn) in Shandong and the working mode of intelligent agricultural machinery focused on flat-land operations. If this framework is promoted in other provinces in the future, it is necessary to refer to the local agricultural planting structure, cultivation mode, geographical characteristics, and other factors to adjust and optimize the models.
5. Conclusions
This article provides a detailed introduction to the design and implementation of the system’s functions through the case study of Shandong. The proposed system integrates innovated models of modern precision agriculture services and improves the accuracy, efficiency, and frequency of modern agricultural services. In the future, this system can provide high-frequency and high-precision agricultural services at the provincial and county levels for different users in a timely manner. At the same time, on the basis of the demonstration application in Feicheng, further application and promotion will be carried out in Shandong and other provinces and cities to achieve three-dimensional agricultural monitoring, intelligent agricultural machinery operation, and intensive agricultural resource sharing. This research will provide a feasible path for the high-frequency monitoring of agricultural conditions and implementation of intensive sharing services.
Author Contributions
Conceptualization, W.D. and X.Z.; methodology, W.L.; software, W.D., W.L., and J.Z.; validation, W.L. and J.Z.; formal analysis, W.D.; investigation, W.L. and W.D.; resources, X.Z.; data curation, J.Z.; writing—original draft preparation, W.L.; writing—review and editing, W.L. and W.D.; visualization, W.L.; supervision, W.D.; project administration, W.D. and X.Z.; funding acquisition, W.D. and X.Z. All authors have read and agreed to the published version of the manuscript.
Funding
This research was funded by National Key R&D Program of China and Shandong Province, China (2021YFB3901300).
Institutional Review Board Statement
Not applicable.
Data Availability Statement
Not applicable.
Acknowledgments
We would like to express our sincere gratitude to Hongwei Zhao, Xuehui Hou, Linyi Liu, Dong Yao, and Hao Xu for their help in data support and system operation.
Conflicts of Interest
The authors declare no conflict of interest.
References
- Wang, Z.; Yang, X.; Zhou, C. Geographic knowledge graph for remote sensing big data. J. Geo-Inf. Sci. 2021, 23, 16–28. [Google Scholar]
- Abriha, D.; Szabo, S. Strategies in training deep learning models to extract building from multisource images with small training sample sizes. Int. J. Digit. Earth 2023, 16, 1707–1724. [Google Scholar] [CrossRef]
- Price, J.; Sousa, D.; Sousa, F. Effect of spatial and spectral scaling on joint characterization of the spectral mixture residual: Comparative analysis of AVIRIS and WorldView-3 SWIR for geologic mapping in Anza-Borrego Desert State Park. Sensors 2023, 23, 6742. [Google Scholar] [CrossRef] [PubMed]
- Aubert, M.; Baghdadi, N.; Zribi, M.; Ose, K.; Hajj, M.; Vaudour, E.; Gonzalez-Sosa, E. Toward an operational bare soil moisture mapping using TerraSAR-X data acquired over agricultural areas. IEEE J. Sel. Top. Appl. Earth Obs. Remote Sens. 2013, 6, 900–916. [Google Scholar] [CrossRef]
- Nininahazwe, F.; Theau, J.; Antoine, G.M.; Varin, M. Mapping invasive alien plant species with very high spatial resolution and multi-date satellite imagery using object-based and machine learning techniques: A comparative study. GISci. Remote Sens. 2023, 60, 2190203. [Google Scholar] [CrossRef]
- Zhao, Z.; Gao, L.; Chen, D.; Yue, A.; Chen, J.; Liu, D.; Yang, J.; Meng, Y. Development of satellite remote sensing and image processing platform. J. Image Graph. 2019, 24, 2098–2110. [Google Scholar]
- Li, D. On space-air-ground integrated earth observation network. J. Geo-Inf. Sci. 2012, 14, 419–425. [Google Scholar] [CrossRef]
- Luo, J.; Hu, X.; Wu, T.; Liu, W.; Xia, L.; Yang, H.; Sun, Y.; Xu, N.; Zhang, X.; Shen, Z. Research on intelligent calculation model and method of precision land use/cover change information driven by high-resolution remote sensing. J. Remote Sens. 2021, 25, 1351–1373. [Google Scholar] [CrossRef]
- Watson, C.; Elliott, J.; Cordova, M.; Menoscal, J.; Bonilla-Bedoya, S. Evaluating night-time light sources and correlation with socio-economic development using high-resolution multi-spectral Jilin-1 satellite imagery of Quito, Ecuador. Int. J. Remote Sens. 2023, 44, 2691–2716. [Google Scholar] [CrossRef]
- Liang, S.; Bai, R.; Chen, X.; Cheng, J.; Fan, W.; He, T.; Jia, K.; Jiang, B.; Jiang, L.; Jiao, Z. Review of China’s land surface quantitative remote sensing development in 2019. J. Remote Sens. 2020, 24, 618–671. [Google Scholar]
- Raliya, R.; Saharan, V.; Dimkpa, C.; Biswas, P. Nanofertilizer for precision and sustainable agriculture: Current state and future perspectives. J. Agric. Food Chem. 2018, 66, 6487–6503. [Google Scholar] [CrossRef]
- Li, W.; Huang, J.; Yang, L.; Chen, Y.; Fang, Y.; Jin, H.; Sun, H.; Huang, R. A practical remote sensing monitoring framework for late frost damage in wine grapes using multi-source satellite data. Remote Sens. 2021, 13, 3231. [Google Scholar] [CrossRef]
- Azzari, G.; Lobell, D. Landsat-based classification in the cloud: An opportunity for a paradigm shift in land cover monitoring. Remote Sens. Environ. 2017, 202, 64–74. [Google Scholar] [CrossRef]
- Dahiya, N.; Singh, S.; Gupta, S.; Rajab, A.; Hamdi, M.; Elmagzoub, M.; Sulaiman, A.; Shaikh, A. Detection of multitemporal changes with artificial neural network-based change detection algorithm using hyperspectral dataset. Remote Sens. 2023, 15, 1326. [Google Scholar] [CrossRef]
- Bhatt, P.; Maclean, A. Comparison of high-resolution NAIP and unmanned aerial vehicle (UAV) imagery for natural vegetation communities classification using machine learning approaches. GISci. Remote Sens. 2023, 60, 2177448. [Google Scholar] [CrossRef]
- Peladarinos, N.; Piromalis, D.; Cheimaras, V.; Tserepas, E.; Munteanu, R.; Papageorgas, P. Enhancing smart agriculture by implementing digital twins: A comprehensive review. Sensors 2023, 23, 7128. [Google Scholar] [CrossRef] [PubMed]
- Sisheber, B.; Marshall, M.; Mengistu, D.; Nelson, A. Detecting the long-term spatiotemporal crop phenology changes in a highly fragmented agricultural landscape. Agric. For. Meteorol. 2023, 340, 109601. [Google Scholar] [CrossRef]
- Maes, W.; Steppe, K. Perspectives for remote sensing with unmanned aerial vehicles in precision agriculture. Trends Plant Sci. 2019, 24, 152–164. [Google Scholar] [CrossRef]
- Elijah, O.; Rahman, T.; Orikumhi, I.; Leow, C.; Hindia, M. An overview of internet of things (IoT) and data analytics in agriculture: Benefits and challenges. IEEE Internet Things 2018, 5, 3758–3773. [Google Scholar] [CrossRef]
- Jorge, L.; Brandao, Z.; Inamasu, R. Insights and recommendations of use of UAV platforms in precision agriculture in Brazil. Remote Sens. Agric. Eco Hydrol. 2014, 9239, 313–330. [Google Scholar]
- Chataut, R.; Phoummalayvane, A.; Akl, R. Unleashing the power of IoT: A comprehensive review of IoT applications and future prospects in healthcare, agriculture, smart homes, smart cities, and industry 4.0. Sensors 2023, 23, 7194. [Google Scholar] [CrossRef] [PubMed]
- Chen, Z.; Ren, J.; Tang, H.; Shi, Y.; Leng, P.; Liu, J.; Wang, L.; Wu, W.; Yao, Y.; Hasiyuya. Progress and perspectives on agricultural remote sensing research and applications in China. J. Remote Sens. 2016, 20, 748–767. [Google Scholar]
- Yang, Y.; Wu, Z.; Luo, J.; Huang, Q.; Zhang, D.; Wu, T.; Sun, Y.; Cao, Z.; Dong, W.; Liu, W. Parcel-based crop distribution extraction using the spatiotemporal collaboration of remote sensing data. Trans. Chin. Soc. Agric. Eng. 2021, 37, 166–174. [Google Scholar]
- Gong, P.; Zhang, W.; Yu, L.; Li, C.; Wang, J.; Liang, L.; Li, X.; Ji, L.; Bai, Y. New research paradigm for global land cover mapping. J. Remote Sens. 2016, 20, 1002–1016. [Google Scholar] [CrossRef]
- Li, W.; Guo, X.; Yang, L.; Yan, M.; Zou, C.; Fang, Y.; Sun, H.; Huang, J. Accurate recognition of wine grapes using multi-feature optimization based on GF-6 satellite images. Trans. Chin. Soc. Agric. Eng. 2020, 36, 165–173. [Google Scholar]
- Gong, P. Intelligent mapping with remote sensing, iMap. J. Remote Sens. 2021, 25, 527–529. [Google Scholar] [CrossRef]
- Yang, L.; Wang, L.; Huang, J.; Mansaray, L.R.; Mijiti, R. Monitoring policy-driven crop area adjustments in northeast China using Landsat-8 imagery. Int. J. Appl. Earth Obs. Geoinf. 2019, 82, 101892. [Google Scholar] [CrossRef]
- Wang, R.; Bowling, L.; Cherkauer, K. Estimation of the effects of climate variability on crop yield in the Midwest USA. Agric. For. Meteorol. 2016, 216, 141–156. [Google Scholar] [CrossRef]
- Mateo-Sanchis, A.; Adsuara, J.; Piles, M.; Munoz-Mari, J.; Perez-Suay, A.; Camps-Valls, G. Interpretable long short-term memory networks for crop yield estimation. IEEE Geosci. Remote Sens. Lett. 2023, 20, 2501105. [Google Scholar] [CrossRef]
- Karimli, N.; Selbesoglu, M. Remote sensing-based yield estimation of winter wheat using vegetation and soil indices in Jalilabad, Azerbaijan. ISPRS. Int. J. Geo-Inf. 2023, 12, 124. [Google Scholar] [CrossRef]
- Li, B.; Xu, X.; Zhang, L.; Han, J.; Bian, C.; Li, G.; Liu, J.; Jin, L. Above-ground biomass estimation and yield prediction in potato by using UAV-based RGB and hyperspectral imaging. ISPRS J. Photogramm. Remote Sens. 2020, 162, 161–172. [Google Scholar] [CrossRef]
- Fieuzal, R.; Sicre, C.; Baup, F. Estimation of corn yield using multi-temporal optical and radar satellite data and artificial neural networks. Int. J. Appl. Earth Obs. Geoinf. 2017, 57, 14–23. [Google Scholar] [CrossRef]
- Parez, S.; Dilshad, N.; Alghamdi, N.S.; Alanazi, T.M.; Lee, J.W. Visual intelligence in precision agriculture: Exploring plant disease detection via efficient vision transformers. Sensors 2023, 23, 6949. [Google Scholar] [CrossRef] [PubMed]
- Huang, W.; Dong, Y.; Zhao, L.; Geng, Y.; Ruan, C.; Zhang, B.; Sun, Z.; Zhang, H.; Ye, H.; Wang, K. Review of locust remote sensing monitoring and early warning. J. Remote Sens. 2020, 24, 1270–1279. [Google Scholar] [CrossRef]
- Ren, Y.; Huang, W.; Ye, H.; Zhou, X.; Ma, H.; Dong, Y.; Shi, Y.; Geng, Y.; Huang, Y.; Jiao, Q. Quantitative identification of yellow rust in winter wheat with a new spectral index: Development and validation using simulated and experimental data. Int. J. Appl. Earth Obs. Geoinf. 2021, 102, 102384. [Google Scholar] [CrossRef]
- Fu, S.; Wei, X.; Zheng, S.; Wu, L.; Li, B.; Wang, T. Effects of integrated management of water and fertilizer on the physiological characteristics and water-fertilizer use efficiency of grapes in greenhouse. Trans. Chin. Soc. Agric. Eng. 2021, 37, 61–72. [Google Scholar]
- Wang, Z.; Cheng, X.; Xie, Y.; Hong, C.; Hu, M.; Gao, Y.; You, J.; He, Y.; Liu, J.; Xiao, B. Effects of different water and fertilizer use patterns on the lodging resistances of indica and japonica rice. Trans. Chin. Soc. Agric. Eng. 2022, 38, 108–118. [Google Scholar]
- Song, C.; Zhou, Z.; Zang, Y.; Zhao, L.; Yang, W.; Luo, X.; Jiang, R.; Ming, R.; Zang, Y.; Zi, L.; et al. Variable-rate control system for UAV-based granular fertilizer spreader. Comput. Electron. Agric. 2021, 180, 105832. [Google Scholar] [CrossRef]
- Song, P.; Mansaray, L.; Huang, J.; Huang, W. Mapping paddy rice agriculture over China using AMSR-E time series data. ISPRS J. Photogramm. Remote Sens. 2018, 144, 469–482. [Google Scholar] [CrossRef]
- Li, X.; Wigneron, J.; Fan, L.; Frappart, F.; Yueh, S.; Colliander, A.; Ebtehaj, A.; Gao, L.; Fernandez-Moran, R.; Liu, X. A new SMAP soil moisture and vegetation optical depth product (SMAP-IB): Algorithm, assessment and inter-comparison. Remote Sens. Environ. 2022, 271, 112921. [Google Scholar] [CrossRef]
- Antwi-Agyei, P.; Atta-Aidoo, J.; Asare-Nuamah, P.; Stringer, L.C.; Antwi, K. Trade-offs, synergies and acceptability of climate smart agricultural practices by smallholder farmers in rural Ghana. Int. J. Agric. Sustain. 2023, 21, 2193439. [Google Scholar] [CrossRef]
- Brook, A.; De Micco, V.; Battipaglia, G.; Erbaggio, A.; Ludeno, G.; Catapano, I.; Bonfante, A. A smart multiple spatial and temporal resolution system to support precision agriculture from satellite images: Proof of concept on aglianico vineyard. Remote Sens. Environ. 2020, 240, 111679. [Google Scholar] [CrossRef]
- Campos-Taberner, M.; Javier Garcia-Haro, F.; Camps-Valls, G.; Grau-Muedra, G.; Nutini, F.; Crema, A.; Boschetti, M. Multitemporal and multiresolution leaf area index retrieval for operational local rice crop monitoring. Remote Sens. Environ. 2016, 187, 102–118. [Google Scholar] [CrossRef]
- Wu, T.; Luo, J.; Zhao, X.; Li, M.; Zhang, X.; Dong, W.; Gao, L.; Wang, L.; Yang, Y.; Zhao, W. Collaborative computing of high-resolution remote sensing driven by fine-accurate geographic applications. Geomat. Inf. Sci. Wuhan Univ. 2022, 47, 1220–1235. [Google Scholar]
- Zhu, X.; Cai, F.; Tian, J.; Williams, T. Spatiotemporal fusion of multisource remote sensing data: Literature survey, taxonomy, principles, applications, and future directions. Remote Sens. 2018, 10, 527. [Google Scholar] [CrossRef]
- Jiao, W.; Wang, L.; McCabe, M. Multi-sensor remote sensing for drought characterization: Current status, opportunities and a roadmap for the future. Remote Sens. Environ. 2021, 256, 112313. [Google Scholar] [CrossRef]
- Xi, W.; Du, S.; Wang, Y.; Zhang, X. A spatiotemporal cube model for analyzing satellite image time series: Application to land-cover mapping and change detection. Remote Sens. Environ. 2019, 231, 111212. [Google Scholar] [CrossRef]
- Xia, X.; Zhang, T.; Wang, L.; Gong, W.; Zhu, Z.; Wang, W.; Gu, Y.; Lin, Y.; Zhou, X.; Dong, J. Spatial-temporal fusion of 10-min aerosol optical depth products with the GEO-LEO satellite joint observations. Remote Sens. 2023, 15, 2038. [Google Scholar] [CrossRef]
- Luo, J.; Wu, T.; Xia, L. The Theory and Calculation of Spatial-spectral Cognition of Remote Sensing. J. Geo-Inf. Sci. 2016, 18, 578–589. [Google Scholar]
- Luo, J.; Wu, T.; Wu, Z.; Zhou, Y.n.; Gao, L.; Sun, Y.; Wu, W.; Yang, Y.; Hu, X.; Zhang, X. Methods of intelligent computation and pattern mining based on Geo-parcels. J. Geo-Inf. Sci. 2020, 22, 57–75. [Google Scholar]
- Wu, T.; Ma, J. A remote sensing change detection method combining with spatial-spectral features under the guidance of historical interpretation knowledge. J. Geo-Inf. Sci. 2016, 18, 655–663. [Google Scholar]
Disclaimer/Publisher’s Note: The statements, opinions and data contained in all publications are solely those of the individual author(s) and contributor(s) and not of MDPI and/or the editor(s). MDPI and/or the editor(s) disclaim responsibility for any injury to people or property resulting from any ideas, methods, instructions or products referred to in the content. |
© 2023 by the authors. Licensee MDPI, Basel, Switzerland. This article is an open access article distributed under the terms and conditions of the Creative Commons Attribution (CC BY) license (https://creativecommons.org/licenses/by/4.0/).