Article

Effect of Drought and Pluvial Climates on the Production and Stability of Different Types of Peanut Cultivars in Guangdong, China

1
Guangdong Modern Agriculture (Cultivated Land Conservation and Water-Saving Agriculture) Industrial Technology Research and Development Center, Zhanjiang Experiment Station, Chinese Academy of Tropical Agricultural Sciences, Zhanjiang 524031, China
2
Guangdong Engineering Technology Research Center for Dryland and Water Saving Agriculture, South Subtropical Crop Research Institute, Chinese Academy of Tropical Agricultural Sciences, Zhanjiang 524091, China
*
Author to whom correspondence should be addressed.
Agriculture 2023, 13(10), 1965; https://doi.org/10.3390/agriculture13101965
Submission received: 14 August 2023 / Revised: 6 October 2023 / Accepted: 7 October 2023 / Published: 8 October 2023

Abstract

:
The production and breeding of peanuts was restricted by the frequently extreme climatic conditions in Guangdong province, China. To understand the influence of drought and pluvial climates on peanut traits and yield, a phenotypic investigation of seventy peanut cultivars was conducted from 2018 to 2022; comprehensive field meteorological data collection, and typical drought (2021) and pluvial (2022) climates were recorded. The results revealed that the cultivars achieved the highest single plant pod weight (SPPW) and single plant seed weight (SPSW) of 61.03 g and 45.84 g, respectively, in drought conditions, followed by the control, and finally the pluvial. The SPPW, SPSW and eight agronomy traits exhibited significant differences across the different climatic conditions. Correlation analysis revealed the yield traits and key yield-related traits were positively or negatively correlated with soil water content (SWC), total global radiation (TGR), total precipitation (TP) and total net radiation (TNR). The intermediate and Spanish type cultivars were more stable and productive than the other botanical types of cultivars, commercial varieties exhibited better performance than landraces, and seven cultivars were identified with good production potential, under drought and pluvial conditions. Our study showed that pluvial climate was detrimental to peanut yield, and the SPPW and SPSW were significantly influenced by climates with genotype differences.

1. Introduction

Peanut (Arachis hypogaea) is an important oil crop providing high-quality vegetable oil, protein, vitamins, and micronutrients [1,2]. In addition, peanut is planted in arid and semi-arid regions of more than 100 countries worldwide [3]. Until 2021, the harvest area of peanuts in China was about 4.81 million hectares, producing 18.31 million tons of peanut pods with average productivity of 3.80 t·ha−1 [4]. The average peanut productivity in Guangdong province, the third largest peanut-planted area in China, is about 3.31 t·ha−1 and is chronically below the national average peanut productivity and the higher productivity areas, such as the Henan and Shandong provinces [5]. Therefore, breeding cultivars with higher productivity is always one of the key objectives for peanut genetic improvement in Guangdong province.
Climate change has influenced the agricultural environments in many regions of China [6,7,8]. Guangdong Province is located in the south of China and has a tropical monsoon climate (Figure 1). Typically, the rainy season lasts from April to September, and the dry season lasts from October to March next year. In recent years, due to climate change, phenomena that are manifested by extreme temperatures, seasonal droughts, and excessive rainfall events have occurred in greater frequency [9,10]. This has made it increasingly challenging to achieve desired peanut yields and breed cultivars with high quality, high yield, and wide environmental adaptability [11]. Due to the abovementioned challenges, it is crucial to comprehend the impact of the environment (or climate change) on peanut traits and how they eventually affect yield and its components.
In the past years, many studies have been conducted to understand the influence of the environment on peanut traits. For example, analysis of variance (ANOVA) of the Zhonghua 10 × ICG12625 F2:3 population indicated that the traits, height of main stem (MSH), total branch number (TBN), pod length (PL), pod width (PW), seed length (SL), hundred pod weight (HPW) and hundred-seed weight (HSW), were significantly influenced by both the genotype (G) and the environment (E) [12]. Furthermore, based on F2:3, RIL, and germplasm resource populations, the broad sense heritability (H2) of these traits indicated that genetic factors were predominant in determining these traits [13,14,15,16,17,18,19,20,21]. Other studies also showed that the genotype-environment interaction effect (GE) significantly influenced the height of the main stem (MSH), seed length (SL), seed width (SW), hundred-seed weight (HSW), first branch length (FBL), seed length-width ratio (SLW) and shelling percentage (SP) [1,14,21]. The H2 for single plant pod weight (SPPW) and mature pods per plant were 0.39 and 0.14, respectively [17], which indicated that environmental factors predominantly determined these two important yield traits. However, these studies have mainly focused on finding the key factors in determining traits, and the relationship between environment (or climates) and traits has not been explored deeply yet.
Moreover, a few studies have been carried out to examine the impact of climatic parameters on peanut yield at large spatial and time scales. Based on meteorological data and peanut yield data collected separately from China’s 305 meteorological stations from 1980 to 2012, Wang et al. [22] found light, precipitation and temperature were considered the most important climatic parameters affecting peanut yield. Grey correlation analysis on peanut yield and meteorological factors from 2000 to 2017 in Anhui Province revealed that peanut yield was closely related to temperature and light [23]. In addition, the study of 18 years of peanut yield and meteorological factors in Zhengyang showed precipitation and light duration had important effects on peanut yield [24]. Recently, a correlation analysis between the peanut yield-related traits and the meteorological data in 77 environments from 2013 to 2016 revealed that pod yield was significantly correlated with accumulated temperature, precipitation throughout the growth period, average diurnal temperature range, and average temperature [25]. However, limited by spatial and time scales, the relationship between meteorological parameters and important traits besides peanut yield, could not be explored in these studies.
In order to comprehensively and accurately evaluate the effects of drought and pluvial climate conditions on peanut production in Guangdong Province, we systematically investigated the phenotype data of seventy peanut cultivars in combination with field meteorological data from 2018 to 2022 in Zhanjiang, Guangdong Province. Typical growing seasons with drought and pluvial were recorded in 2021 and 2022, respectively. Meanwhile, the 2021 peanut growing season has been the growing season with the least precipitation over past ten years. Here, we used the mean field meteorological data and the best linear unbiased prediction (BLUP) of the traits as controls to explore the influence of drought (2021) and pluvial conditions (2022) on peanut traits and yield. We evaluated the stability and production potential of different types of cultivars and selected cultivars with favorable adaptability and production potential. This study lays the foundation for understanding the effects of drought and pluvial climate conditions on peanut production and provides references for trait selection during peanut breeding practice in Guangdong Province.

2. Materials and Methods

2.1. Experimental Location

The study was conducted in the experimental field of the Zhanjiang Experimental Station, Mazhang District, Zhanjiang City, Guangdong Province, China (Figure 1), which is located at 110°15′42″ W and 20°9′50″ N. The average annual temperatures are 22.70–23.50 °C with 1395.50–1723.10 mm of precipitation and 1714.80–2038.2 h sunshine duration per year. The experimental field has tropical red loam soil, and the soil characteristics are listed in Table 1.

2.2. Plant Materials and Experimental Design

Seventy peanut cultivars, including twenty-three landraces, were used as plant materials in this study and are listed in supplementary Table S1. The cultivars were collected from 15 provinces in China and belong to the Spanish (44), intermediate (4), Valencia (9), and Virginia (13) types, respectively. All the cultivars were planted by February and harvested by June from 2018 to 2022. A randomized complete-block experimental design was used with three replicates. Each cultivar was planted in two rows with a row length of 1.5 m, row space of 0.30 m, and plant space of 0.15 m in each replicate. The cultivation management adhered to the local peanut production practices in the region, which included the application of adequate irrigation only after seed sowing and then relying mainly on natural precipitation throughout the growing season.

2.3. Phenotyping and Field Meteorological Data Collection

Twenty peanut traits, including leaf area (LA), leaf length (LL), leaf width (LW), leaf length-width ratio (LLWR), MSH, FBL, TBN, pod length-width ratio (PLWR), PL, PW, SLWR, SL, SW, HSW, hundred pod-seed weight (HPSW), HSW, SP, single plant pod weight (SPPW) and SPSW, were measured according to the description and measurement standards for a peanut by Jiang et al. [26]. In brief, the LA, LL and LW were measured on the third leaf from the top using a scanner (Epson Expression 12000XL, Epson China. Inc., Beijing, China). The MSH and FBL were the length of the main stem and first branch and were measured using a ruler from the bottom to the top. The TBN was the number of branches. The PL, PW, SL and SW were the length and width of the pod and seed and were measured using a scanner. The LLWR, PLWR and SLWR were the ratios of LL and LW, PL and PW, SL and SW, respectively. HPW, HPSW and HSW were weight of 100 pods, the seeds in 100 pods and 100 seeds, respectively. SPPW and SPSW were the weight of the single plant pod and seed. The HPW, HPSW, HSW, SPPW and SPSW were measured by a scale. SP was the ratio of HPSW and HPW. The shape factor (LSF), was calculated according to the formula:
F = 4 π S D 2 ,
where S represents leaf area, D2 represents leaf perimeter. In brief, LA, LL, LW, LLWR, and LSF were measured a week before harvest. The MSH, FBL, and TBN were measured during harvest. The other traits were measured after the pod had dried.
Field meteorological data were collected from 2018 to 2022 using a Campbell CR1000 automatic weather station (Campbell.Inc., Wilmington, MA, USA) set up on the experiment field. The air temperature, mean relative humidity, net radiation, global radiation, photosynthetically active radiation, soil temperature, soil water content, and precipitation were automatically recorded by automatic weather stations. The accumulated temperature (AT) was calculated by the cumulative mean daily temperatures minus 15 °C over the entire growing season. Soil accumulated temperature (SAT) was calculated by the cumulative mean daily soil temperatures minus 15 °C over the entire growing season. Total net radiance (TNR), total global radiation (TGR), total photosynthetically active radiation (TPAR), and total precipitation (TP) of the entire growing season were calculated by the cumulative daily data over the entire growing season. Mean daily temperature (MDT), Soil water content (SWC) and mean relative humidity (MRH) were calculated by the average of the daily data over the entire growing season.

2.4. Statistical Analysis

The 5-year mean of the field meteorological data served as a control for evaluating the climate characteristics of the drought (2021) and pluvial (2022) conditions. To remove the environmental effects and obtain stable genetic phenotypes, the BLUP values of the traits were calculated using the R package lme4 (Version 1.1-34) and used as a control. The 2021 and 2022 growing seasons served as a natural treatment of drought and pluvial, respectively.
Descriptive statistics and broad-sense heritability of the traits. The trait data obtained were sorted using Microsoft Office Excel 2010. The descriptive statistics of each trait, including the average ( x ¯ ), standard deviation (σ), range, coefficient of variation (CV), ANOVA and multiple comparisons were calculated using the software Origin (Version 2019b 9.65). The multiple comparison was analyzed using the LSD method. The broad-sense heritability was calculated according to Hallauer and Miranda [27] as follows:
H 2 = σ g 2 σ g 2 + σ g e 2 n + σ e 2 n r
where σ g 2 represents the genetic variance, σ g e 2 represents the genotype by environment interaction variance, σ e 2 represents the residual error variance, n represents the number of environments, and r represents the number of replications.
Phenotypic diversity. The degree of phenotypic diversity was estimated by the Shannon–Wiener index [28] with the following calculation formula:
H = i = 1 n P i l n P i i = 1 ,   2 ,   3
where H represents the diversity index, n represents the total number of classes, and Pi is the effective percentage of the material distribution frequency in the i-th phenotypic class of the trait. The classes of each trait’s phenotype values were set from <−2σ as the first level to ≥2σ as the tenth level, and every 0.5σ corresponded to one level.
Multivariate linear stepwise regression analysis and correlation analysis. Multivariate linear stepwise regression analysis was performed using the R package MASS (Version 7.30). The SPPW and SPSW were used as the dependent variables, respectively, and the other eighteen traits were used as independent variables to mine the associations between the traits affecting the yield. Correlation analysis was performed using the software Origin (Version 2019b 9.65).
Stability analysis. The stability of the phenotypic traits was evaluated by comparing the trait performance in control, drought, and pluvial conditions. The stability of different types of peanut cultivars was evaluated through the SPPW and SPSW reduction ratio in pluvial conditions compared with the control.

3. Results

3.1. Phenotypic Variation and Stability of Twenty Peanut Traits during the Drought and Pluvial Conditions

The names, units, and descriptive statistics of the 20 peanut traits are shown in Table 2. The result showed that the cultivars archived the highest mean yield with SPPW and SPSW of 61.03 g and 45.84 g, respectively, in drought conditions, followed by the control, and finally the pluvial. The CV of the traits ranged from 0.02 to 0.16, 0.04 to 0.24, and 0.05 to 0.31 for control, drought and pluvial conditions, respectively. The CV of all traits was increased in drought and pluvial conditions compared with control. The five traits with the most CV increase were LA, SL, SW, SPPW and SPSW in drought conditions and LA, MSH, SP, SPPW and SPSW in pluvial conditions. The Shannon–Wiener diversity index (H′) of the traits evaluated ranged from 2.52 to 2.98, 2.65 to 2.98, and 2.08 to 3.02 for control, drought and pluvial conditions, respectively. Analysis of variance indicated that both the genotype (G) and the environment (E) significantly influenced the traits at 0.05, 0.01, or 0.001 significance levels, except for the traits LSF and PLWR, for which the effect of the environment was not significant. The broad sense heritability of all traits ranged from 0.13 for SPSW to 0.93 for TBN, which indicated that genetic factors were predominant in determining the phenotypes of most traits. For the yield traits, SPSW and SPPW, the environmental effect may play a key role in determining the phenotypes. The analysis of significant differences in the values of the twenty traits between the CK, drought, and pluvial conditions showed that ten traits, including LA, LW, MSH, TBN, SW, HPW, HPSW, HSW, SPPW and SPSW, exhibited significant differences between the different climatic conditions, while six traits (LSF, FBL, PL, PW, PLWR, and SL) showed no significant changes (Figure 2). In addition, significant differences were observed between certain climatic conditions for a number of the remaining traits. For instance, LLWR, SLWR, and SP were significantly different between the drought and pluvial conditions. These results suggested the stability of the peanut traits differed significantly during different climate conditions.

3.2. Climate Characteristics of the Drought and Pluvial Conditions

The names, units and values of meteorological parameters are listed in Table 3. Compared to control, the drought condition exhibited increases in AT, TNR, TGR, TPAR, SAT and MDT and decreases in MRH, SWC, and TP, with TP exhibiting the greatest decrease (Figure 3). The meteorological parameter changes were inverted in pluvial conditions compared to the drought. Comparing the meteorological parameters of the pluvial and drought, the TP increased 100.76%, while AT and SAT in 0–15 cm and 15–30 cm decreased by 21.02%, 19.46%, and 19.33% in the former, respectively. Monthly analysis of the meteorological parameters during the entire peanut growing season showed that the MDT and mean daily soil temperature increased, and the SWC decreased, while precipitation and other parameters fluctuated with each passing month (Figure 4). The mean daily global radiation, net radiation, and photosynthetically active radiation showed consistent trends during each growing season which were opposite to the precipitation trends. The MDT and mean daily soil temperature during the drought were consistently higher than in the pluvial during the growing season. Combined with the growth period of peanuts, the highest precipitation in the drought was observed during the flowering and pegging stage (April), which is the most sensitive stage to water shortage. While, the maximum rainfall occurred during the podding stage (May) in control and the pluvial growing season, which is a stage of excessive rainfall detrimental to peanut growth. Meanwhile, during the May to June period, when peanuts accumulate dry matter through efficient photosynthesis, higher mean daily global radiation, net radiation, and photosynthetically active radiation were recorded in the drought condition compared to control and pluvial. In addition, the MDT and mean daily soil temperature during the drought were consistently higher than in the pluvial, which is more favorable to the growth and development of peanuts.

3.3. Influence of Meteorological Parameters on Peanut Traits

SPPW and SPSW are direct indicators of peanut pod and seed production. To assess the relationship between yield and its associated traits, SPPW and SPSW were used as the dependent variable, respectively, and the other eighteen traits were used as independent variables. Multivariable linear stepwise regression analysis, using the five-year mean data, indicated that SPPW was associated with LA, LW, LLWR, MSH, TBN, PLWR, PW and HSW (Table S2). Moreover, using the BLUP data, SPPW was associated with LA, LW, LLWR, MSH, and TBN (Table S3). Regarding SPSW, multivariable linear stepwise regression analysis revealed that it was significantly associated with LA, LW, LLWR, MSH, TBN, PLWR, PW, HSW and SP, using both the five-year mean data and the BLUP data (Tables S4 and S5). These results suggested that the aforementioned traits may significantly contribute to peanut yield.
To understand the impact of the meteorological parameters on peanut production and on the key yield traits, a correlation analysis between the meteorological parameters and traits was performed. Seventeen correlation pairs were identified between thirteen traits and seven meteorological parameters (Table 4). Among them, a positive correlation was observed in eight pairs, while nine pairs exhibited a negative correlation. Moreover, SWC 0–15 cm was significantly negatively correlated with SPPW and SPSW, suggesting that this parameter directly affects peanut yield. Among the traits that were associated with yield based on the multiple regression analysis, LW and LLWR were significantly correlated with AT, SWC and MDT. The PLWR, HSW, and SP were positively correlated with TGR, TP, and TNR, respectively. Among all the meteorological parameters, TNR showed a positive significant correlation with pod and seed-related traits, such as SL, SW, HSW, and HPSW. Further analysis of the correlations between the meteorological parameters showed that TNR, TGR, and TPAR were correlated with TP and SAT, respectively (Table S6). The multiple correlations identified suggested the presence of complex interactions between peanut yield components and environmental factors affecting peanut productivity.

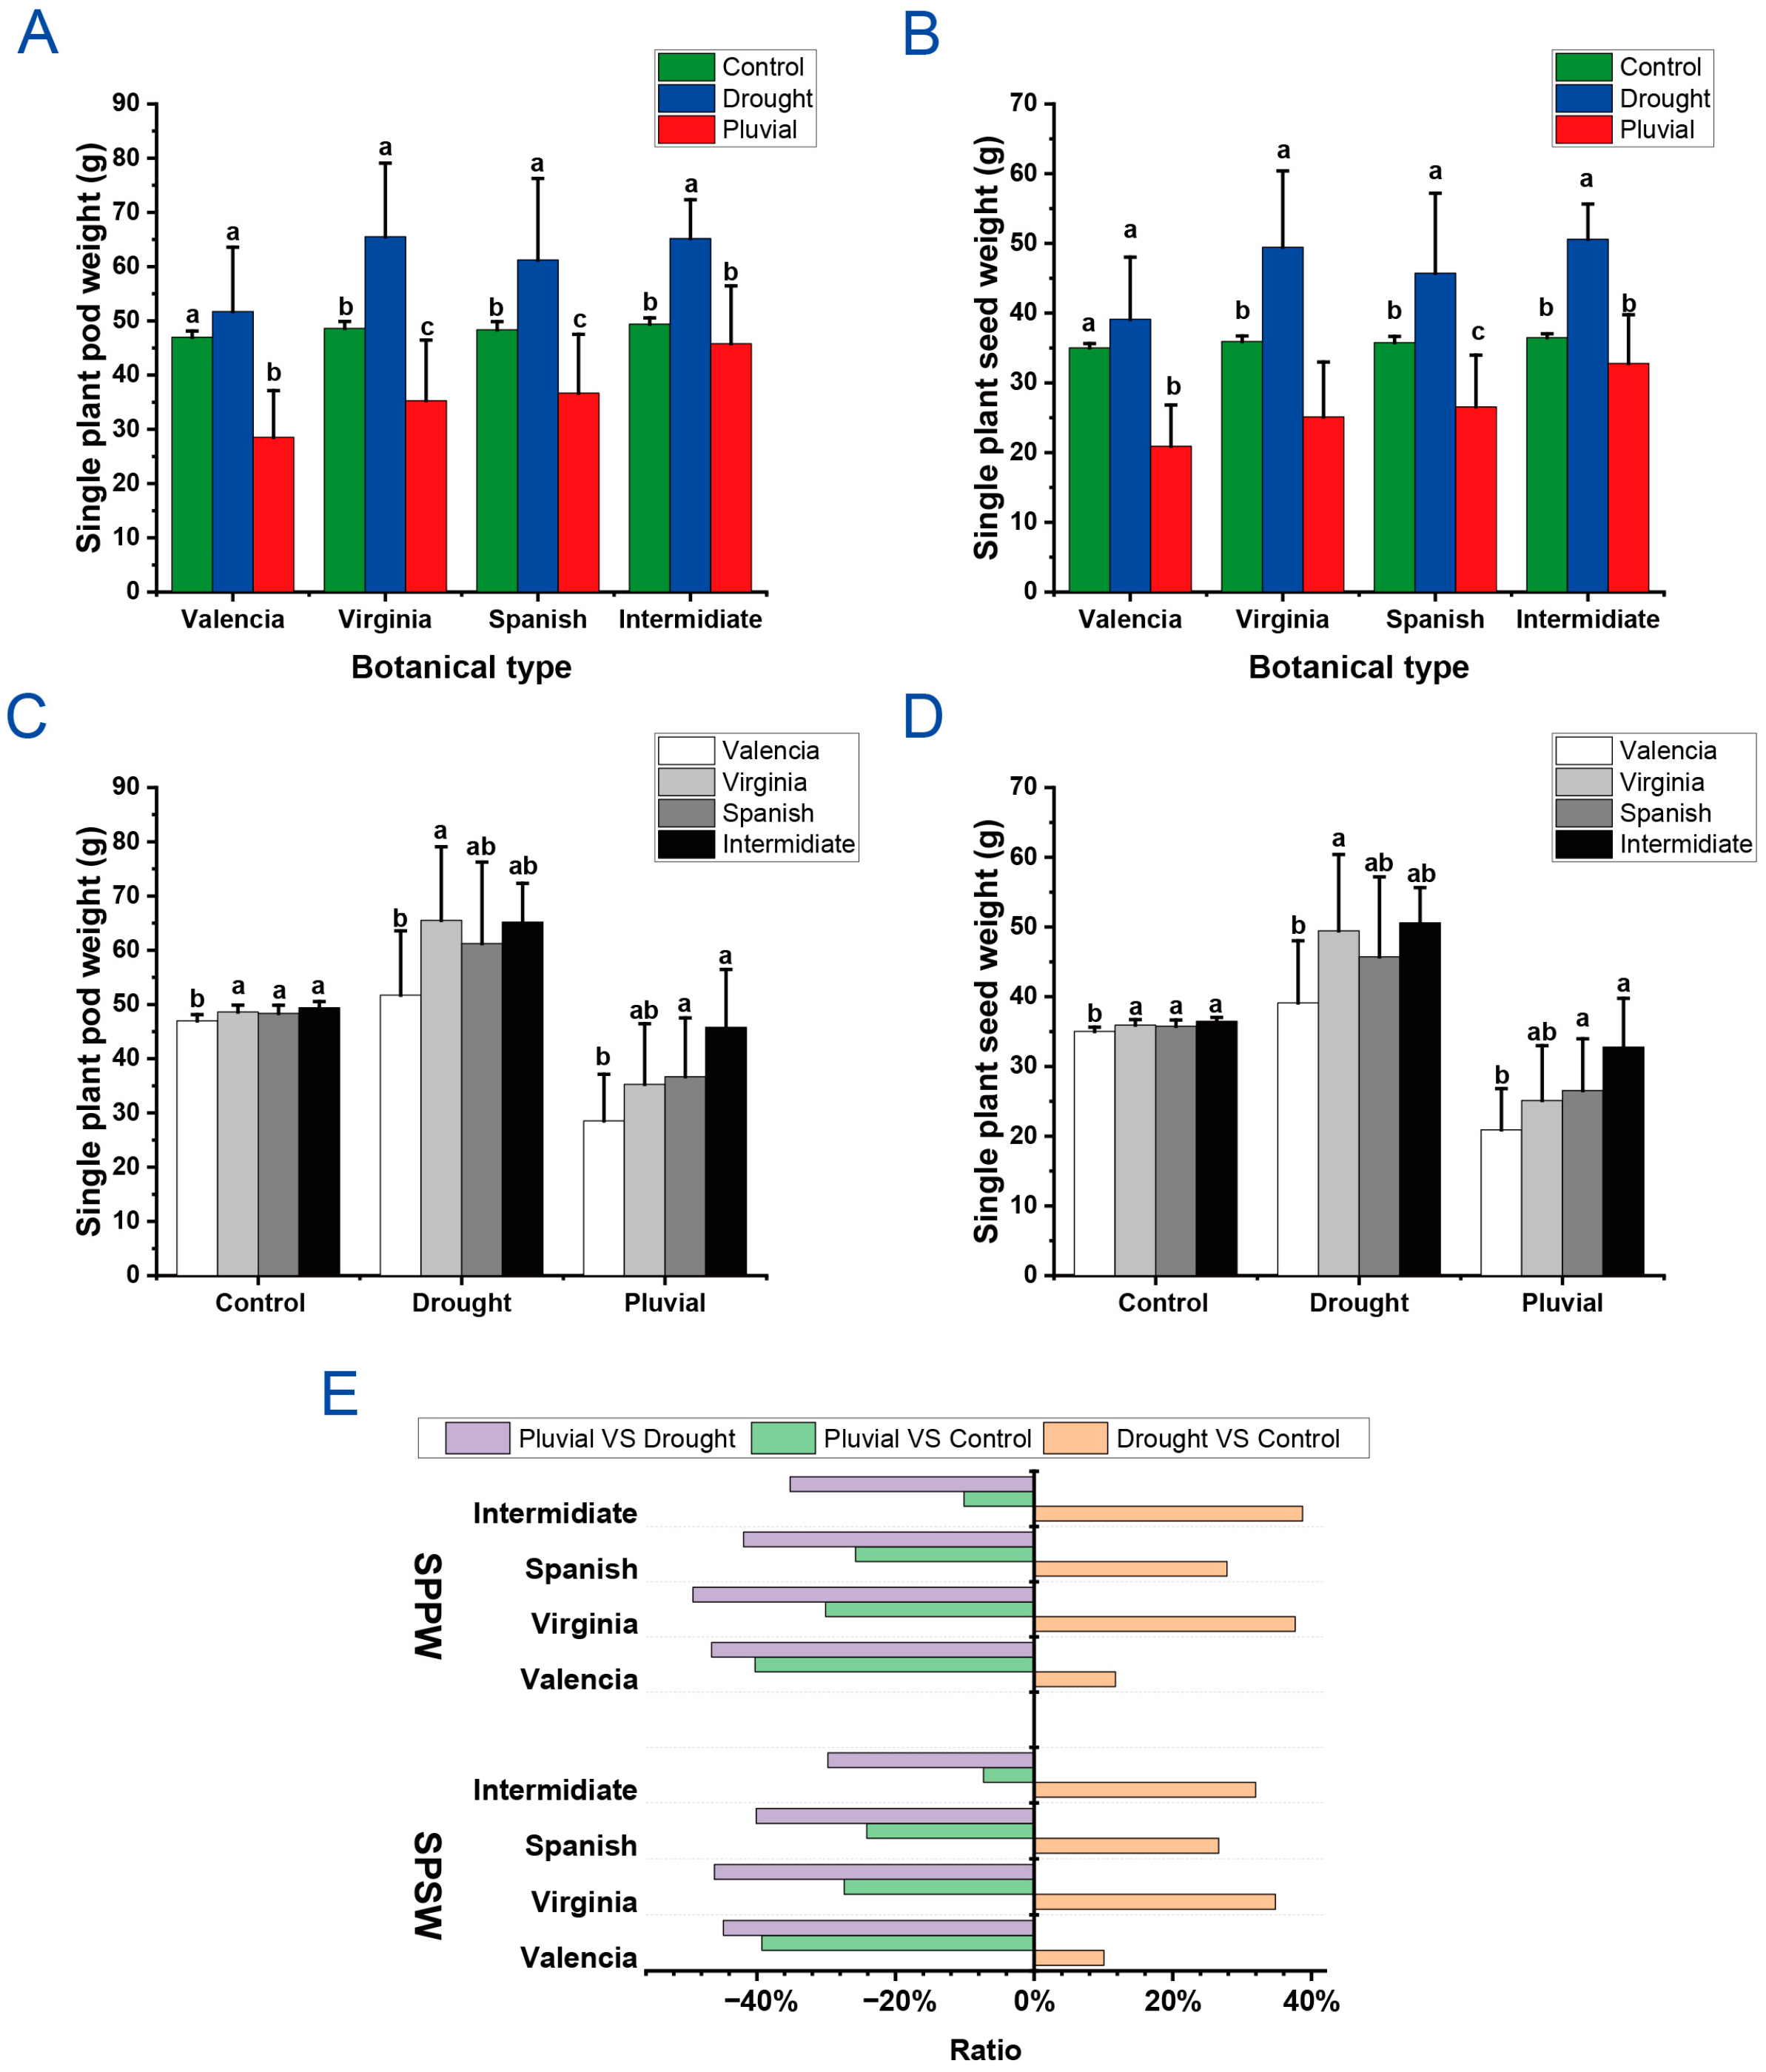
3.4. Stability and Production Potential of Different Botanical Types of Peanut Cultivars

Based on the comparative analysis results, SPPW and SPSW of the Valencia, Virginia, Spanish, and intermediate types of peanut cultivars remained similar across different growing seasons (Figure 5A,B). During the drought condition, there was no significant difference in SPPW and SPSW in the Valencia-type cultivars when compared to the control. However, the SPPW and SPSW were significantly higher in the dry growing season or control than in the pluvial condition. The Virginia and Spanish types exhibited their highest SPPW and SPSW during the drought condition, followed by the condition and finally, the pluvial condition. This suggests that these two peanut cultivar types are more adapted to drought conditions. Regarding the intermediate type, no significant differences were observed between the control and the pluvial for SPPW and SPSW. In contrast, both the SPPW and SPSW were significantly lower when compared to the drought. This indicates that the intermediate-type peanut cultivars exhibited greater tolerance to pluvial conditions compared to the other types.
A further comparison of the SPPW and SPSW of the different botanical types of cultivars in the same growing season revealed no significant differences between the Virginia, Spanish, and intermediate types (Figure 5C,D). However, the Valencia type showed significantly lower SPPW and SPSW than the other three types under the control conditions. Furthermore, during the drought condition, the Valencia-type cultivars had a lower SPPW and SPSW compared to the Virginia-type. During the pluvial condition, SPPW and SPSW were lower Valencia-type cultivars compared to the Spanish and intermediate types. The Virginia-type cultivars exhibited the best performance in the drought condition compared to other types. In contrast, Spanish and intermediate types had a higher SPPW and SPSW during the pluvial condition. Based on the best linear unbiased prediction of the overall productivity of peanut cultivars (control), a comprehensive evaluation of the productivity of each botanical type in the dry and pluvial seasons was performed. The different types were ranked from the most stable to least stable as follows: intermediate type, Spanish type, Virginia type, and Valencia type (Figure 5E). Additionally, the Virginia type exhibited a greater suitability for drought and had a greater potential for high yield.

3.5. Stability and Production Potential of Peanut Commercial Varieties and Landraces

A comparative analysis of SPPW and SPSW showed the same trends of change among the commercial varieties and landraces across different growing seasons (Figure 6A,B). Compared to the control, SPPW and SPSW of different cultivar types significantly increased during the drought condition and significantly decreased during the pluvial condition (Figure 6A,B). A further comparison of commercial varieties and landraces under different conditions revealed that commercial varieties outperformed landraces across all climatic conditions (Figure 6C–E). These results indicate that commercial varieties had better environmental stability and higher yield potential than the landraces.

3.6. Evaluation and Selection of Cultivars with Favorable Production Potential

The distribution of the cultivars’ SPPW and SPSW across control, drought, and pluvial conditions is shown in Figure 7A,B. The analysis revealed a substantial increase, compared to control, in both SPPW and SPSW for the majority of cultivars during the drought condition, which ranged from 2.44% to 73.34% and 3.96% to 85.37%, respectively. At the same time, there was a significant decrease in both SPPW and SPSW during the pluvial condition ranging from −63.78% to −0.04% and −66.00% to −5.87%, respectively. However, during the drought condition, fifteen cultivars exhibited a distinct decrease ranging from −5.20% to −25.14% for SPPW and from −3.77% to −24.52% for SPSW, which indicated that these cultivars were drought-sensitive. Moreover, during the pluvial condition, nine cultivars showed an apparent increase in SPPW ranging from 5.34% to 21.60%, while eight cultivars exhibited an apparent increase in SPSW ranging from 1.60% to 12.95%. Thus, these cultivars exhibited a greater tolerance under pluvial climatic conditions. Based on a comprehensive analysis of cultivar productivity during the drought and pluvial conditions, seven cultivars (Zhanyou 6, Luhua 1, Jihua 5, Guihua 25, Guihua 22, Qianhuasheng 4 and Zhonghua 10) showed a significant increase in both SPPW and SPSW compared with the BLUP values (control), suggesting these cultivars had high yield potential. Interestingly, the landrace Duyundapinghuasheng exhibited a distinct decrease in both SPPW and SPSW by about −25.14% and −23.60% during the dry growing season, while it showed an increase in both SPPW and SPSW by about 9.24% and 1.90% during the pluvial season. The result indicated this landrace was both drought-sensitive and pluvial-tolerant. All the results above indicated that these cultivars exhibit different adaptability and productivity in drought and pluvial conditions.

4. Discussion

Climate change is one of the most pressing environmental challenges worldwide, manifesting in rising global temperatures, changes in precipitation regimes, and an increased frequency and intensity of extreme weather events [29]. In recent decades, extreme climatic conditions, including seasonal droughts, heavy precipitation, storms, floods, and heat waves, have disrupted food production and frequently caused yield losses, seriously threatening China’s food security [30]. Guangdong province, located in the southern mainland of China and near the South China Sea, experiences a higher frequency of extreme climate events due to the combined influence of the ocean and the mainland [31]. The meteorological data from 1960 to 2020 indicate that the climate in Guangdong has become warmer and drier over the past 61 years, with an increased frequency of droughts projected in the future [31]. Furthermore, there has been a significant increase in heavy precipitation events, which are classified as strong and relatively strong events, while there was a notable decrease in relatively weak precipitation events [9]. As the occurrences of extreme climatic conditions and events increase, a growing number of studies have revealed their significant influence on the production and yield of major crops, including rice, maize, and wheat, in China [7,32,33,34,35]. Only a few studies have been conducted on the impact of climate on the growth and adaptation of peanuts, and most of the current studies have focused on suitable geographic zones for peanut cultivation or key climate factors affecting peanut yield [36,37,38]. Thus, assessing the influence of environment or extreme climate conditions on plant growth and yield traits of peanuts during a complete growing season is important for understanding the effects of climate change on peanut production and for breeding cultivars with favorable yield, especially in the climatically variable Guangdong province.
In this study, we systematically investigated the phenotype data of seventy peanut cultivars across five years combined with field meteorological data collection. We observed excellent yield performance during a drought condition (2021) and poor productivity and lower yield during the pluvial condition (2022) for most cultivars. This suggested that the drought did not have an absolutely detrimental effect on peanut yield. The analysis of meteorological parameters revealed that during the drought condition, despite the significant decrease in precipitation compared to the five-year mean (control) precipitation or to that of the pluvial growing season, the distribution of precipitation was suitable for peanut productivity, based on the water demands during the different developmental stages of peanut. The flowering, pegging, and podding stages are the main water-demanding periods during peanut growth. Both excessive and insufficient water during these stages are detrimental to peanut growth, and the flowering and pegging stage is the most sensitive period to water deficit [39,40]. In this study, the precipitation in the drought season was mainly concentrated in April and decreased in May and June. This period corresponds to the flowering, pegging, and podding stages. Moreover, the temperature in the drought condition in 2021 was higher and within the optimum temperature range for flowering (25~28 °C, April) and podding (25~35 °C, May and June) [40,41,42]. Interestingly, the characteristics of dry-wet climate change of Zhanjiang City from 1990 to 2020 also revealed that the increase in precipitation and temperature in April was conducive to the increase in peanut yield, while the precipitation in May and June was negatively correlated with peanut yield [43]. In addition, during the drought growing season, the cultivars got abundant sunlight for dry matter accumulation at the podding and maturity stages. These may contribute together to the excellent peanut yield performance in drought conditions. However, the precipitation continued to increase from March to May during control and the pluvial conditions, with excessive precipitation in May corresponding to the podding stage. Notably, the heavy precipitation events in Guangdong province predominantly occur in May and June [9], and excessive precipitation is unfavorable for peanut pod formation [39,40]. Unfortunately, the temperature during the pluvial growing season was close to the lower limit during flowering and lower during the early podding stage in the pluvial growing season. Therefore, the different precipitation, temperature and sunlight during the flowering, pegging, podding and maturity stages may contribute to significant peanut yield performance differences during the drought and pluvial climate conditions.
The impact of the climate or the environment on crops ultimately manifests in their phenotype, and different climates or environments may affect different traits [42,44,45,46,47]. In this study, the CV of the twenty traits varied in CK, drought and pluvial conditions. Usually, when the CV is greater than 10%, the trait shows significant variation within the population [45,48]. Using the best linear unbiased prediction (control), nine of the twenty traits showed significant variation with a coefficient of variation greater than 10%. Moreover, fifteen and seventeen traits had a coefficient of variation greater than 10% in the dry and pluvial growing seasons. The CV of five traits, including LA, PW, PLWR, SPPW, and SPSW, was increased to greater than 10% in the two climatic conditions studied. At the same time, one trait (SW) and three traits (LL, LW, and SP) exhibited a coefficient of variation greater than 10% in the dry or pluvial growing season, respectively. Therefore, the pluvial climate can lead to a higher variation of peanut traits compared to dry climatic conditions. Although previous studies have not explored the relationship between climate and trait performance, the variation in traits observed between different years also reflects this impact [49,50]. For example, continuous three-year monitoring of oil content, protein content, and their related traits in 61 peanut cultivars revealed differences in the variability of these traits during the years [51]. The evaluation of SP and HPW of sixty peanut cultivars in four ecological areas also revealed significant differences in the traits, areas, or years [52]. To adapt to climate change, breeding varieties with good environmental stability is crucial.
Phenotypic traits are the expression of both genetic and environmental factors [48]. To gain insights into the key factors influencing peanut traits, numerous studies have been conducted focusing on elucidating the predominant determinants, which are mainly influenced by genetic factors [1,12,13,14,15,16,17,18,19,20,21]. In this study, a systematic evaluation of 20 important agronomic and yield traits of peanuts indicated that eighteen of the twenty traits were predominantly controlled by genetic factors, consistent with previous research using F2:3 [12], RIL [13,14,15,16,19,20,21], and germplasm populations [17,18] for the evaluation of a single or a small number of peanut traits. However, the yield traits, SPPW and SPSW, were dominated by environmental effects, with a broad sense heritability of 0.16 and 0.13, respectively. The low broad sense heritability of yield per plant (SPPW) has also been reported by Wang et al. [17] using a collection of 195 peanut accessions. To the best of our understanding, SPPW or yield is determined by the plant pod number, which can be attributed to the number of flowers that successfully develop into pods. This biological process is susceptible to environmental influences like temperature and water [40]. Therefore, it is unsurprising that despite most yield-related traits being genetically controlled, the SPPW and SPSW are still significantly affected by drought or pluvial conditions. In addition, although predominantly controlled by genetic factors, eight traits (LA, LW, MSH, TBN, SW, HPW, HPSW, HSW) also exhibited significant differences between different environments, suggesting that the stability of these traits needs to be examined in multiple environments during the breeding process.
The relationship between climatic parameters and agricultural production is quite complex because environmental factors affect plant growth and development in different ways during the complete growth stages [53,54,55]. A few studies have been conducted in China to examine the relationship between climate parameters and peanut yield at large space and time scales [22,23,24,25,43], and have explained the correlation between climatic parameters (such as light, precipitation and temperature) and peanut yield. Different from previous studies, our study investigated the important agronomic and yield traits of peanuts more comprehensively and recorded meteorological data more accurately in a small experimental space. In this study, seventeen correlation pairs were identified between thirteen traits and seven meteorological parameters. Among them, SPPW and SPSW were significantly negatively correlated with SWC 0–15 cm. Meanwhile, six of the eight key yield-related traits were positively correlated with AT, SWC, TGR, TP, TNR and MDT, respectively. These meteorological parameters positively or negatively regulated the key yield-related traits, while the correlation between the meteorological parameters indicated the shared influence among the parameters. All these interactions contribute to the complex influence of climate on peanut production.
Assessment of genotype-by-environment interactions is important for predicting how beneficial improvements in crop genetics due to breeding can lead to increased stability of agronomically important phenotypes in the face of climate change [6]. For example, to identify peanut varieties with desirable hundred pod weight and shelling percentage stability, Guo et al. selected five cultivars with greater performance after assessing the adaptability of 60 varieties from the Yellow River and Yangtze River region through a two-year, four-location experiment [52]. In this study, evaluation of the stability and production potential of different peanut botanical types showed that the intermediate and Spanish types had better stability to dry and pluvial conditions, consistent with the cultivar type suitable for the area. Generally, the peanut cultivars in the north of China are mainly the Virginia type. At the same time, those in the south are primarily the Spanish type, and the intermediate type is also in demand due to its better adaptability and yield [56]. Notably, the Virginia type and intermediate type cultivars showed better drought adaptability than the Spanish type because these mainly come from more arid northern growing regions. Landraces are commonly considered to have better environmental stability and resistance than commercial varieties. They are important gene sources for biotic and abiotic stress breeding, and they have been exploited in rice [57,58], tomato [59], and sorghum [60]. Interestingly, in our study, the commercial varieties exhibited better stability and production potential compared with the landraces, suggesting the yield and stability may have been selected simultaneously during their genetic improvement. Further, the genotype production potential was evaluated, and seven cultivars were identified with good performance during drought and pluvial conditions. These cultivars could be used as the base materials for improving the adaptability of peanut varieties in the future.

5. Conclusions

In this study, a comprehensive analysis of the phenotype of seventy peanut cultivars in combination with field meteorological parameters was conducted to understand the influence of drought and pluvial climate conditions on peanut traits and yield. The result revealed that the cultivars archived the highest mean yield in the drought condition, followed by the control, and finally the pluvial. The yield traits, SPPW and SPSW, were predominantly controlled by environmental factors, and significantly influenced by the environment along with LA, LW, MSH, TBN, SW, HPW, HPSW, and HSW. Six traits, LSF, FBL, PL, PW, PLWR, and SL, were kept stable across different environments. There were complex correlations between peanut traits and meteorological parameters. The yield traits and key yield-related traits were positively or negatively correlated with SWC, TGR, TP and TNR. The intermediate and Spanish types were more stable and productive and commercial varieties performed better than landraces in drought and pluvial climate conditions. Seven (Zhanyou 6, Luhua 1, Jihua 5, Guihua 25, Guihua 22, Qianhuasheng 4, and Zhonghua 10) cultivars exhibited excellent production potential during both drought and pluvial conditions.

Supplementary Materials

The following supporting information can be downloaded at: https://www.mdpi.com/article/10.3390/agriculture13101965/s1, Table S1: Information of the peanut cultivars; Table S2: Multivariable linear stepwise regression analysis between single plant pod weight and its associated traits using the five-year mean data; Table S3: Multivariable linear stepwise regression analysis between single plant pod weight and its associated traits using the BLUP data; Table S4: Multivariable linear stepwise regression analysis between single plant seed weight and its associated traits using the five-year mean data; Table S5: Multivariable linear stepwise regression analysis between single plant seed weight and its associated traits using the BLUP data; Table S6: Correlation analysis between the meteorological parameters.

Author Contributions

Conceptualization, Z.X.; methodology, Z.X. and D.A.; software, L.X. and Q.L.; validation, Z.X. and X.Z.; formal analysis, Z.X.; investigation, Z.X., D.A. and B.Z.; resources, Z.X., D.A. and B.Z.; data curation, Z.X., D.A. and B.Z.; writing—original draft preparation, Z.X.; writing—review and editing, Z.X.; visualization, Z.X.; supervision, Z.X.; project administration, Z.X.; funding acquisition, Z.X., X.Z. and Q.L. All authors have read and agreed to the published version of the manuscript.

Funding

This research was funded by Hainan Provincial Natural Science Foundation of China and Guangdong Basic and Applied Basic Research Foundation, grant number 321QN348 and 2020A1515010636. This research was also funded by Central public-interest Scientific Institution Basal Research Fund for Chinese Academy of Tropical Agricultural Sciences, grant number 1630102023001 and 1630102023002.

Institutional Review Board Statement

Not applicable.

Data Availability Statement

The phenotypic data is available on request from the corresponding author.

Conflicts of Interest

The authors declare no conflict of interest.

References

  1. Li, L.; Cui, S.; Dang, P.; Yang, X.; Wei, X.; Chen, K.; Liu, L.; Chen, C.Y. GWAS and bulked segregant analysis reveal the Loci controlling growth habit-related traits in cultivated Peanut (Arachis hypogaea L.). BMC Genom. 2022, 23, 403. [Google Scholar]
  2. Chu, Y.; Chee, P.; Culbreath, A.; Isleib, T.G.; Holbrook, C.C.; Ozias-Akins, P. Major QTLs for resistance to early and late leaf spot diseases are identified on chromosomes 3 and 5 in peanut (Arachis hypogaea). Front. Plant Sci. 2019, 10, 883. [Google Scholar] [CrossRef] [PubMed]
  3. Kunta, S.; Agmon, S.; Chedvat, I.; Levy, Y.; Chu, Y.; Ozias-Akins, P.; Hovav, R. Identification of consistent QTL for time to maturation in Virginia-type Peanut (Arachis hypogaea L.). BMC Plant Biol. 2021, 21, 186. [Google Scholar] [CrossRef] [PubMed]
  4. National Bureau of Statistics. Available online: https://data.stats.gov.cn/ (accessed on 20 July 2023).
  5. Xu, Z.; Wu, X.; Hu, X.; Liu, Y. Phenotypic diversity of 33 introduced peanut germplasm accessions and preliminary adaptability evaluation in west Guangdong. Chin. J. Trop. Crops 2021, 42, 1885–1895. [Google Scholar]
  6. Attia, Z.; Pogoda, C.S.; Reinert, S.; Kane, N.C.; Hulke, B.S. Breeding for sustainable oilseed crop yield and quality in a changing climate. Theor. Appl. Genet. 2021, 134, 1817–1827. [Google Scholar] [PubMed]
  7. Liu, Y.; Zhang, J.; Ge, Q. The optimization of wheat yield through adaptive crop management in a changing climate: Evidence from China. J. Sci. Food Agric. 2021, 101, 3644–3653. [Google Scholar] [CrossRef] [PubMed]
  8. Deng, L.; Li, Y.; Cao, Z.; Hao, R.; Wang, Z.; Zou, J.; Wu, Q.; Qiao, J. Revealing impacts of human activities and natural factors on dynamic changes of relationships among ecosystem services: A case study in the Huang-Huai-Hai plain, China. Int. J. Environ. Res. Public Health 2022, 19, 10230. [Google Scholar] [CrossRef]
  9. Wu, H.; Zou, Y.; Liu, W. Quantitative assessment of regional heavy rainfall process in Guangdong and its climatological characteristics. J. Appl. Meteor. Sci. 2019, 30, 233–244. [Google Scholar]
  10. Wang, H.; Chen, H.; Tang, L.; Wang, J.; Tang, H. Temporal and spatial change of climate resources and meteorological disasters under climate change during winter crop growing season in Guangdong Province, China. Chin. J. Appl. Ecol. 2018, 29, 93–102. [Google Scholar]
  11. Puppala, N.; Nayak, S.N.; Sanz-Saez, A.; Chen, C.; Devi, M.J.; Nivedita, N.; Bao, Y.; He, G.; Traore, S.M.; Wright, D.A.; et al. Sustaining yield and nutritional quality of peanuts in harsh environments: Physiological and molecular basis of drought and heat stress tolerance. Front. Genet. 2023, 14, 1121462. [Google Scholar]
  12. Huang, L.; He, H.; Chen, W.; Ren, X.; Chen, Y.; Zhou, X.; Xia, Y.; Wang, X.; Jiang, X.; Liao, B.; et al. Quantitative trait locus analysis of agronomic and quality-related traits in cultivated peanut (Arachis hypogaea L.). Theor. Appl. Genet. 2015, 128, 1103–1115. [Google Scholar] [CrossRef]
  13. Chen, W.; Jiao, Y.; Cheng, L.; Huang, L.; Liao, B.; Tang, M.; Ren, X.; Zhou, X.; Chen, Y.; Jiang, H. Quantitative trait locus analysis for pod- and kernel-related traits in the cultivated peanut (Arachis hypogaea L.). BMC Genet. 2016, 17, 25. [Google Scholar] [CrossRef]
  14. Zhang, S.; Hu, X.; Miao, H.; Chu, Y.; Cui, F.; Yang, W.; Wang, C.; Shen, Y.; Xu, T.; Zhao, L.; et al. QTL identification for seed weight and size based on a high-density SLAF-seq genetic map in peanut (Arachis hypogaea L.). BMC Plant Biol. 2019, 19, 537. [Google Scholar]
  15. Huang, L.; Ren, X.; Wu, B.; Li, X.; Chen, W.; Zhou, X.; Chen, Y.; Pandey, M.K.; Jiao, Y.; Luo, H.; et al. Development and deployment of a high-density linkage map identified quantitative trait loci for plant height in peanut (Arachis hypogaea L.). Sci. Rep. 2016, 6, 39478. [Google Scholar]
  16. Zhou, X.; Xia, Y.; Liao, J.; Liu, K.; Li, Q.; Dong, Y.; Ren, X.; Chen, Y.; Huang, L.; Liao, B.; et al. Quantitative trait locus analysis of late leaf spot resistance and plant-type-related traits in cultivated peanut (Arachis hypogaea L.) under multi-environments. PLoS ONE 2016, 11, e0166873. [Google Scholar]
  17. Wang, J.; Yan, C.; Li, Y.; Li, C.; Zhao, X.; Yuan, C.; Sun, Q.; Shan, S. GWAS discovery of candidate genes for yield-related traits in peanut and support from earlier QTL mapping studies. Genes 2019, 10, 803. [Google Scholar] [CrossRef]
  18. Zhou, X.; Guo, J.; Pandey, M.K.; Varshney, R.K.; Huang, L.; Luo, H.; Liu, N.; Chen, W.; Lei, Y.; Liao, B.; et al. Dissection of the genetic basis of yield-related traits in the Chinese peanut mini-core collection through genome-wide association studies. Front. Plant Sci. 2021, 12, 637284. [Google Scholar] [PubMed]
  19. Wang, Z.; Huai, D.; Zhang, Z.; Cheng, K.; Kang, Y.; Wan, L.; Yan, L.; Jiang, H.; Lei, Y.; Liao, B. Development of a high-density genetic map based on specific length amplified fragment sequencing and its application in quantitative trait loci analysis for yield-related traits in cultivated peanut. Front. Plant Sci. 2018, 9, 827. [Google Scholar] [PubMed]
  20. Luo, H.; Pandey, M.K.; Khan, A.W.; Guo, J.; Wu, B.; Cai, Y.; Huang, L.; Zhou, X.; Chen, Y.; Chen, W.; et al. Discovery of genomic regions and candidate genes controlling shelling percentage using QTL-seq approach in cultivated peanut (Arachis hypogaea L.). Plant Biotechnol. J. 2019, 17, 1248–1260. [Google Scholar] [PubMed]
  21. Chavarro, C.; Chu, Y.; Holbrook, C.; Isleib, T.; Bertioli, D.; Hovav, R.; Butts, C.; Lamb, M.; Sorensen, R.; A Jackson, S.; et al. Pod and seed trait QTL identification to assist breeding for peanut market preferences. Genes Genomes Genet. 2020, 10, 2297–2315. [Google Scholar]
  22. Wang, Y.; Xu, S.W.; Yu, W. Research on the effects of meteorological factors on peanut yield. Guangdong Agric. Sci. 2014, 41, 1–8. [Google Scholar]
  23. Yang, X.; Yang, J.; Yang, C.; Ren, Z.; Wang, D. Peanut yield in Anhui: Correlation with meteorological factors and forecast model. Chin. Agric. Sci. Bull. 2020, 36, 100–103. [Google Scholar]
  24. Sun, R. Correlation analysis of meteorological factors of main peanut growth stages and yield of summer peanut in Zhengyang. Zhejiang Agric. Sci. 2021, 62, 1317–1319. [Google Scholar]
  25. Jiang, X.; Xu, J.; Pan, L.; Chen, N.; Wang, T.; Jiang, X.; Yin, X.; Yang, Z.; Yu, S.; Chi, X. Peanut yield-related traits and meteorological factors correlation analysis in multiple environments. Acta Agron. Sin. 2023, 49, 3110–3121. [Google Scholar]
  26. Jiang, H.; Duan, N.; Ren, X. Descriptors and Data Standard for Peanut (Arachis spp.); China Agriculture Press: Beijing, China, 2006; pp. 26–27. [Google Scholar]
  27. Hallauer, A.R.; Miranda, J.B. Quantitative Genetics in Maize Breeding, 2nd ed.; Iowa State University Press: Ames, IA, USA, 1898. [Google Scholar]
  28. Miller, L.; Pisacane, C.; Vicino, G. Relationship between behavioural diversity and faecal glucocorticoid metabolites: A case study with cheetahs (Acinonyx Jubatus). Anim. Welf. 2016, 25, 325–329. [Google Scholar] [CrossRef]
  29. Freitas, T.R.; Santos, J.A.; Silva, A.P.; Fraga, H. Reviewing the adverse climate change impacts and adaptation measures on almond trees (Prunus dulcis). Agriculture 2023, 13, 1423. [Google Scholar]
  30. Shi, W.; Wang, M.; Liu, Y. Crop yield and production responses to climate disasters in China. Sci. Total Environ. 2021, 750, 141147. [Google Scholar]
  31. Zhao, B.; An, D.; Yan, C.; Yan, H.; Kong, R.; Su, J. Spatiotemporal variations of reference evapotranspiration and its climatic driving factors in Guangdong, a humid subtropical province of south China. Agronomy 2023, 13, 1446. [Google Scholar] [CrossRef]
  32. Guo, E.L.; Liu, X.P.; Zhang, J.Q.; Wang, Y.F.; Wang, C.L.; Wang, R.; Li, D.J. Assessing spatiotemporal variation of drought and its impact on maize yield in Northeast China. J. Hydrol. 2017, 553, 231–247. [Google Scholar] [CrossRef]
  33. Zhang, Z.; Chen, Y.; Wang, C.Z.; Wang, P.; Tao, F.L. Future extreme temperature and its impact on rice yield in China. Int. J. Climatol. 2017, 37, 4814–4827. [Google Scholar] [CrossRef]
  34. Zipper, S.C.; Qiu, J.X.; Kucharik, C.J. Drought effects on US maize and soybean production: Spatiotemporal patterns and historical changes. Environ. Res. Lett. 2016, 11, 094021. [Google Scholar] [CrossRef]
  35. Serna, L. Maize stomatal responses against the climate change. Front. Plant Sci. 2022, 13, 952146. [Google Scholar] [PubMed]
  36. Cui, L.; Gai, S.R.; Yue, G.; Xing, Q.; Zhang, Y. Study on rational planting division of summer peanut in Shandong Province. J. Peanut Sci. 1990, 2, 1–7. [Google Scholar]
  37. Wang, Y. Study and Zoning on Agricultural Climatic Suitability of Peanuts in Liaoning Province Based on GIS Technology. Master’s Thesis, Shenyang Agricultural University, Shenyang, China, 2017. [Google Scholar]
  38. Wei, S.; Li, K.; Yang, Y.; Wang, C.; Liu, C.; Zhang, J. Comprehensive climatic suitability evaluation of peanut in Huang-Huai-Hai region under the background of climate change. Sci. Rep. 2022, 12, 11350. [Google Scholar]
  39. Miao, H.; Li, Q.; Hou, X.; Jia, D.; Shi, B.; Ding, H.; Zhang, Z. Effects of drought at different growth stages on growth and yield of peanut. Xinjiang Agric. Sci. 2021, 58, 441. [Google Scholar]
  40. Shandong Peanut Research Institute. Chinese Peanut Cultivation; Shanghai Science and Technology Press: Shanghai, China, 2003; pp. 195–198. [Google Scholar]
  41. Prasad, P.V.V.; Boote, K.J.; Hartwell, A.L.; Thomas, J.M.G. Super-optimal temperatures are detrimental to peanut (Arachis hypogaea L.) reproductive processes and yield at both ambient and elevated carbon dioxide. Glob. Chang. Biol. 2003, 9, 1775–1787. [Google Scholar]
  42. Akram, N.A.; Shafiq, F.; Ashraf, M. Peanut (Arachis hypogaea L.): A prospective legume crop to offer multiple healthbenefits under changing climate. Compr. Rev. Food Sci. Food Saf. 2018, 17, 1325–1338. [Google Scholar]
  43. Zhao, B.; Dou, M.; An, D.; Yan, C.; Ma, H.; Huang, S.; Su, J. Characteristics of dry-wet climate change and its impacts on the yield of rice, sugarcane and peanut in Zhanjiang area, Guangdong, China. Chin. J. Tropic. Crops 2023, 44, 1506–1514. [Google Scholar]
  44. Xu, Y. Envirotyping for deciphering environmental impacts on crop plants. Theor. Appl. Genet. 2016, 129, 653–673. [Google Scholar]
  45. Xu, Z.; Kong, R.; An, D.; Zhang, X.; Li, Q.; Nie, H.; Liu, Y.; Su, J. Evaluation of a sugarcane (Saccharum spp.) hybrid F1 population phenotypic diversity and construction of a rapid sucrose yield estimation model for breeding. Plants 2023, 12, 647. [Google Scholar]
  46. Hyles, J.; Bloomfield, M.T.; Hunt, J.R.; Trethowan, R.M.; Trevaskis, B. Phenology and related traits for wheat adaptation. Heredity 2020, 125, 417–430. [Google Scholar] [PubMed]
  47. Ahrens, C.W.; Andrew, M.E.; Mazanec, R.A.; Ruthrof, K.X.; Challis, A.; Hardy, G.; Byrne, M.; Tissue, D.T.; Rymer, P.D. Plant functional traits differ in adaptability and are predicted to be differentially affected by climate change. Ecol. Evol. 2019, 10, 232–248. [Google Scholar] [CrossRef] [PubMed]
  48. Xin, Y.H.; Wu, Y.X.; Qiao, B.; Su, L.; Xie, S.Q.; Ling, P. Evaluation on the phenotypic diversity of Calamansi (Citrus microcarpa) germplasm in Hainan island. Sci. Rep. 2022, 12, 371. [Google Scholar] [CrossRef] [PubMed]
  49. Gremillion, S.K.; Culbreath, A.K.; Gorbet, D.W.; Mullinix, B.G.; Pittman, R.N., Jr.; Stevenson, K.L.; Todd, J.W.; Escobar, R.E.; Condori, M.M. Field evaluations of leaf spot resistance and yield in peanut genotypes in the United States and Bolivia. Plant Dis. 2011, 95, 263–268. [Google Scholar] [CrossRef]
  50. Guo, F.; Ruan, J.; Wang, Y.; Wan, S.; Peng, Z. Study on genetic stability of peanut quality characters in response to environmental changes using coefficient of variation. Shandong Agric. Sci. 2017, 49, 25–31. [Google Scholar]
  51. Guo, J.; Wu, B.; Chen, W.; Huang, L.; Chen, Y.; Zhou, X.; Luo, H.; Liu, N.; Ren, X.; Jiang, H. Stability of major fatty acids contents of peanut varieties grown in different ecological regions. Acta Agron. Sin. 2019, 45, 676–682. [Google Scholar] [CrossRef]
  52. Guo, J.; Jia, C.; Jing, J.; Chen, S.; Chen, W.; Huang, L.; Chen, Y.; Zhou, X.; Luo, H.; Liu, N.; et al. Ecological stability of shelling percentage and hundred pod weight in main peanut cultivars. Chin. J. Oil Crop Sci. 2019, 41, 186. [Google Scholar]
  53. Dosso, S.; Yoroba, F.; Kouassi, B.; Kouadio, K.; Diawara, A.; Kobea, A.; Diedhiou, A. Climate impact on the productivity of sugarcane varieties in Ferke1 Industrial Plantations. Agric. Sci. 2023, 14, 954–976. [Google Scholar] [CrossRef]
  54. Camargo, M.B.P.D. The impact of climatic variability and climate change on arabic coffee crop in Brazil. Bragantia 2010, 69, 239–247. [Google Scholar] [CrossRef]
  55. He, Y.; Matthews, M.L. Seasonal climate conditions impact the effectiveness of improving photosynthesis to increase soybean yield. Field Crops Res. 2023, 296, 108907. [Google Scholar] [CrossRef]
  56. Li, G.; Qin, S.; Liu, Y.; Zhang, J.; Han, Y.; Wan, S. Advances in plant architecture studies of peanut. Chin. J. Oil Crop Sci. 2020, 42, 934–939. [Google Scholar]
  57. Beena, R.; Kirubakaran, S.; Nithya, N.; Manickavelu, A.; Sah, R.P.; Abida, P.S.; Sreekumar, J.; Jaslam, P.M.; Rejeth, R.; Jayalekshmy, V.G.; et al. Association mapping of drought tolerance and agronomic traits in rice (Oryza sativa L.) landraces. BMC Plant Biol. 2021, 21, 484. [Google Scholar]
  58. Li, W.; Li, K.; Huang, Y.; Shi, C.; Hu, W.S.; Zhang, Y.; Zhang, Q.J.; Xia, E.H.; Hutang, G.R.; Zhu, X.G.; et al. SMRT sequencing of the Oryza rufipogon genome reveals the genomic basis of rice adaptation. Commun. Biol. 2020, 3, 167. [Google Scholar]
  59. Massaretto, I.L.; Albaladejo, I.; Purgatto, E.; Flores, F.B.; Plasencia, F.; Egea-Fernández, J.M.; Bolarin, M.C.; Egea, I. Recovering Tomato landraces to simultaneously improve fruit yield and nutritional quality against salt stress. Front. Plant Sci. 2018, 9, 1778. [Google Scholar] [CrossRef]
  60. Nagesh Kumar, M.V.; Ramya, V.; Govindaraj, M.; Sameer Kumar, C.V.; Maheshwaramma, S.; Gokenpally, S.; Prabhakar, M.; Krishna, H.; Sridhar, M.; Venkata Ramana, M.; et al. Harnessing sorghum landraces to breed high-yielding, grain mold-tolerant cultivars with high protein for drought-prone environments. Front. Plant Sci. 2021, 12, 659874. [Google Scholar] [CrossRef]
Figure 1. Location of Guangdong Province and experimental site. The red star represents the experiment site.
Agriculture 13 01965 g001
Figure 2. Significant differences analysis of the twenty peanut traits between the control, drought and pluvial conditions. The significant differences of the traits were analyzed using Origin software with LSD method. *, ** and *** represent significant at p < 0.05, p < 0.01, and p < 0.001, respectively.
Agriculture 13 01965 g002
Figure 3. Comparison of meteorological parameters in control, drought and pluvial conditions. The ratio was calculated by the parameter value difference in different climate conditions dividing the value of parameter compared.
Agriculture 13 01965 g003
Figure 4. Changes in the meteorological parameters in different months during CK, drought, and pluvial conditions. The green, blue and red lines represent control, drought and pluvial, respectively.
Agriculture 13 01965 g004
Figure 5. Comparative analysis of single plant pod and seed weight between Valencia, Virginia, Spanish, and intermediate type peanut cultivars. (A,B) Single plant pod and seed weight comparison of each botanical type peanut cultivar under control, the drought and pluvial conditions. (C,D) Single plant pod and seed weight comparison of the four botanical type peanut cultivars under the same growing conditions. (E) Comparison of single plant pod and seed weight changes for the four botanical type peanut cultivars in control, drought and pluvial conditions. The comparative analysis was conducted using Origin software with LSD method. a, b and c represent significant at p < 0.05, respectively.
Agriculture 13 01965 g005
Figure 6. Comparative analysis of single plant pod weight and single plant seed weight between commercial varieties and landraces. (A,B) Single plant pod and seed weight comparison of each type of peanut cultivar under control, the drought and pluvial conditions. (C,D) Single plant pod and seed weight comparison of commercial varieties and landraces under the same growing conditions. (E) Comparison of single plant pod and seed weight changes for commercial varieties and landraces in control, drought and pluvial conditions. The comparative analysis was conducted using Origin software with LSD method. a, b and c represent significant at p < 0.05, respectively.
Agriculture 13 01965 g006
Figure 7. Evaluation of the adaptability and production potential of the seventy peanut cultivars. (A,B) Distribution of single plant pod of the seventy cultivars during the control, drought and pluvial conditions. (C) Comparison of single plant pod and seed weight changes for drought and pluvial conditions.
Agriculture 13 01965 g007
Table 1. Chemical characteristics of the experimental soil.
PropertiesValue
Total N (g·kg−1)1.20
Total P (g·kg−1)0.96
Total K (g·kg−1)2.20
Available N (mg·kg−1)130.60
Available P (mg·kg−1)95.80
Available K (mg·kg−1)77.00
Organic C (g·kg−1)24.80
pH5.51
Table 2. Phenotypic variation and diversity analysis of seventy peanut cultivars in CK, drought and pluvial conditions.
TraitsMean ± SD aRangeCV bH′cG dE eH2 f
ControlDroughtPluvialControlDroughtPluvialControlDroughtPluvialControlDroughtPluvial
LA (mm2)1240.85 ± 106.031573.29 ± 215.15909.08 ± 212.601039.79–1555.5968.14–2112.62479.36–18670.090.140.242.932.912.76******0.61
LL (mm)58.96 ± 3.4066.89 ± 4.9550.74 ± 6.2152.51–68.5752.47–83.9537.9–75.020.060.070.122.842.822.85******0.70
LW (mm)28.4 ± 1.6132.65 ± 3.0024.3 ± 3.1024.94–32.1325.56–40.3917.4–35.260.060.090.132.982.912.99******0.63
LLWR2.09 ± 0.132.06 ± 0.172.11 ± 0.191.79–2.441.63–2.531.78–2.560.060.080.092.852.872.91******0.82
LSF0.92 ± 0.040.92 ± 0.050.93 ± 0.050.82–1.000.79–1.010.80–1.030.040.060.052.872.922.99***ns0.80
MSH (cm)58.77 ± 9.4955.06 ± 9.6461.94 ± 15.0740.99–81.6234.40–82.5039.50–105.700.160.180.252.872.882.67******0.82
FBL (cm)67.56 ± 11.2465.55 ± 13.2268.76 ± 13.8045.89–94.7140.90–96.2044.70–102.400.170.200.202.852.822.95******0.89
TBN7.98 ± 0.908.53 ± 1.257.57 ± 1.325.05–9.334.30–11.104.00–9.400.110.150.182.542.892.55******0.76
PLWR2.45 ± 0.342.44 ± 0.392.45 ± 0.381.99–3.702.00–3.931.84–3.660.140.160.162.682.662.79***ns0.93
PL (mm)36.05 ± 5.4436.7 ± 6.6535.42 ± 5.7125.92–52.2719.51–58.4224.04–49.990.150.180.162.882.862.92******0.92
PW (mm)15.04 ± 1.1715.29 ± 1.6314.89 ± 1.6312.42–17.659.01–18.1811.28–18.510.080.110.112.932.883.02****0.80
SLWR1.73 ± 0.161.7 ± 0.181.76 ± 0.221.43–2.251.42–2.171.34–2.490.090.110.132.842.812.80******0.87
SL (mm)16.62 ± 1.8316.99 ± 2.9016.39 ± 2.1313.62–22.6712.77–32.3613.15–20.620.110.170.132.792.652.90*****0.81
SW (mm)9.73 ± 0.6110.14 ± 1.169.42 ± 0.708.42–11.958.11–15.867.86–11.200.060.120.072.832.782.88******0.74
HPW (g)189.2 ± 28.27201.24 ± 33.91178.62 ± 33.76128.72–269.04126.10–301.55107.20–274.600.150.170.192.942.862.93******0.90
HPSW (g)139.41 ± 18.91150.98 ± 25.69129.41 ± 24.4596.48–195.893.15–227.6573.30–192.100.140.170.192.862.812.87******0.84
HSW (g)71.41 ± 11.8979.63 ± 16.1564.25 ± 12.1444.68–99.2446.00–117.737.80–92.300.170.200.192.902.842.92******0.90
SP0.74 ± 0.020.75 ± 0.030.73 ± 0.080.70–0.850.67–0.810.63–1.200.030.040.112.522.942.08******0.89
SPPW (g)48.29 ± 1.4861.03 ± 14.2935.9 ± 10.9544.95–51.9634.51–86.2717.43–63.170.030.240.312.912.932.90****0.16
SPSW (g)35.74 ± 0.8845.84 ± 11.0025.92 ± 7.5433.87–37.8825.76–67.9312.16–45.080.020.240.292.922.982.92****0.13
a represents standard deviation; b represents coefficient of variation; c represents the Shannon-Wiener diversity index; d represents genotypic effect; e represents environmental effect; f represents the broad-sense heritability. *, ** and *** represent significant at p < 0.05, p < 0.01, and p < 0.001, respectively. ns represents no significance at p < 0.05.
Table 3. The meteorological parameters of control, drought and pluvial conditions.
Meteorological ParameterControlDroughtPluvial
AT (°C)1346.931461.281154.09
MRH (%)86.8085.5788.29
TNR (W/m2)12,430.1013,609.6812,737.47
TGR (W/m2)23,898.0825,862.1224,093.68
TPAR (umol/s/m2)47,211.3350,801.6348,004.48
SAC 0–15 cm (°C)1696.271846.381486.89
SAC 15–30 cm (°C)1639.431783.561438.75
SWC 0–15 cm0.260.250.27
SWC 15–30 cm0.350.350.37
TP (mm)421.23238.40478.60
MDT (°C)25.2626.1523.80
Table 4. Correlation analysis between the meteorological parameters and peanut traits.
CorrelationATMRHTNRTGRTPARSAT
(0–15 cm)
SAT (15–30 cm)SWC
(0–15 cm)
SWC (15–30 cm)TPMDT
LA0.943−0.2590.4350.7260.8260.8680.759−0.976−0.767−0.8050.945
LL0.901−0.1810.5170.7120.8570.8110.692−0.948−0.691−0.8520.903
LW0.951 *−0.2840.410.7320.8180.8820.777−0.980 *−0.786−0.7890.953 *
LLWR−0.968 *0.5850.042−0.640−0.501−0.976−0.9370.9240.990 *0.425−0.967 *
LSF0.723−0.719−0.4610.3910.0750.8060.841−0.622−0.9180.0340.720
MSH−0.793−0.078−0.739−0.411−0.602−0.437−0.1960.171−0.5590.726−0.826
FBL−0.3460.448−0.176−0.500−0.384−0.268−0.355−0.441−0.8950.152−0.416
TBN0.7940.0690.7340.4200.6080.4440.206−0.1680.560−0.7220.828
PLWR−0.7790.662−0.008−0.985 *−0.897−0.871−0.8730.7750.7440.413−0.785
PL0.780.2260.7620.3090.5870.5720.390−0.85−0.497−0.966 *0.779
PW0.4980.5560.9410.0540.4540.2360.032−0.601−0.147−0.970 *0.496
SLWR−0.386−0.671−0.9450.123−0.291−0.1030.1050.4890.0410.912−0.384
SL0.2440.7710.969 *−0.2180.226−0.045−0.250−0.3560.112−0.8640.241
SW0.3220.7170.963 *−0.1570.2740.037−0.171−0.4310.031−0.8970.320
HPW0.3240.7180.957 *−0.1680.2600.037−0.170−0.4310.026−0.8920.322
HPSW0.3240.7180.958 *−0.1670.2610.037−0.170−0.4310.027−0.8930.321
HSW0.7320.2920.8090.2720.5790.5120.324−0.81−0.430−0.980 *0.731
SP0.2140.7940.957 *−0.2700.172−0.079−0.283−0.3240.135−0.8380.211
SPPW0.925−0.0760.5580.5450.7060.7890.646−0.967 *−0.713−0.8820.925
SPSW0.926−0.0780.5550.5430.7020.7900.648−0.968 *−0.716−0.880.926
LA, LL, LW, LLWR, LSF, MSH, FBL, TBN, PLWR, PL, PW, SLWR, SL, SW, HPW, HPSW, HSW, SP, SPPW and SPSW are the abbreviations of peanut traits. AT, MRH, TNR, TGR, TPAR, SAT (0–15 cm), SAT (15–30 cm), SWC (0–15 cm), SWC (15–30 cm), TP and MDT are the abbreviations of meteorological parameters. * represent significance at p < 0.05.
Disclaimer/Publisher’s Note: The statements, opinions and data contained in all publications are solely those of the individual author(s) and contributor(s) and not of MDPI and/or the editor(s). MDPI and/or the editor(s) disclaim responsibility for any injury to people or property resulting from any ideas, methods, instructions or products referred to in the content.

