Abstract
In arid zones, the yields of soft winter wheat varieties are particularly affected by the variations of hydrothermal conditions. This especially applies to direct seeding practices, for which the understanding of the links between hydrothermal parameters of soil and the environment, on one side, and the productivity of winter wheat, on the other, is one of the founding pillars of stable agricultural systems. On the case of the arid zone of Central Fore-Caucasus, this study investigates changes in the duration of interphase periods of plant development, plant density, and yield. It is found that in 2019–2021, positive temperature shifts and drought resulted in an increase in the duration of the growing season of crop varieties, thinned plant density, and reduced productivity of drought-resistant varieties. Evaluation of indices, that determine the ecological and genetic variability of varieties in the “genotype-environment” system resulted in the establishment of models that described the effect of drought on crop yields by type of manifestation and forecrops (sunflower, chickpeas). It is shown that the average linear deviations improved phase techniques and changed the area of winter wheat cultivation. On the back of the further drought propagation, farmers in arid zones could benefit from breeding new varieties and hybrids of grain crop. These measures may increase or stabilize the productivity of winter wheat in arid environments. Specifically, for the arid zone of Central Fore-Caucasus, the study recommends reducing lands under grain crop and shifting the cultivation of winter wheat northward. This will reduce the impact of volatile climatic conditions on winter wheat productivity in the region.
1. Introduction
Numerous studies on the relationship between hydrothermal parameters of soil and the environment and the productivity of crops show that droughts depress the genetic and physiological systems of winter wheat plants (in terms of accumulation and attraction of assimilates, the rate of ontogenesis phases, etc.) [1,2,3,4,5,6]. In arid environments, where the yields are particularly vulnerable to the slightest changes in climatic conditions, low humidity associated with high temperature deteriorates the productivity of winter wheat crops radically [7,8,9,10,11]. The degree of plant tolerance to drought varies during ontogenesis [12,13,14], but both varietal differences and temperature parameters equally affect the duration of the vegetation period [15,16,17,18,19,20]. Therefore, yield is determined not only by genes of quantitative traits, but also by the emergence of the “genotype-environment” system, which puts forward ontogenetic, population, and phytocenotic properties of high levels of organization [14,21]. Dragavtsev et al. [21] estimated the share of genetic variability in the components of productivity to stay at 10–20%, while the share of ecological variability may reach 80–90%. In this case, there is a change in the spectrum and the number of genes determining the component trait of productivity when the lim-factor of the external environment is manifested. Following Liebig [22], Fisher [23], and Dragavtsev [24], among others, this study defines lim-factors as environmental parameters that somehow limit growth of plants, temperature, and precipitation being the most decisive of them. The above factors result in the inhibition of plant development [25,26]. At the same time, tillering and ripening phases determine the final productivity [27,28], since the impact of drought during this period affects the number of grains in the head and the degree of grain shriveling. It is the variety of drought types, their duration and intensity, as well as the degree of plant response to drought (sensitivity) in the corresponding phases of ontogenesis that lead to a decrease in quantitative indicators, such as the duration of interphase periods of plant development or plant population [29].
High susceptibility of yields to the adverse environmental impacts is especially relevant for territories where, on the one hand, a significant population is concentrated, and, on the other hand, the land and climatic conditions do not allow ensuring the grain output required by the market [30]. Most importantly, the production of grain crops suffers from the period-to-period instability of yields. Such regions critically depend on food supplies from outside in the event of unfavorable climatic and hydrothermal conditions in a given year [31]. According to Liu et al. [32], the dependency problem is particularly acute for arid and semiarid areas, where crop yields can be hardly predicted. The common examples of climate change impact on crop yield are the rise in the average surface temperature [33,34,35], changes in frequency, timing, and duration of climatic events [36], and more intense and damaging climate-related hazards, such as peak water shortages [37], longer-lasting droughts [38], and extreme floods [39]. The vulnerability of crop yields to climate poses a substantial threat to the productivity of domestic agricultural enterprises [40,41,42], food security of the population [43,44], and the self-sufficiency of the economy [45,46,47]. Even in relatively favorable periods (in terms of climatic conditions), poor soils and low humidity do not allow to raise yields significantly to independently meet domestic demand for wheat and other grain crops. The examples of arid zones are North Africa, Central Asia, East Asia (Mongolia and Russia’s Far East), northwestern provinces of China, and Russia’s territories north of the Caucasus mountains [48,49].
The latter accumulate over 18 million people who inhibit steppe-type lands between the Black Sea and the Caspian Sea (see Section 2.1 for the overview of the region). About 1.12 million hectares (ha) are under crops, while arid lands occupy about 41% of the territory of Central Fore-Caucasus. Annual loss of gross grain output due to the arid climate and extreme climatic events, such as droughts, amounts to 10%. Therefore, cultivated drought-resistant breeding material manifests itself to the greatest extent by direct traits and productivity in the zone.
To moderate the damaging effects of droughts on crops in arid zones, various genetic and breeding methods and agronomic techniques have been developed, including, among others, direct seeding with superficial soil surface scarification [50], broadcast winter wheat seeding methods for timely seeding and improved labor distribution [16], seed-drills to supply small grain producers in semi-arid rain-fed areas with solutions to combat non-uniform seedling emergence [51], reduction of herbicide application during a transition period from conventional tillage to conservation tillage for soil and environment safety [52], the application of biochar to wheat fields under ridge-furrow rainwater harvesting [3,53], and various improvements to seeding and soil cultivation machinery that allow better preservation of soil moisture [1,19,32,54,55,56]. However, no specific genes for productivity, species immunity, and drought tolerance of plants have been isolated, localized, and sequenced so far. Some authors have tempted to investigate the perspectives of using no-till technologies and direct seeding practices to moderate the effects of climate-related parameters on yields [16,57,58,59,60,61]. Dridiger and Gadzhiumarov [62], Pismennaya et al. [20], Goryanin and Shcherbinina [63], Litvinova et al. [64], and Boktaev et al. [65] are among those few scholars who have tested the possibility and effectiveness of applying the direct seeding method in extremely arid zones in Russia’s South and the Volga region, as well as in the countries of Central and East Asia. Although Geleta et al. [14] acknowledged the seeding rate to be a critical factor in increasing grain yields, the general finding for extreme arid zones is that the decrease in the seeding rate is permissible, while the productivity of winter wheat is mainly determined by the volume of productive moisture in spring [64,66,67,68]. However, the dependence of yields on such variables as hydrothermal conditions during the peak periods (extreme droughts or extreme moisture), the duration of the interphase periods of plant development, or plant density has remained underexplored. The studies on the effects of hydrothermal parameters of soils and the environment on the productivity of winter wheat in specific conditions of Central Fore-Caucasus remain scarce and fragmented. While the investigations on the application of such widespread varieties as Triticum aestivum L. [69,70,71,72], Triticum aestivum Kosack [73], Triticum sphaerococcum [28], Triticum turgidum ssp. Durum [13,74], Kekeba [75], or Antonivka [76] in arid and semi-arid conditions have been rather abundant, the results on testing the performance of local winter wheat varieties in specific climate and soil conditions of Russia’s South have not been presented and discussed in the international literature. Consequently, this study aims to bridge the above gaps by revealing the influence of the hydrothermal coefficient on the parameters of ecological and genetic variability of three local winter wheat varieties (Zustrich, Bagrat, Bagira) cultivated by direct seeding method in the arid zone of Central Fore-Caucasus.
2. Materials and Methods
2.1. Territory
Central Fore-Caucasus includes the following territories: Stavropol (entire territory), Krasnodar and Adygeya (northeastern parts), Rostov (southwestern part), Karachaevo-Cherkessia, Kabardino-Balkaria, North Osetia-Alania, Ingushetia, Chechnya, and Dagestan (northern lowland areas) (Figure 1). It is a predominantly flat area to the north of the foothills of the Greater Caucasus, bounded by the Kuma-Manych Depression and the Salsk-Manych ridge on the north, the Sea of Azov on the west, and the Caspian Sea on the east.
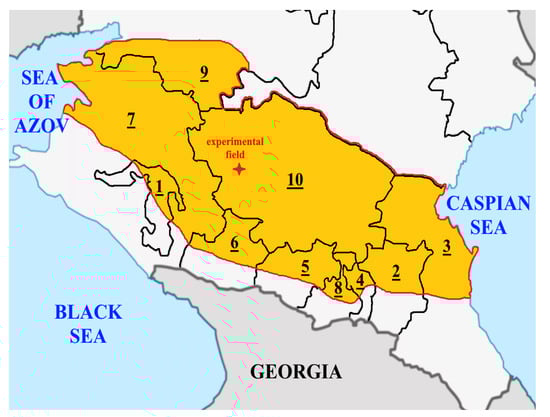
Figure 1.
Central Fore-Caucasus: arid zone and the experimental field. Note: 1 = Adygeya; 2 = Chechnya; 3 = Dagestan; 4 = Ingushetia; 5 = Kabardino-Balkaria; 6 = Karachaevo-Cherkessia; 7 = Krasnodar; 8 = North Osetia-Alania; 9 = Rostov; 10 = Stavropol. Source: authors’ development.
Central Fore-Caucasus is located at the crossroad of the humid air masses coming from the Mediterranean Sea and the Atlantic Ocean and the dry continental air masses coming from the inner Eurasia [77]. The region belongs to the Atlantic-continental steppe climatic zone with moderately continental semi-dry climate and unstable humidification. The snow cover of the most part of the territory is low and unstable. Average rainfall is 450–600 mm per year. Droughts are typical for the northeastern part of Stavropol, the eastern zone of the Tersko-Sunzhenskaya upland, and the Chechen plain. Dry winds in the eastern territories of the zone sharply reduce the atmospheric humidity. The resulting over-evaporation substantially exceeds precipitation. In most territories of the zone, the maximum precipitation occurs in June–July, while the end of summer is often dry. This leads to a significant loss of water for evaporation. Stormy rainfalls cause water loss by surface runoff.
Black soils are formed on loess-like loams and clays across Central Fore-Caucasus. Carbonate black soils are particularly widespread in the Kuban-Azov lowlands, the north-east of the Kuban plain, western and north-western slopes of the Stavropol upland, and the Chechen plain. The specific features of these soils are associated with climatic and hydrothermal regimes: after heavy rains (common in early summer), the soil becomes moist. In dry and hot July and August, soil moisture with carbonates dissolved in it rises to the surface. When it evaporates, carbonates are released in the humus horizon in the form of a thin carbonate vein. Dark chestnut and chestnut soils and saline soils in combination with steppe alkali soils dominate in the north-eastern territories of Stavropol. In the south, leached black soils have formed in high-humid areas. They are common in the Kuban plain and on high above-floodplain terraces in the Kuban Valley, the southwestern part of the Stavropol Upland, as well as the Kabardian, Ossetian, and Chechen plains.
2.2. Experimental Field
The study was carried out in 2018–2021 in a stationary multifactorial experiment to study drought-tolerant varieties of soft winter wheat (Zustrich, Bagrat, Bagira). The experimental field (500 m2) was located in the territory of Agrokhleboprodukt agricultural enterprise (arid zone of Stavropol territory). Major parameters of the experiment:
- meteorological parameters include temperature and precipitation (Figure 2), average linear deviations of precipitation and temperature, and coefficients of variation (oscillation) of precipitation and temperature (Figure 3):
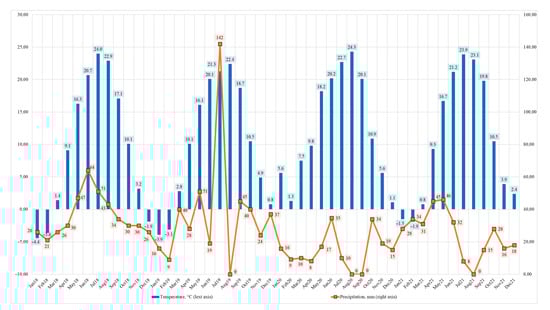 Figure 2. Meteorological parameters: temperature and precipitation. Source: authors’ development based on the Stavropol Center for Hydrometeorology and Environmental Monitoring [78].
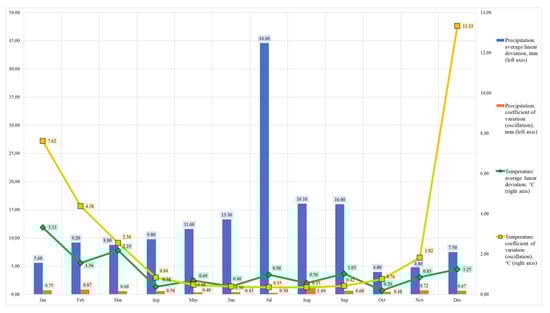 Figure 3. Meteorological parameters: average linear deviations and coefficients of variation. Source: authors’ development based on the Stavropol Center for Hydrometeorology and Environmental Monitoring [78].
 - seeding rate—5 million pcs/ha
- number of trials—three;
- soil type—mostly dark-chestnut soils;
- soil humus content—low (2.61–2.70%);
- content of labile compounds of phosphorus and potassium in soil—high (33.2–37.0 mg/kg and 364.5–420.3 mg/kg, respectively)
2.3. Methodological Framework
The hydrothermal coefficient (HTC) was used to reveal the moisture characteristics in the area. This measure has been widely applied as a principal quantitative indicator of the ratio of humidity and temperature in studying the relationships between the amount of precipitation in the time period, when average day temperature exceeds +10 °C, and the sum of temperature, in degrees in the same period [18,79]. Volkov et al. [80] and Pismennaya et al. [20] specifically demonstrated the employability of the coefficient in studying the influence of annual precipitation on the stability of winter wheat yields across arid and semiarid zones in Caucasus. HTC is calculated as follows (1):
where = sum of precipitation in millimeters for the period with temperatures higher than +10 °C; = sum of temperatures in degrees for the same period.
According to the classification developed by Cirkovs [81] and later adopted by Evarte-Bundere and Evarts-Bunders [82], humidity is sufficient when . If , humidity is considered to be insufficient. In the experiment, HTC value deviated from 0.5 to 0.7, which corresponds to the “very dry” level.
The influence of HTC on the duration of interphase period of plant development is described by the formula (2):
where = index of drought effect on duration of interphase period; = hydrothermal coefficient; = duration of the interphase period, days.
The coefficient value was divided on the plant density value to calculate the effect of HTC on plant density (3):
where = index of the effect of drought on plant density; = hydrothermal coefficient; = plant density, units/m2.
Winter wheat productivity was calculated as follows (4):
where = yield, c/ha; = linear deviation from yield, c/ha; = HTC; = average linear deviation from the average annual HTC; = duration of interphase periods of development of different winter wheat varieties, days; = average linear deviation of duration of interphase periods of different winter wheat varieties development, days; = winter wheat plant density, units/m2; = average linear deviation of winter wheat plant density, units/m2; = coefficient of harmfulness of drought.
The analysis-of-variance method (ANOVA) was used to carry out the mathematical processing of the data. As previously demonstrated by Salvati et al. [83], Kalivas and Kollias [84], Tao et al. [85], and Salan et al. [86], the ANOVA model produces reliable results for the spatial-temporal analysis of climate change effects on the productivity of crops.
3. Results
Trial 1 crop was sown on 21 September 2018 at a monthly average temperature of 17.1 °C [78] and HTC of 0.66. Before sowing of winter wheat, amosofos (N12P52) was applied at a dose of 100 kg/ha followed by early spring fertilization (with ammonium nitrate N35)—100 kg/ha and application of foliar fertilizer (UAN—N32)—100 kg/ha (see Table 1 for the scheme of phytosanitary treatment of crops).

Table 1.
Scheme of phytosanitary treatment by plant development phases of winter wheat.
Sprouts after all the forecrops appeared in late October, and by the end of October, tillering began. During this period, HTC was 0.99 (average monthly temperature—10.1 °C) [78]. Spring tillering of plants occurred at HTC = 0.92 (10.1 °C), and stem elongation and ear formation took place at HTC = 1.02 (16.1 °C) (Table 2).
Table 2.
Duration of interphase periods, days.
The duration of the growing season of winter wheat varies after sunflowers was 74–85 days. The development of all the varieties was homogeneous with the exception of spring tillering and earing phases (coefficient of variation equal to 0.43 and 0.94, respectively) in sunflowers. Bagrat variety demonstrated the shortest ontogenesis period (74 days). The vegetation period for chickpeas varieties lasted 69–80 days. The period of Bagrat variety development lasted 69 days (the shortest). There was a significant variability of indicators on the phases of plant development of all the varieties studied (seedlings—0.51; autumn tillering—0.51; spring tillering—0.94; stem elongation—0.45; earing—2.14). The coefficient of variation, i.e., the response of varieties to HTC, was homogeneous. The largest range (amplitude) of the period of plant development fell on the sprouting phase (average linear deviation for sunflowers and chickpeas—1.56) and stem elongation (1.11 and 1.33, respectively). The average linear deviation for all the varieties and forecrops amounted to 3.78.
In 2019 (Trial 2), winter wheat was sown on September 25 (HTC = 0.33; average monthly temperature = 18.7 °C) [78]. Sprouts after all the forecrops appeared in mid-October, and tillering began in early November (HTC = 1.26, average monthly temperature = 4.9 °C). Spring tillering occurred at HTC = 0.29 (9.8 °C), and stem elongation and ear formation occurred at HTC = 0.30 (18.2 °C). Compared to Trial 1, the growing season of winter wheat after sunflower varieties increased by nine days (9%) and amounted to 82–96 days. The highest coefficient of variation for all the varieties and forecrops was recorded in the earing phase—3.47 (for sunflowers) and 3.67 (for chickpeas). Ontogenesis period of Bagrat variety took 82 days. Vegetation duration for all the varieties grown after legume forecrop was 80–88 days. Development period of Bagrat variety was 80 days. Response of varieties to HTC was homogeneous only for sunflower. The greatest amplitude of the value of plant development duration fell on the sprouting phase of sunflowers (average linear deviation—2.00). The average linear deviation in the development of all the varieties after sunflowers was 4.89 (2.89 after chickpeas) (Table 3).
Table 3.
Duration of interphase periods, coefficients.
In September 2020, HTC value was close to zero. Sowing of winter wheat was shifted to 5 October (HTC = 1.00). Autumn tillering of plants was barely noted. Average monthly temperatures in November and December were 5.6 °C and 1.1 °C, respectively [78]. In December 2020, the sum of positive temperatures from 0 °C to 10 °C was on average 1.4 times higher than in 2018–2019, and the amount of precipitation was 1.15 times lower [78]. The vegetation of plants in spring progressed with HTC = 0.61. Stem elongation and ear formation occurred at HTC = 0.88 (average monthly temperature = 16.7).
In the spring-summer period 2021, there were signs of drought and drought stress. Only 17 mm of precipitation fell during the phase of stem elongation. Maximum temperature was 31 °C (29.05) and minimum temperature was 13 °C (23.05) [78]. Duration of vegetation period of winter wheat varieties after sunflowers increased to 103–109 days (95–101 days after chickpeas). On average, the period of plant development was longer by 22 days or 33% compared to 2019–2020.
The average linear deviation for sunflowers and chickpeas during the whole period of plant ontogenesis was 2.0 and 2.67, respectively, the largest in the sprouting phase (1.56 and 1.11, respectively). The coefficient of variation of winter wheat varieties was almost homogeneous (32% for sunflowers and 36% for chickpeas). At the same time, ecological and genetic variability of winter wheat varieties was manifested in all phases of plant development for both sunflowers and chickpeas. The development period of Bagrat variety for sunflowers was 103 days (or faster by 5.6% than Bagira variety and by 2.9% than Zustrich variety). For chickpeas, it amounted to 95 days, the same as for Zustrich variety. However, Zustrich variety showed the highest yield for sunflowers and chickpeas (4.23 tons/ha and 3.51 tons/ha, respectively).
The two-factor ANOVA analysis for two forecrops with 0.95% of significance in 2019–2021 demonstrated that for varieties, HTC, and relationship (Table 4). The p-value indicators reflected the significance of the regression coefficient for sunflowers and chickpeas, as well as revealed the interaction between factors. Therefore, the study concluded that the change in the duration of interphase periods of the selected crop varieties was caused by the change in the hydrothermal coefficient.
Table 4.
The two-factor ANOVA results in 2019–2021.
Agroclimatic pre-sowing period significantly influences the completeness and rate of sprout emergence. Hydrothermal index determines not only the duration of the sprout emergence, but also the completeness of the sprout emergence. In 2019, the average linear deviation of plant density of all the varieties with an average HTC of 0.85 by phase of development and forecrops was almost homogeneous (3.33 after sunflowers and 1.78 after chickpeas) (Table 5). The coefficient of variation also showed similarity (1.35 after sunflowers and 3.00 after chickpeas). According to the selection, there was a decrease by 5% to 8% for all the varieties after all the forecrops. The lowest ones were registered for Bagrat variety grown after sunflowers (12%) and Zustrich variety grown after chickpeas (5%).
Table 5.
Plant density of winter wheat, pcs/m2.
In 2020, the increase of linear deviation in plant density of all the varieties with the average annual was HTC = 0.33 after sunflowers in the phase of spring tillering (32.44) and after chickpeas in the phase of stem elongation (36.22) (Table 6).
Table 6.
Plant density of winter wheat, coefficients.
The oscillation coefficient showed heterogeneity for all the varieties and forecrops (34% after sunflowers and 41% after chickpeas). By varieties, the decrease in density was from 9% to 22% after all forecrops. The lowest ones were for Bagrat variety grown after sunflowers (17%) and Zustrich variety after chickpeas (20%).
In 2021, the linear deviation in plant density of all the varieties was 1.56 after sunflowers and 5.78 after chickpeas. Coefficient of variation showed heterogeneity for all the varieties and forecrops (1.98 after sunflowers and 2.44 after chickpeas). The decrease in density was from 15% to 34% for all the varieties grown after all the forecrops. The lowest one was for Zustrich variety after all the forecrops.
Having applied the two-factor ANOVA approach to studying the relationship between plant density and HTC, the authors found F to be higher than Fcritical for HTC and relationship (Table 4). However, for varieties, for both sunflowers and chickpeas. The p-value indicators reflected the significance of the regression coefficient for sunflowers and chickpeas, except for varieties (0.554 for sunflowers and 0.793 for chickpeas). There is also the explicit interaction between factors. That means that drought affects the change in the plant density (all considered varieties of winter wheat). Consequently, the study revealed the difference between the genetic and physiological systems of different varieties, which affected the final productivity of crops.
In 2019, the winter wheat yield of Zustrich variety was 4.08 tons/ha, 3.77 tons/ha for Bagira variety, and 4.36 tons/ha for Bagrat variety at an average annual HTC = 0.85.
The genetic and physiological system of winter wheat under the lim-factor stress in the “genotype-environment” system manifested itself differentiated with respect to the yield. The main growth of total biomass with the formation of the main elements of the yield structure and critical periods of moisture availability fell on the spring-summer part of the growing season. Unfavorable conditions exerted a stronger effect on the value of the yield. The later the spring came, the less time was left before the summer-autumn droughts, the probability of which is almost 90%, and the lower was the productivity of crops. In 2020, sunflower yields declined by 1.06 tons/ha on average. Chickpea yields declined by 1.17 tons/ha compared to 2019. In 2021, the decrease in sunflower yields was 0.72 tons/ha. Chickpea yields decreased by 0.82 tons/ha compared to 2019 (Table 7). The lowest indicators were registered for Bagrat variety grown after sunflowers and chickpeas (average yield 3.72 tons/ha and 4.12 tons/ha, respectively).
Table 7.
Effect of HTC on yield of winter wheat varieties, tons/ha.
The average linear deviation of yield (2019–2021) of different varieties grown after sunflowers was 0.20 and 0.20–0.36 after chickpeas. The experiment demonstrated the homogeneity of the oscillation coefficient indicator for all the forecrops (2.88 after sunflowers and 2.60 after chickpeas).
4. Discussion
As outlined above, the academic and practical narratives on the relationship between the hydrothermal conditions of soils and the environment and the productivity of winter wheat is abundant [15,54,56,87,88,89,90,91], but fragmented in terms of revealing the territory-specific effects [1,3,75,92]. This study’s findings contribute to bridging that gap by describing the impact of climate change on ecological and genetic indicators of growth and development of winter wheat cultivated in Central Fore-Caucasus.
Supporting the findings of Szczepanek et al. [28] and Hou et al. [93], who revealed a significant correlation of the grain yield with the amount of precipitation in tillering, the study concludes that drought affects the duration of interphase periods of winter wheat development mainly in the phases of spring tillering and earing (in 2019, HTC = 0.85) (Table 8). Earlier, Pismennaya et al. [20] found that at the tillering stage, the coefficient of variation showed no substantial heterogeneity of the phenological index for winter wheat. Conversely, this study demonstrates that the proximity of D index in different phases of plant development indicates homogeneity of phenotypic processes. For example, D index amounts to 0.05 for the sprouting phase after sunflowers and chickpeas. Differentiation of D index indicates the influence of aridity on the process of plant ontogenesis: the higher the index is, the more favorable hydrothermal conditions are.
Table 8.
Effect of HTC on the index of duration of interphase periods of winter wheat development (D), days (average for 2019–2021).
In the conditions of severe drought (average annual HTC = 0.33), the effect of drought on the duration of the interphase periods of winter wheat development was mainly recorded in the earing phase. To mitigate the adverse effect of low precipitation on yields, Dar et al. [31] recommends farmers in arid zones to seed wheat as early as the first fortnight of April. Sultana et al. [94] and Moghimi et al. [95] also suggests a possible altering of sowing date towards cooler months to cope with the effects of climate change in arid areas. Seeding after chickpeas could also level the drought’s effect to some extent. With excessive dryness of air, drought-resistant plants reacted in the same way in all phases of development and after all the forecrops (row crops and legumes). A slight increase in the average annual HTC (up to 0.43 in 2021) transforms the relationship between humidity and duration of interphase periods of plant development—the effect is observed in the sprouting phase (0.03 after sunflowers and 0.04 after chickpeas). This finding correlates with the results of the earlier studies of Dridiger and Gadzhiumarov [62] and Pismennaya et al. [20], who demonstrated that in extremely arid areas, precipitation in winter and during the growing season increases winter wheat yields significantly, especially after sunflower.
The above findings can be interpreted in a way that the optimal values of D index for arid areas are 0.05 in the sprouting phase, 0.05 in autumn tillering, 0.07 in spring tillering, 0.04 in stem elongation, and 0.10 in the earing phase. The latter stage is the most vulnerable among the others with an average annual HTC = 1.02 (±0.03), HTC = 0,88 (±0.02), and HTC = 0.30 (±0.01). As previously demonstrated by Pismennaya et al. [20], Liu et al. [96], Goryanin and Shcherbinina [63], and Huang et al. [68], at the earing phase, excessive air dryness leads to drought stress, which results in shriveling of grain. To protect plants in their sensitive phase of ontogenesis, the study recommends farmers to introduce a separate agro-technology stage. Some studies, including Gao et al. [97], Wang et al. [70], Zhang et al. [98], Bi et al. [99], and Duchene et al. [100], evidence that such a measure allows grain producers to reduce losses during the ontogenesis stage and increase the gross output of crops.
The plant density index fluctuated substantially (Table 9). The greatest differentiation of indices was observed in 2020 (0.0030–0.0009), while the lowest one was recorded in 2019 (0.002 in all phases of ontogenesis). During drought stresses due to the decrease in precipitation and reduced soil moisture, crops become less tolerant to drought and therefore less productive grown after all the forecrops.
Table 9.
Effect of HTC on winter wheat plant density index (PD), units/m2.
Cann et al. [71], Yan et al. [101], Qi et al. [102], and Moghimi et al. [95], among others, recognized drought to be the deciding factor of reducing winter wheat yields in arid and semiarid regions. This study particularly specifies harmful effects of declines in humidity during spring and summer periods: the longer they last, the lower the resulting productivity of crops. One-month (summer) drought decreases yields by 7.1% after chickpeas and 9.8% after sunflowers. Two-month (summer-autumn) drought decreases yields by 26.6% and 30.3%, respectively. Productivity models of winter wheat were established based on the types of drought and forecrop (Table 10).
Table 10.
Winter wheat productivity model depending on the type of drought and forecrop, tons/ha.
It is commonly accepted that abnormal drought effects pose a great threat to the stability of crop yields [30,80,103,104,105]. Many scholars, including Dar et al. [31], Demidov et al. [104], Fenni et al. [57], and Flower et al. [106] agree that without taking appropriate adaptation measures, both yields and areas under grain crops will continue decreasing due to the progressing climate change. A variety of agronomic and breeding adaptations, including the introduction of new varieties of winter wheat to arid zones, may allow farmers stabilize yields in volatile scenarios of climate change [30,48,71]. This study’s findings demonstrate that the improvement of phase technologies along with the application of new varieties and hybrids may secure the stability of winter wheat production and allow for increasing yields even in arid environments.
5. Conclusions
Studying the relationship between the hydrothermal coefficient and the parameters of ecological and genetic variability of drought tolerant varieties of soft winter wheat cultivated by direct seeding method in the arid zone of Central Fore-Caucasus resulted in the finding that the state of the genetic and physiological system of plants of different winter wheat varieties directly depends on hydrothermal conditions and the effectiveness of agronomic work, i.e., shifting the sowing dates depending on the hydrothermal coefficient (21 September 2018 at HTC = 0.66; 25 September 2019 at HTC = 0.33; 5 October 2020 at HTC = 1.00) and “phase” technologies.
Monitoring of ecological and genetic system of plants and recording lim-factor stress effects on the trait laid in one or another phase of ontogenesis resulted in the identification of the most stress-resistant variety. Thus, for Bagrat variety, the development time in both relatively favorable periods (2019 and 2021) after the sunflower and chickpea dry period (2020) was the shortest (74 days after sunflowers and 103 days after chickpeas in 2019; 82 days and 80 days in 2020, respectively; and 69 days and 95 days in 2021, respectively). In 2021, Zustrich variety performed the best in terms of the decrease of plant density after the two forecrops (16% after sunflowers and 8% after chickpeas). In 2020, Zustrich variety was slightly inferior to Bagrat variety by that parameter. In general, the yield of Bagrat variety was not significantly higher than that of Zustrich variety (5.6% after sunflowers and 4.3% after chickpeas). Bagira variety showed the poorest performance.
The calculation of D and PD indices contributed to the establishment of models that describe the effect of climate by type of drought and forecrop (row crop and legume) on winter wheat yields in arid conditions. The indices-based analysis resulted in determining the average linear deviations for the improvement of “phase” technologies and changes in the area of winter wheat cultivation. To stabilize yields and increase productivity of winter crops in arid areas, Bagrat and Zustrich varieties should be introduced. Areas under grain crops should be reconsidered to mitigate climate-related risks. In the case of Central Fore-Caucasus, production sites should move as far north as possible to reduce the adverse influence of the arid environment on the productivity of winter wheat.
Author Contributions
Conceptualization, A.E., V.S., E.P. and V.E.; methodology, A.E. and E.P.; software, A.O. and A.I.; validation, O.V., E.G. and V.E.; formal analysis, A.E., E.P. and A.I.; investigation, A.E., E.P., E.G., O.V., A.O. and A.I.; resources, A.E. and V.S.; data curation, A.E., E.P., E.G., O.V. and A.I.; writing—original draft preparation, A.E., E.P. and V.E.; writing—review and editing, V.E.; visualization, V.E., A.E. and E.P.; supervision, A.E., V.S. and E.P.; project administration, A.E., E.P., A.I. and V.E.; funding acquisition, V.E. All authors have read and agreed to the published version of the manuscript.
Funding
This research received no external funding.
Institutional Review Board Statement
Not applicable.
Data Availability Statement
The data presented in this study is available on request from the leading author.
Conflicts of Interest
The authors declare no conflict of interest.
References
- Beljaev, V.; Volnov, V.; Sokolova, L.; Kuznecov, V.; Matsyura, A. Effect of Sowing Techniques on the Agroecological Parameters of Cereal Crops. Ukr. J. Ecol. 2017, 7, 130–136. [Google Scholar] [CrossRef]
- Liu, X.; Wang, Y.; Yan, X.; Hou, H.; Liu, P.; Cai, T.; Zhang, P.; Jia, Z.; Ren, X.; Chen, X. Appropriate Ridge-Furrow Ratio Can Enhance Crop Production and Resource Use Efficiency by Improving Soil Moisture and Thermal Condition in a Semi-Arid Region. Agric. Water Manag. 2020, 240, 106289. [Google Scholar] [CrossRef]
- Ma, X.; Lv, M.; Huang, F.; Zhang, P.; Cai, T.; Jia, Z. Effects of Biochar Application on Soil Hydrothermal Environment, Carbon Emissions, and Crop Yield in Wheat Fields under Ridge-Furrow Rainwater Harvesting Planting Mode. Agriculture 2022, 12, 1704. [Google Scholar] [CrossRef]
- Chen, C.; Chen, H.Y.H.; Chen, X.; Huang, Z. Meta-Analysis Shows Positive Effects of Plant Diversity on Microbial Biomass and Respiration. Nat. Commun. 2019, 10, 1332. [Google Scholar] [CrossRef] [PubMed]
- Fernandez, A.; Sheaffer, C.; Wyse, D.; Staley, C.; Gould, T.; Sadowsky, M. Associations between Soil Bacterial Community Structure and Nutrient Cycling Functions in Long-Term Organic Farm Soils Following Cover Crop and Organic Fertilizer Amendment. Sci. Total Environ. 2016, 566–567, 949–959. [Google Scholar] [CrossRef] [PubMed]
- Kang, B.; Bowatte, S.; Hou, F. Soil Microbial Communities and Their Relationships to Soil Properties at Different Depths in an Alpine Meadow and Desert Grassland in the Qilian Mountain Range of China. J. Arid Environ. 2021, 184, 104316. [Google Scholar] [CrossRef]
- Manukyan, I.; Basieva, M.; Miroshnikova, E.; Abiyev, V. Evaluation of Adaptability of Winter Wheat Genotypes for Arid Conditions in the Foothill Zone of the Central Caucasus. Agrar. Bull. Ural. 2019, 184, 16–22. [Google Scholar]
- Likhovidova, V.; Gaze, V.; Ionova, E.; Marchenko, D. The Effect of Soil and Air Drought on the Development of Root System of Winter Soft Wheat Varieties and Lines. Grain Econ. Russ. 2018, 4, 39–42. [Google Scholar] [CrossRef]
- Dubinina, O. Winter Wheat Resistance to Main Stress Factors of Environment and Weather (Review). Grain Econ. Russ. 2017, 49, 23–26. [Google Scholar]
- Esaulko, A.; Pismennaya, E.; Azarova, M. Influence of the Pigment System of Plants of Various Winter Wheat Varieties on Their Productivity When Cultivated Using No-Till Technology. Zemledelie 2021, 3, 10–15. [Google Scholar] [CrossRef]
- Lyu, Y.; Shi, P.; Han, G.; Liu, L.; Guo, L.; Hu, X.; Zhang, G. Desertification Control Practices in China. Sustainability 2020, 12, 3258. [Google Scholar] [CrossRef]
- Udolskaya, N. Drought Resistance of Spring Wheat Varieties; Omgiz: Omsk, Russia, 1936. [Google Scholar]
- Kim, S.H.; Kim, J.Y.; Kim, D.Y.; Yoon, J.S.; Jung, W.J.; Yacoubi, I.; Seo, Y.W. Development of a SCAR Marker Associated with Salt Tolerance in Durum Wheat (Triticum turgidum ssp. durum) from a Semi-Arid Region. Genes Genom. 2016, 38, 939–948. [Google Scholar] [CrossRef]
- Geleta, B.; Atak, M.; Baenziger, P.S.; Nelson, L.A.; Baltenesperger, D.D.; Eskridge, K.M.; Shipman, M.J.; Shelton, D.R. Seeding Rate and Genotype Effect on Agronomic Performance and End-Use Quality of Winter Wheat. Crop. Sci. 2002, 42, 827–832. [Google Scholar]
- Synowiec, A.; Jop, B.; Domaradzki, K.; Podsiadlo, C.; Gaweda, D.; Waclawowicz, R.; Wenda-Piesik, A.; Nowakowski, M.; Bocianowski, J.; Marcinkowska, K.; et al. Environmental Factors Effects on Winter Wheat Competition with Herbicide-Resistant or Susceptible Silky Bentgrass (Apera spicaventi L.) in Poland. Agronomy 2021, 11, 871. [Google Scholar] [CrossRef]
- Collins, B.; Fowler, D. A Comparison of Broadcast and Drill Methods for No-Till Seeding Winter Wheat. Can. J. Plant Sci. 1992, 72, 1001–1008. [Google Scholar] [CrossRef]
- Shakoor, U.; Saboor, A.; Ali, I.; Mohsin, A. Impact of Climate Change on Agriculture: Empirical Evidence from Arid Region. Pak. J. Agric. Sci. 2011, 48, 327–333. [Google Scholar]
- Selyaninov, G. Wheat Climate Requirements. Bull. Appl. Bot. Genet. Plant Breed. 1960, 32, 183–198. [Google Scholar]
- Li, J.; Dong, W.; Oenema, O.; Chen, T.; Hu, C.; Yuan, H.; Zhao, L. Irrigation Reduces the Negative Effect of Global Warming on Winter Wheat Yield and Greenhouse Gas Intensity. Sci. Total Environ. 2019, 646, 290–299. [Google Scholar] [CrossRef]
- Pismennaya, E.; Azarova, M.; Belyaeva, A. The Influence of Weather and Climatic Conditions on the Phenological Indicators and Productivity of Winter Wheat Cultivated by Direct Seeding Technology in the Arid Zone of the Stavropol Territory. Agrar. Sci. J. 2021, 6, 21–26. [Google Scholar] [CrossRef]
- Dragavtsev, V.; Mikhailenko, I.; Proskuryakov, M. On How We Can Non-Canonically Increase Hereditary Drought Resistance in Plants (by an Example of Cereals). Agric. Biol. 2017, 52, 487–500. [Google Scholar] [CrossRef]
- Liebig, J. Chemistry and Its Application to Agriculture and Physiology; T. B. Peterson: Philadelphia, PA, USA, 1847. [Google Scholar]
- Fisher, R. The Design of Experiments; Hafner Press: New York, NY, USA, 1971. [Google Scholar]
- Dragavtsev, V. How to Aid on Sating the Humanity. Biosfera 2013, 5, 279–290. [Google Scholar]
- Dragavtsev, V.; Dragavtseva, I.; Efimova, I.; Kuznetsova, A.; Morenets, A. To the Experimental Confirmation of the Hypothesis about an Eco-Genetic Nature of the Phenomenon Genotype—Environment Interaction for Woody Plants. Agric. Biol. 2018, 53, 151–156. [Google Scholar] [CrossRef]
- Dragavtsev, V.; Dragavtseva, I.; Efimova, I.; Morenets, A.; Savin, I. Management by Genotype-Environment Interaction—Most Important Lever for Increase of Cultivated Plants Yields. Proc. Kuban State Agrar. Univ. 2016, 59, 105–121. [Google Scholar]
- Tian, J.; Li, S.; Xing, Z.; Cheng, S.; Guo, B.; Hu, Y.; Wei, H.; Gao, H.; Liao, P.; Wei, H.; et al. Differences in Rice Yield and Biomass Accumulation Dynamics for Different Direct Seeding Methods after Wheat Straw Return. Food Energy Secur. 2022, 11, e425. [Google Scholar] [CrossRef]
- Szczepanek, M.; Lemanczyk, G.; Nowak, R.; Graczyk, R. Response of Indian Dwarf Wheat and Persian Wheat to Sowing Density and Hydrothermal Conditions of the Growing Seasons. Agriculture 2022, 12, 205. [Google Scholar] [CrossRef]
- Sabinin, D. Physiology of Plant Development; Publishing House of the USSR Academy of Sciences: Moscow, Russia, 1963. [Google Scholar]
- Hussain, J.; Khaliq, T.; Rahman, M.; Ullah, A.; Ahmed, I.; Srivastava, A.; Gaiser, T.; Ahmad, A. Effect of Temperature on Sowing Dates of Wheat under Arid and Semi-Arid Climatic Regions and Impact Quantification of Climate Change through Mechanistic Modeling with Evidence from Field. Atmosphere 2021, 12, 927. [Google Scholar] [CrossRef]
- Dar, S.; Norphel, C.; Akhoon, M.; Zargar, K.; Ahmed, N.; Yabgo, M.; Dar, K.; Hussain, N.; Thomas, T.; Singh, M.; et al. Man’s Artificial Glacier—A Way Forward Toward Water Harvesting for Pre and Post Sowing Irrigation to Facilitate Early Sowing of Wheat in Cold Arid Himalayan Deserts of Ladakh. Renew. Agric. Food Syst. 2019, 34, 363–372. [Google Scholar] [CrossRef]
- Liu, Z.; Xu, Z.; Bi, R.; Wang, C.; He, P.; Jing, Y.; Yang, W. Estimation of Winter Wheat Yield in Arid and Semiarid Regions Based on Assimilated Multi-Source Sentinel Data and the CERES-Wheat Model. Sensors 2021, 21, 1247. [Google Scholar] [CrossRef]
- Holst, R.; Yu, X.; Grun, C. Climate Change, Risk and Grain Yields in China. J. Integr. Agric. 2013, 12, 1279–1291. [Google Scholar] [CrossRef]
- Tao, F.; Zhang, Z.; Xiao, D.; Zhang, S.; Rotter, R.; Shi, W.; Liu, Y.; Wang, M.; Liu, F.; Zhang, H. Responses of Wheat Growth and Yield to Climate Change in Different Climate Zones of China, 1981–2009. Agric. For. Meteorol. 2014, 189–190, 91–104. [Google Scholar] [CrossRef]
- Tatsumi, K.; Yamashiki, Y.; Valmir da Silva, R.; Takara, K.; Matsuoka, Y.; Takahashi, K.; Maruyama, K.; Kawahara, N. Estimation of Potential Changes in Cereals Production under Climate Change Scenarios. Hydrol. Process. 2011, 25, 2715–2725. [Google Scholar] [CrossRef]
- Arunrat, N.; Sereenonchai, S.; Chaowiwat, W.; Wang, C. Climate Change Impact on Major Crop Yield and Water Footprint under CMIP6 Climate Projections in Repeated Drought and Flood Areas in Thailand. Sci. Total Environ. 2022, 807, 150741. [Google Scholar] [CrossRef] [PubMed]
- Blanc, E.; Caron, J.; Fant, C.; Monier, E. Is Current Irrigation Sustainable in the United States? An Integrated Assessment of Climate Change Impact on Water Resources and Irrigated Crop Yields. Earth Future 2017, 5, 877–892. [Google Scholar] [CrossRef]
- Adhikari, U.; Nejadhashemi, A.P.; Woznicki, S. Climate Change and Eastern Africa: A Review of Impact on Major Crops. Food Energy Secur. 2015, 4, 110–132. [Google Scholar] [CrossRef]
- Kure, S.; Tebakari, T. Hydrological impact of regional climate change in the Chao Phraya River Basin, Thailand. Hydrol. Res. Lett. 2012, 6, 53–58. [Google Scholar] [CrossRef]
- Panait, M.; Erokhin, V.; Andrei, J.V.; Gao, T. Implication of TNCs in Agri-Food Sector—Challenges, Constraints and Limits—Profit or CSR? Strateg. Manag. 2020, 20, 33–43. [Google Scholar] [CrossRef]
- Constantin, M.; Radulescu, I.D.; Andrei, J.V.; Chivu, L.; Erokhin, V.; Gao, T. A Perspective on Agricultural Labor Productivity and Greenhouse Gas Emissions in Context of the Common Agricultural Policy Exigencies. Econ. Agric. 2021, 68, 53–67. [Google Scholar] [CrossRef]
- Zhao, Z.; He, J.; Geisen, S.; Han, L.; Wang, J.; Shen, J.; Wei, W.; Fang, Y.; Li, P.; Zhang, L. Protist Communities Are More Sensitive to Nitrogen Fertilization than Other Microorganisms in Diverse Agricultural Soils. Microbiome 2019, 7, 33. [Google Scholar] [CrossRef]
- Erokhin, V. Approaches to Sustainable Rural Development in a Predominantly Non-Rural Region. Econ. Agric. 2014, 61, 291–306. [Google Scholar] [CrossRef]
- Sikandar, F.; Erokhin, V.; Shu, W.H.; Rehman, S.; Ivolga, A. The Impact of Foreign Capital Inflows on Agriculture Development and Poverty Reduction: Panel Data Analysis for Developing Countries. Sustainability 2021, 13, 3242. [Google Scholar] [CrossRef]
- Erokhin, V. Contemporary Reshaping of Eurasian Integration: Russia’s Policies and their Implication for the EU and EurAsEC. Procedia Econ. Financ. 2015, 22, 402–411. [Google Scholar] [CrossRef]
- Erokhin, V. Factors Influencing Food Markets in Developing Countries: An Approach to Assess Sustainability of the Food Supply in Russia. Sustainability 2017, 9, 1313. [Google Scholar] [CrossRef]
- Erokhin, V. Self-Sufficiency versus Security: How Trade Protectionism Challenges the Sustainability of the Food Supply in Russia. Sustainability 2017, 9, 1939. [Google Scholar] [CrossRef]
- Hussain, J.; Khaliq, T.; Ahmad, A.; Akhter, J.; Asseng, S. Wheat Responses to Climate Change and Its Adaptations: A Focus on Arid and Semi-arid Environment. Int. J. Environ. Res. 2018, 12, 117–126. [Google Scholar] [CrossRef]
- Erokhin, V.; Gao, T. Competitive Advantages of China’s Agricultural Exports in the Outward-Looking Belt and Road Initiative. In China’s Belt and Road Initiative: Changing the Rules of Globalization; Zhang, W., Alon, I., Lattemann, C., Eds.; Palgrave Macmillan: Cham, Switzerland, 2018; pp. 265–285. [Google Scholar] [CrossRef]
- Louhaichi, M.; Clifton, K.; Hassan, S. Direct Seeding of Salsola Vermiculata for Rehabilitation of Degraded Arid and Semi-Arid Rangelands. Range Manag. Agrofor. 2014, 35, 182–187. [Google Scholar]
- Strauss, J.; Truter, K.; Swanepoel, P. The Influence of Seed-Drill Choice on Crop Performance in a Semi-Arid Production Region of South Africa. South Afr. J. Plant Soil 2022, 39, 85–93. [Google Scholar] [CrossRef]
- Labad, R.; Hartani, T.; Shinde, G.U. Optimum Herbicide Dose Management in Direct Seeding for Cereals Production: Case of Semi-arid Area of Algeria. J. Agron. 2018, 17, 99–105. [Google Scholar] [CrossRef][Green Version]
- Yan, Q.; Dong, F.; Li, J.; Duan, Z.; Yang, F.; Li, X.; Lu, J.; Li, F. Effects of Maize Straw-Derived Biochar Application on Soil Temperature, Water Conditions and Growth of Winter Wheat. Eur. J. Soil Sci. 2019, 70, 1280–1289. [Google Scholar] [CrossRef]
- Pramanik, P.; Chakrabarti, B.; Bhatia, A.; Singh, S.; Maity, A.; Aggarwal, P.; Krishnan, P. Effect of Elevated Temperature on Soil Hydrothermal Regimes and Growth of Wheat Crop. Environ. Monit. Assess. 2018, 190, 217. [Google Scholar] [CrossRef]
- Eissa, M.; Rekaby, S.; Hegab, S.; Ragheb, H. Effect of Deficit Irrigation on Drip-Irrigated Wheat Grown in Semi-Arid Conditions of Upper Egypt. J. Plant Nutr. 2018, 41, 1576–1586. [Google Scholar] [CrossRef]
- Al-Habsi, R.; Al-Mulla, Y.A.; Charabi, Y.; Al-Busaidi, H.; Al-Belushi, M. Validation and Integration of Wheat Seed Emergence Prediction Model with GIS and Numerical Weather Prediction Models. In Geographical Information Systems Theory, Applications and Management; Grueau, C., Gustavo Rocha, J., Eds.; Springer: Cham, Switzerland, 2016; pp. 90–103. [Google Scholar] [CrossRef]
- Fenni, M.; Nadjem, K.; Mekhlouf, A. Carbon Sequestration by Direct Seeding of Wheat in Setif High Plains (North East of Algeria). In Progress in Clean Energy; Dincer, I., Colpan, C., Kizilkan, O., Ezan, M., Eds.; Springer: Cham, Switzerland, 2015; pp. 615–621. [Google Scholar] [CrossRef]
- Sun, Z.; Sun, C.; Chen, Y.; Li, J.; Zhang, H. Efficient Water-Saving Irrigation Solution for Direct Seeding Rice under No-Tillage after Cultivating Wheat. In Information Technology and Agricultural Engineering. Advances in Intelligent and Soft Computing; Zhu, E., Sambath, S., Eds.; Springer: Berlin/Heidelberg, Germany, 2012; pp. 819–826. [Google Scholar] [CrossRef]
- Yalcin, H.; Cakir, E.; Aykas, E. Tillage Parameters and Economic Analysis of Direct Seeding, Minimum and Conventional Tillage in Wheat. J. Agron. 2005, 4, 329–332. [Google Scholar] [CrossRef][Green Version]
- De Souza, D. Forest Restoration by Direct Seeding: A Global Bibliometric Analysis. Restor. Ecol. 2022, 30, e13631. [Google Scholar] [CrossRef]
- Marakoglu, T.; Carman, K. Wheat Production Using Direct Seeding, Reduced Tillage and Conventional Tillage in Middle Anatolia. Bulg. J. Agric. Sci. 2012, 18, 789–793. [Google Scholar]
- Dridiger, V.; Gadzhiumarov, R. Cultivation of Agricultural Crops Using Direct Seeding Technology in the Extremely Arid Zone of the Stavropol Territory. Agrar. Bull. Ural. 2020, 200, 9–16. [Google Scholar] [CrossRef]
- Goryanin, O.; Shcherbinina, E. Features of the Formation of Spring Wheat Grain Yield in the Volga Region. Agrar. Sci. J. 2021, 8, 19–22. [Google Scholar] [CrossRef]
- Litvinova, V.; Bopp, V.; Kurachenko, N.; Shmeleva, Z. The Efficiency of the Spring Wheat Production Process Depending on the Seeding Rate in the Arid Zone of Mongolia. IOP Conf. Ser. Earth Environ. Sci. 2020, 421, 082017. [Google Scholar] [CrossRef]
- Boktaev, M.; Goldvarg, B.; Filobok, V. The Effect of Growing Conditions on Productivity, Grain and Flour Quality of the New Winter Bread Wheat Varieties for the Republic of Kalmykia. Grain Econ. Russ. 2022, 3, 64–68. [Google Scholar] [CrossRef]
- Othmani, A.; Ayed, S.; Rezgui, M.; Melki, M.; da Silva, J.A.T. Water Regimes and Seeding Rates Influence Grain Yield and Water Use Efficiency of Three Durum Wheat Varieties. Asian J. Res. Biosci. 2020, 2, 30–39. [Google Scholar]
- Zhao, J.; Khan, S.; Anwar, S.; Mo, F.; Min, S.; Yu, S.; Dong, S.; Ren, A.; Lin, W.; Yang, Z.; et al. Plastic Film-Mulching with Appropriate Seeding Rate Enhances Yield and Water Use Efficiency of Dryland Winter Wheat in Loess Plateau, China. Appl. Ecol. Environ. Res. 2020, 18, 1107–1127. [Google Scholar] [CrossRef]
- Huang, F.; Liu, Z.; Zhang, P.; Jia, Z. Hydrothermal Effects on Maize Productivity with Different Planting Patterns in a Rainfed Farmland Area. Soil Tillage Res. 2021, 205, 104794. [Google Scholar] [CrossRef]
- McKenzie, R.; Middleton, A.; Zhang, M. Optimal Time and Placement of Nitrogen Fertilizer with Direct and Conventionally Seeded Winter Wheat. Can. J. Soil Sci. 2001, 81, 613–621. [Google Scholar] [CrossRef]
- Wang, H.; Cutforth, H.; McCaig, T.; McLeod, G.; Brandt, K.; Lemke, R.; Goddard, T.; Sprout, C. Predicting the Time to 50% Seedling Emergence in Wheat Using a Beta Model. NJAS–Wagening. J. Life Sci. 2009, 57, 65–71. [Google Scholar] [CrossRef]
- Cann, D.; Schillinger, W.; Hunt, J.; Porker, K.; Harris, F. Agroecological Advantages of Early-Sown Winter Wheat in Semi-Arid Environments: A Comparative Case Study from Southern Australia and Pacific Northwest United States. Front. Plant Sci. 2020, 11, 568. [Google Scholar] [CrossRef]
- Ullah, R.; Lone, M.; Ullah, K.; Mehdi, S.; Qazi, M. Effect of Cropping System and Seasonal Variation on Soil Microbial Biomass and Enzymatic Activities in Arid Soils. J. Anim. Plant Sci. 2013, 23, 493–499. [Google Scholar]
- Bergman, E.; Fredlund, K.; Reinikainen, P.; Sandberg, A. Development of Predictive Models for Optimization of Phytate Degradation in Wheat and Rye During Hydrothermal Processing. Cereal Chem. 2001, 78, 144–150. [Google Scholar] [CrossRef]
- Ereifej, K.; Al-Karaki, G.; Hammouri, M. Variability of Some Physico-Chemical Characteristics of Wheat Cultivars Grown under Arid and Semiarid Mediterranean Conditions. Int. J. Food Prop. 2001, 4, 91–101. [Google Scholar] [CrossRef]
- Gebeyehu, B. Response of Bread Wheat (Triticum Aestivum L.) to Seeding Rate and Fertilizer Types on Yield and Yield Components. J. Agron. Res. 2021, 3, 38–47. [Google Scholar]
- Markovska, O.; Dudchenko, V.; Grechishkina, T.; Stetsenko, I. Prevalence and Harmfulness of Winter Wheat Brown Leaf Rust (Puccinia recondita Rob. ex desm. f. sp. tritici) in the Southern Steppe of Ukraine. Ukr. J. Ecol. 2020, 10, 69–74. [Google Scholar] [CrossRef]
- Zhuchenko, A.; Trukhachev, V. Agricultural Systems of Stavropol Region; AGRUS: Stavropol, Russia, 2011. [Google Scholar]
- Stavropol Center for Hydrometeorology and Environmental Monitoring. Available online: http://stavpogoda.ru/ (accessed on 13 December 2022).
- Voropay, N.; Ryazanova, A. A Comparative Assessment of the Aridity Indices for Analysis of the Hydrothermal Conditions. IOP Conf. Ser. Earth Environ. Sci. 2018, 190, 012041. [Google Scholar] [CrossRef]
- Volkov, S.; Savinova, S.; Cherkashina, E.; Shapovalov, D.; Bratkov, V.; Klyushin, P. Assessment of Current Climate Conditions Changes in the Territory of Ciscaucasia for the Purposes of Forecasting Winter Wheat Yield. South Russ.–Ecol. Dev. 2021, 16, 117–127. [Google Scholar] [CrossRef]
- Cirkovs, J. Fundamentals of Agricultural Metrology; Zvaigzne: Riga, Latvia, 1978. [Google Scholar]
- Evarte-Bundere, G.; Evarts-Bunders, P. Using of the Hydrothermal Coefficient (HTC) for Interpretation of Distribution of Non-Native Tree Species in Latvia on Example of Cultivated Species of Genus Tilia. Acta Biol. Univ. Daugavp. 2012, 12, 135–148. [Google Scholar]
- Salvati, L.; Zambon, I.; Pignatti, G.; Colantoni, A.; Cividino, S.; Perini, L.; Pontuale, G.; Cecchini, M. A Time-Series Analysis of Climate Variability in Urban and Agricultural Sites (Rome, Italy). Agriculture 2019, 9, 103. [Google Scholar] [CrossRef]
- Kalivas, D.; Kollias, V. Effects of Soil, Climate and Cultivation Techniques on Cotton Yield in Central Greece, Using Different Statistical Methods. Agron. EDP Sci. 2001, 21, 73–89. [Google Scholar] [CrossRef][Green Version]
- Tao, F.; Rotter, R.; Palosuo, T.; Diaz-Ambrona, C.G.H.; Minguez, I.; Semenov, M.; Kersebaum, K.C.; Nendel, C.; Specka, X.; Hoffmann, H.; et al. Contribution of Crop Model Structure, Parameters and Climate Projections to Uncertainty in Climate Change Impact Assessments. Glob. Change Biol. 2018, 24, 1291–1307. [Google Scholar] [CrossRef]
- Salan, M.S.A.; Hossain, M.M.; Sumon, I.H.; Rahman, M.M.; Kabir, M.A.; Majumder, A.K. Measuring the Impact of Climate Change on Potato Production in Bangladesh Using Bayesian Hierarchical Spatial-Temporal Modeling. PLoS ONE 2022, 17, e0277933. [Google Scholar] [CrossRef]
- Feng, T.; Xi, Y.; Zhu, Y.; Chai, N.; Zhang, X.; Jin, Y.; Turner, N.; Li, F. Reduced Vegetative Growth Increases Grain Yield in Spring Wheat Genotypes in the Dryland Farming Region of North-West China. Agronomy 2021, 11, 663. [Google Scholar] [CrossRef]
- Singh, S.; Sharma, S.; Prasad, R. The Effect of Seeding and Tillage Methods on Productivity of Rice-Wheat Cropping System. Soil Tillage Res. 2001, 61, 125–131. [Google Scholar] [CrossRef]
- Rinaldi, M.; Di Paolo, E.; Richter, G.; Payne, R. Modelling the Effect of Soil Moisture on Germination and Emergence of Wheat and Sugar Beet with the Minimum Number of Parameters. Ann. Appl. Biol. 2005, 147, 69–80. [Google Scholar] [CrossRef]
- Bullied, J.; Flerchinger, G.; Bullock, P.; Van Acker, R. Process-Based Modeling of Temperature and Water Profiles in the Seedling Recruitment Zone: Part I. Model Validation. Agric. For. Meteorol. 2014, 188, 89–103. [Google Scholar] [CrossRef]
- Hafez, M.; Mohamed, A.; Rashad, M.; Popov, A. The Efficiency of Application of Bacterial and Humic Preparations to Enhance of Wheat (Triticum aestivum L.) Plant Productivity in the Arid Regions of Egypt. Biotechnol. Rep. 2021, 29, e00584. [Google Scholar] [CrossRef]
- Gu, X.; Cai, H.; Fang, H.; Chen, P.; Li, Y.; Li, Y. Soil Hydro-Thermal Characteristics, Maize Yield and Water Use Efficiency as Affected by Different Biodegradable Film Mulching Patterns in a Rain-Fed Semi-Arid Area of China. Agric. Water Manag. 2021, 245, 106560. [Google Scholar] [CrossRef]
- Hou, H.; Zhang, X.; Yin, J.; Fang, Y.; Yu, X.; Wang, H.; Ma, Y. Effects of Soil-Plastic Mulching on Water Consumption Characteristics and Grain Yield of Spring Wheat in a Semi-Arid Area. Irrig. Drain. 2020, 69, 914–927. [Google Scholar] [CrossRef]
- Sultana, H.; Ali, N.; Iqbal, M.; Khan, A. Vulnerability and Adaptability of Wheat Production in Different Climatic Zones of Pakistan under Climate Change Scenarios. Clim. Change 2009, 94, 123–142. [Google Scholar] [CrossRef]
- Moghimi, M.; Shabani, A.; Zarei, A. Effect of Different Timescales of Drought on Water Productivity of Rain-Fed Winter Wheat in Arid and Semi-Arid Regions. J. Water Clim. Change 2021, 12, 3200–3223. [Google Scholar] [CrossRef]
- Liu, X.; Wang, Y.; Zhang, Y.; Ren, X.; Chen, X. Can Rainwater Harvesting Replace Conventional Irrigation for Winter Wheat Production in Dry Semi-Humid Areas in China? Agric. Water Manag. 2022, 272, 107852. [Google Scholar] [CrossRef]
- Gao, T.; Erokhin, V.; Arskiy, A. Dynamic Optimization of Fuel and Logistics Costs as a Tool in Pursuing Economic Sustainability of a Farm. Sustainability 2019, 11, 5463. [Google Scholar] [CrossRef]
- Zhang, T.; Wang, L.; Liu, W.; Rihu, S.; Li, J.; Zhang, D. Forage Mixed Planting Can Effectively Improve Soil Enzyme Activity and Microbial Community Structure and Diversity in Agro-Pastoral Interlacing Arid Zone. Can. J. Soil Sci. 2022, 102, 697–706. [Google Scholar] [CrossRef]
- Bi, Y.; Zhou, P.; Li, S.; Wei, Y.; Xiong, X.; Shi, Y.; Liu, N.; Zhang, Y. Interspecific Interactions Contribute to Higher Forage Yield and Are Affected by Phosphorus Application in a Fully-Mixed Perennial Legume and Grass Intercropping System. Field Crops Res. 2019, 244, 107636. [Google Scholar] [CrossRef]
- Duchene, O.; Vian, J.-F.; Celette, F. Intercropping with Legume for Agroecological Cropping Systems: Complementarity and Facilitation Processes and the Importance of Soil Microorganisms. A Review. Agric. Ecosyst. Environ. 2017, 240, 148–161. [Google Scholar] [CrossRef]
- Yan, J.; Zhang, N.; Wang, X.; Zhang, S. Selection of Yield-Related Traits for Wheat Breeding in Semi-Arid Region. Int. J. Agric. Biol. 2018, 20, 569–574. [Google Scholar] [CrossRef]
- Qi, Z.; Zhang, T.; Zhou, L.; Feng, H.; Zhao, Y.; Si, B. Combined Effects of Mulch and Tillage on Soil Hydrothermal Conditions under Drip Irrigation in Hetao Irrigation District, China. Water 2016, 8, 504. [Google Scholar] [CrossRef]
- Zeng, H.; Wu, B.; Zhang, M.; Zhang, N.; Elnashar, A.; Zhu, L.; Zhu, W.; Wu, F.; Yan, N.; Liu, W. Dryland Ecosystem Dynamic Change and Its Drivers in Mediterranean Region. Curr. Opin. Environ. Sustain. 2021, 48, 59–67. [Google Scholar] [CrossRef]
- Demidov, A.; Vakhnyi, S.; Siroshtan, A.; Khakhula, V.; Gudzenko, V. Yield of Monocrop Winter Wheat Sowing. Biosci. Res. 2019, 15, 1638–1644. [Google Scholar]
- Panasiewicz, M.; Grochowicz, J.; Sobczak, P. Influence of Hydrothermal Processes on Selected Physical Properties of Oat Grain. J. Food Eng. 2009, 90, 81–89. [Google Scholar] [CrossRef]
- Flower, K.; Ward, P.; Micin, S.; Cordingley, N. Crop Rotation Can Be Used to Manipulate Residue Levels under No-Tillage in a Rainfed Mediterranean-Type Environment. Soil Tillage Res. 2021, 212, 105062. [Google Scholar] [CrossRef]


Disclaimer/Publisher’s Note: The statements, opinions and data contained in all publications are solely those of the individual author(s) and contributor(s) and not of MDPI and/or the editor(s). MDPI and/or the editor(s) disclaim responsibility for any injury to people or property resulting from any ideas, methods, instructions or products referred to in the content. |
© 2022 by the authors. Licensee MDPI, Basel, Switzerland. This article is an open access article distributed under the terms and conditions of the Creative Commons Attribution (CC BY) license (https://creativecommons.org/licenses/by/4.0/).