Article

A Cucumber Photosynthetic Rate Prediction Model in Whole Growth Period with Time Parameters

1
College of Mechanical and Electronic Engineering, Northwest A&F University, Yangling 712100, China
2
Key Laboratory of Agricultural Internet of Things, Ministry of Agriculture and Rural Affairs, Yangling 712100, China
3
National Engineering Research Center for Information Technology in Agriculture, Beijing 100097, China
*
Authors to whom correspondence should be addressed.
Agriculture 2023, 13(1), 204; https://doi.org/10.3390/agriculture13010204
Submission received: 26 November 2022 / Revised: 4 January 2023 / Accepted: 9 January 2023 / Published: 13 January 2023
(This article belongs to the Section Digital Agriculture)

Abstract

:
Photosynthetic rate prediction models can provide guidance for crop photosynthetic process optimization, which has been widely used in the precise regulation of the protected environment. The photosynthetic capacity of crops continuously changes during their whole growth process. Previous studies on photosynthetic models mainly consider the interaction between a crop’s photosynthetic rate and its outer environmental conditions and have been able to predict a crop’s photosynthetic rate in a certain growth period. However, photosynthetic rate prediction models for whole growth periods have not been proposed yet. To solve this question, this paper introduces growing time into a variable set and proposes a method for building a cucumber photosynthetic rate prediction model of whole growth periods. First, the photosynthetic rate of cucumber leaves under different environmental conditions (light, temperature, and CO2 concentration) during the whole growth period was obtained through a multi-gradient nested test. With the environmental data and the cultivation time as the inputs, a photosynthetic rate prediction model was built using the Support Vector Regression algorithm. In order to obtain better modeling results, multiple kernel functions were used for pretraining, and the parameters of the Support Vector Regression algorithm were optimized based on multiple population genetic algorithms. Compared with a Back Propagation neural network and Non-linear Regression method, the Support Vector Regression model optimized had the highest accuracy, with the coefficient of determination of the test set was 0.998, and the average absolute error was 0.280 μmol·m−2·s−1, which provides a theoretical solution for the prediction of the cucumber photosynthetic rate during the whole growth period.

1. Introduction

Protected agriculture is a modern agricultural operation which provides the most suitable environment and conditions for crop growth, thereby obtaining high-quality and high-yield agricultural products [1]. Compared with traditional agriculture, protected agriculture has the advantages of a high level of automation and production without seasonal restrictions [2]. It has gradually developed into a pillar industry of China’s agricultural economy [3]. Photosynthesis is an important chemical reaction for crops undergoing metabolism and organic matter accumulation, and its rate directly reflects the growth status of the crop [4], which in turn affects yield and quality. In recent years, in order to meet the needs of crop photosynthesis in protected environments, crop growth models have been constructed, and on this basis, greenhouse environments have been precisely controlled. It has become a hot issue in the field of facility agriculture research. The precise control of greenhouse environment has become a hotspot in the field of protected agriculture research [5,6,7].
Plant photosynthesis is affected by multiple external environmental conditions [8]. Among them, light irradiance, carbon dioxide (CO2) concentration, and temperature are three environmental factors that significantly affect plants’ photosynthetic rate [9]. However, the photosynthetic rate of plants is not only affected by environmental factors. The physiological conditions such as leaf structure and chlorophyll content have a continuous change with the development process [10,11], and the photosynthetic rate in different growth periods is greatly different [12]. Studies have shown that the growth rate of cucumber varies significantly with growing time [13]. The growth rate of fruit cucumber leaves in glasshouses was fast at first and then became slow, and the early stage was the relatively rapid growth stage of the leaves [14]. The growth rate during the initial flowering stage and the initial fruiting stage was about three times that of the harvesting stage [15]. This study explores the relationship between growing factors (including environmental factors and growth periods) and plant photosynthetic rate, and establishes a corresponding mathematical model, which can better guide agricultural production.
Previous studies have established photosynthetic rate models based on the interaction between environmental factors and photosynthesis, which reflects the changes in photosynthetic rate to varying degrees. Based on a machine learning algorithm, the model can accurately predict the effect of environmental factors on the photosynthetic rate of the plants [16]. On this basis, it can also respond to the variation of plant photosynthetic rates at the spatial scale by adding different leaf position information [17]. To improve the convergence speed of the models, optimization algorithms for photosynthetic rate modeling characteristics have also been proposed [18]. These studies simultaneously modeled multiple types of environmental factors and had good applicability to the prediction of photosynthetic rate under dynamic environmental conditions. To further investigate the variation of the photosynthesis in cucumber, artificial neural networks were used to simulate the photosynthetic rate changes of cucumber in different growth periods [19]. However, the study modeled the seedlings and flowering periods separately and did not have continuity in growing days. The above photosynthetic rate models did not consider the continuous changes in the growth state of the cucumber throughout its growth cycle, which leads to a bias in its prediction of photosynthetic rate. Therefore, according to the nested effects of growth period and environmental factors on photosynthetic rate, the establishment of a photosynthetic rate model for the whole growth period to achieve the accurate prediction of photosynthetic rate is of great significance for the facility of environmental regulation.
In view of the above problems, this paper considers the differences in the photosynthetic rates of cucumbers in different growth periods and the effects of different external environments on cucumber photosynthesis to establish a model for predicting the photosynthetic rates of cucumber leaves during the whole growth period. Firstly, taking “Jinyou 35” cucumber as the research object, a multi-environmental factor nesting experiment in a non-uniform sampling period was designed to obtain samples of the photosynthetic rate of cucumber leaves corresponding to different photon flux densities, temperatures, and CO2 concentrations during the whole growth period. On this basis, the modeling effects of the four types of Support Vector Regression (SVR) algorithm kernel functions were compared, and multiple population genetic algorithm (MPGA) was used to optimize the parameters of the SVR algorithm. Based on the SVR algorithm, a cucumber photosynthetic rate prediction model in a whole growth period with time parameters was constructed to realize the accurate prediction of the photosynthetic rate of cucumbers in the greenhouse. The flow chart of the model construction in this study is shown in Figure 1.

2. Materials and Methods

2.1. Experimental Materials

The experiment was carried out at the Jingyang Vegetable Experiment Demonstration Station (lat. 34°07′39″ N, long. 107°59′50″ E, elevation 648 m) of Northwest A&F University in Xianyang City from September to December 2017. After hot-water-treatment in dark, the seeds of “Jinyou 35” cucumber (Cucumis sativus L.) were sown in a 72-well tray. The organic matter mass fraction contained in the nursery substrate was over 50%, the humic acid mass fraction was over 20%, and the pH value was between 5.5 and 6.5. The seedlings were cultured to three-leaf stage, and data were collected after the recovery stage.

2.2. Experimental Methods

In this paper, the photon flux density, temperature, and CO2 concentration in the facility environment were used as independent variables, and the photosynthetic rate value under the corresponding conditions was used as the dependent variable. A non-uniform sampling period was designed, and the growth parameters (light intensity, CO2 concentration, temperature, and growing time) of cucumber were collected during this period.
The cucumber seedlings with luxuriant growth were randomly selected, and their functional leaves were used as samples to collect photosynthetic rate. The LED light source module, temperature and humidity control module, and CO2 injection module of LI-6400 Portable Photosynthesis Rate Instrument of American LI-COR company were set to provide the required environment for the experiment. According to the general rule of cucumber light response changes [20], the LED light source module was set to provide non-uniform photon flux density sampling gradients of 0, 20, 50, 100, 200, 300, 500, 700, 1000, 1200, 1500, 1800 μmol·m−2·s−1, a total of 12 gradients. The flow rate of the LI-6400 control module was set to 500 μmol·s−1 and the relative humidity of the moisture module was set to 50%. The environmental factor parameter settings are shown in Table 1.
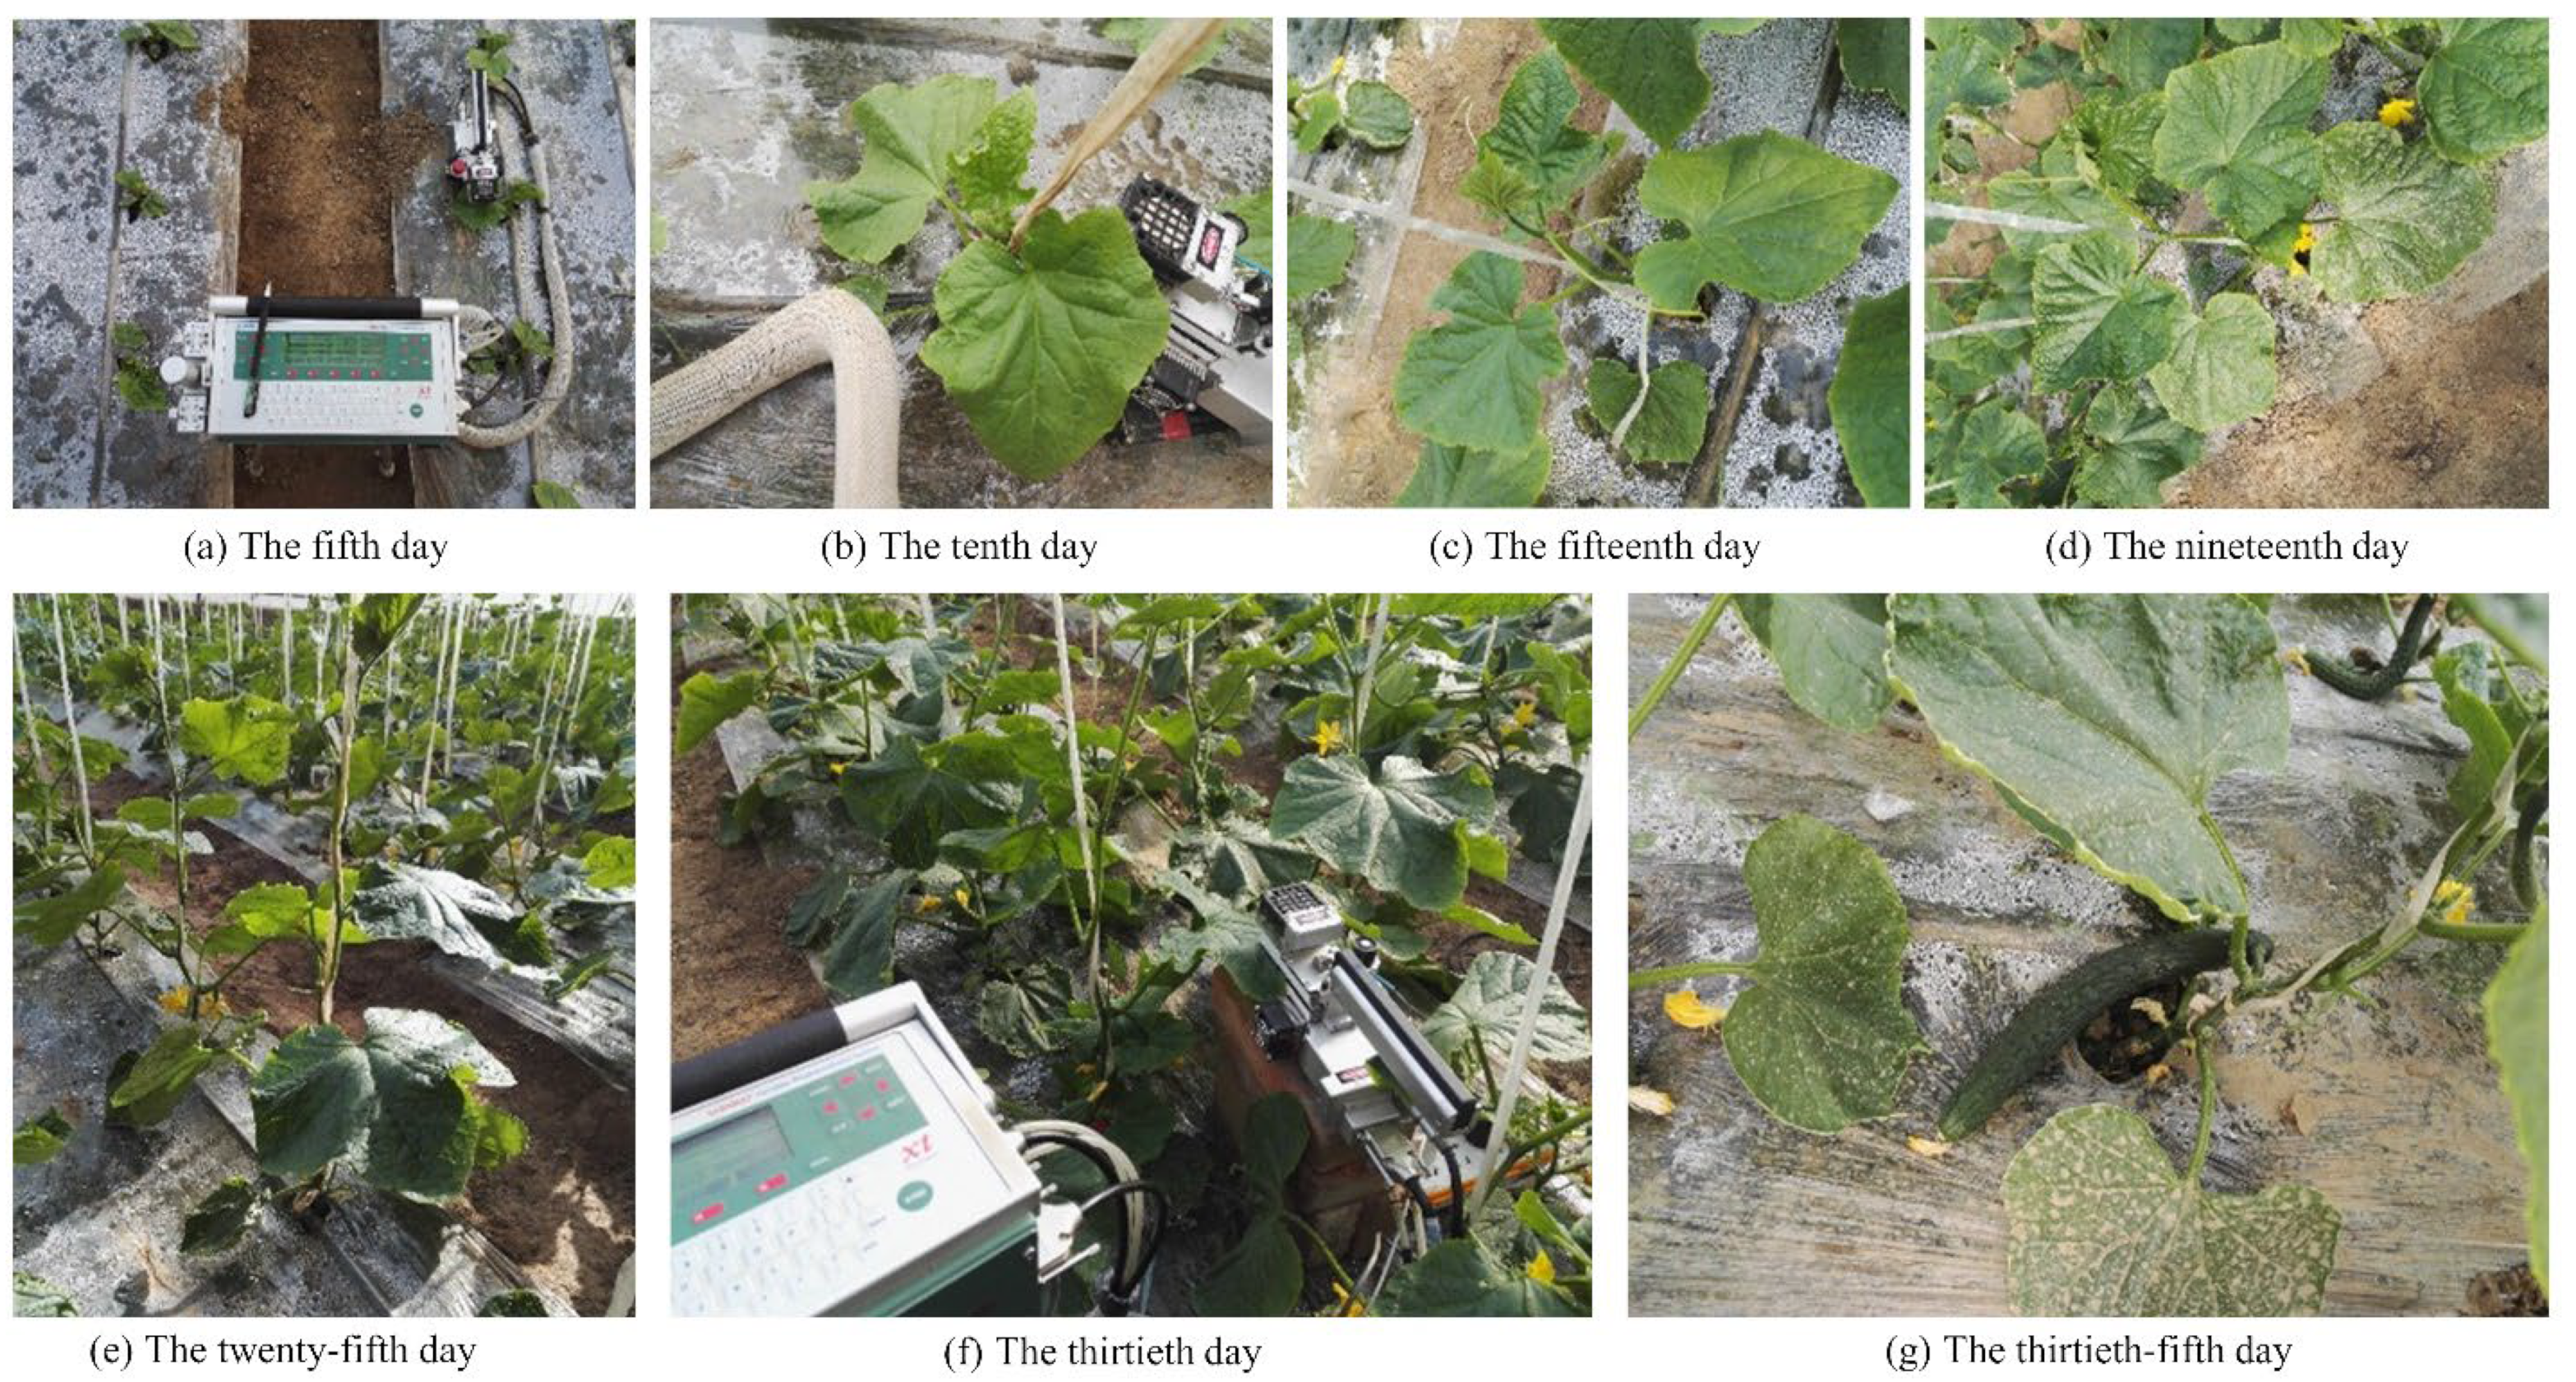
A total of 192 environmental conditions (12 × 4 × 4) were formed. In order to eliminate accidental errors, the photosynthetic rate was measured three times in each group and the average value was taken as the data collection result of one experiment. Therefore, the response photosynthetic rates of cucumber under different environmental factors were obtained. In order to obtain the regularity of the photosynthetic rate of cucumber in the whole growth period, a non-uniform sampling period was designed according to the growth cycle of cucumber and the difference in the development speed of each period. A total of 10 collection experiments were performed on the 5th, 10th, 15th, 20th, 25th, 30th, 35th, 50th, 65th, and 80th days after the cucumber seedlings were planted. At the end of the experiment, a total of 30 leaves were measured. The collection period settings were shown in Table 2. The growth status of cucumbers in different days is shown in Figure 2.

2.3. Data Preprocessing Method

The growth parameters and environment variables of cucumber seedlings were set as model inputs, and recorded as X. X = ( x 1 , x 2 , x 3 , x 4 ) T , where x1, x2, x3, x4 were light intensity, CO2 concentration, temperature, and growing time, respectively. The photosynthetic rate values were set as model output y, and the sample set P = ( x 1 ,   x 2 ,   x 3 ,   x 4 ,   y ) T was obtained. Since the dimensions of each variable were different, it is necessary to eliminate the influence of magnitude values for better model performance. A linear transformation function was used to normalize the sample set:
t = ( t m a x   t m i n )   ×   ( s     s m a x ) / ( s m a x     s m i n ) + t m i n
where smax and smin are the maximum and minimum value of the sample set before normalization, tmax and tmin are the upper and lower limits of the sample set after normalization. s and t are the sample data before and after normalization.
Finally, a set of 1920 (12 × 4 × 4 × 10) photosynthetic rate modeling sample set P = ( x ) T was obtained.

2.4. Method of Photosynthetic Rate Prediction Model

In this paper, SVR algorithm was used to build a prediction model of photosynthetic rates for cucumber in whole growth period. The SVR algorithm maps data vectors from a low-dimension space to a high-dimension space, which enables models to transform a non-linear problem into a very high dimensional linear problem, leading to more accurate predictions [21]. The training set containing l samples was defined as (Xi, yi), i = 1,2,…,l, where Xi was the input vector of the i-th training sample, and yi was the corresponding output value. The linear regression function established in the high-dimensional feature space can be defined as
f ( X ) = W T φ ( X ) + b
where,
  • W = an weight vector
  • φ(X) = a nonlinear mapping function
  • b = a constant.
Ignoring the fitting error less than ε, -SVR can be expressed as the following constrained optimization problem:
m i n W ,   b ,   ξ ,   ξ * 1 2 W T W + 1 2 C i = 1 l ( ξ i + ξ i * ) } s . t . y i   W T φ ( X i   )     b     ε + ξ i   y i + W T φ ( X i ) + b     ε + ξ i * ξ i ,   ξ i *     0 ,   i = 1 , 2 , , l
where,
  • C = the penalty factor
  • ξ i and ξ i * = a pair of relaxation factors.
By introducing the Lagrange function, the optimization problem of Equation (3) can be transformed into a dual form, and the objective equation is shown in Equation (4):
f ( X ) = i = 1 l ( a i *     a i ) K ( X i ,   X ) + b
where,
  • a i * and a i = dual variables
  • K(Xi,Xj) = φ(Xi)Tφ(Xj) = the kernel function.
In order to get better results, four kinds of kernel functions commonly used in SVR algorithm were pre-trained. Then the C and gamma parameters of SVR algorithm were optimized by using MPGA.

2.5. Data Preprocessing Method

The SVR kernel function is a mapping function from nonlinear space to linear space, which determines the position of the hyperplane in the model and directly affects the performance of the model. The frequently used SVR kernel functions include Linearity function, Polynomial function, Radial basis function, and Sigmoid function. In order to select the optimal kernel function, this paper randomly selected 30% samples from the sample set P′, randomly divided them into a training set and a test set with a ratio of 4:1. Then, four kinds of kernel functions were used for pre-training. Furthermore, the coefficient of determination (R2) and root-mean-square error (RMSE) were selected as evaluation indicators.

2.6. SVR Model Parameter Optimization

Model parameter is another key factor affecting SVR regression performance. Among them, the kernel function parameter gamma and the penalty factor C are important parameters for the SVR algorithm to optimize the target and the regression hyperplane, and directly participate in the training of the regression model and the selection of support vectors. The penalty factor C is used as an adjustment parameter of structural risk and empirical risk in the optimization target, affecting the prediction accuracy of the SVR regression model. When the C value is too large, the training accuracy would increase but it is easy to overfit; when the C value is too small, the training accuracy would decrease and the problem of under-fitting appears. The above situations would reduce the generalization ability of the model. Different values of gamma would change the shape of the kernel function, which would cause the regression hyperplane to change. As a result, some sample points would be thrown out of the hyperplane band-shaped region, and could never achieve correct prediction. For different datasets, the optimal parameter values of the SVR algorithm vary greatly. In order to achieve the best model performance, this paper introduced MPGA into the C and gamma parameter optimization.
MPGA, as a global optimization search method has the advantages of high efficiency and rapid speed and is suitable for complex optimization problems [22,23]. MPGA consists of standard genetic algorithm (SGA), immigration operator, artificial operator, and elite population. Among them, each SGA uses different genetic parameters for crossover and mutation operations to eliminate the parameter mismatch caused by the difference in initialization parameters. Next, the immigration operators are used to connect the various populations, and the worst individual in the target population is replaced with the best individual to realize the information exchange between the populations. Finally, the artificial algorithm is used to record the optimal individual of each generation in each population and pass it to an elite population. The elite population does not perform cross mutation operations to ensure that the outstanding individuals are not destroyed or lost and can output consistent convergence results, thereby achieving a global optimal search.

2.7. Data Processing Methods

The procedures of the algorithms and the models were written in Matlab R2016a (The MathWorks, Natick, MA, USA) based on LIBSVM toolbox (farutoUltimateVersion) [24] and artificial neural networks toolbox.

3. Results and Discussion

3.1. Experimental Results

3.1.1. Effects of Environmental Factors on Photosynthetic Rate

In order to analyze the response of photosynthetic rate to the main environmental factors, the photosynthetic rate data of cucumber on the 35th day after planting was taken as an example, and its photon flux density–photosynthetic rate change curve was drawn. When the temperature was 20, 24, 28, and 32 °C, and the CO2 concentration was 600, 900, 1200, and 1500 μmol·mol−1, the cucumber light response curves are shown in Figure 3.
The photosynthetic rate changed significantly under different photon flux densities. The photoinhibition occurs when the increase in photo flux density cannot synchronously rapidly increase (or even slightly decrease) the photosynthetic rate [25,26]. When the ambient temperature was 20 and 24 °C, the photosynthetic rate decreased under the high light intensity (1500–1800 μmol·m−2·s−1), and the photoinhibition phenomenon appeared, as is shown in Figure 3b.
There is difference in the photosynthetic rate of cucumber in relatively low CO2 concentrations (600 μmol·mol−1·s−1) and relatively high CO2 concentrations (900–1500 μmol·mol−1·s−1). However, the difference was not significant when the CO2 concentration is higher than 900 μmol·mol−1·s−1. Such a phenomenon shows that the effect of high CO2 concentration will not further significantly increase the photosynthetic rate of cucumber. This was due to the limitation of the regeneration ability of the phosphate of the crops’ photophosphorylation process [27]. In addition, we compared the photosynthetic rate curve within different temperature ranges (Figure 3(b1–b4)). When the temperature rises to the range of 28–32 °C, the photosynthetic rate of cucumber under high photon flux density was greater than that of the range of 20–24 °C. In addition, under relatively high temperatures, when the CO2 concentration is 900–1500 μmol·mol−1·s−1, the photosynthetic rate of cucumber under high photon flux density increased more than under 600 μmol·mol−1·s−1. This is because the sensitivity of C3 plants to CO2 will increase with the increase in temperature [28], which is reflected in the increase in photosynthetic rate.
The four sub-graphs all revealed that the temperature increase caused a rapid increase in photosynthetic rate. This is because temperature affects the activity of photosynthesis-related enzymes, which accelerates the reaction process [29]. Moreover, as the temperature rose, the inflection point of the light response curve gradually shifted to the right, and the light saturation point gradually increased.
In summary, various environmental factors have a significant effect on photosynthetic rate, and the above response law is consistent with the mechanism of plant photosynthesis [30,31]. Therefore, it is reasonable to introduce environmental factors into the establishment of cucumber photosynthetic rate prediction models.

3.1.2. Effects of Growing Time on Photosynthetic Rate

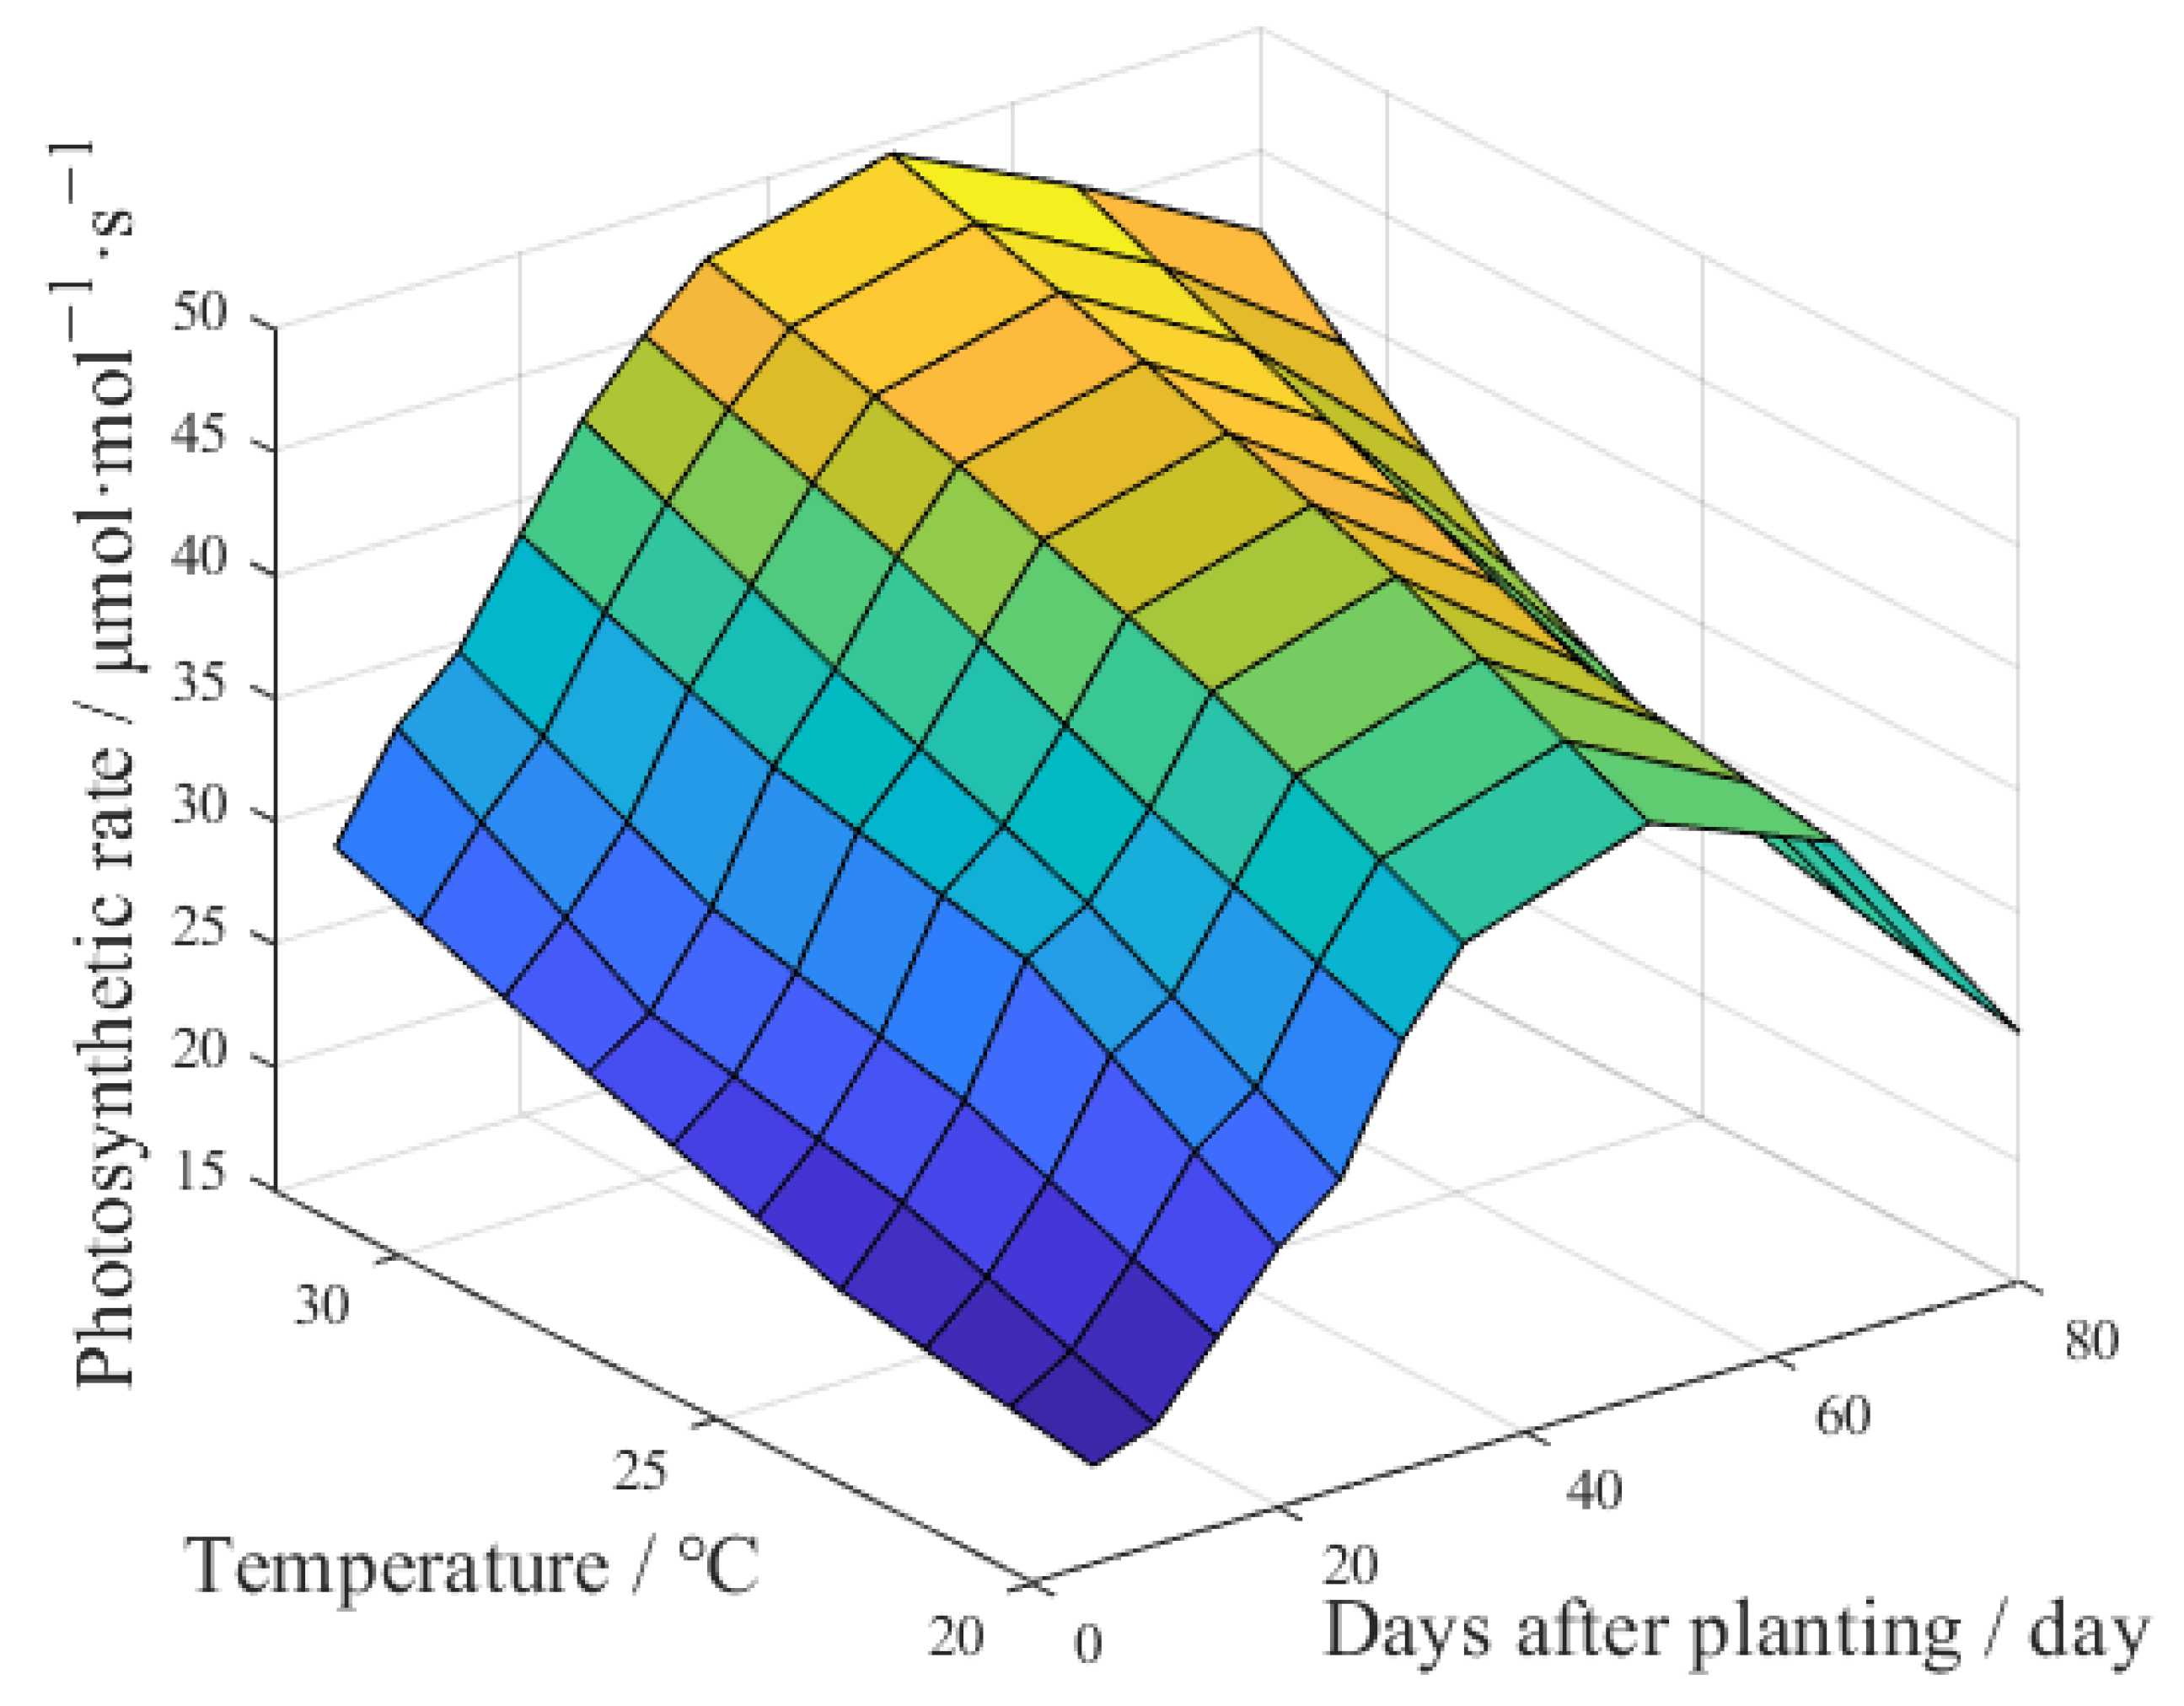
In order to overcome the contingency of a single dataset, four sets of environmental conditions were selected to analyze the effect of growing time on photosynthetic rate. When the photon flux density was 1500 μmol·m−2·s−1 and the CO2 concentration was 1500 μmol·mol−1, the response curve of the photosynthetic rate with time factor at the temperatures of 20 °C, 24 °C, 28 °C, and 32 °C was shown in Figure 4.
It can be seen from Figure 4 that in the above temperature range, the photosynthetic rate of cucumber increased rapidly in the period from pumping to early fruiting (0–35 days). During the fruit-harvest period (35–65 days), the photosynthetic rate slowly increased first and then decreased, indicating that the leaves began to age. From the later stage of the fruiting period to the end of fruiting (65–80 days), the photosynthetic rate of the leaves showed a downward trend, and the leaves were completely into the stage of aging.
Similarly, numerous studies suggested that the leaf photosynthetic rate in most species increased rapidly during leaf development [32]. When the leaves were fully expanded, their areas and photosynthesis rates were 90–100% of maximum values [33]. As leaves age further, photosynthetic capacity, stomatal conductance, leaf dry mass per area, nitrogen, protein, and photosynthetic enzymes including Rubisco decreased [34]. However, their growth process is continuous, and measuring the photosynthetic rate of plants in different growing days could more accurately reflect their photosynthetic process, which would improve the accuracy of prediction models.
Figure 4 indicated that the photosynthetic rate of cucumber varied significantly over time, and was consistent with the characteristics of cucumber growth. Therefore, it is necessary to incorporate time factor into the establishment of photosynthetic rate prediction models.

3.2. SVR Algorithm Optimization Results

3.2.1. Optimal Kernel Function Acquisition

To select the optimal kernel function, this paper randomly selected 30% samples from the dataset P′, and randomly divided them into a training set and a test set with a ratio of 4:1. Then, four kinds of kernel functions were used for pre-training. RMSE and R2 were selected as the evaluation indexes and the pre-training results are shown in Table 3.
It can be seen from Table 3 that the test set R2 of the model using the RBF kernel function was 0.995 and RMSE was 0.851 μmol·m−2·s−1, and its generalization ability was the best. Because the RBF function had the best training efficiency and precision, it was selected as the kernel function of photosynthetic rate prediction model.

3.2.2. Optimal C and Gamma Parameters Combination Acquisition

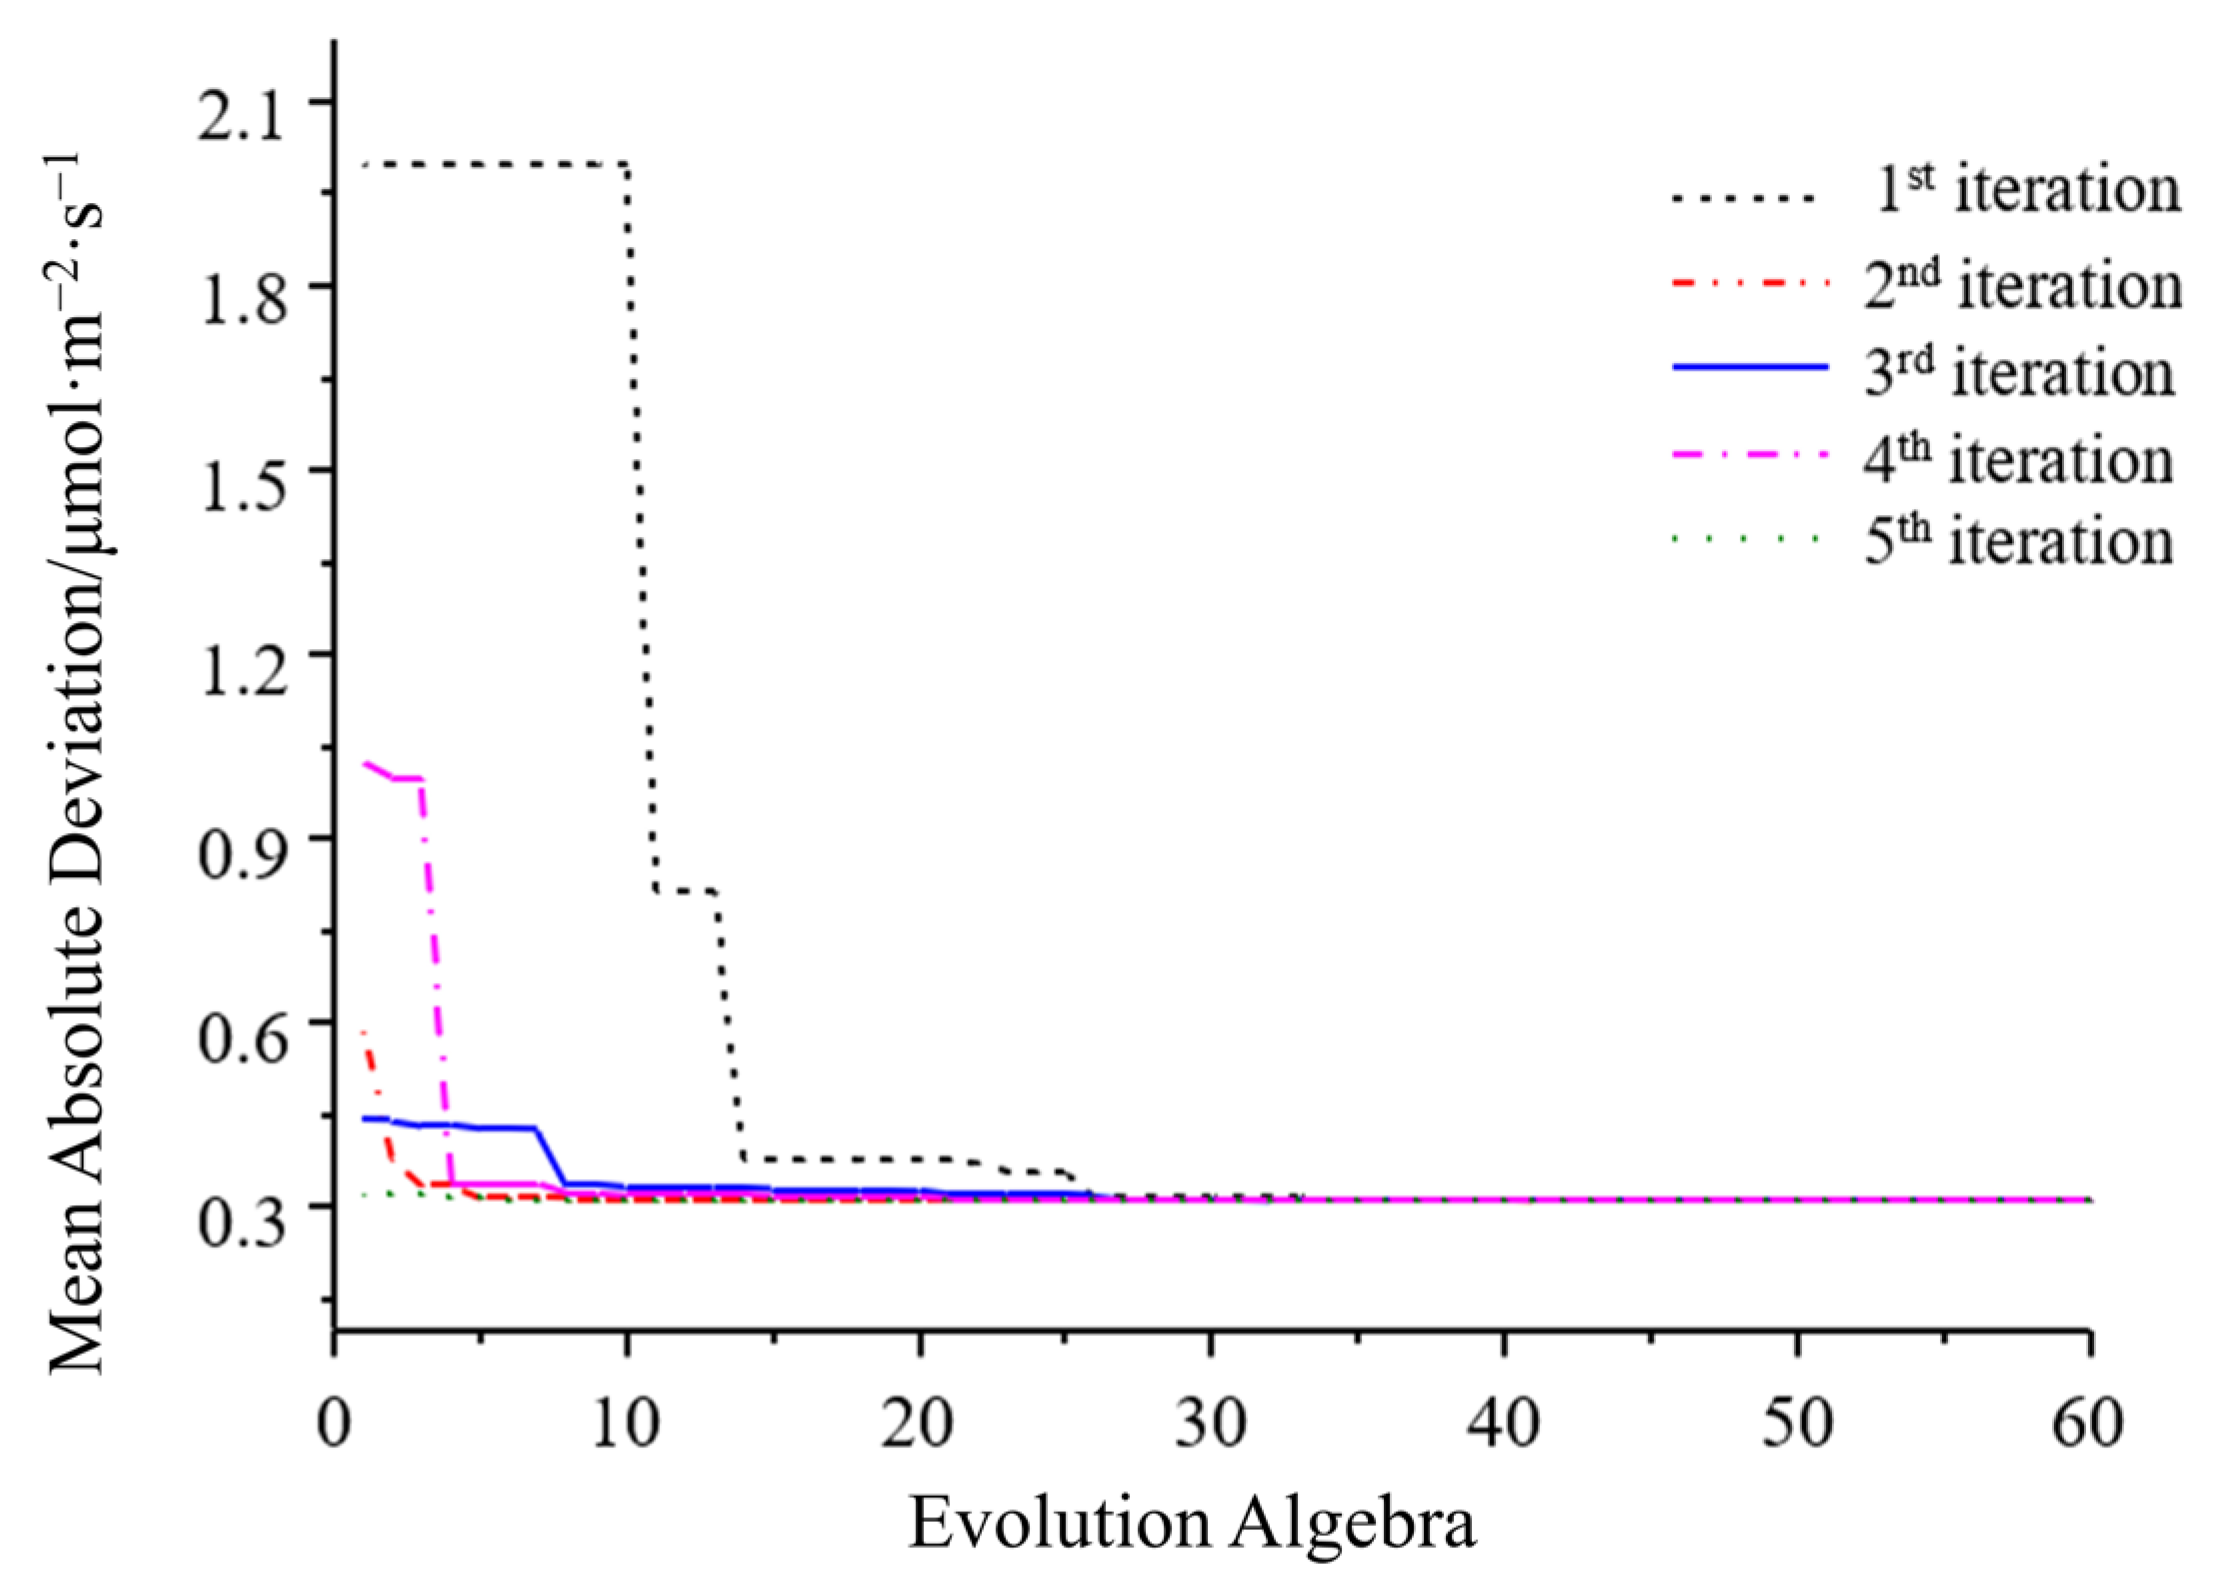
The C and gamma parameters of SVR algorithm were optimized by MPGA. Figure 4 showed the genetic evolution of multiple populations after five trainings.
It can be seen from Figure 5 that with the increase in the evolution algebra, the results of MPGA algorithm in 5 trainings all converged to the same error value. Moreover, the optimal solutions for the C and gamma parameters obtained from the 5 trainings are the same, both are 79.268 and 0.937, respectively. MPGA algorithm avoided the problems of low search efficiency and early convergence that were often found in standard genetic algorithm, and was more suitable for parameter optimization [35,36]. At the same time, no oscillation occurred after each training reached the optimal solution, which indicated that the MPGA algorithm had good convergence.
To verify the effect of MPGA for parameters optimization, this paper selected the GridSearchCV method to compare the algorithm performance. The input sample set was randomly divided into a training set and a test set with a ratio of 4:1. The RBF function was selected as the kernel function, and two optimization algorithms were used to train the SVR model respectively. The results were shown in Table 4.
As can be seen from Table 4, in terms of accuracy, the mean absolute deviation (MAD) of the prediction set and test set of the model optimized using the MPGA algorithm were 0.193 μmol·m−2·s−1 and 0.280 μmol·m−2·s−1. Both were lower than the corresponding errors using the GridsearchCV method. Meanwhile, research shows that the grid search method takes a long training time to reach a certain accuracy [37]. In summary, the MPGA algorithm has good performance accuracy and could effectively optimize the SVR algorithm.

3.3. Model Validation

In order to compare the performance of the models built by the SVR algorithm, this paper used the same training set and test set to build the model based on the Gridsearch-SVR (GS-SVR) algorithm, MPGA-SVR algorithm, Back Propagation Neural Network (BPNN), and nonlinear regression (NLR) method. The BPNN adopted a single hidden layer structure, and the number of input nodes, hidden layer nodes, and output nodes were set to 4, 8, and 1. The transfer functions were Tansig function and Purelin function, and the training function was trainlm function. NLR used SPSS non-linear regression toolbox for model analysis, and the quaternion cubic polynomial was used as the framework to train the model. The MAD, the maximum absolute error (MAE), R2 were chosen as the evaluation indicators. The performance of each model on the testing set are shown in Table 5.
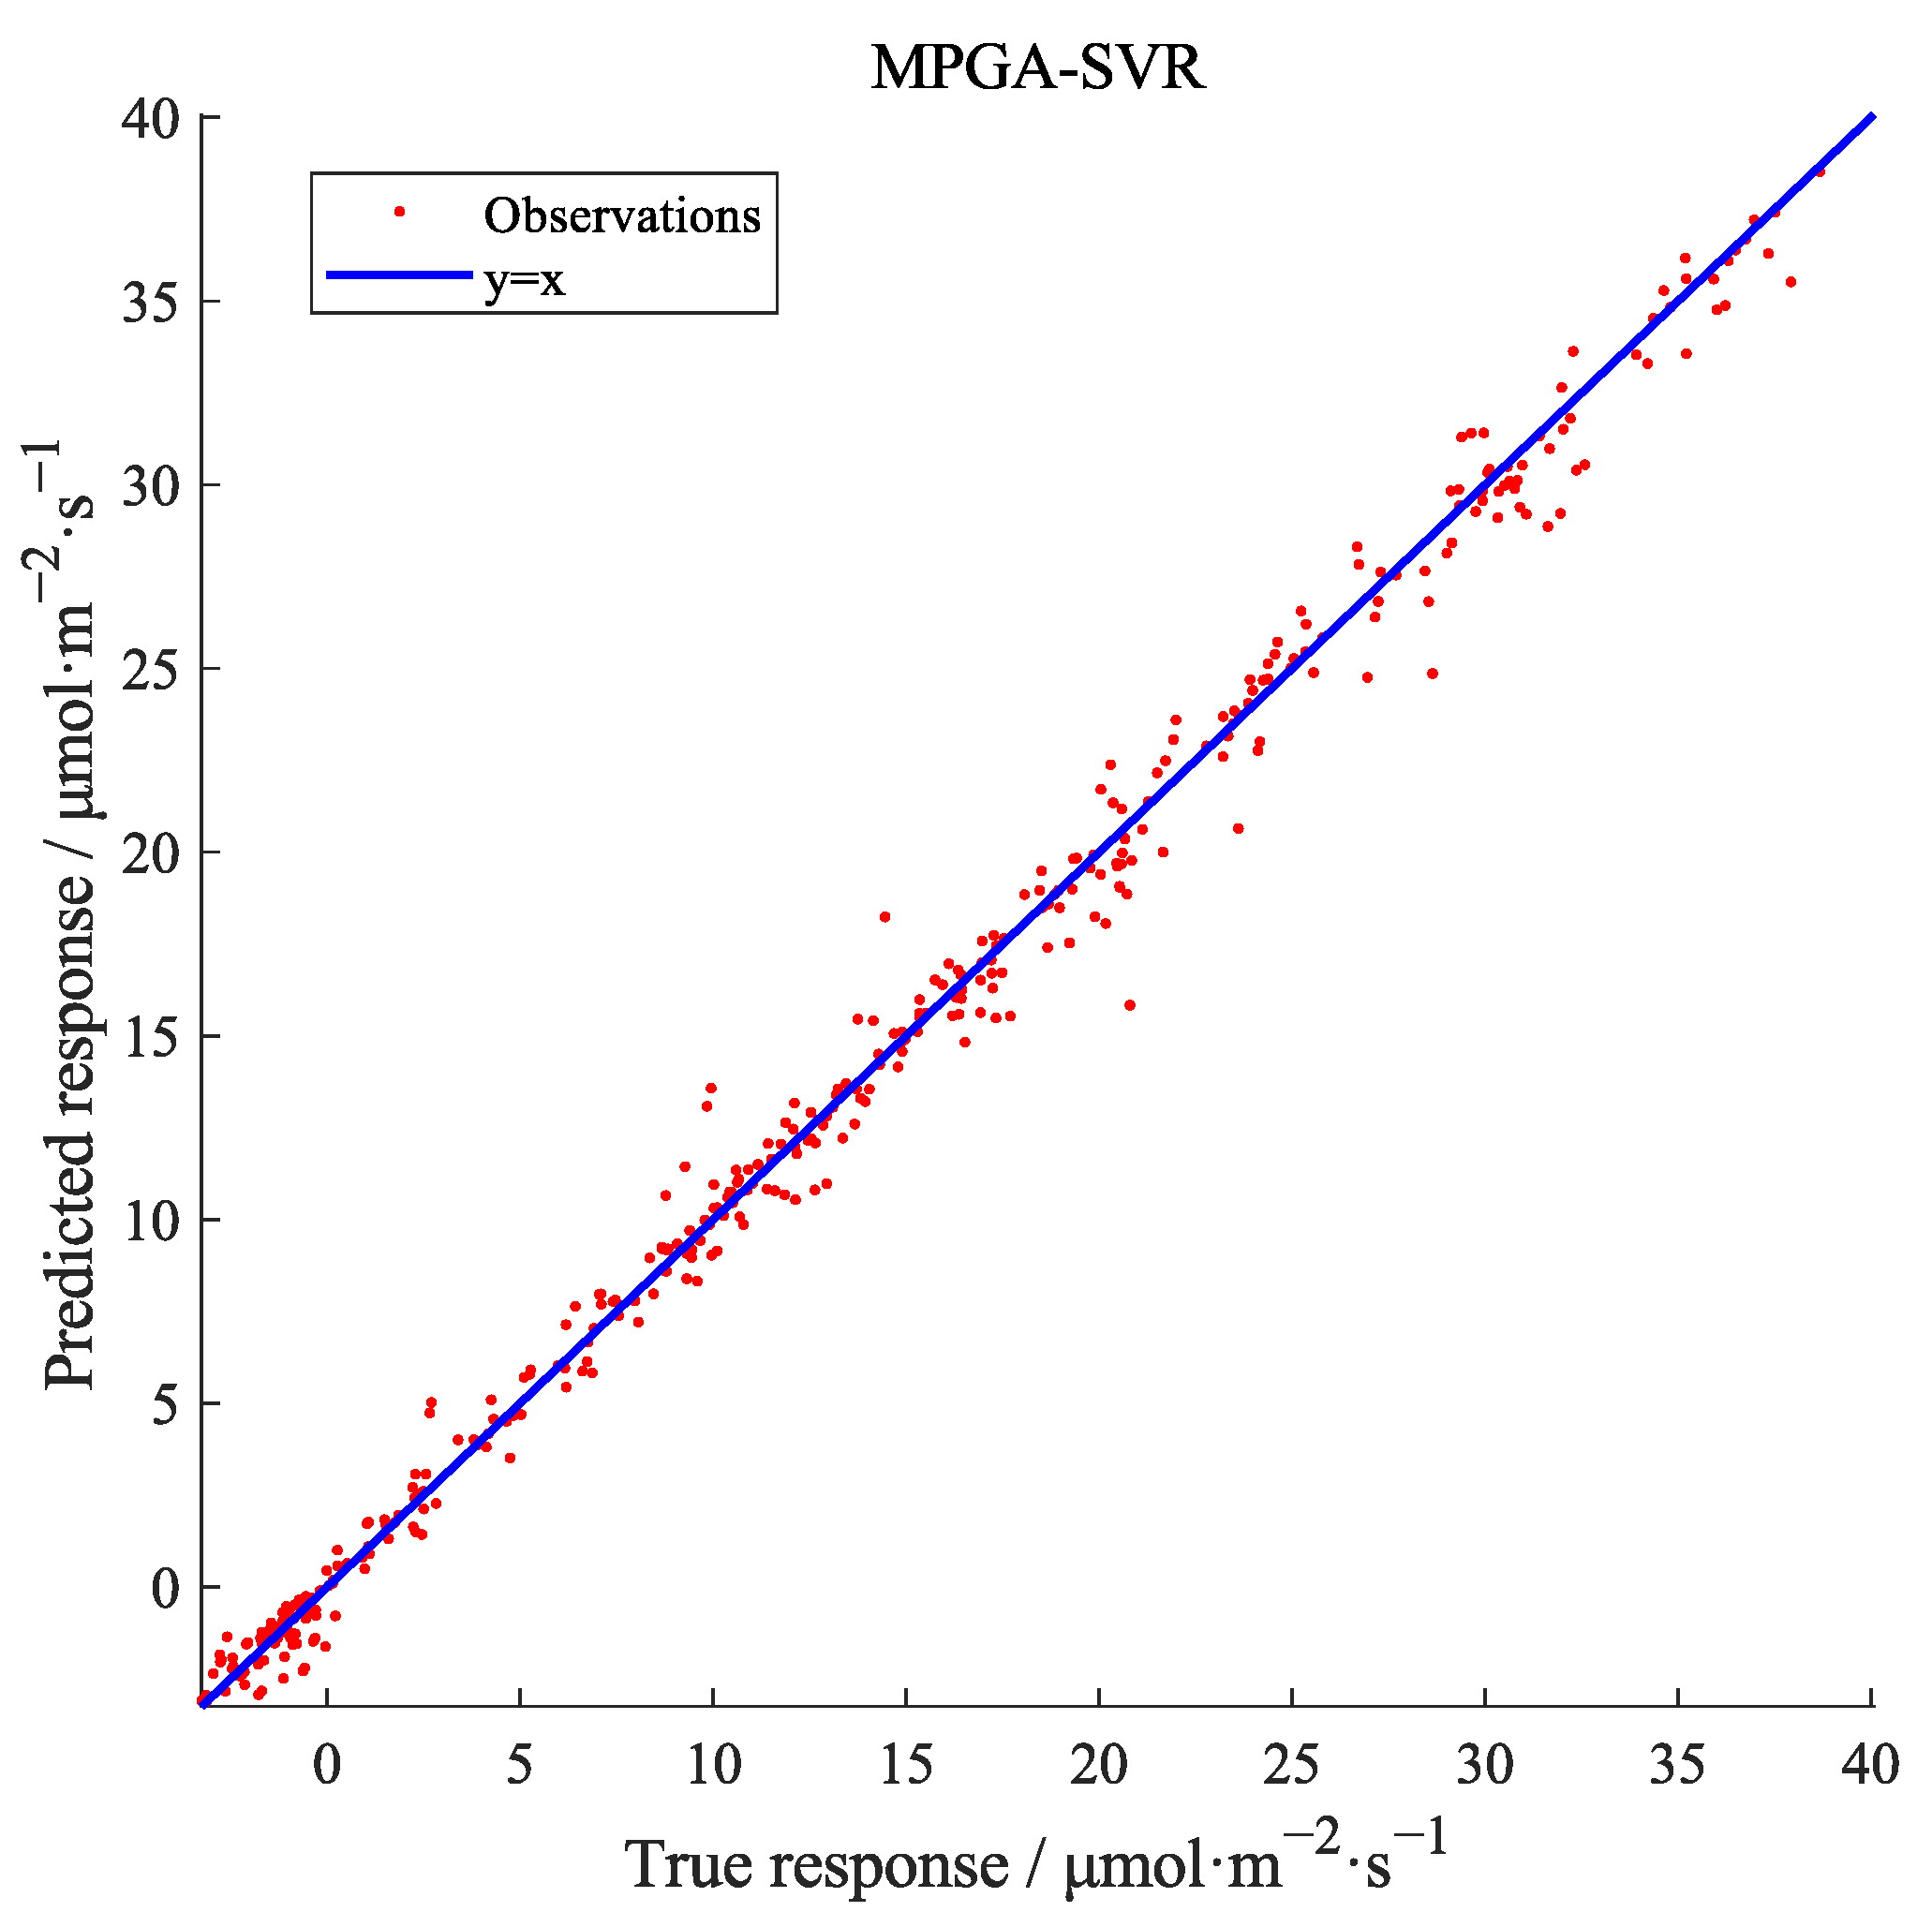
As can be seen from Table 5, the models built using the BPNN, GS-SVR algorithm, and MPGA-SVR algorithm all performed well (R2 > 0.99), indicating that there was a strong correlation between predicted and measured values, and the model could well reflect samples’ data characteristics. In terms of prediction errors, the MAD of the GS-SVR and MPGA-SVR algorithms were 0.407 μmol·m−2·s−1, 0.280 μmol·m−2·s−1, and the MAE were 2.809 μmol·m−2·s−1 and 2.462 μmol·m−2·s−1, which were smaller than BPNN algorithm. This shows that the accuracy of the model using the SVR algorithm in this paper is higher than that of the BP network with a single hidden layer. The MPGA-SVR model had the highest accuracy among the above evaluation indicators, indicating that it could accurately predict the photosynthetic rate of cucumber under different light densities, temperatures, CO2 concentrations, and growing days. The plot of true response–predicted response of the MPGA-SVR model on the test dataset is shown in Figure 6.
In this study, the factor of growing days was used as the independent variable of the model to refine the process of crop growth, which can dynamically describe the continuous change of photosynthetic rate. A previous study divided the growth process of plants with different growth periods, and proposed a BPNN algorithm-based photosynthetic rate prediction model [19]. In addition to environmental variables, the model also used chlorophyll content and growth stage as inputs, with R2 of 0.9517 and RMSE of 1.622 μmol·m−2·s−1. The results indicate that the prediction accuracy is less than the model established in this paper. As there are multiple days for a growth period of crops [38], it may cause a large error to use one day of them to represent the photosynthetic rate level of the entire growth period. Therefore, the model built in this paper could provide a more accurate and effective way for the intelligent regulation of protected agriculture.

4. Conclusions

In this study, cucumber was used as the research object. The photosynthetic rate data set of cucumbers with different growing times and environmental factors was obtained by the photosynthetic rate experiment during the whole growth period. The optimal SVR algorithm parameter combination was obtained by MPGA, and a cucumber photosynthetic rate prediction model in a whole growth period with time parameters was constructed. The main conclusions are as follows:
(1)
In terms of parameter optimization of SVR algorithm, MPGA algorithm overcomes the premature convergence phenomenon commonly seen in standard genetic algorithm through global optimization, and can obtain higher model accuracy than GridSearchCV algorithm;
(2)
Model verification results show that the R2 of the test set of the MPGA-SVR model is 0.998, and the MAD is 0.280 μmol·m−2·s−1. Its evaluation results are better than the models built by GridsearchCV-SVR algorithm, BPNN, and NLR method. At the same time, it shows that the modeling with growing days could well reflect the change of photosynthetic rate under different growth stages in the whole growth period, and the accuracy of the model could meet the needs of practical application.

Author Contributions

Conceptualization, Z.W. and X.W.; methodology, X.W.; validation, K.Y. and M.L.; formal analysis, Z.W., X.W. and P.G.; investigation, W.L.; resources, K.Y. and W.L.; writing—original draft preparation, Z.W., X.W. and B.L.; writing—review and editing, B.L., P.G., H.W. and J.H.; visualization X.W.; supervision, H.W. and J.H.; project administration, J.H.; funding acquisition, H.W. and J.H. All authors have read and agreed to the published version of the manuscript.

Funding

This research was funded by the National Key Research and Development Program of China (CN), funding number 2020YFD1100602 (Jin Hu); the Key Research and Development Projects of Shaanxi Province (CN), funding number 2021ZDLNY03-02 (Jin Hu); the Fundamental Research Funds for the Central Universities (CN), funding number 2452020292 (Jin Hu); and the Task of Post Expert of National Bulk Vegetable Industry Technology System (CN), funding number cars-23-c06 (Huarui Wu).

Institutional Review Board Statement

Not applicable.

Data Availability Statement

The data presented in this study are available upon request from the corresponding author.

Conflicts of Interest

The authors declare no conflict of interest.

References

  1. Hernández-Morales, C.A.; Luna-Rivera, J.M.; Perez-Jimenez, R. Design and deployment of a practical IoT-based monitoring system for protected cultivations. Comput. Commun. 2022, 186, 51–64. [Google Scholar] [CrossRef]
  2. Xie, J.; Yu, J.; Chen, B.; Feng, Z.; Li, J.; Zhao, C.; Lyu, J.; Hu, L.; Gan, Y.; Siddique, K.H.M. Facility Cultivation Systems: A Chinese Model for the Planet. In Advances in Agronomy; Sparks, D.L., Ed.; Academic Press: Cambridge, MA, USA, 2017; Volume 145, pp. 1–42. [Google Scholar]
  3. Xu, Y.; Li, J.; Wan, J. Agriculture and crop science in China: Innovation and sustainability. Crop J. 2017, 5, 95–99. [Google Scholar] [CrossRef]
  4. Iqbal, M.; Mahmooduzzafar; Nighat, F.; Khan, P.R. Photosynthetic, metabolic and growth responses ofTriumfetta rhomboideato coal-smoke pollution at different stages of plant ontogeny. J. Plant Interact. 2010, 5, 11–19. [Google Scholar] [CrossRef] [Green Version]
  5. Jamil, F.; Ibrahim, M.; Ullah, I.; Kim, S.; Kahng, H.K.; Kim, D.-H. Optimal smart contract for autonomous greenhouse environment based on IoT blockchain network in agriculture. Comput. Electron. Agric. 2022, 192, 106573. [Google Scholar] [CrossRef]
  6. Jo, W.J.; Shin, J.H. Development of a transpiration model for precise tomato (Solanum lycopersicum L.) irrigation control under various environmental conditions in greenhouse. Plant Physiol. Biochem. 2021, 162, 388–394. [Google Scholar] [CrossRef]
  7. Xin, P.; Zhang, H.; Hu, J.; Shao, Z.; Peters, R.T. CO2 Control system design based on optimized regulation model. Appl. Eng. Agric. 2019, 35, 377–388. [Google Scholar] [CrossRef]
  8. Kaiser, E.; Morales, A.; Harbinson, J.; Kromdijk, J.; Heuvelink, E.; Marcelis, L.F. Dynamic photosynthesis in different environmental conditions. J. Exp. Bot. 2015, 66, 2415–2426. [Google Scholar] [CrossRef] [Green Version]
  9. Johnson, I.R.; Thornley, J.H.; Frantz, J.M.; Bugbee, B. A model of canopy photosynthesis incorporating protein distribution through the canopy and its acclimation to light, temperature and CO2. Ann. Bot. 2010, 106, 735–749. [Google Scholar] [CrossRef] [Green Version]
  10. Whitehead, W.F.; Singh, B.P. Leaf Age Affects Gas Exchange in Okra. HortScience 1995, 30, 1017–1019. [Google Scholar] [CrossRef] [Green Version]
  11. Zhang, S.B.; Hu, H.; Li, Z.R. Variation of photosynthetic capacity with leaf age in an alpine orchid, Cypripedium flavum. Acta Physiol. Plant. 2008, 30, 381–388. [Google Scholar] [CrossRef]
  12. Fan, X.X.; Xu, Z.G.; Liu, X.Y.; Tang, C.M.; Wang, L.W.; Han, X.L. Effects of light intensity on the growth and leaf development of young tomato plants grown under a combination of red and blue light. Sci. Hortic. 2013, 153, 50–55. [Google Scholar] [CrossRef]
  13. Sun, J.L.; Sui, X.L.; Huang, H.Y.; Wang, S.H.; Wei, Y.X.; Zhang, Z.X. Low Light Stress Down-Regulated Rubisco Gene Expression and Photosynthetic Capacity During Cucumber (Cucumis sativus L.) Leaf Development. J. Integr. Agric. 2014, 13, 997–1007. [Google Scholar] [CrossRef] [Green Version]
  14. Ding, X.T.; Jiang, Y.P.; Zhang, Z.H.; Jin, H.J.; Zhang, H.M.; Yu, J.Z. The change of cucumber growth and development in glasshouse. Acta Agric. Shanghai 2013, 29, 36–39. [Google Scholar]
  15. Li, P.; Zhou, J.; Wang, J.; Fu, W. Exponential sine equation for predicting cucumber growth process in greenhouses. J. Jiangsu Univ. 2009, 30, 325–329. [Google Scholar]
  16. Chen, W.Y. Predicting photosynthetic rate of sunflowers using back propagation neural network based on uniform design. Afr. J. Agric. Res. 2011, 6, 5817–5821. [Google Scholar] [CrossRef]
  17. Jung, D.H.; Shin, J.H.; Cho, Y.Y.; Son, J.E. Development of a two-variable spatial leaf photosynthetic model of irwin mango grown in greenhouse. Prot. Hortic. Plant Fact. 2015, 24, 161–166. [Google Scholar] [CrossRef]
  18. Hu, J.; Xin, P.; Zhang, S.; Zhang, H.; He, D. Model for tomato photosynthetic rate based on neural network with genetic algorithm. Int. J. Agric. Biol. Eng. 2019, 12, 179–185. [Google Scholar] [CrossRef] [Green Version]
  19. Xin, P.; Zhang, H.; Hu, J.; Wang, Z.; Zhang, Z. An Improved Photosynthesis Prediction Model Based on Artificial Neural Networks Intended for Cucumber Growth Control. Appl. Eng. Agric. 2018, 34, 769–787. [Google Scholar] [CrossRef]
  20. Yang, X.; Xu, H.; Shao, L.; Li, T.; Wang, Y.; Wang, R. Response of photosynthetic capacity of tomato leaves to different LED light wavelength. Environ. Exp. Bot. 2018, 150, 161–171. [Google Scholar] [CrossRef]
  21. Abdollahpour, S.; Kosari-Moghaddam, A.; Bannayan, M. Prediction of wheat moisture content at harvest time through ANN and SVR modeling techniques. Inf. Process. Agric. 2020, 7, 500–510. [Google Scholar] [CrossRef]
  22. Jiandong, M.; Juan, L. Dust particle size distribution inversion based on the multi population genetic algorithm. Terr. Atmos. Ocean. Sci. 2014, 25, 791. [Google Scholar]
  23. Zhu, H.; Jiao, L.; Pan, J. Multi-population genetic algorithm for feature selection. In Proceedings of the Advances in Natural Computation, Berlin/Heidelberg, Germany, 24–28 September 2006; pp. 480–487. [Google Scholar]
  24. Chang, C.C.; Lin, C.J. Libsvm: A library for support vector machines. ACM Trans. Intell. Syst. Technol. 2011, 2, 1–27. [Google Scholar] [CrossRef]
  25. Gao, P.; Tian, Z.; Lu, Y.; Lu, M.; Zhang, H.; Wu, H.; Hu, J. A decision-making model for light environment control of tomato seedlings aiming at the knee point of light-response curves. Comput. Electron. Agric. 2022, 198, 107103. [Google Scholar] [CrossRef]
  26. Krupa, Z.; Oquist, G.; Gustafsson, P. Photoinhibition of photosynthesis and growth responses at different light levels in psbA gene mutants of the cyanobacterium Synechococcus. Physiol. Plant. 1991, 82, 1–8. [Google Scholar] [CrossRef]
  27. Igamberdiev, A.U.; Kleczkowski, L.A. Optimization of CO2 fixation in photosynthetic cells via thermodynamic buffering. Biosystems 2011, 103, 224–229. [Google Scholar] [CrossRef]
  28. Kirschbaum, M.U.F. The sensitivity of C3 photosynthesis to increasing CO2 concentration: A theoretical analysis of its dependence on temperature and background CO2 concentration. Plant Cell Environ. 1994, 17, 747–754. [Google Scholar] [CrossRef]
  29. Galmes, J.; Capo-Bauca, S.; Niinemets, U.; Iniguez, C. Potential improvement of photosynthetic CO2 assimilation in crops by exploiting the natural variation in the temperature response of Rubisco catalytic traits. Curr. Opin. Plant Biol. 2019, 49, 60–67. [Google Scholar] [CrossRef]
  30. Aguera, E.; Ruano, D.; Cabello, P.; de la Haba, P. Impact of atmospheric CO2 on growth, photosynthesis and nitrogen metabolism in cucumber (Cucumis sativus L.) plants. J. Plant Physiol. 2006, 163, 809–817. [Google Scholar] [CrossRef]
  31. Xue, W.; Li, X.; Lin, L.; Wang, Y.; Li, L. Effects of short time heat stress on photosystem II, Rubisco activities and oxidative radicals in Alhagi sparsifolia. Chin. J. Plant Ecol. 2011, 35, 441–451. [Google Scholar] [CrossRef]
  32. Pettersen, R.I.; Torre, S.; Gislerød, H.R. Effects of leaf aging and light duration on photosynthetic characteristics in a cucumber canopy. Sci. Hortic. 2010, 125, 82–87. [Google Scholar] [CrossRef]
  33. Ming, Z.; Piyao, Z.; Ruifang, W. Studies on the dynamic changes of the photosynthetic rates of the leaves duration the course of the growth and development of summer-sown corn. Acta Agron. Sin. 1992, 18, 337–343. [Google Scholar]
  34. Bertamini, M.; Nedunchezhian, N. Leaf age effects on chlorophyll, Rubisco, photosynthetic electron transport activities and thylakoid membrane protein in field grown grapevine leaves. J. Plant Physiol. 2002, 159, 799–803. [Google Scholar] [CrossRef]
  35. Elliott, L.; Ingham, D.B.; Mera, N.S. A multi-population genetic algorithm approach for solving ill-posed problems. Comput. Mech. 2004, 33, 254–262. [Google Scholar] [CrossRef]
  36. Huang, Y.; Ma, X.; Su, S.; Tang, T. Optimization of train operation in multiple interstations with multi-population genetic algorithm. Energies 2015, 8, 14311–14329. [Google Scholar] [CrossRef]
  37. Hu, J.; Gao, P.; Chen, D.; Li, B.; Jing, H.; Zhang, H. Establishment of photosynthetic rate prediction model for eggplant leaves fused with dark fluorescence parameters. Trans. Chin. Soc. Agric. Mach. 2020, 51, 328–336. [Google Scholar]
  38. Lindström, L.I.; Pellegrini, C.N.; Aguirrezábal, L.A.N.; Hernández, L.F. Growth and development of sunflower fruits under shade during pre and early post-anthesis period. Field Crops Res. 2006, 96, 151–159. [Google Scholar] [CrossRef]
Figure 1. The flow chart of the establishment of the cucumber photosynthetic rate prediction model in whole growth period with time parameters.
Agriculture 13 00204 g001
Figure 2. The growth status of cucumbers in different days.
Agriculture 13 00204 g002
Figure 3. (a). The response surface of photosynthetic rate to photon flux density and CO2 concentration at different temperatures (changing temperature). (b). The light response curve of cucumber photosynthetic rate under different environmental conditions (changing CO2 concentration and temperature). The photoinhibition points of the light response curve are marked with red boxes in the subfigures of Figure 3b.
Agriculture 13 00204 g003
Figure 4. Changes of photosynthetic rate with growing time of cucumber under different environment.
Agriculture 13 00204 g004
Figure 5. Multi-population genetic algorithm five evolution curves.
Agriculture 13 00204 g005
Figure 6. The true response vs. the predicted response of the MPGA-SVR model on the test set.
Agriculture 13 00204 g006
Table 1. Experimental environment parameter settings.
Photon Flux Density
(μmol·m−2·s−1)
Temperature
(°C)
CO2 Concentration
(μmol·mol−1)
Range0–180020–32600–1500
Step size/4300
Table 2. Collection period setting of Full growth period.
Growth StageInitial Flowering Stage to Initial Fruiting Stage (Day)Full Fruiting Stage to Final Fruiting Stage (Day)
Time range3536–85
Sampling
interval
515
Table 3. Effect of four types of kernel function on model performance.
Kernel Function Training SetTest Set
RMSE
(μmol·m−2·s−1)
R2RMSE
(μmol·m−2·s−1)
R2
linearity2.2220.8664.4170.874
polynomial1.1380.9341.8010.860
RBF0.4280.9970.8510.995
Sigmoid2.5710.8245.1110.832
Table 4. Comparison between Gridsearch CV and MPGA optimization results.
Optimization AlgorithmsOptimal COptimal GammaE1 (μmol·m−2·s−1) 1E2 (μmol·m−2·s−1) 2
GridsearchCV6410.2840.407
MPGA79.2680.9370.1930.280
1 E1 means the absolute deviation of training set, 2 E2 means the absolute deviation of test set.
Table 5. Validation of the photosynthetic rate model for the whole growth period of cucumber on the testing set.
ModelsMAD (μmol·m−2·s−1)MAE (μmol·m−2·s−1)R2
Training
Set
Test
Set
Training
Set
Test
Set
Training
Set
Test
Set
NLR1.9232.3078.79810.1150.8240.707
BPNN0.4700.5342.8503.3530.9970.996
GS-SVR0.3350.4072.3542.8090.9960.997
MPGA-SVR0.2280.2802.0082.4620.9980.998
Disclaimer/Publisher’s Note: The statements, opinions and data contained in all publications are solely those of the individual author(s) and contributor(s) and not of MDPI and/or the editor(s). MDPI and/or the editor(s) disclaim responsibility for any injury to people or property resulting from any ideas, methods, instructions or products referred to in the content.