Article

Effects of Homogenization on Organoleptic Quality and Stability of Pasteurized Milk Samples

Beijing Advanced Innovation Center for Food Nutrition and Human Health, Beijing Technology & Business University, Beijing 100048, China
*
Author to whom correspondence should be addressed.
Agriculture 2023, 13(1), 205; https://doi.org/10.3390/agriculture13010205
Submission received: 22 November 2022 / Revised: 9 January 2023 / Accepted: 9 January 2023 / Published: 13 January 2023
(This article belongs to the Special Issue Sensory Analysis and Evaluation of Agricultural Products)

Abstract

:
The organoleptic quality and stability of pasteurized milk are closely related to consumption choices. Our study investigated the effects of different homogenization pressures on the organoleptic quality and stability of pasteurized milk during shelf life. The three homogenization pressures used in this work were 0, 150, and 300 bar. The three homogenization times were 40 s, 56 s, and 60 s respectively. The sensory quality and stability of pasteurized milk after storage for 8, 72, and 168 h were investigated by sensory description experiment, electronic nose technology, and physical properties (such as stability, color, and particle size). The results showed that, at the same storage time, different homogenization pressures had prominent effects on the creamy, milk, fat, and fresh milk flavors of pasteurized milk, together with different effects on the stability of pasteurized milk. The pasteurized milk samples stored for 8 h under the three homogenization pressures had a good fresh milk flavor, and its strong fat flavor affected the taste. The pasteurized milk samples stored for 72 h under 150-bar homogenization pressure had uniform texture, excellent milk flavor, and delicious taste, and the stability of milk reached the best state. Pasteurized milk samples stored for 168 h under three homogenization pressures had increased metallic, sour, and salty tastes in varying degrees, affecting the flavor quality and stability of milk. In short, the organoleptic quality and stability of pasteurized milk samples stored for 72 h under 150-bar homogenization pressure (ML72) were the most optimal. The results provide a scientific theoretical basis for improving product organoleptic quality and stability, which may inspire a new production strategy to innovate pasteurized milk product. This study examined the impact of different homogenization pressures (0, 150, and 300 bar) on the organoleptic quality and stability of pasteurized milk during shelf life (8, 72, and 168 h).

1. Introduction

Milk, a functional food rich in nutrients and vitamins, has gradually become an indispensable part of the human diet. Due to the rapid pace of modern life and work, pasteurized milk products, as a fast-moving consumer good, have been favored by people. Currently, pasteurization (72–75 °C for 15–16 s or 80–85 °C for 10–15 s) and ultrahigh temperature (UHT) sterilization (135–150 °C for 4–15 s) are common milk sterilization methods used worldwide, including in China [1]. Although UHT-treated milk has a longer shelf life without refrigeration than pasteurized milk, it has more nutrient loss [2]. In comparison, pasteurized milk is processed in a gentle way, which not only kills the pathogenic bacteria in milk but also maximizes the nutritional and flavor properties of fresh milk. However, pasteurization changes the flavor and quality of milk, and the change in quality can affect consumer acceptance [3].
Milk is prone to instability phenomena such as fat floating during processing and storage. To maintain and improve the sensory quality and stability of pasteurized milk, the selection of homogenization pressure is an important step in the milk production process. Homogenization is based on instant expansion and explosion of the liquid by using the high-pressure homogenizing valve in the homogenizer, with the liquid passing through a gap (0.4 mm in diameter) at a speed of 200–300 m/s. In this process, the average diameter of the small particles in the liquid is extruded to reach a value of about 1 micron to form an ideal emulsion. The homogenization pressure decomposes the fat globules into smaller size, which slows the fat-floating phenomenon and thus improves milk stability [4]. Furthermore, homogenization affects the physicochemical properties of dairy products and develops their texture and flavor [5]. The main function of pasteurized milk homogenization is to uniformly distribute milk components, further improving the quality and stability of milk [6]. The improvement of milk quality and stability through homogenization involves two mechanisms: the reduction of fat globule size and the interaction of the fat with the protein matrix [7]. The main purpose of this study was to improve the flavor quality and stability of pasteurized milk products by using a suitable homogenization pressure. For homogenization of pasteurized milk and most dairy products, the pressure is typically in the range of 150–300 bar [8]. The particle size of milk fat globules (MFG) did not increase significantly (p > 0.05) during storage when the homogenization pressure was greater than 300 bar [9]. Therefore, 300 bar was chosen as the homogenization parameter for this experiment. Furthermore, most dairies in China use 100–300 bar as the homogenization pressure for the first stage [10]. Therefore, we chose an intermediate value of 150 bar as the homogenization parameter for this experiment. A 0 bar was chosen as the control parameter. Pasteurized milk is a nutritious product but has a limited shelf life at 5–8 °C (usually only 7 days) [11]. Therefore, 168 h was chosen as the time parameter for this experiment. The shelf life of pasteurized milk is mainly affected by microbes and other factors, and no significant difference is found in microbial load between the pasteurized milk having a shelf life of 24 and 72 h [12]. Therefore, 72 h was chosen as the time parameter for this experiment. The difference in quality between 8 h and 0 h of pasteurized milk storage was not significant. We chose 8 h as the time parameter for this experiment, and 8 h can be used as a control parameter. In this work, three-time points (8, 72, and 168 h) were correspondingly designed to explore the changes in flavor quality and stability of pasteurized milk.
At present, studies on pasteurized milk in the dairy field mainly focus on the changes in microbial counts in pasteurized milk and its nutrition [13,14]. Innovatively, this study investigated the effect of homogenization pressure on the organoleptic quality and stability of pasteurized milk samples during their shelf life. This study could provide a theoretical basis for milk production.

2. Materials and Methods

2.1. Sample Collection

Fresh bovine milk was supplied by Beijing Sanyuan Food Co., Ltd., Beijing, China with a composition of 3.7% (w/w) fat and 3.1% (w/w) protein. The samples were placed in light-proof containers in portable refrigerated boxes. All milk samples were sent to the lab within 2 h and stored at 4 ± 1 °C.

2.2. Preparation of Pasteurized Milk Samples

The milk samples were heated in a water bath at 45 °C for 10 min. The samples were homogenized by using a high-pressure homogenizer (Emusiflex-c3, Avestin, Ottawa, ON, Canada) at 150 and 300 bar, respectively. The nonhomogenized milk served as the blank control group. All the milk samples were heated (85 °C, 15 s) and then stored in a refrigerator (4 ± 1 °C). As shown in Table 1, the samples MC, ML, and MH represented milk treated at homogenization pressures of 0, 150, and 300 bar with different shelf life (8, 72, and 168 h), respectively.

2.3. Sensory Evaluation Group Establishment

Sensory evaluation is a scientific discipline for people to measure, analyze, and interpret the properties of food and raw materials, which are reflected through sight, smell, touch, and hearing. The sensory description method was used to obtain complete sensory details of the product, which can help identify the ingredients, process changes, detailed sensory characteristics, and the differences between products. For the screening of sensory assessors, (1) candidates should have a strong ability to express and describe feelings, be focused and free from outside influences. (2) Candidates should have the ability to attend assessment tests on time and demonstrate honesty and reliability in the workplace [15]. (3) Twelve untrained panelists were given a sensory discrimination test—the triangle test. The panel for the triangle test consisted of three samples with a three-digit random code. Two samples were always the same and one was different. Participants were asked to identify the different samples, to describe the intensity of the differences from slight to extreme, and to indicate some features of the different samples [16]. Lastly, (4) according to the principles and concepts of descriptive analysis technology [17], eight professional food assessors (aged 20–31; 5 women and 3 men; nonsmokers) with high sensory sensitivity and strong expression ability were selected to form the sensory evaluation group.

2.4. Sensory Assessor Training

This experiment was carried out in the dairy sensory evaluation room of the School of Food Health, Beijing Technology and Business University. Sensory evaluators were trained every morning for three weeks. During the first training phase, the sensory assessors tested basic smells and tastes, such as sour, sweet, bitter, salty, fresh, and astringency [18]. In the second phase, we integrated the descriptors generated by each assessor to determine the final descriptor system for pasteurized milk. In the third stage, the sensory panel became familiar with the flavor attributes and texture characteristics of the pasteurized milk samples. In the fourth stage, the scoring tests were conducted on various types of pasteurized milk samples. During the assessment, the assessors were objective and fair, and all descriptive evaluations were based on perceptual intensity rather than personal pleasure responses [19].

2.5. Descriptive Sensory Language for Pasteurized Milk

After strict training, the sensory evaluators could identify the sensory attributes required for pasteurized milk. Before the experiment, the samples were taken out of the refrigerator and placed in a water bath at 37 °C for 10 min to represent the oral temperature. The samples were placed in transparent and odorless plastic cups and numbered randomly. The characteristics and flavor attributes of MC, ML, and MH milk samples with different shelf life (8, 72, and 168 h) were assessed by assessors in separate rooms in terms of sight, smell, and taste using accurate language. Table 2 shows the final reference standard for each attribute.

2.6. Sensory Assessment Experiments

QDA is the most effective method for the sensory assessment of milk [20]. The obtained sensory experimental data were analyzed by using statistical analysis; the PCA and cobweb diagrams were formed to show the final statistical results. The sensory quality of the samples was assessed by using a 9-point preference scoring method. Briefly, the sample attribute standard was 1–9 points (1–2: a small part of this attribute; 2.1–4: weak attribute; 4.1–7: medium attribute; 7.1–8.9: strong attribute; 9: strongest attribute). Each sample was evaluated three times. A higher score indicated a greater contribution of the sensory attribute to the flavor of the sample. Milk, creamy, sweet, and fresh milk flavors were indicated as superior, and other flavors were considered inferior.

2.7. Determination of Volatile Components in Pasteurized Milk Samples by Using an Electric Nose

An electronic nose device (PEN2 portable electronic nose, Win Muster Airsense Analytic Inc., Schwerin, Germany) consisting of 10 metal oxide sensors (W1C, W5S, W3C, W6S, W5C, W1S, W1W, W2S, W2W, and W3S) were used to collect the bionic olfactory information of the sample milk under various homogenization pressures with three different shelf lives (8, 72, and 168 h) (Table 3). The electronic nose system was preprocessed and calibrated by following the manufacturer-specified procedures to ensure detection accuracy. The sample milk (5 mL) and sodium chloride (1 g) were mixed in a 20 mL rubber stopper vial and incubated (40 °C, 10 min) in a magnetic water bath. Next, the air injection needle and sample suction needle were simultaneously inserted into this 20 mL rubber stopper vial for gas adsorption. The needle loading time, the analysis sampling time, the cleaning time of the electronic nose sensor, and the autozero time were 10, 60, 300, and 10 s, respectively. The sensors were cleaned and standardized before and after detection to eliminate the drift phenomenon [21]. The sampling data of the electronic nose was in three time periods (8, 72, and 168 h). Finally, the test results were subjected to CA.

2.8. Colorimetric Analysis of Pasteurized Milk Samples

The colorimeter (CR400, Konica Minolta, Tokyo, Japan) was used to compare the color of milk samples with different fat. In this study, the samples were preheated for 30 min. The color management software CIELAB system was used for color correction. The blackboard was initially calibrated, with the target coverage of φ30 mm CM-AI23, followed by the calibration of the whiteboard, with the target coverage of φ8 mm CM-AI22.
A quartz colorimetric dish (CM-A97, Konica Minolta) was used to calibrate the whiteboard with 3/4 volume-distilled water. After calibration, the L, a, and b values were measured by using a high-pressure homogenizer (EmusiFlex-C3, Avestin) in the order of 0-, 150-, and 300-bar homogenization pressures. Moreover, three sets of parallel values were measured for the samples under each homogenization pressure. The colorimeter software was used for data processing. The total chromatic aberration was calculated by using the following formula:
E * [ ( L * ) 2 + ( a * ) 2 + ( b * ) 2 ]

2.9. Stability Analysis of Pasteurized Milk Samples

The stability of the pasteurized milk was quickly determined by centrifugation. The empty 10-mL centrifuge tube (Huaxia Ruitai Plastic Industry Co., Ltd., Taizhou, China) was marked and weighed. After the addition of 1/3 of the sample, the tube was weighed by using the electronic balance (ALC-210.4, Sartorius, Gttingen, Germany). Next, following sample centrifugation (10 min) in a high-speed-freezing centrifuge (CR22/21N, Hitachi, Tokyo, Japan) to remove the supernatant liquid, the tube was reweighed. We chose a reasonable centrifugal speed, centrifugal time, and correction value, changed the acceleration of particles floating or falling through centrifugal action, and comprehensively judged the product stability in a short time through centrifuges as well as other related instruments. The centrifugal rate was calculated based on the following formula: centrifugal rat = solid mass/sample mass.

2.10. Particle Size Analysis of Pasteurized Milk Samples

The sample milk was stored in a refrigerator (4 ± 1 °C) after different homogenization pressure treatments, which were then taken out at 8, 72, and 168 h, respectively. After heating in a water bath, the sample was well-shaken before detection [22]. The particle size was then analyzed and detected by using the Mastersizer 2000 laser particle size analyzer (Mastersizer 2000, Malvern Panalytic, Malvern, Britain). This fully automatic modular instrument can measure samples through the set standard procedures, eliminating the differences caused by different operators. The instrument adopted the Mie scattering principle. The refractive index was 1.520, the particle absorption rate was 0.1, and the particle size ranged from 0.02 to 2000 microns [23].

2.11. Statistical Analysis

A two-way analysis of variance was used to analyze the results of this study. In addition, the multivariate analysis method (PCA) was performed to evaluate data. Regarding the sensory evaluation consistency and ability, Panelcheck (version 1.3.2, Nofima Mat, Breivika, Ås, Norway) was used for data analyses, and parameters were calculated by using OriginPro 2019 software (OriginLab Corporation, Northampton, MA, USA). The electronic nose (PEN 2, Win Muster Airsense Analytic Inc., Schwerin, Germany) CA diagram analysis was conducted by using SPSS, version 26.0 (IBM SPSS, Chicago, IL, USA). The remaining statistical analyses were performed by using GraphPad Prism software (Prism 7, GraphPad Software, Inc., CA, USA). A p < 0.05 was considered statistically significant.

3. Results and Discussion

3.1. Organoleptic Quality

3.1.1. Consistency and Capacity Assessment of Evaluation Group

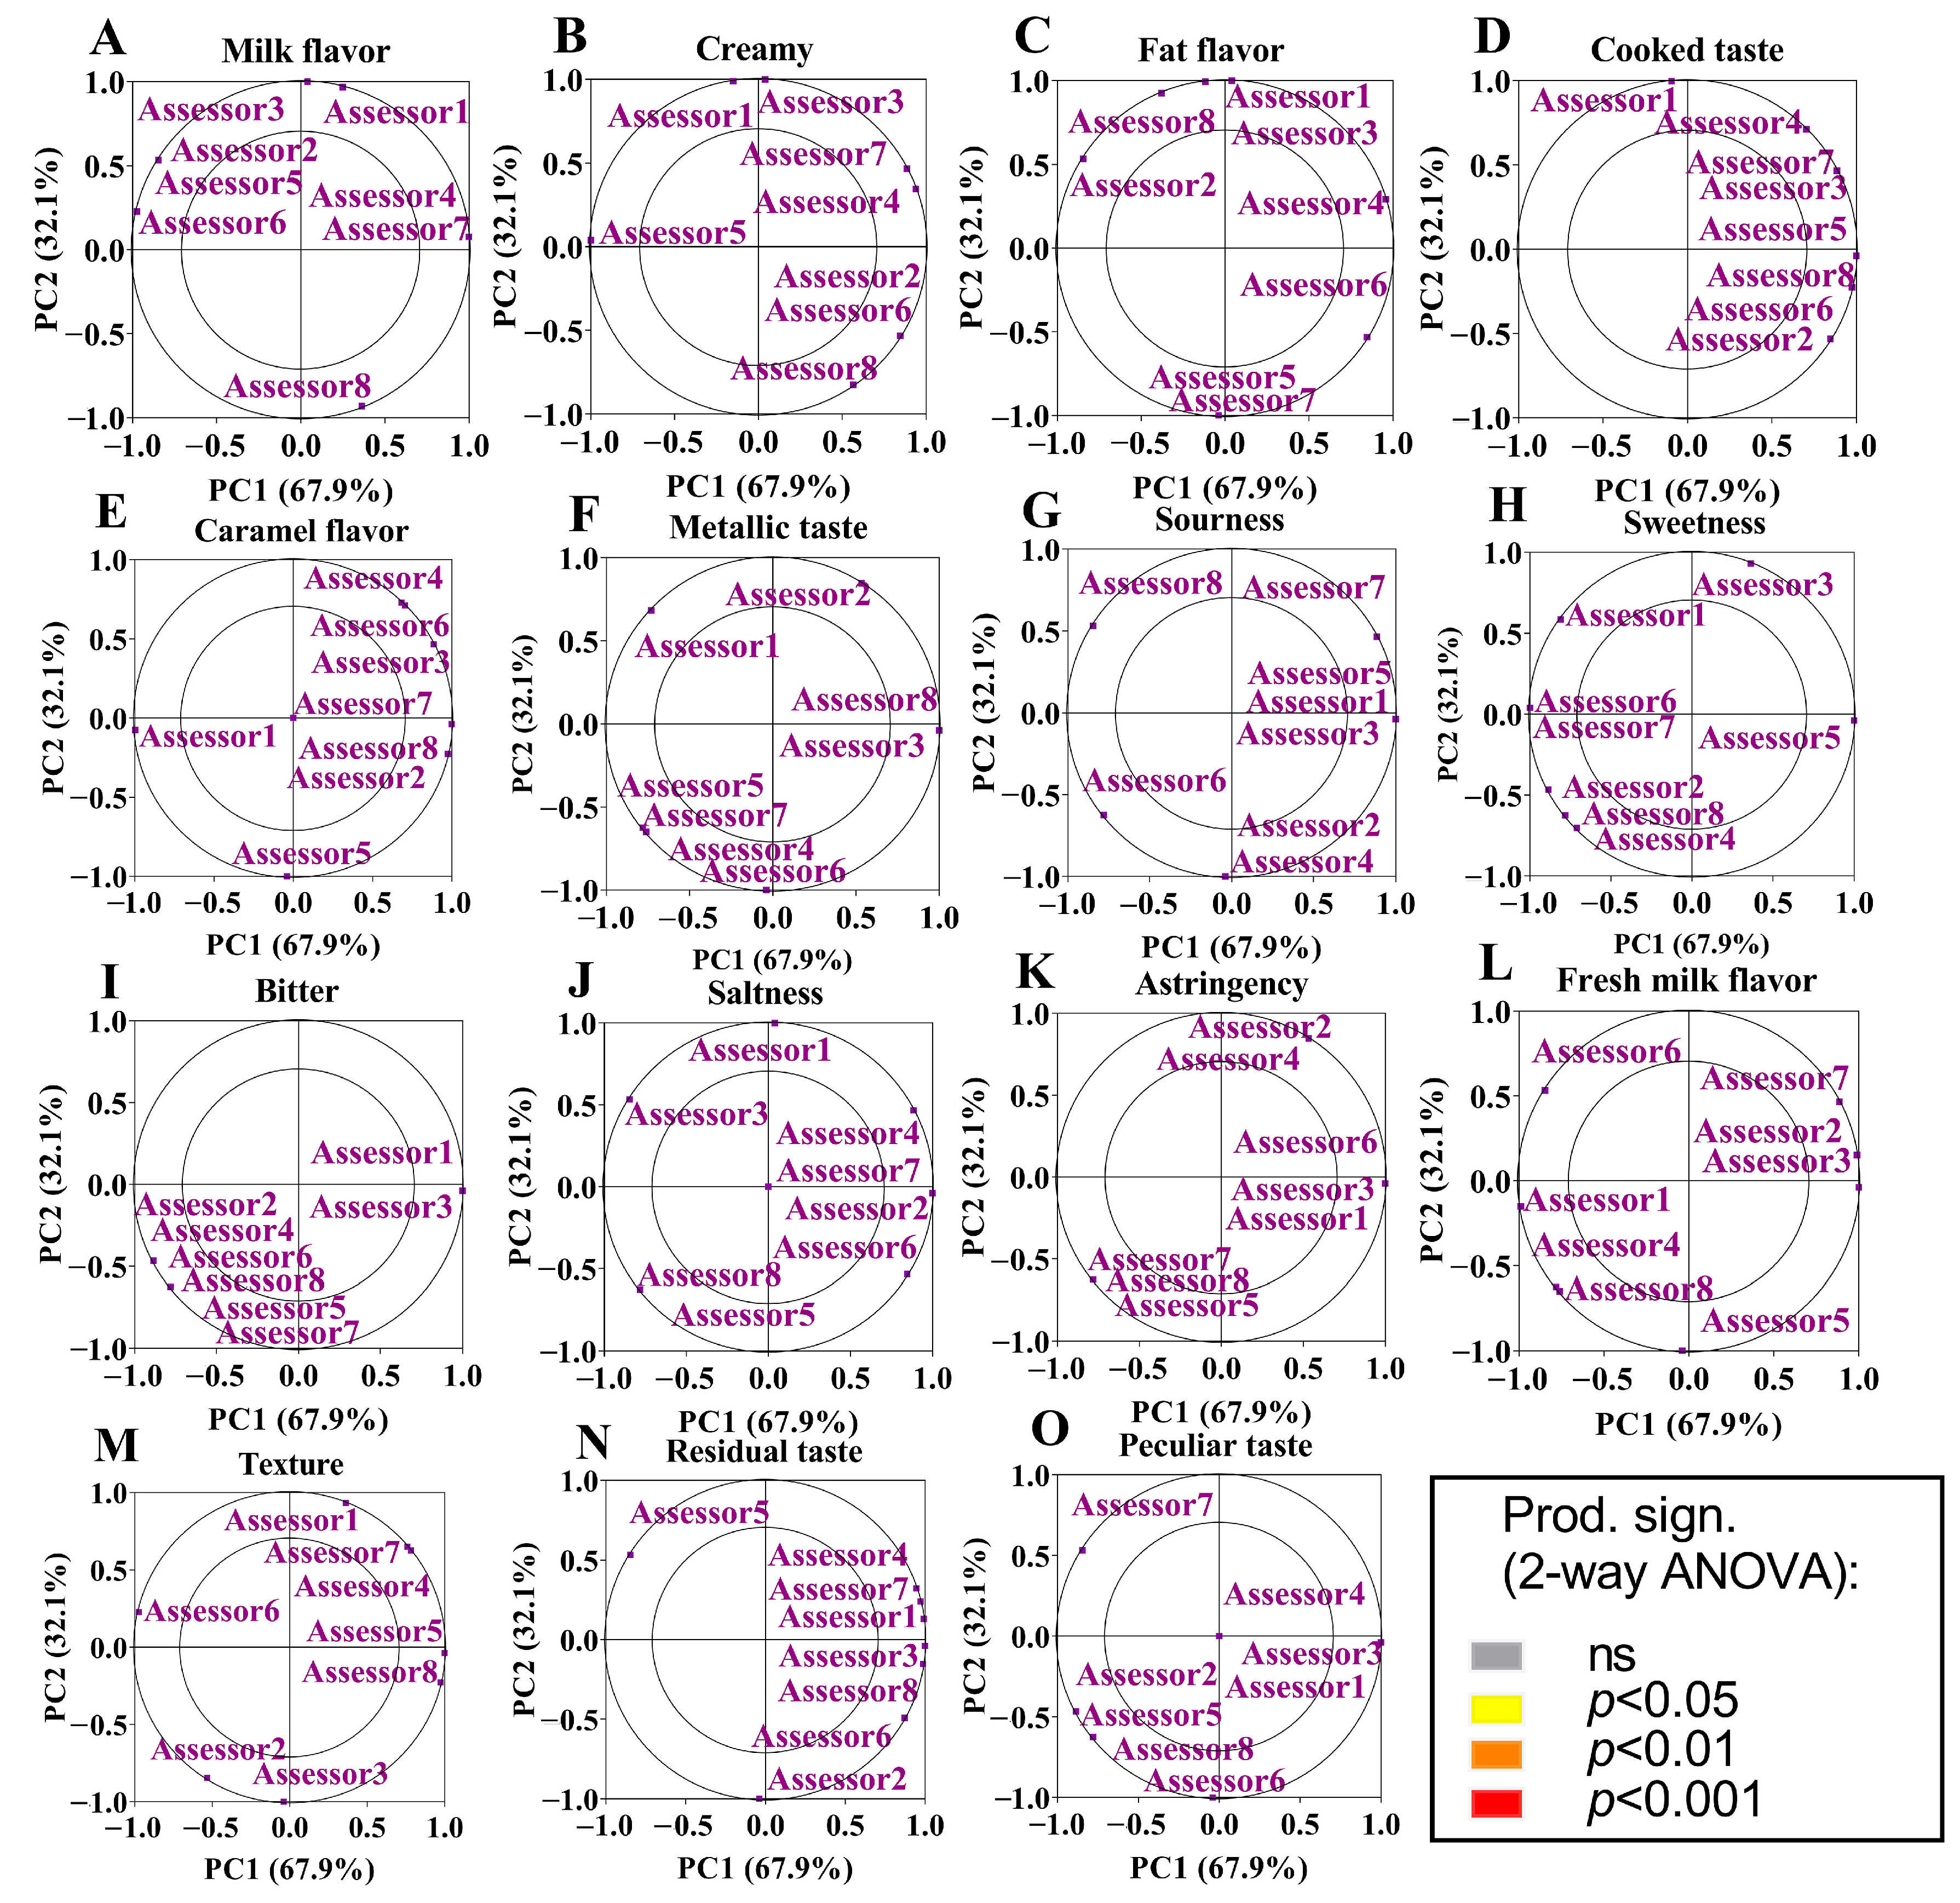
The overall consistency of the group was evaluated by researchers by using the Tucker-1 method, which could reflect their evaluation ability and the consistency of the overall performance for a certain attribute [24], as shown in Figure 1, Figure 2 and Figure 3. Each point represented an assessor, and the inner and outer circles represented 50% and 100% explanatory variance, respectively. The point closer to the outer circle indicated a stronger ability of the assessor to distinguish the attribute of the sample, and a higher degree of point-clustering represented higher consistency of the group in attribute evaluation [25]. The analysis results of samples stored for 8 h are shown in Figure 1A–O; the points representing the 15 sensory attributes were all located on the outer circle but were scattered. For samples stored for 8 h, the scores of the assessors were all on the outer circle and relatively scattered, indicating that the evaluators had high comprehensive evaluation ability for the three groups of samples at this time point (8 h), but the evaluation consistency was relatively general. The analysis results of samples stored for 72 h are shown in Figure 2A–O; it was found that for five sensory attributes, including creaminess (B), fatty flavor (C), caramel flavor (E), metallic taste (F), and saltiness (J), a point of one assessor was not on the outer circle. In addition to these five sensory attributes, all points of the assessors for other attributes were on the outer circle, which were relatively concentrated. This indicated a high degree of consistency in the assessors’ assessment of the three sets of samples stored for 72 h. The analysis results of samples stored for 168 h are shown in Figure 3A–O; for three sensory attributes, including caramel flavor (E), saltiness (J), and peculiar taste (O), one evaluator’s point was not on the circle, and all the points of other sensory attributes were on the outer circle, but they were not well clustered. This indicated the weak evaluation ability of these three assessors; the consistency of the evaluation was not high.

3.1.2. Sensory Evaluation Experiment

PCA and cobweb diagram analysis were performed to obtain a simple and intuitive profile of pasteurized milk constructed by main attributes, which revealed the correlation changes between different samples and attributes. The corresponding results of sensory evaluation data are displayed in Figure 4. The PCA/cobweb diagram analysis results of milk samples stored for 8, 72, and 168 h, respectively, in Figure 4. In the PCA of the principal components (PC), PC1 and PC2 explained more than 90% of the total similarities and differences, providing the explicable differences between different pasteurized milk samples.
The sensory characteristics of pasteurized milk samples stored for 8 h under three homogenization pressures of 0, 150, and 300 bar were different (Figure 4A,B). There was no overall significant difference among the three samples. Combining the PCA and spider web analysis diagrams, it was found that fat flavor made the greatest contributions to the strong flavor of the sample MC8 after comparing the flavor characteristics of the three samples, which might be because the milk fat was not homogenized. The sample MC8 had a low salt content because the milk remained fresh after 8 h, and the microorganisms did not break down or oxidize into perishable impurities [26]. The maturity and emulsified flavor made the largest contributions to sample ML8. Other properties of pasteurized milk sample MH8 were more prominent than sample MC8 while reducing fat flavor, which might be attributed to the decomposition of fat particles into smaller particles under 300-bar homogenization pressure [27]. The creamy and milk flavors of sample MH8 were reduced, which might be caused by the mechanical stress damage to the unsaturated aldehydes and ketones in milk fat [28]. Therefore, the creamy and milk flavors of sample MH8 were inferior to the other two samples in these respects.
The changes in sensory properties of pasteurized milk samples stored for 72 h under three homogenization pressures of 0, 150, and 300 bar. As shown in Figure 4C,D the fat flavor scores improved for all three samples. Moreover, the three samples also showed significantly different textures. Sample MC72 scored higher in terms of sweetness and creaminess, which might be because unsaturated aldehydes and ketones were not destroyed by mechanical stress in the nonhomogenized pasteurized milk samples [28]. At the same time, homogenization affects the degradation of pasteurized milk fat, protein, and lactose, and the decomposition of milk protein produces sweet amino acids [29]. Therefore, the nonhomogenized pasteurized milk samples scored well for both sweetness and creaminess. The scores for the other sensory attributes of the sample MC72 were lower than those of the other two samples. The sample MC72 had the lowest texture score, indicating that the homogenized pasteurized milk sample had better organoleptic properties than the nonhomogenized one. The fat flavor of sample MH72 was slightly increased over that of the sample ML72. At the same time, the caramel taste and astringency of the sample MH72 had higher scores, indicating that with the prolongation of storage time, the overall flavor of the pasteurized milk sample had a downward trend. This showed that the pasteurized milk stored for 168 h was not very popular due to its tendency to decrease in terms of quality and flavor.
The sample ML72 showed the highest texture score, with this attribute contributing the most to it, which might be because it was more homogeneous in structure and prominent in milk flavor and had better stability. The oral texture of food is closely related to the overall food preference [30]. Once placed in the mouth, the food undergoes a complex series of oral processes related to the perceived texture. Texture may influence consumer preferences. Chung reported that Korean consumers’ preference for milk was positively correlated with sweetness, creaminess, and smooth texture [31]. Astringency is a common aftertaste sensation associated with food residue after consumption [30]. The reduction in astringency is directly related to the decrease in the size of the pasteurized milk fat particles [30]. The sample ML72 had the lowest astringency, best texture, and peculiar taste, indicating that homogenization affected the organoleptic properties and flavor profile of pasteurized milk. These findings suggested that pasteurized milk homogenized at 150 bar could retain milk umami better, effectively guaranteeing the fresh milk flavor and quality of milk [28]. In conclusion, the sample ML72 had the best sensory quality.
The sensory properties of pasteurized milk samples on the last day of shelf life (168 h) under three homogenization pressures of 0, 150, and 300 bar (Figure 4E,F). As seen in Figure 4E, the sour taste of MH168 increased on the last day of the shelf life. The sourness of milk is associated with high levels of free fatty acids, especially short-chain fatty acids and medium-chain fatty acids [32]. Homogenization is an effective method by which to impart new flavors to dairy products [32]. Physical actions such as homogenization and stirring can disrupt the milk fat globule membrane, thereby inducing lipolysis [33]. Thus, homogenization can affect the release of fatty acids, which in turn influences the flavor of the product [32].
The sensory changes in the three samples on the last day (168 h) of the shelf life of pasteurized milk (Figure 4F). The sample MC168 was not homogenized, and the fat flavor and creaminess were particularly prominent on the last day of the shelf life. It scored significantly higher than the other two samples in terms of fresh milk flavor and sweetness because the unsaturated aldehydes and ketones were not destroyed. Other attributes contributed similarly to ML168 and MH168, except for sweetness and milk flavor. The sample ML168 had relatively low astringency, saltiness, and cooked taste. Two attributes (cooked and caramel flavors) negatively affect the flavor quality of milk [34]. The cooked taste of sample MH168 significantly improved, which might be due to prolonged storage time.
Overall, the sensory evaluation spider web and PCA diagrams of 168-h samples showed that the flavors of the pasteurized milk under the three homogenization pressure treatments were released better during the last day of the shelf life of the pasteurized milk. At the same time, unpleasant tastes, such as metallic taste, bitterness, sourness, and astringency, also increased in 168-h samples over those of other milk samples. Odors such as bitter and metallic odors typically originate from fat hydrolysates, such as fatty acids and mono- and diglycerides. The short-chain fatty acids in these products, such as butyric acid and caproic acid, cause unpleasant odors [34]. Proteolysis of milk during storage can also lead to the accumulation of small peptides leading to the development of bitter taste and astringency [35]. The results showed that the sensory quality of the pasteurized milk samples was significantly worse on the last day of the shelf life. Thus, the sensory quality and stability of the sample MH168 need further improvement.
To sum up, by analyzing the differences in pasteurized milk under different homogenization pressures and comparing the data of PCA and cobweb diagram, it could be concluded that the homogenization storage time of 72 h under 150-bar pressure (sample ML72) was the most suitable in terms of the sensory quality and stability of pasteurized milk.

3.1.3. Electronic Nose Data Results

One of the methods for sensory analysis is to use an electronic nose. The device consists of a series of chemical gas sensors that measure volatile compounds in the headspace of the sample [36]. In principle, both electronic and human noses work by sensing many components simultaneously, resulting in specific response patterns [37]. The electronic nose assesses volatile mixtures released from samples with the advantage of being nondestructive and reliable [38,39]. Therefore, the electronic nose can be a potential tool with which to differentiate the flavor intensity of pasteurized milk.
CA is a dimensionality-reduction method by which to reduce information loss by finding representative variables among multiple variables; many variables are replaced with a small number of representative variables. The response values of the 10 sensors of the electronic nose were used as variables. The electronic nose CA diagram of pasteurized milk under different homogenization pressures is given in Figure 5. The CA results of pasteurized milk stored for 8, 72, and 168 h are shown in Figure 5. Numbers 1, 2, 3, 4, and 5 represented nonhomogenized pasteurized milk samples; numbers 6, 7, 8, 9, and 10 depicted pasteurized milk samples under 150-bar homogenization pressure; and numbers 11, 12, 13, 14, and 15 denoted pasteurized milk samples under 300-bar homogenization pressure. Results showed that the 10 pasteurized milk sensors treated under different homogenization pressures responded differently at different times. The nonhomogenized pasteurized milk and the pasteurized milk homogenized at 150-bar pressure were first brought together in Figure 5A. The pasteurized milk samples homogenized at 300 bar could be distinguished from it. It showed that the distinction between homogenized and nonhomogenized pasteurized milk samples was not apparent when the storage time was 8 h because it was relatively short. It could be speculated that the amount of homogenization pressure played a role in the flavor of pasteurized milk samples. The pasteurized milk samples subjected to homogenization at 150 and 300 bar were first brought together in Figure 5B,C. Nonhomogenized pasteurized milk samples could be distinguished from them. This indicated that with the increasing pressure of homogenization, the flavor of pasteurized milk samples exhibited obvious differences. This is because under the effect of homogenization, as the homogenization pressure increases, the interaction of each component in the milk enhances, resulting in physical and chemical changes, maximizing the volatilization of richer flavor substances, and developing its texture and flavor [5]. For example, the oxidation reaction of milk fat promoted the release of fatty acids in milk, increased the content of acidic compounds, contributed to the esterification of free fatty acids and alcohol substances to generate esters, and the β-oxidation of milk fat caused secondary molecules such as ketones and production of tertiary oxidation products [40]. The flavor-related fatty acids in milk are mainly free fatty acids. Butyric acid, capric acid, and pelargonic acid are acid-type volatile flavor compounds uniquely produced after heating and homogenization and have a strong milk flavor at low concentrations [41]. Esters can impart good flavors such as fruity and floral flavors to milk [31]. This suggested that the sensory quality of pasteurized milk improved to a certain extent after homogenization. The results showed that the 10 pasteurized milk sensors treated at different homogenization pressures responded differently at different times. The organoleptic quality of homogenization pressure-treated pasteurized milk was better than that of pasteurized milk without homogenization treatment.

3.2. Physical Properties

3.2.1. Color

The color of food is one of the main factors that affect consumers’ food choices, which not only directly reflects food maturity and freshness but is also a vital indicator of food safety and consumer attractiveness. Some studies have pointed out that better color and whiteness are important factors for milk drinkers to prefer milk [42]. Sensory whiteness is an important factor in distinguishing milk with different fat levels [42]. The whiteness of milk is related to natural pigments, such as protein, riboflavin, and carotenoids. The flavor of pasteurized milk comes from various reactions during homogenization or storage, which can affect color [42]. The purpose of homogenization is to give the emulsion a homogeneous structure by breaking down the large fat globules in the milk into smaller ones. The size of the emulsion particles affects the milk color. The color of the milk varies depending on the particle size in milk due to different homogenization pressures. A previous study has pointed out that milk with low carotenoid content and high protein and riboflavin contents is usually whiter [43]. According to the color analysis results of pasteurized milk samples under different homogenization pressures (Table 4), pasteurized milk treated at different homogenization pressures exhibited various degrees of color change.
CIE-L*, a*, and b* color system was used to calibrate the pasteurized milk samples. The larger the L* value, the greater the whiteness and brightness of the sample and vice versa. The a* value indicates the red and green color components in the sample; the larger the a* value, the more reddish is the sample, and vice versa. The b* value denotes that the sample is yellowish, and vice versa [44]. The L* value has a greater effect on the milk color difference, and the change in brightness mainly causes the sensory color change in milk [44]. In addition, the L* value is related to the state and particle size of casein. The yellowness of milk is closely related to the fat content. A high milk fat content leads to an increase in the b* index of milk, making milk more yellow in color; however, the redness decreases with the increase in fat content [44]. The homogenization pressure may affect the presence of milk fat and cause the content to change, and other components such as the content of casein, riboflavin, and carotenoids can also affect the total color difference to a certain extent [43]. The effect of homogenization on the color of pasteurized milk samples is greater than that for nonhomogenized ones due to the smaller size and larger number of fat globules produced by homogenization, thus reflecting more light from fat and casein micelles [45].
The L* value indicating whiteness of pasteurized milk samples homogenized at 150 bar was high, whereas that of the sample homogenized at 300 bar was low in Table 4. This can be due to the fact that the higher homogenization pressure disrupts the fat globule membrane and causes the fat globules to contact each other, increasing the fat globule diameter and turbidity and affecting the whiteness and brightness of the samples. In addition, pasteurization is a mild form of sterilization that does not destroy all microorganisms. The change in color of pasteurized milk during its shelf life may also be caused by microorganisms as the storage period increases.
The color of pasteurized milk does not change much at different shelf-life values, and it is difficult to see significant differences with the naked eye. The red and yellow parameters of the milk changed less as the shelf life was extended. This may result from the reduced fat content in the milk due to oxidation as the storage period of the pasteurized milk samples is extended. It can be seen from Table 4 that the redness and yellowness of sample ML72 did not change markedly, with a relatively little total color change difference. Therefore, the color of sample ML72 pasteurized milk could be considered ideal.

3.2.2. Stability

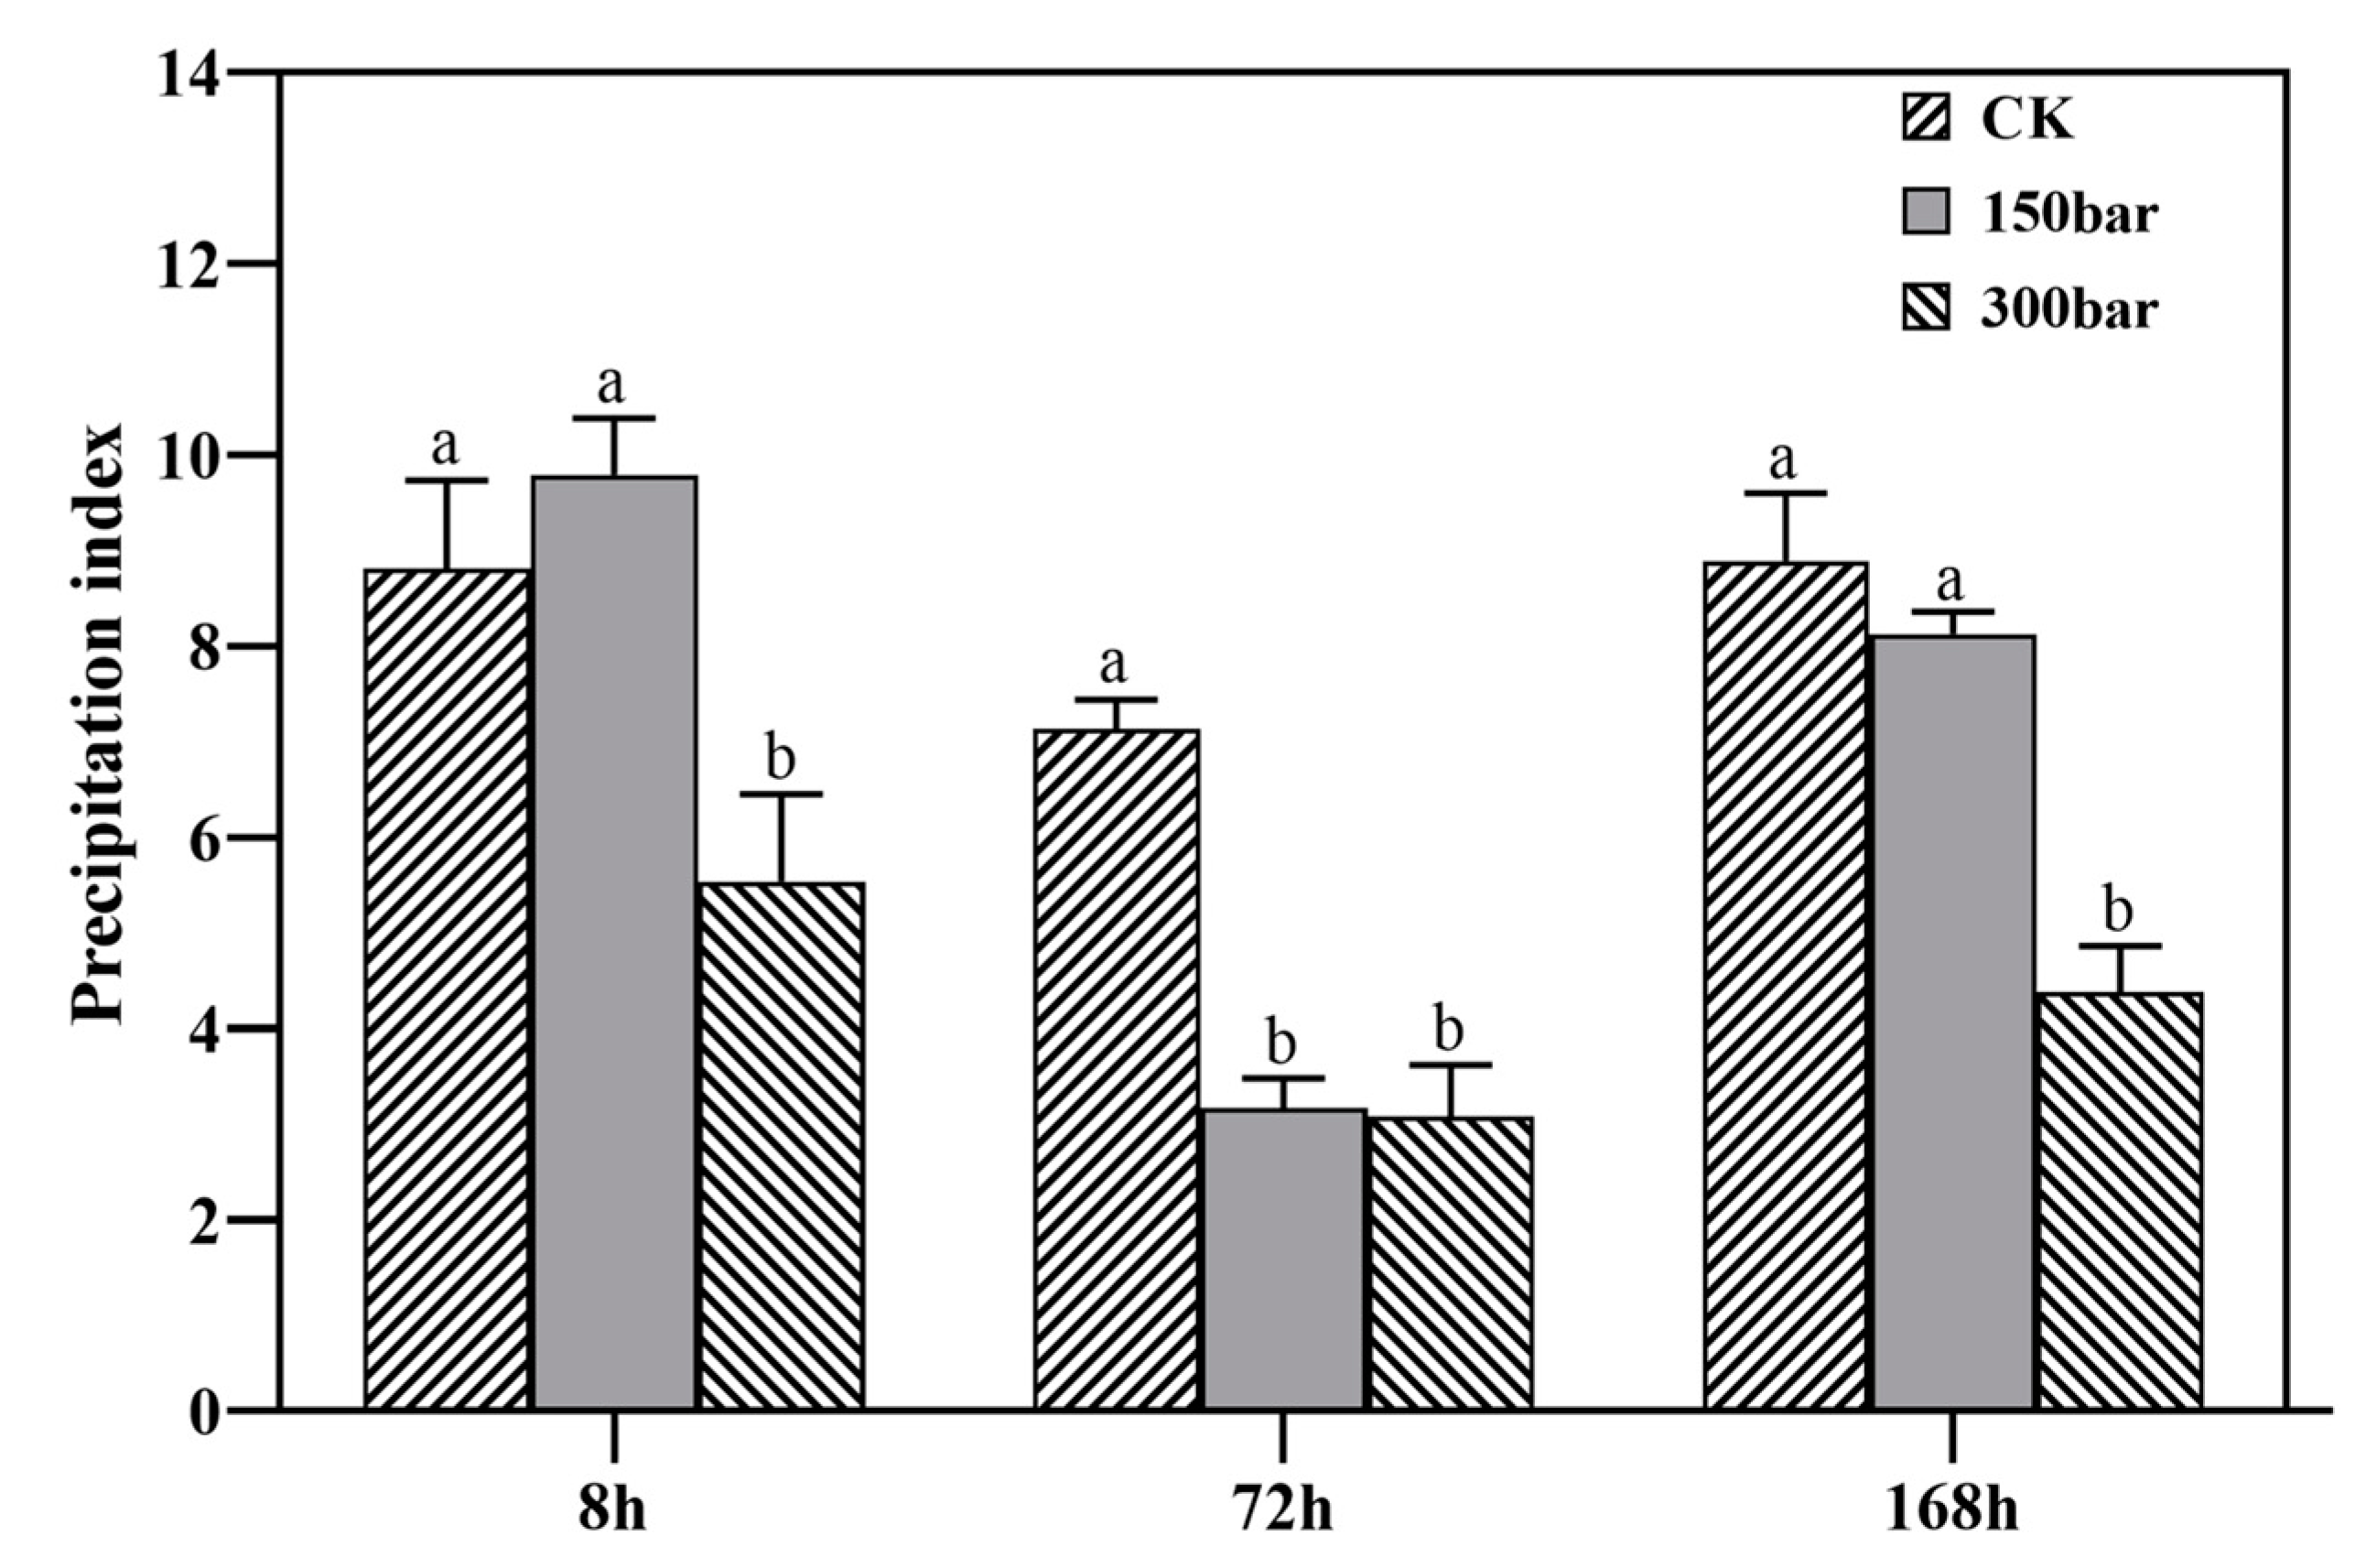
Milk is usually homogenized and heat-treated to reduce the size of fat globules and microbial load, increasing the stability of milk [46,47]. The high milk fat content and the large diameter of the fat globules make it easy for instability issues such as fat floating to occur during storage. To minimize these phenomena during production, the homogenization pressure needs to be strictly controlled. Homogenization pressure can make the fat globules smaller and slow down the fat floating, thus improving milk stability [48]. When the homogenization pressure reaches a certain level, the energy consumption increases sharply, and the homogenization efficiency increases slowly [48]. Due to the smaller particle size of the fat globules with increased homogenization pressure, the surface area increases. Thus, the thickness, strength, and product stability of the new interface film are reduced [49]. In Figure 6, the stability of pasteurized milk treated with different ho-mogenization pressures for three time periods (8, 72, and 168 h). The stability of pasteurized milk on the last day of shelf life at 150-bar homogenizing pressure decreased with increasing storage time in Figure 6. There was little difference between the stability of pasteurized milk stored at 300-bar homogenizing pressure for 72 h and 168 h. The stability of pasteurized milk at different homogenizing pressures for 8 h was good, but the shelf life was short. Therefore, pasteurized milk with a shelf life of 72 h at a homogenization pressure of 150 bar was more stable. By homogenizing milk, the fat globules become smaller, triglycerides are released, and the surface of the fat film becomes rough and uneven, which leads to better interaction between fat and casein and ultimately increases stability [50].
Homogenization pressure significantly affected the flavor and stability of pasteurized milk. Results showed that the emulsions were slightly more stable after passing through the high-pressure homogenizer and had good physical stability [51]. The flavor stability of pasteurized milk improved as the homogenization pressure increased and its fat globule size decreased. Manufacturers of pasteurized milk should continually evaluate the effectiveness of homogenization and use this process to stabilize the emulsion system to improve their product stability [51].

3.2.3. Particle Size

In the process of milk storage, the fat globules undergo irregular Brownian motion, resulting in the fusion of fat globules and the formation of larger fat globules. The floating phenomenon of fat ultimately affects the quality and stability of the product [4]. Fat is an important component of milk. The content and form of fat greatly influence the quality of pasteurized milk. The commonly used method to reduce the diameter of fat globules is homogenization. The effect of cavitation makes the large fat globules in milk smaller, which considerably slows down the fat floating phenomenon in the process of milk storage and affects other physicochemical properties of pasteurized milk [4]. In this study, the particle size of pasteurized milk samples treated with different homogenization pressures was analyzed by using Mastersizer 2000.
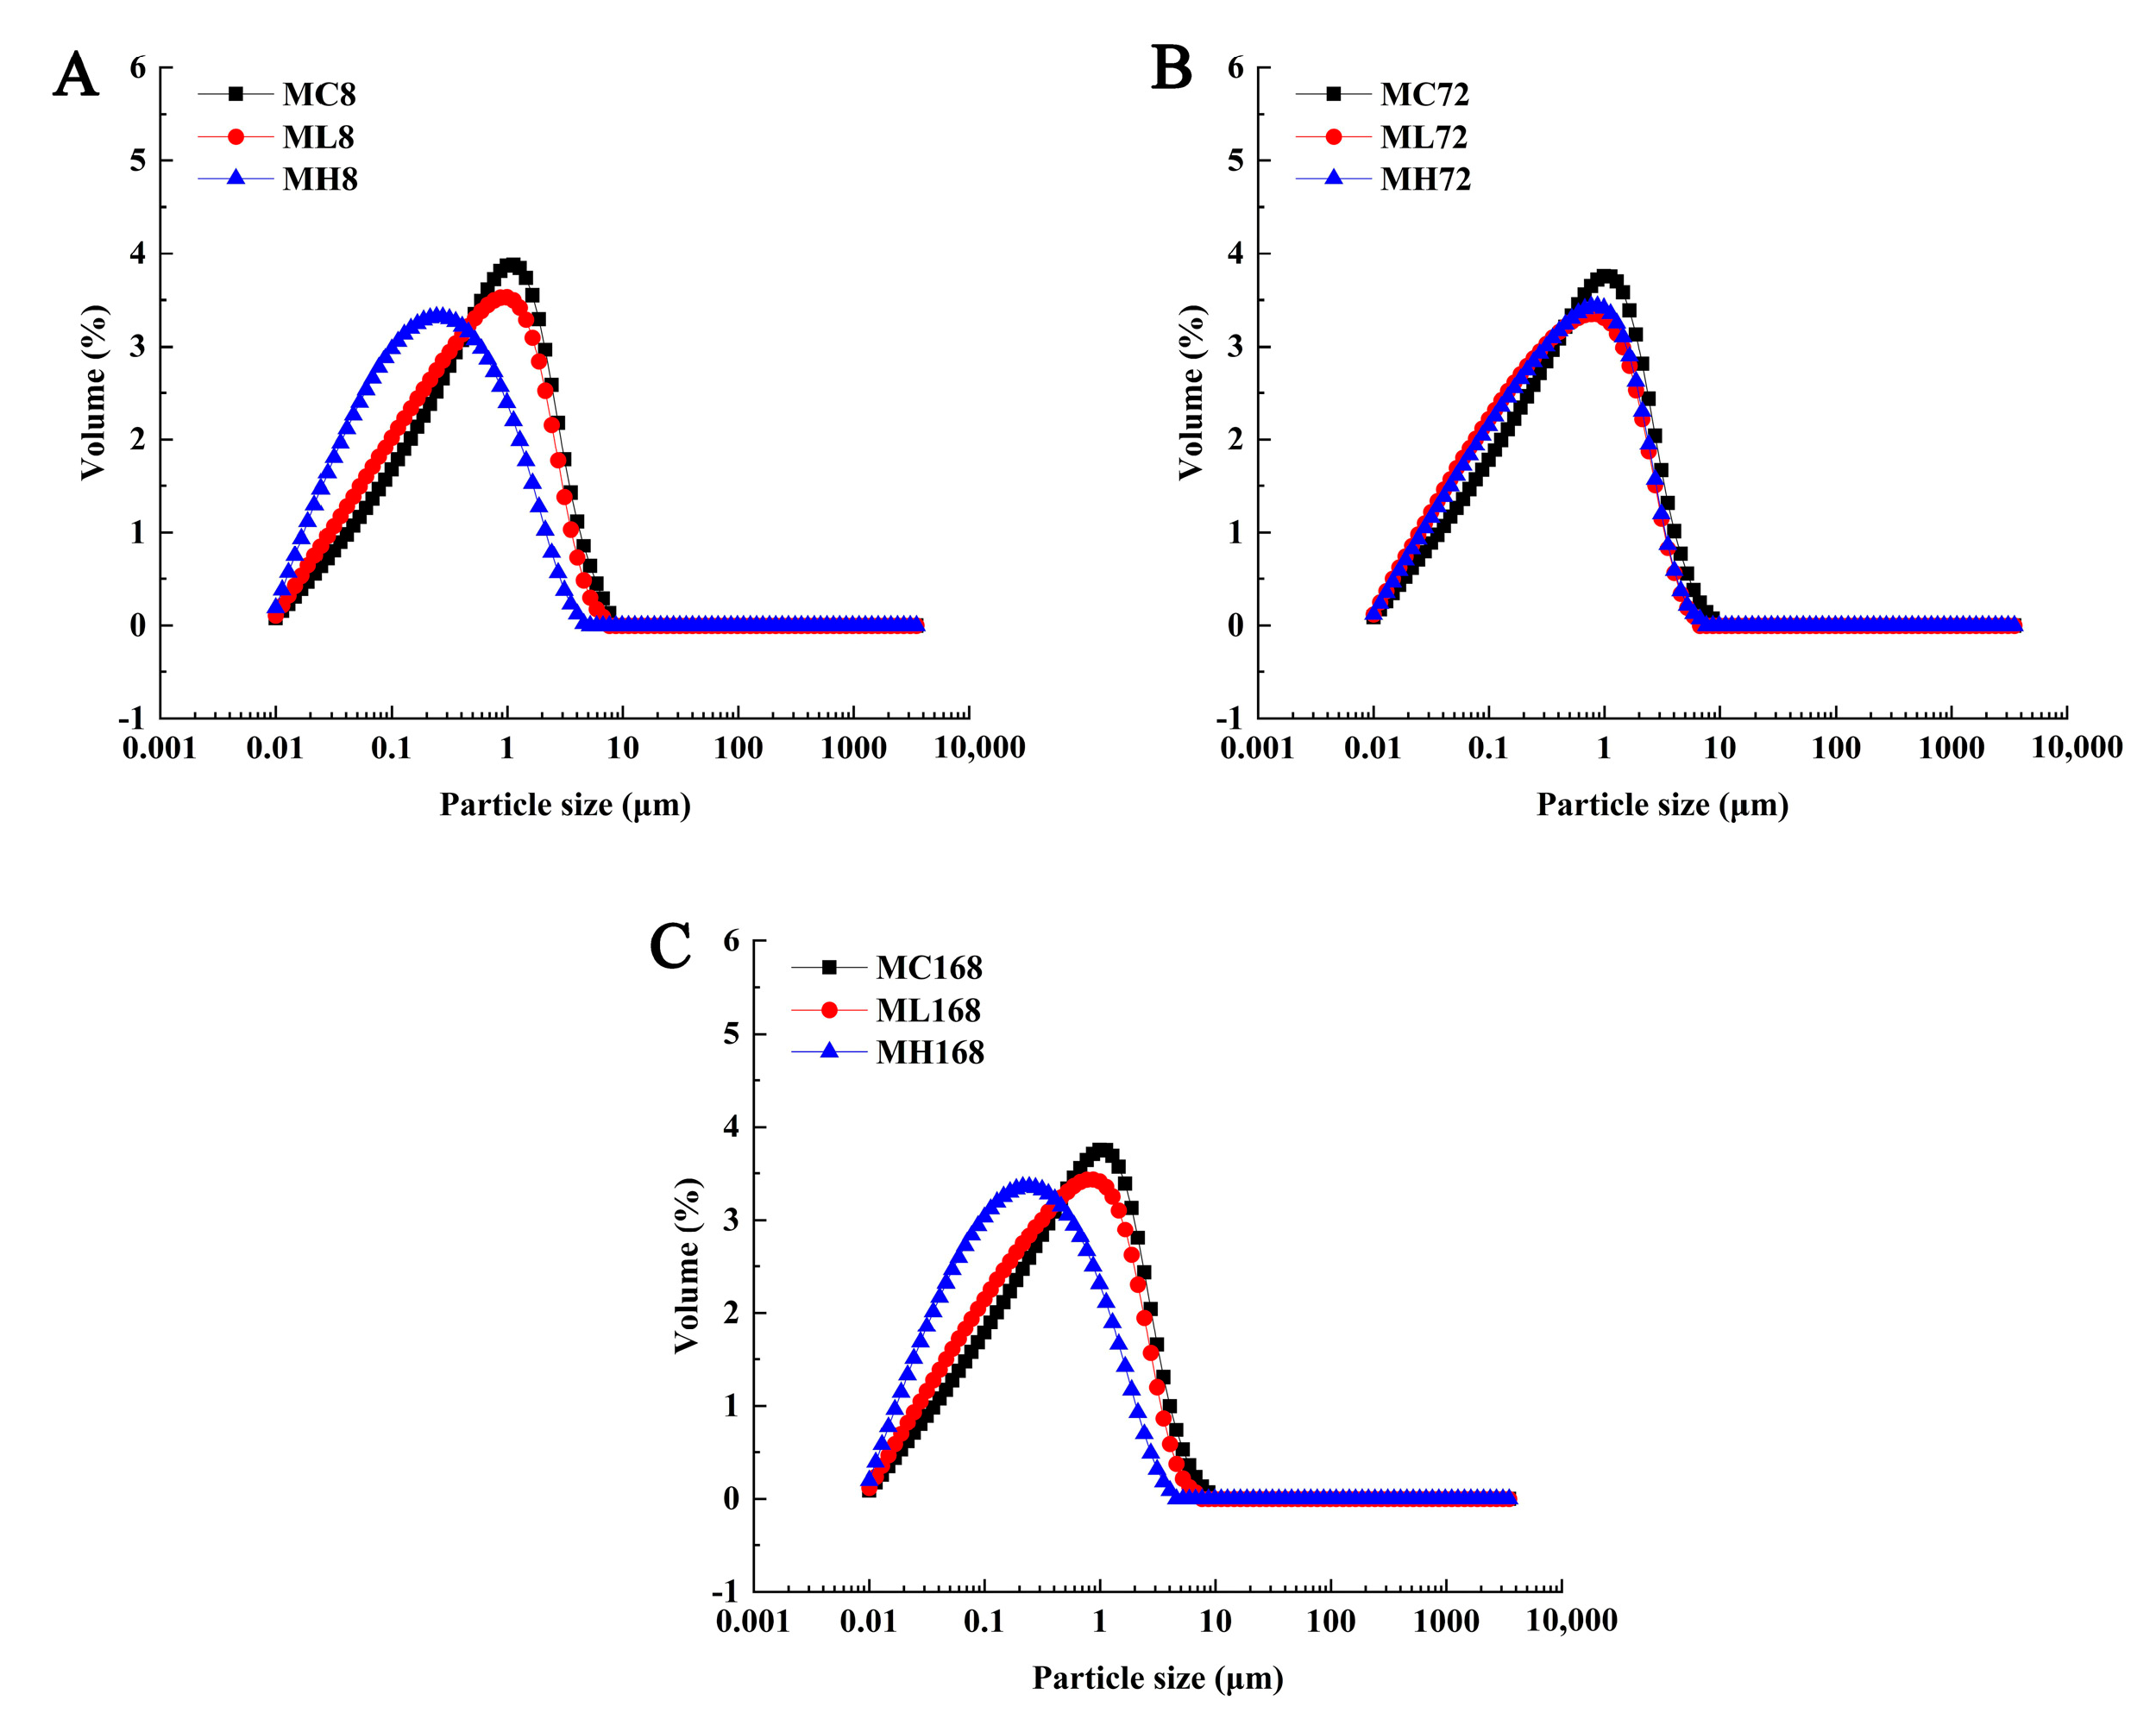
Milk is an emulsion discontinuously dispersed in water, where water is the continuous phase and proteins and fats are the dispersed phases. The particle size and particle size distribution of the emulsion can affect the solubility, stability, and organoleptic properties of milk proteins. The particle sizes of the samples stored for 8, 72, and 168 h are shown in Figure 7. The particle size of milk was mainly 0.01–9 μm, and the maximum volume peak was 1.5 μm. The particle size distribution of milk with different storage times was similar. With the increase in homogenization pressure, the position of volume peak gradually moved to the left; particles smaller than 0.5 μm increased, and those larger than 0.5 μm decreased. Figure 7 show the decrease and increase in large and small particles, respectively. The reason may be that the oxidative breakdown of fat in cow’s milk leads to a decrease in large particles and an increase in small particles. The increase in small particle size is conducive to the dispersion of milk particles and improves the emulsion solubility. The presence of particles with excessive particle size in the system increases the instability of milk [6]. As can be seen from Figure 7A,B, the difference in particle size of pasteurized milk samples stored for 8 and 72 h at homogenization pressures of 0 and 150 bar is not significant, and the maximum volume peak of the particle size of these two samples slowly moved to the left. The particle size of sample milk with a different shelf life under 300-bar homogenization pressure was significantly smaller than that under the other two homogenization pressures.
The purpose of homogenization was to decompose the large milk fat globules into smaller ones under strong mechanical action, which could effectively prevent oil from floating up and improve product stability [52]. As shown in Table 5, the D [3,2] (average particle size in terms of surface area) and D [4,3] (average particle size in terms of volume) of the milk fat globules decreased with the increase in the homogenization pressure and the values of DV10, DV50, and DV90 also decreased, with basically the same decreasing trend. There were few differences in the particle size of pasteurized milk with the same homogenization pressure treatment at different time points. As shown in Table 5, D [3,2] and D [4,3] of samples stored for 72 h and 168 h were 0.095 and 0.449, respectively, under 300-bar homogenization pressure, and the stability of sample milk was the same at these times. The particle size of sample stored for 72 h under 150-bar pressure (D [3,2] = 0.133; D [4,3] = 0.762) was smaller than that of the sample stored for 168 h (D [3,2] = 0.138; D [4,3] = 0.792). It was obvious that the sample ML72 (pasteurized milk under 150-bar homogenization pressure with 72 h shelf life) had the smallest particle size and the best stability.

4. Conclusions

In our study, the pressure homogenization of pasteurized milk was carried out at 0, 150, and 300 bar. Through descriptive sensory experiments, electronic nose technology, color, particle size, and stability tests, the sensory quality and stability of pasteurized milk at 8, 72, and 168 h were tested. Results showed that the homogenization pressure had different effects on the sensory flavor and stability of pasteurized milk simultaneously during the shelf life. The nonhomogenized pasteurized milk stored for 8 h had a strong fatty taste, which affected the taste. The sensory flavor and stability of pasteurized milk that was stored for 72 h and homogenized at 150-bar pressure reached the best state; the liquid was uniform, and the stability was good, which maintained the umami and quality of the milk. The organoleptic flavor and stability of the pasteurized milk stored for 168 h and homogenized under pressure at 300 bar decreased due to the increase in unpleasant tastes, such as metallic, sour, and salty tastes, on the last day of the shelf life. The results of the e-nose study showed that the sensory flavor and stability of homogenized pressure-treated pasteurized milk was significantly better than that of nonhomogenized pasteurized milk. The variation in ∆E for sample ML72 pasteurized milk was relatively small. Sample ML72 homogenized pasteurized milk had the best stability with improved flavor and stability. The results of the particle size study showed that sample ML72 had the smallest particle size and the best stability. Our study combined human senses and electronic nose technology to account for the subjective error during human sensory evaluation. While studying the flavor quality of pasteurized milk, its physical properties were also discussed. Thus, this study can help in improving the flavor quality and stability of pasteurized milk and provide technical support to select a reasonable homogenization pressure during its production process.

Author Contributions

Conceptualization, N.A., Y.S. and Y.Y.; methodology, Y.S. and Y.X.; software, Y.S.; validation, N.A. and Y.S; formal analysis, Y.S. and T.Z.; investigation, Y.Y.; resources, Y.S.; data curation, Y.S. and T.Z.; writing-original draft preparation, Y.S.; writing, review and editing, Y.S.; visualization, Y.S.; supervision, N.A.; project administration, N.A. All authors have read and agreed to the published version of the manuscript.

Funding

This work was supported by a grant from the National Natural Science Foundation of China (32272460) and the Beijing Outstanding Young Scientist Program (BJJWZYJH01201910011025).

Institutional Review Board Statement

Not applicable.

Data Availability Statement

The original contributions presented in the study are included in the article. Further inquiries can be directed to the corresponding authors.

Acknowledgments

We would like to acknowledge the reviewers for their helpful comments on this paper.

Conflicts of Interest

The authors declare no conflict of interest.

References

  1. Birlouez-Aragon, I.; Sabat, P.; Gouti, N. A new method for discriminating milk heat treatment. Int. Dairy J. 2002, 12, 59–67. [Google Scholar] [CrossRef]
  2. Karlsson, M.A.; Langton, M.; Innings, F.; Malmgren, B.; Höjer, A.; Wikström, M.; Lundh, Å. Changes in stability and shelf-life of ultra-high temperature treated milk during long term storage at different temperatures. Heliyon 2019, 5, e02431. [Google Scholar] [CrossRef] [PubMed] [Green Version]
  3. Li, Y.H.; Zhang, L.W.; Wang, W.J.; Han, X. Differences in particle characteristics and oxidized flavor as affected by heat-related processes of milk powder. J. Dairy Sci. 2013, 96, 4784–4793. [Google Scholar] [CrossRef] [Green Version]
  4. D’Incecco, P.; Rosi, V.; Cabassi, G.; Hogenboom, J.A.; Pellegrino, L. Microfiltration and ultra-high-pressure homogenization for extending the shelf-storage stability of UHT milk. Food Res. Int. 2018, 107, 477–485. [Google Scholar] [CrossRef] [PubMed]
  5. Sfakianakis, P.; Tzia, C. Conventional and innovative processing of milk for yogurt manufacture; development of texture and flavor: A review. Foods 2014, 3, 176–193. [Google Scholar] [CrossRef]
  6. Xiong, Y.L.; Aguilera, J.M.; Kinsella, J.E. Emulsified milkfat effects on rheology of acid-induced milk gels. J. Food Sci. 1991, 56, 920–925. [Google Scholar] [CrossRef]
  7. Sodini, I.; Remeuf, F.; Haddad, S.; Corrieu, G. The relative effect of milk base, starter, and process on yogurt texture: A review. Crit. Rev. Food Sci. Nutr. 2004, 44, 113–137. [Google Scholar] [CrossRef]
  8. Wilbey, R.A. Homogenization of milk: Principles and mechanism of homogenization, effects and assessment of efficiency: Valve homogenizers. In Reference Module in Food Science; Elsevier: Amsterdam, The Netherlands, 2016; pp. 1–5. [Google Scholar]
  9. Ren, Q.; Li, Q.; Liu, H.; Ma, Y. Thermal and storage properties of milk fat globules treated with different homogenisation pressures. Int. Dairy J. 2020, 110, 104725. [Google Scholar] [CrossRef]
  10. Lu, C.; Wang, G.; Li, Y.; Zhang, L. Effects of homogenisation pressures on physicochemical changes in different layers of ultra-high temperature whole milk during storage. Int. J. Dairy Technol. 2013, 66, 325–332. [Google Scholar] [CrossRef]
  11. Abdel-Aziz, M.E.D.; Darwish, M.S.; Mohamed, A.H.; El-Khateeb, A.Y.; Hamed, S.E. Potential activity of aqueous fig leaves extract, olive leaves extract and their mixture as natural preservatives to extend the shelf life of pasteurized buffalo mil. Foods 2020, 9, 615. [Google Scholar] [CrossRef]
  12. Limbo, S.; Pellegrino, L.; D’Incecco, P.; Gobbi, S.; Rosi, V.; Fracassetti, D. Storage of pasteurized milk in clear PET bottles combined with light exposure on a retail display case: A possible strategy to define the shelf life and support a recyclable packaging. Food Chem. 2020, 329, 127116. [Google Scholar] [CrossRef] [PubMed]
  13. Woldemariam, H.W.; Am, A. Microbial and physicochemical qualities of pasteurized milk. J. Food Process. Technol. 2017, 8, 651. [Google Scholar] [CrossRef]
  14. Ansari, J.A.; Ismail, M.; Farid, M. Extension of shelf life of pasteurized trim milk using ultraviolet treatment. J. Food Saf. 2020, 40, e12768. [Google Scholar] [CrossRef]
  15. Stone, H.; Sidel, J.; Oliver, S.; Woolsey, A.; Singleton, R.C. Sensory evaluation by quantitative descriptive analysis. In Descriptive Sensory Analysis in Practice; Food & Nutrition Press, Inc.: Malden, MA, USA, 2004; pp. 23–34. [Google Scholar]
  16. Klimanova, Y.; Polzonetti, V.; Pucciarelli, S.; Perinelli, D.R.; Bonacucina, G.; Cespi, M.; Gabrielli, M.G.; Santini, G.; Fioretti, L.; Cognigni, L.; et al. Effect of steam frothing on milk microfoam: Chemical composition, texture, stability and organoleptic properties. Int. Dairy J. 2022, 135, 105476. [Google Scholar] [CrossRef]
  17. Stone, H.; Bleibaum, R.N.; Thomas, H.A. Chapter 6—Descriptive Analysis. In Sensory Evaluation Practices, 4th ed.; Academic Press: San Diego, CA, USA, 2012; pp. 233–289. [Google Scholar]
  18. Liu, X.W. A comparative study on the method of evaluating the sensory quality of strawberry. Food R D 2018, 8, 20–23+47. [Google Scholar] [CrossRef]
  19. Puri, R.; Khamrui, K.; Khetra, Y.; Malhotra, R.; Devraja, H.C. Quantitative descriptive analysis and principal component analysis for sensory characterization of Indian milk product cham-cham. J. Food Sci. Technol. 2016, 53, 1238–1246. [Google Scholar] [CrossRef] [Green Version]
  20. Zhang, S.; Yang, R.; Zhao, W.; Hua, X.; Zhang, W.; Zhang, Z. Influence of pulsed electric field treatments on the volatile compounds of milk in comparison with pasteurized processing. J. Food Sci. 2011, 76, C127–C132. [Google Scholar] [CrossRef]
  21. Tan, J.; Xu, J. Applications of electronic nose (e-nose) and electronic tongue (e-tongue) in food quality-related properties determination: A review. Artif. Intell. Agric. 2020, 4, 104–115. [Google Scholar] [CrossRef]
  22. Lu, N.; Wang, J.; Chen, Z.; Zhang, X.; Chen, C.; Wang, S. The effect of adding phospholipids before homogenization on the properties of milk fat globules. LWT 2021, 146, 111659. [Google Scholar] [CrossRef]
  23. Kuntsche, J.; Klaus, K.; Steiniger, F. Size determinations of colloidal fat emulsions: A comparative study. J. Biomed. Nanotechnol. 2009, 5, 384–395. [Google Scholar] [CrossRef]
  24. Kermit, M.; Lengard, V. Assessing the performance of a sensory panel–panellist monitoring and tracking. J. Chemom. 2005, 19, 154–161. [Google Scholar] [CrossRef]
  25. Liu, L.L.; Dong, H.; Shi, Y.G. Study on the evaluation method of the quality of dried bean curd. Sci. Technol. Food Ind. 2011, 32, 420–423. [Google Scholar] [CrossRef]
  26. Lanza, B.; Amoruso, F. Panel performance, discrimination power of descriptors, and sensory characterization of table olive samples. J. Sens. Stud. 2020, 35, e12542. [Google Scholar] [CrossRef]
  27. Leksrisompong, P.; Gerard, P.; Lopetcharat, K.; Drake, M. Bitter taste inhibiting agents for whey protein hydrolysate and whey protein hydrolysate beverages. J. Food Sci. 2012, 77, S282–S287. [Google Scholar] [CrossRef] [PubMed]
  28. Fuchsmann, P.; Stern, M.T.; Brügger, Y.A.; Breme, K. Olfactometry profiles and quantitation of volatile sulfur compounds of swiss tilsit cheeses. J. Agric. Food Chem. 2015, 63, 7511–7521. [Google Scholar] [CrossRef]
  29. Ai, N.S.; Liu, H.L.; Wang, J.; Zhang, X.M.; Zhang, H.J.; Chen, H.T.; Huang, M.Q.; Liu, Y.G.; Zheng, F.P.; Sun, B.G. Triple-channel comparative analysis of volatile flavour composition in raw whole and skim milk via electronic nose, GC-MS and GC-O. Anal. Methods 2015, 7, 4278–4284. [Google Scholar] [CrossRef]
  30. Li, Y.; Joyner, H.S.; Carter, B.G.; Drake, M.A. Effects of fat content, pasteurization method, homogenization pressure, and storage time on the mechanical and sensory properties of bovine milk. J. Dairy Sci. 2018, 101, 2941–2955. [Google Scholar] [CrossRef]
  31. Cheng, N.; Barbano, D.M.; Drake, M. Effects of milk fat, casein, and serum protein concentrations on sensory properties of milk-based beverages. J. Dairy Sci. 2019, 102, 8670–8690. [Google Scholar] [CrossRef]
  32. Chen, X.; Wang, J.; Stevenson, R.J.; Ang, X.; Peng, Y.; Quek, S.Y. Lipase-catalyzed modification of milk fat: A promising way to alter flavor notes of goat milk products. LWT 2021, 145, 111286. [Google Scholar] [CrossRef]
  33. Wiking, L.; Løkke, M.M.; Kidmose, U.; Sundekilde, U.K.; Dalsgaard, T.K.; Larsen, T.; Feilberg, A. Comparison between novel and standard methods for analysis of free fatty acids in milk-Including relation to rancid flavour. Int. Dairy J. 2017, 75, 22–29. [Google Scholar] [CrossRef]
  34. Cadwallader, K.R.; Singh, T.K. Flavours and Off-Flavours in Milk and Dairy Products. In Advanced Dairy Chemistry: Volume 3: Lactose, Water, Salts and Minor Constituents; Springer: New York, NY, USA, 2009; pp. 631–690. [Google Scholar]
  35. Santos, M.V.; Ma, Y.; Caplan, Z.; Barbano, D.M. Sensory threshold of off-flavors caused by proteolysis and lipolysis in milk. J. Dairy Sci. 2003, 86, 1601–1607. [Google Scholar] [CrossRef] [PubMed] [Green Version]
  36. Gardner, J.W.; Bartlett, P.N. A brief history of electronic noses. Sensor. Actuat. B-Chem. 1994, 18, 210–211. [Google Scholar] [CrossRef]
  37. Haugen, J.E.; Kvaal, K. Electronic nose and artificial neural network. Meat Sci. 1998, 49, S273–S286. [Google Scholar] [CrossRef]
  38. Echeverría, G.; Correa, E.; Ruiz-Altisent, M.; Graell, J.; Puy, J.; López, L. Characterization of Fuji apples from different harvest dates and storage conditions from measurements of volatiles by gas chromatography and electronic nose. J. Agric. Food Chem. 2004, 52, 3069–3076. [Google Scholar] [CrossRef]
  39. Zhang, H.; Wang, J.; Tian, X.; Yu, H.; Yu, Y. Optimization of sensor array and detection of stored duration of wheat by electronic nose. J. Food Eng. 2007, 82, 403–408. [Google Scholar] [CrossRef]
  40. Buchin, S.; Delague, V.; Duboz, G.; Berdague, J.L.; Beuvier, E.; Pochet, S.; Grappin, R. Influence of pasteurization and fat composition of milk on the volatile compounds and flavor characteristics of a semi-hard cheese. J. Dairy Sci. 1998, 81, 3097–3108. [Google Scholar] [CrossRef]
  41. Chen, L.; Daniel, R.M.; Coolbear, T. Detection and impact of protease and lipase activities in milk and milk powders. Int. Dairy J. 2003, 13, 255–275. [Google Scholar] [CrossRef]
  42. Zhao, X.; Cheng, M.; Wang, C.; Jiang, H.; Zhang, X. Effects of dairy bioactive peptides and lotus seeds/lily bulb powder on flavor and quality characteristics of goat milk yogurt. Food Biosci. 2022, 47, 101510. [Google Scholar] [CrossRef]
  43. Solah, V.A.; Staines, V.; Honda, S.; Limley, H.A. Measurement of milk color and composition: Effect of dietary intervention on Western Australian Holstein-Friesian cow’s milk quality. J. Food Sci. 2007, 72, S560–S566. [Google Scholar] [CrossRef]
  44. McDermott, A.; Visentin, G.; McParland, S.; Berry, D.P.; Fenelon, M.A.; De Marchi, M. Effectiveness of mid-infrared spectroscopy to predict the color of bovine milk and the relationship between milk color and traditional milk quality traits. J. Dairy Sci. 2016, 99, 3267–3273. [Google Scholar] [CrossRef]
  45. Cheng, N.; Barbano, D.M.; Drake, M.A. Effect of pasteurization and fat, protein, casein to serum protein ratio, and milk temperature on milk beverage color and viscosity. J. Dairy Sci. 2019, 102, 2022–2043. [Google Scholar] [CrossRef]
  46. Lucey, J.A. Cultured dairy products: An overview of their gelation and texture properties. Int. J. Dairy Technol. 2004, 57, 77–84. [Google Scholar] [CrossRef]
  47. Tamime, A.Y.; Robinson, R.K. Tamime and Robinson’s Yoghurt, 3rd ed.; Woodhead Publishing: Cambridge, UK, 2007; pp. 83–108. [Google Scholar]
  48. Park, C.W.; Drake, M. The effect of homogenization pressure on the flavor and flavor stability of whole milk powder. J. Dairy Sci. 2017, 100, 5195–5205. [Google Scholar] [CrossRef] [PubMed] [Green Version]
  49. Tribst, A.A.L.; Falcade, L.T.P.; Carvalho, N.S.; Junior, B.R.d.C.L.; de Oliveira, M.M. Using stirring and homogenization to improve the fermentation profile and physicochemical characteristics of set yogurt from fresh, refrigerated and frozen/thawed sheep milk. LWT 2020, 130, 109557. [Google Scholar] [CrossRef]
  50. Juttulapa, M.; Piriyaprasarth, S.; Takeuchi, H.; Sriamornsak, P. Effect of high-pressure homogenization on stability of emulsions containing zein and pectin. Asian J. Pharm. Sci. 2017, 12, 21–27. [Google Scholar] [CrossRef]
  51. Kashaninejad, M.; Razavi, S.M.A. Influence of thermosonication treatment on the average size of fat globules, emulsion stability, rheological properties and color of camel milk cream. LWT 2020, 132, 109852. [Google Scholar] [CrossRef]
  52. Hayes, M.G.; Kelly, A.L. High pressure homogenisation of raw whole bovine milk (a) effects on fat globule size and other properties. J. Dairy Res. 2003, 70, 297–305. [Google Scholar] [CrossRef]
Figure 1. Checking the consistency of sensory evaluation group using Tucker-1 analysis for milk samples stored for 8 h. There were eight assessors and 15 flavors in total. (A) Milk flavor; (B) Creamy; (C) Fat flavor; (D) Cooked taste; (E) Caramel flavor; (F) Metallic taste; (G) Sourness; (H) Sweetness; (I) Bitter; (J) Saltness; (K) Astringency; (L) Fresh milk flavor; (M) Texture; (N) Residual taste; (O) Peculiar taste. A p < 0.05 was considered statistically significant.
Agriculture 13 00205 g001
Figure 2. Checking the consistency of sensory evaluation group using Tucker-1 analysis for milk samples stored for 72 h. There were eight assessors and 15 flavors in total. (A) Milk flavor; (B) Creamy; (C) Fat flavor; (D) Cooked taste; (E) Caramel flavor; (F) Metallic taste; (G) Sourness; (H) Sweetness; (I) Bitter; (J) Saltness; (K) Astringency; (L) Fresh milk flavor; (M) Texture; (N) Residual taste; (O) Peculiar taste. A p < 0.05 was considered statistically significant.
Agriculture 13 00205 g002
Figure 3. Checking the consistency of sensory evaluation group using Tucker-1 analysis for milk samples stored for 168 h. There were eight assessors and 15 flavors in total. (A) Milk flavor; (B) Creamy; (C) Fat flavor; (D) Cooked taste; (E) Caramel flavor; (F) Metallic taste; (G) Sourness; (H) Sweetness; (I) Bitter; (J) Saltness; (K) Astringency; (L) Fresh milk flavor; (M) Texture; (N) Residual taste; (O) Peculiar taste. A p < 0.05 was considered statistically significant.
Agriculture 13 00205 g003
Figure 4. Principal component Analysis (PCA) diagram and spider web diagram of pasteurized milk. MC, 0-bar pressure-homogenized pasteurized milk; ML, 150-bar pressure-homogenized pasteurized milk; and MH, 300-bar pressure-homogenized pasteurized milk. PCA of 8-h samples (A). Cobweb plot of 8-h sample sensory attributes (B). PCA of 72-h samples (C). Cobweb plot of 72-h sample sensory attributes (D). PCA of 168-h samples (E). Cobweb plot of 168-h sample sensory attributes (F).
Agriculture 13 00205 g004
Figure 5. Cluster analysis (CA) of pasteurized milk. Labels 1, 2, 3, 4, and 5 represent the control sample milk. Labels 6, 7, 8, 9, and 10 represent the homogenized sample milk at 150-bar pressure. Labels 11, 12, 13, 14, and 15 represent the homogenized sample milk at 300-bar pressure. Cluster analysis (CA) of 8-h pasteurized milk (A). CA of 72 h pasteurized milk (B). CA of 168-h pasteurized milk (C).
Agriculture 13 00205 g005
Figure 6. Analysis of the stability of pasteurized milk treated with different homogenization pressures at different time points. a-b represented the significant difference (p < 0.05) between groups.
Agriculture 13 00205 g006
Figure 7. Analysis of particle size of milk samples stored for 8 h under three homogenization pressures (A). Analysis of particle size of milk samples stored for 72 h under three homogenization pressures (B). Analysis of particle size of milk samples stored for 168 h under three homogenization pressures (C).
Agriculture 13 00205 g007
Table 1. Different homogenization pressures and storage time of pasteurized milk samples.
Homogenization Time8 h72 h168 h
Homogenization Pressure
0 barMC8MC72MC168
150 barML8ML72ML168
300 barMH8MH72MH168
Table 2. Descriptive sensory language for pasteurized milk.
Sensory AttributesEvaluation Method
Milk flavorAfter tasting, the intensity of residual milk flavor.
CreamyOil scent.
Fat flavorAfter tasting, the intensity of fat feeling in the mouth.
Cooked tasteHave a slight taste of feed, carton, iron pot boiled water taste
Caramel flavorThe flavor produced by heating or cooking.
Metallic tasteTaste of rust-like metal, tasting whether the sample has a metallic smell.
SournessThe intensity of sourness was felt in the mouth.
SweetnessAfter tasting, the intensity of residual sweetness.
BitterBitter taste after preservation at room temperature.
SaltnessThe intensity of salt was felt in the mouth. Slight salt should exist in the optimum sample.
AstringencyAfter processing and storage produced astringent taste, tongue slightly bitter feeling.
Fresh milk flavortaste intensity from oral to MSG.
TextureWhether the sample is a uniform liquid, and whether there is a clot or precipitation.
Residual tasteAfter tasting, the greasy feeling remains on the tongue and upper teeth.
Peculiar tasteUnpleasant taste, the greater the odor, the higher the score, normal milk will not taste.
Table 3. Sensor properties of PEN3 electronic nose.
Sensor Number
in Array Sensor
GeneralDescriptionReference
(mL/m3)
S1W1CSensitive to aromatic constituentsC7H8, 10
S2W5SHigh sensitivity to nitrogen oxidesNO2, 1
S3W3Csensitive to aromatic componentsC6H6, 10
S4W6SSelectivity to hydrogenH2, 100
S5W5CSensitive to aromatic compoundsC3H8, 1
S6W1SSensitiveto methane and hydrocarbonsCH4, 100
S7W1WSensitive to sulfidesH2S, 1
S8W2SSensitive to ethanolCO, 100
S9W2WSensitive to sulfides and chloridesH2S, 1
S10W3SSensitive to methaneCH4, 100
Table 4. Effect of different homogenization pressures on milk chromaticity at each treatment time.
Homogeneous ParametersL*a*b*∆E
8 h
CK58.22 ± 0.02 b0.94 ± 0.00 a16.89 ± 0.01 ab0.14 ± 0.02 ab
150 bar47.74 ± 0.13 d0.67 ± 0.02 c17.05 ± 0.13 a0.32 ± 0.16 a
300 bar49.52 ± 0.01 c0.80 ± 0.01 b16.82 ± 0.01 b0.07 ± 0.01 b
72 h
CK59.05 ± 0.54 a0.90 ± 0.03 a16.13 ± 0.04 c0.31 ± 0.17 a
150 bar50.08 ± 0.07 b0.89 ± 0.01 a16.97 ± 0.01 a0.14 ± 0.07 a
300 bar49.96 ± 0.06 b0.86 ± 0.01 a16.82 ± 0.02 b0.21 ± 0.05 a
168 h
CK59.23 ± 0.19 a0.76 ± 0.04 a16.11 ± 0.10 b0.36 ± 0.20 b
150 bar52.42 ± 0.08 c0.69 ± 0.02 b15.88 ± 0.04 c0.53 ± 0.09 b
300 bar50.39 ± 0.06 d0.79 ± 0.01 a16.50 ± 0.03 a0.10 ± 0.03 b
Note: L* means whiteness, a* means redness, b* means yellowness, and ∆E means total color difference. Different superscript letters in the same column data indicate significant differences (p < 0.05).
Table 5. Particle size distribution data under different storage times and homogenization pressures.
Homogenization ParametersSurveillance Project
D [3,2]D [4,3]Dv(10)Dv(50)Dv(90)
8 h0 bar0.1841.0510.0700.6222.600
150 bar0.1480.8560.0540.4752.200
300bar0.0970.4710.0350.2261.25
72 h0 bar0.1711.0030.0640.5752.507
150 bar0.1330.7620.0480.4022.000
300bar0.0950.4490.0350.2161.190
168 h0 bar0.1700.9940.0630.5712.483
150 bar0.1380.7920.0500.4262.057
300 bar0.0950.4490.0350.2161.193
Note: D [3,2] is the average particle size in terms of surface area; D [4,3] is the average particle size in terms of volume. Dv10 is the number of milk fat globules with a diameter below this value accounting for 10% of the whole; Dv50 is the number of milk fat globules with a diameter below this value accounting for 50% of the whole; and Dv90 is the number of milk fat globules with a diameter lower than this value, accounting for 90% of the whole.
Disclaimer/Publisher’s Note: The statements, opinions and data contained in all publications are solely those of the individual author(s) and contributor(s) and not of MDPI and/or the editor(s). MDPI and/or the editor(s) disclaim responsibility for any injury to people or property resulting from any ideas, methods, instructions or products referred to in the content.