Article

Effects of Barley- and Oat-Based Diets on Some Gut Parameters and Microbiota Composition of the Small Intestine and Ceca of Broiler Chicken

1
Institute of Physiology and Nutrition, Department of Animal Nutrition and Nutritional Physiology, Georgikon Campus, Hungarian University of Agriculture and Life Sciences, Deák Ferenc Street 16, 8360 Keszthely, Hungary
2
Regional Center for Food and Feed, Agricultural Research Center, Giza 12619, Egypt
3
Agrofeed Ltd., Duna Kapu Square 10, 9022 Győr, Hungary
4
Institute of Mathematics and Basic Science, Georgikon Campus, Hungarian University of Agriculture and Life Sciences, Deák Ferenc Street 16, 8360 Keszthely, Hungary
*
Author to whom correspondence should be addressed.
Agriculture 2023, 13(1), 169; https://doi.org/10.3390/agriculture13010169
Submission received: 16 December 2022 / Revised: 5 January 2023 / Accepted: 6 January 2023 / Published: 9 January 2023

Abstract

:
Barley and oats can be alternatives of corn and wheat in poultry nutrition and used at higher inclusion rates. Both cereals contain hulls, a structural fiber source, that can be beneficial for the gizzard function of birds. They also contain high amounts of β-glucans, of which about 60–70% is water soluble. Soluble β-glucans increase gut viscosity, impair digestion, and modify gut microbiota. The aim of this trial was to evaluate the effects of feeding oats and barley at high inclusion rates and with exogenous glucanase on some relevant gut parameters and the microbiota composition of jejunum content (JC), jejunum mucosa (JM), and cecal content (CC). A total of 360 male, Ross 308 broiler chickens were allocated randomly into three treatment groups of 5 replicate pens with 24 chickens. Beside a corn and soybean meal-based control diet (C), a barley (B)- and oat (O)-based treatment was used. In all feeding phases, barley was fed at 40, while oats at 20% inclusion rate. At day 40, 10 birds per treatment were slaughtered and gut viscosity, the cecal short chain fatty acid (SCFA) concentration, and the microbiota composition of the different gut parts determined. In spite of the glucanase enzyme addition, the barley-based diet significantly increased the viscosity of the ileal content and this was also the diversity of the bacteriota in the small intestine. On the other hand, this treatment decreased the microbial diversity in the ceca and resulted in lower SCFA contents. Barley increased the abundance of the phyla Bacteroidetes and decreased that of Firmicutes and some of them genera in the JC and CC. Oats had only a slight effect on the measured parameters. The results highlight the importance of also taking into account the soluble fiber fractions of the feedstuffs in diet formulation and to adapt the exogenous enzyme supplementation of to the actual soluble fiber contents.

1. Introduction

Compared with maize, barley and oats are more resistant to abiotic stresses, such as drought or high temperature and can be alternatives of both maize and wheat in the future. However, both grains are rich in insoluble and soluble non-starch polysaccharides (NSPs). The insoluble fiber of oats and barley are related to the hulls of the grain. Although insoluble fiber is not digestible for poultry, the structural properties of hulls can stimulate the gizzard and enhance the energy utilization and protein digestion of birds [1]. Several studies have proven, for example, the positive effects of oat hull supplementation of broiler diets [2].The soluble NSP in barley and oats are mainly β-glucans containing 1–3 and 1–4 linkages and represent about 60–70% of the total beta-glucans [3]. This NSP fraction, due to its unique physicochemical properties, increases digesta viscosity, slows the passage rate, and this way impairs the digestibility of nutrients and the performance of chickens [4,5]. The decreased digestion results in more substrates for the gut bacteria, causing increased bacterial content and modified bacteriota composition in the jejunum and ileum. β-glucans, on the other hand, can improve the immunity of pigs and poultry [6,7]. They also have antioxidant potential prebiotic effect in the hind gut segments [8].
To eliminate the negative effects of the soluble NSP fractions, β-glucanase supplementation of diets is a common practice in the nutrition of farm animals. Previous studies described that enzyme supplementation increased weight gain, apparent metabolizable energy, and fat digestibility. As well as its positive effect on the production parameters, β-glucanase may reduce the weight of the gut [9,10]. Nevertheless, the exact mechanism behind the positive effects of NSP-degrading enzymes is not fully clarified yet [11,12].
Because of their hulls, oats and barley are also rich in cellulose and contain less starch and protein than wheat [13]. Certain amounts of structural insoluble fiber in poultry diets stimulates gizzard function and can also improve the growth and feed conversion of broilers or the incidence of cannibalism in laying hens [14,15,16]. Carre et al. (1990) found, however, that high ratio of oat hulls decrease the metabolizable energy content of broiler diets and impair the feed conversion ratio [17]. At limited inclusion rates, however, structural fiber can improve the digestion of starch, enhance the performance of the chickens, and reduce the cannibalism in laying hens [14,15,16]. Denayrolles et al. (2007) and Dunkley et al. (2007) found that mostly the fiber characteristics, its soluble and insoluble fraction, affect the bacterial profile of the gut [18,19]. There are quite a lot of research results available on the effects of arabinoxylans (AX) on the gut microbiota composition. We know that AX and xylan-oligosaccharides (XOS), the products of arabinoxylans after xylanase breakdown, have positive effects on the bacteriota composition of the caeca, increasing the number of butyrate producing bacteria, such as Lachnospiraceae or Ruminococcaceae [20]. Donaldson et al. (2021) published recently that the latest rye varieties can also be competitive feedstuffs of maize and wheat. In their trial, feeding rye increased the absorptive surface of the small intestine in broiler chickens [21].
The aim of the present study was to investigate the effects of barley- and oat-based broiler diets on the gut characteristics and microbiota composition. The two grains were used at higher inclusion rates (barley—40%; oats—20%) than the common practice. In addition to the gut contents, the bacteriota composition of the ileum mucosa was also involved into the measured parameters.

2. Materials and Methods

2.1. Diets and Experimental Design

A total of 360 male broiler chickens (Ross 308) were included in a feeding experiment, obtained from a commercial hatchery (Gallus Ltd., Devecser, Hungary). The day-old chickens were transported to the experimental farm (Institute of Physiology and Nutrition, Hungarian University of Agriculture and Life Sciences, Georgikon Campus, Keszthely, Hungary) and randomly allocated into 15 floor pens of 24 chickens per pen. The study design consisted of 3 dietary treatments with 5 replicate pens.
Aside from a maize–soybean-based control diet (C), diets containing 40% barley (B) or 20% oats (O) were used. The nutrient content of the oats and barley is shown in Table 1.
Starter diets were fed until day 10 in mash form, while the grower (11–24 days) and finisher feeds (25–40 days) as pellets. Feed and water were available ad libitum. The diets were isoenergetic and isonitrogenous, and their nutrient content covered the requirements of the Ross 308 broiler chickens (Aviagen, Huntsville, AL, USA, 2018) [23]. The composition and nutrient content of the experimental diets is shown in Table 2 and Table 3. It can be seen that the measured nutrient contents and the calculated ME values of the diets were similar, except the higher crude fat content of the oat containing diets and the higher crude fiber contents of both the barley and oat diets. The soluble dietary fiber content of the diets also increased if barley and oat was used. The barley-based feeds contained the highest level of soluble fiber (Table 3.)
Computer-controlled housing and climatic conditions were maintained during the trial according to the breeder’s recommendation [23]. All husbandry and euthanasia procedures were performed in accordance with the Hungarian Government Decree 40/2013 and in full consideration of animal welfare ethics. The animal experiment was approved by the Institutional Ethics Committee (Animal Welfare Committee, Georgikon Campus, Hungarian University of Agriculture and Life Sciences) under the license number MÁB—10/2019.

2.2. Diets and Experimental Design

On day 40, 2 chickens per pen, 10 birds per treatment, were selected randomly, slaughtered, and gut contents collected. Chymus samples were also collected from the entire ileum to measure their viscosity.
The jejunal content (JC) was collected before the vitelline diverticulum, from a 10 cm long gut segment. Cecal contents (CC) from the right sac were collected for analysis of microbiota composition, and the remainder used for analysis of SCFA. After the gut content collection, the jejunum was washed with sterile ice-cold phosphate buffer solution (PBS) until the mucosa was completely cleaned from the digesta. Mucosa samples (jejunum mucosa, JM) were collected aseptically by scraping off the mucosa from the internal wall of the gut with a glass slide. The viscosity and SCFA samples were stored on ice during the sample collection period, and then stored at −20 °C until further analysis. All samples for microbiota analysis were homogenized and stored at −80 °C until further processing occurred. Before DNA extraction, the samples of two birds of the same pen were pooled. Thus, the microbiota analysis of each gut segments was carried out in 5 replicates.

2.3. Ileal Chyme Viscosity

After thawing, viscosity samples were centrifuged (12,000 g for 10 min) and the supernatant (0.5 mL) was measured using a Brookfield DV II+ viscometer (Brookfield Engineering Laboratories, Stoughton, MA, 02,072 USA) at 25 °C with a CP40 cone and shear rate of 60–600/s. The dimension of viscosity measurements was centipoise (cPs); 1 cPs = 1/100 dyne sec/cm2 = 1 mPa.s.

2.4. Cecal SCFA

Cecal digesta samples were thawed on ice and samples were prepared for gas chromatographic SCFA measurements according to the method of Atteh et al. (2008) with minor modifications [24]. Briefly, samples were thoroughly mixed and 250 μL digesta were taken and mixed with 600 μL of 1.11 M HCl. The SCFA concentrations were determined by gas chromatography (TRACE 2000; Thermo Scientific, Waltham, MA, USA) using a 30 m (0.25 mm i.d.) fused silica column (Nukol column, Supelco Inc., Bellefonte, PA, 16,823 USA). The detector type was FID with a split injector (1:50), the injection volume was set as 1 μL at 220 °C, and the detection was performed at 250 °C. Helium was used as a carrier gas with the pressure of 83 kPa. Standard mixtures of SCFAs (1, 4, 8 and 20 mM), comprised of acetate, propionate, n-butyrate, and n-valerate as external standards, were applied for calibration. The total SCFA was the sum of all measured short chain fatty acids and expressed as µmol/g digesta.

2.5. DNA Extraction, 16S rRNA Gene Amplification, and Illumina MiSeq Sequencing

For bacterial DNA extraction and purification, AquaGenomic Kit (MoBiTec GmbH, Göttingen, Germany) and KAPA Pure Beads (Roche, Basel, Switzerland) were used, according to the manufacturer’s protocols. DNA concentration was measured by fluorometric quantitation (Qubit 3.0 Fluorometer with the Qubit dsDNA HS Assay Kit—Thermo Fisher Scientific Inc., Waltham, MA, USA). Primer pair 341f/785r was used (Klindworth et al.; 2013) to amplify the V3–V4 region of the bacterial 16S rRNA gene. [25]. Library preparation was performed using the High Sensitivity D1000 ScreenTape on the TapeStation 2200 instrument (Agilent Technologies, Santa Clara, CA, USA). Paired-end sequencing was performed on a MiSeq (Illumina Inc., San Diego, CA, USA) using MiSeq Reagent Kit v3. 300—bp reads per end were generated, according to Illumina’s demonstrated protocol (Illumina Inc., 2013).

2.6. Bioinformatics and Statistical Analyses

Quantitative Insights Into Microbial Ecology 2 (QIIME2—version 2020.2) software was used to perform microbiome analysis [26]. The raw sequence data were demultiplexed and filtered using the q2—demux plugin, followed by denoising with Deblur [27]. Sequences were filtered based on QIIME2 default setting. VSEARCH centroid-based algorithm was used for clustering sequences into operational taxonomic units (OTUs). The SILVA database release (ver. 132) was applied as the reference database for taxonomic assignment with 97% similarity [28].
Alpha and beta diversity were estimated using the QIIME2 diversity plugin and MicrobiomeAnalyst (https://www.microbiomeanalyst.ca/, accessed on 1 September 2020) online software after the data were rarefied to 10,000 sequences/sample [29]. To examine differences in microbial community structures between samples PERMANOVA (Permutational multivariate analysis of variance) was generated based on the Bray–Curtis dissimilarity.
SPSS (version 23.0—IBM Corp. Released, 2015) and the R package were used for the statistics [30]. All data were tested for normality using the Shapiro–Wilk test and homogeneity of variances using Levene’s test.
Statistics were performed using the nonparametric Kruskal–Wallis test and Dunn’s post hoc tests for multiple comparisons, with Bonferroni correction. The statistical significance level was p < 0.05, whereas a p-value between 0.05 and 0.10 was considered as a trend.

3. Results

3.1. Ileal Chyme Viscosity and Cecal SCFA Content

Table 4 shows, that the viscosity of ileal chymus of the barley fed birds was significantly (p < 0.001) higher than those of the C and O treatments. Barley incorporation in the broiler’s diets significantly reduced the acetate (p = 0.041), propionate (p = 0.007), valerate (p = 0.026), and total SCFA (p = 0.037) concentration of the ceca, compared to the C and O diets. Not significantly, but oat supplementation also decreased acetate, propionate, butyrate, valerate, and total SCFA concentration.

3.2. Microbial Diversity

As expected, the highest bacterial diversity was found in the ceca and lower species richness was true for the ileal content and ileal mucosa (Table 5, Figure S1). The Chao1 and Shannon indexes were more sensitive than the Simpson index. Significant dietary treatment effects were found only with Chao1 and Shannon.
Feeding barley tendentially increased (p = 0.056) the number of species in the jejunum content (Chao1) compared with the control treatment. In JM, both barley and oats resulted lower species richness according to the Chao1 index; however, according to the Shannon diversity index, tendentially (p = 0.093) higher diversity was found in the B treatment group.
In CC, B dietary treatment significantly reduced (p = 0.009) the number of species compared to C and O groups (Chao1). Barley reduced also the Shannon diversity index. The difference was, in this case, significant (p = 0.017) between treatments B and O.
Beta-diversity based on principal coordinate analysis (PCoA) ordination using Bray–Curtis dissimilarity matrix showed significant differences (PERMANOVA global R = 0.69. p = 0.001) among sampling places. High overlap exists for the bacterial structure of IC and IM, but the species similarity of CC is different (Figure 1A). The dietary treatment effects on the bacterial community structure were also significant. In the JC, the control and oat treatments showed almost 100% similarity. However, feeding the barley-based diets resulted different species too (1B; R = 0.53, p = 0.02). Interestingly, in the ileal mucosa, both cereal treatments modified the species composition of the bacterial community (1C; R = 0.46, p = 0.047). The biggest dissimilarity of the bacterial species was found in the ceca. In this case, beside the overlaps, all the three treatments resulted in different beta diversity (1D, R = 0.59, p = 0.001).

3.3. Jejunal and Cecal Microbial Abundances

In the jejunum, Firmicutes was the dominant phylum both in chymus and mucosa (Table 6, Figure S2). No significant dietary treatment effect was found in the jejunal content. However, the abundance of Firmicutes was 6–7% lower in the barley fed birds in the jejunal mucosa. The difference was significant in the comparison of treatments B and C. The other significant difference in the phyla above 1% abundance was Proteobacteria. The difference in this comparison was also only significant between the barley containing and control diets. Phylum Tenericutes could be detected only in the mucosa of the barley-treated group. Treatment B resulted also in an increase of Bacteroidetes and Actinobacteria, but the differences in these cases were not significant.
Interestingly, the significant increase of Tenericutes of treatment B remained also in the ceca. In the ceca, Firmicutes was still the determinant phyla, but its abundance was lower than in the ileum. At the expense of Firmicutes, Bacteroidetes increased to 8–11%. Oats increased but barley decreased the abundance of this phyla, but the differences were not significant. The most significant difference in CC was the increase of Actinobacteria to 6.73% in treatment B. Its abundance in the two other groups was below 0.3%.
At genus level in JC, Lactobacillus was the dominant group with 80.31%, 65.81%, and 88.38% abundance in treatments C, B, and O respectively (Table S1, Figure S3). In spite of the big decrease in treatment B, the differences were not significant. On the other hand, the change of some genera with low abundance was significant. For example, Curtobacterium increased in treatment O, while Bifidobacterium (p = 0.019), Ruminococcus torques group (p = 0.032), Erysipelatoclostridium (p = 0.019), Dietzia (p = 0.032) and Christensenellaceae R—7 (p = 0.031) in the barley fed birds (Figure 2).
In JM, similarly to the jejunal content, Lactobacillus was also the dominant group with 57.7%, 48.36%, and 66.86% abundance in treatments C, B, and O, respectively (Table S2). The next dominant genus was Bacteroides, only with 0.8%, 2.35%, and 0.33%. Of the genera with a relative abundance above 1%, only Pseudomonas (p = 0.046) showed significant differences between C and B treatments group (0.55% vs. 2.08%; Figure 3). In JM oats, there was a significant increase in the case of some minor genera (Curtobacterium, p = 0.031; Cutibacterium p = 0.039, and Methylobacterium, p = 0.044).
At the genus level in CC, the high abundance of Lactobacillus decreased to 10.48%, 11.05%, and 8.89%, while that of Bacteroides increased to 6.61, 6.63, and 6.22 in the treatments C, B, and O, respectively (Table 7). These dominant genera showed no significant changes due to the diet composition. The most determinant significant treatment effects are shown in Table 7. It can be seen that O decreased the abundance of Streptococcus (p = 0.009) and GCA—900066225 (family Ruminococcaceae) and increased those of Christensenellaceae R—7 group (p = 0.026); some genera from family Lachnospiraceae (Sellimonas (p = 0.032), Marvinbryantia (p = 0.047)) and some genera from the family of Ruminococcaceae (Ruminococcaceae UCG—004. —005. —008. —014. —NK4A214 gr., Ruminococcus 2, Anaerotruncus, Anaerofilum) significantly compared to treatment C. Treatment B led to significantly higher Bifidobacterium (p = 0.005) and Anaerostipes (p = 0.01) ratios.

4. Discussion

Corn is very sensitive to climatic changes, including heat stress and drought. Therefore, the use of alternative, abiotic stress-resistant secondary cereals will increase in the near future. Barley and oats could be potential alternatives of corn and wheat. However, both of these cereals contain hulls and soluble fiber. Structural fiber in poultry diets can be beneficial, because of its gizzard stimulatory effect [1,31]. On the other hand, high dietary structural fiber decreases digestion mostly in young birds. The dominant soluble fiber fraction in barley and oats are β-glucans. It is generally known that the soluble arabinoxylan and β-glucan increase digesta viscosity, decreasing the access of enzymes to the substrates, thus impairing nutrient digestion and absorption [32] and the growth and feed conversion of animals [33]. Exogenous glucanase enzymes are used to split beta glucans and produce shorter chain carbohydrates with lower water holding capacity. Glucanase can therefore decrease digesta viscosity and overcome all the previously mentioned negative effects. NSP degrading enzymes can also provide fermentable substrates for beneficial bacteria, resulting in increased SCFA production and less pathogenic bacteria [34]. There are many research data available on how arabinoxylans (AX) and xylan-oligosaccharides (XOS) of wheat can modify the gut characteristics and the microbiota composition in the intestine of chickens [3,5,20]. However, the information on beta-glucans and their degraded products is very limited. Therefore, in this study barley- and oat-based diets, supplemented with exogenous glucanase, were fed to get more understanding on their effects on some relevant gut parameters and the intestinal microbiota of broiler chickens.

4.1. Ileal Viscosity and Cecal SCFA Concentration

The measured ileal viscosity of this trial was in the range of the published values [35,36,37]. In our study, the ileal chymus of birds fed the barley-based diets was more viscous compared with the two other treatments. The reason for this could be that barley contains higher amounts of soluble NSP than oat, and at 40% inclusion rate, the exogenous glucanase was probably not efficient enough to degrade the high concentration of beta-glucan in the ileal digesta. The soluble dietary fiber content of the barley-based diet was higher than that of the oats and control treatments. This result reaffirms the need for a more precise fiber evaluation of poultry feedstuffs and taking into account both the structural and soluble fractions. Exogenous enzyme supplementation of the diets and the dosage/activity of enzymes should be in accordance with the real soluble fiber content. The other explanation of the results could be that not all the soluble, high molecular weight fiber of the grains are beta glucan. There are also arabinoxylan and other viscous compounds in barley and oats [32], but their ratio and variance have not yet been investigated in detail. Of course, not only viscosity that affects digestion, but many non-dietary factors such as stress [38,39], pathogenic bacteria [40,41], or diseases can play a role [42]. In this trial. no such treatment specific symptoms were registered, so the measured differences could have been attributed to the different diets.
In the cecum, chymus acetate was the determinant volatile fatty acid followed by butyrate and propionate. The dietary treatments did not modify this main trend. However, all measured SCFA concentration decreased in the treatment group B. Barley incorporation significantly reduced the acetate, propionate, valerate, the total SCFA, and in tendency also the butyrate concentration compared to treatments C and O. This finding is opposite to the results of the wheat-based and xylanase-supplemented diets. It is well known that xylanase splits the long chain arabinoxylans to smaller molecular weight XOS, which increase the microbial activity in the ceca and the abundance of the butyrate producing bacterial genera [20]. Comparing the effects of corn- and wheat-based diets on the cecal SCFA concentration of 35-day old broilers, wheat increased the amounts of acetate and butyrate significantly, but failed to modify the concentration of propionate [43].
We also found that feeding wheat-based diets with xylanase supplementation increases the SCFA content, decreases the pH in the ceca, and this way significantly decreased the Campylobacter jejuni counts 14 days post infection [44]. It seems that the degradation of beta glucans does not provide such oligosaccharides that mean extra substrate for the bacteria in the ceca. The negative effect of barley on the cecal SCFA production remains unclear.

4.2. Diversity of Gut Microbiota

Alpha diversity is a measure of microbiome diversity or species richness of a local site, in our case of the gut different sampling places. It is assumed that higher diversity means more stable and balanced microbial community. The dietary treatments in our trial had different effects in the different digestive tract parts. The oat-based dietary treatment did not cause significant differences in this index. The barley-based diets increased in tendency with the bacterial diversity in the jejunal content and jejunal mucosa. On the other hand, this diet decreased significantly the alpha diversity index in the ceca. The lower cecal diversity of treatment B is in accordance with the SCFA results, when barley also had a depressed effect. The reason for the results could be that barley resulted in higher gut viscosity, this way decreased nutrient digestibility [45]. The impaired digestibility means more available substrate for the bacteria, resulting in higher bacterial counts and probably also higher diversity. The reason for the decline of diversity and SCFA production in the ceca after feeding of the barley-based diets is not known. We did not find research results to compare the effects of barley on these parameters.
Beta diversity measures the similarity or dissimilarity of two communities, in our case between the sampling places and between the dietary treatments of a sampling place. As expected, the most significant differences in this index were found between the sampling places. This is not new, since the environment for the bacteria are different in the different gut segments. The jejunum is not a fully anaerobic environment, which is not true for the mucosa and ceca. The nutrient availability and pH are also different in these gut segments. No big differences between the beta diversity indices in the jejunal content were found. In the jejunum, the change in the substrates probably cannot cause big differences because of the quick transit time and low bacterial content. However, in the mucosa, clear difference can be found between the control group and the groups of barley or oats. This means that the soluble fiber fractions can modify the composition or the thickness of the mucus and this way, the translocation of some bacteria from the gut lumen into the mucosal surface. Intestinal mucus, synthetized by the goblet cells, is an important barrier in the gut which acts as a physical fence, participates in bacterial clearance, and displays antimicrobial activity [46]. Only a few studies have been done on the impact of dietary β-glucan, with and without an endo-β-glucanase, on the gut morphology and microbiota number and diversity. According to these studies butyrate is the most efficient SCFA believed to have the largest effect on the intestine [47,48,49,50].
The composition of microbiota is affected mostly on the cross-feeding interactions between the groups that degrade complex carbohydrates, simple sugars, or amino acids. Feeding diets with high fiber content increase the abundance of Firmicutes and Actinobacteria [51,52].

4.3. Effects of Dietary Treatments on the Composition of Intestinal Microbiota

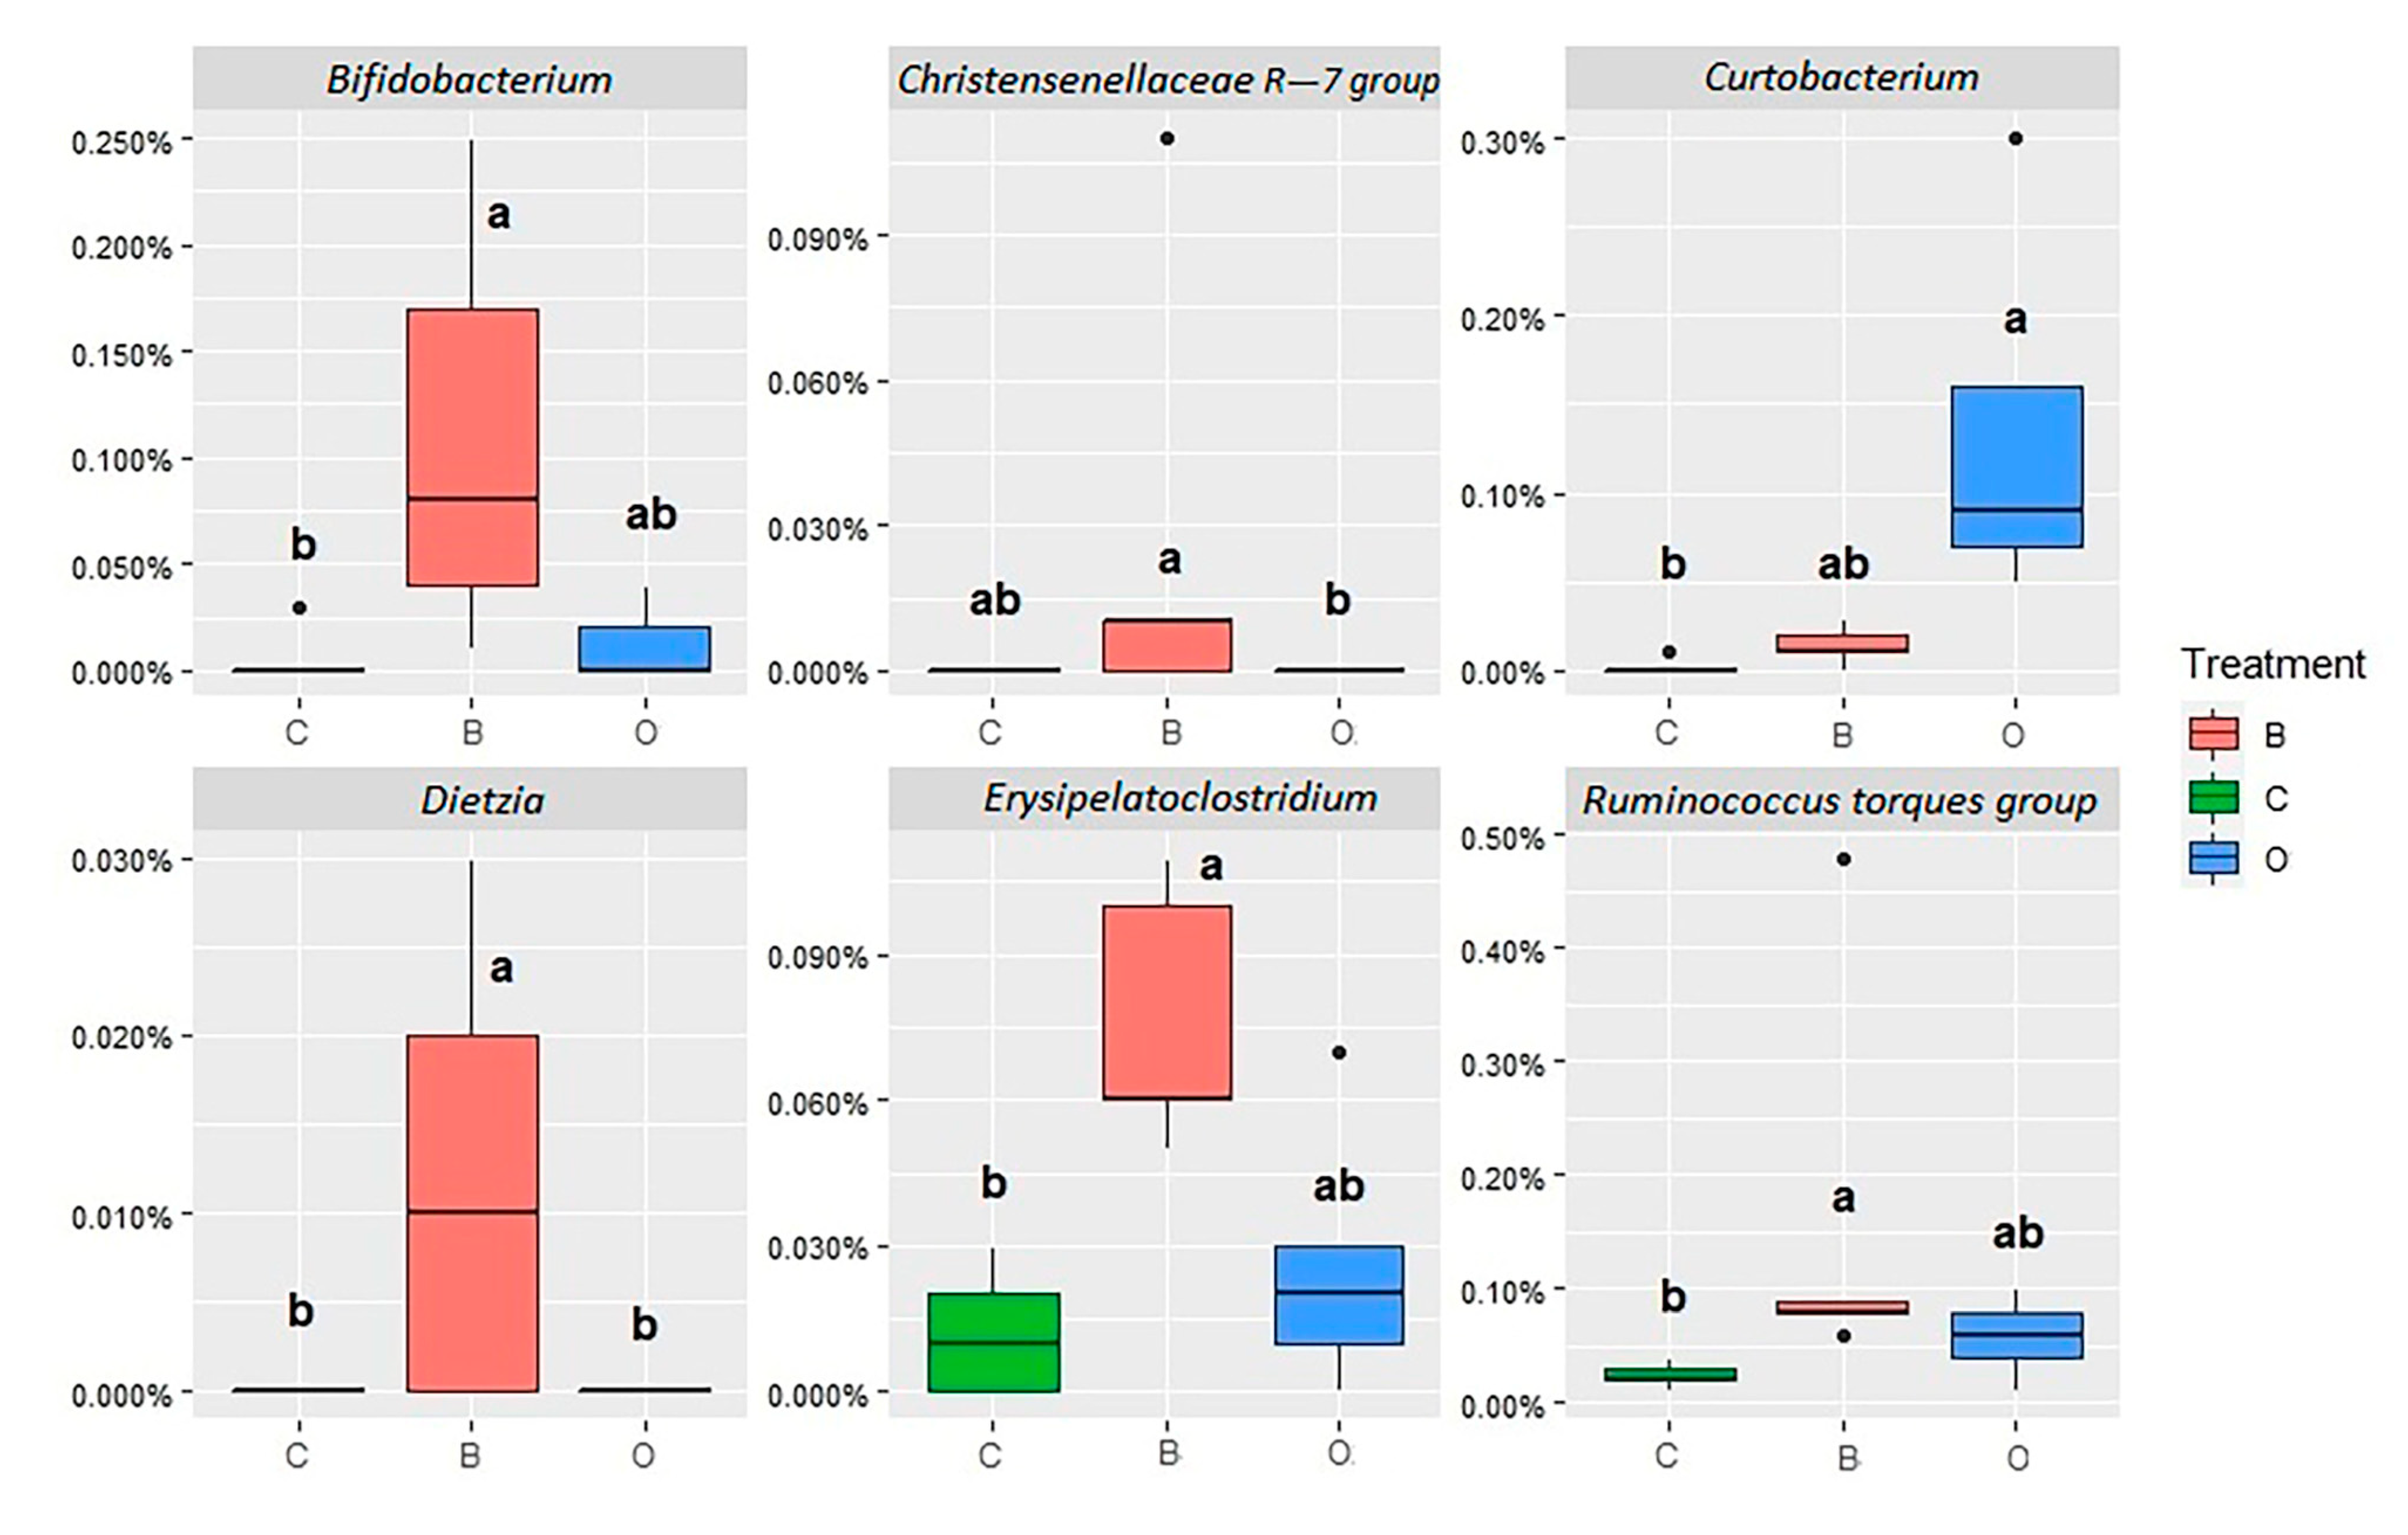
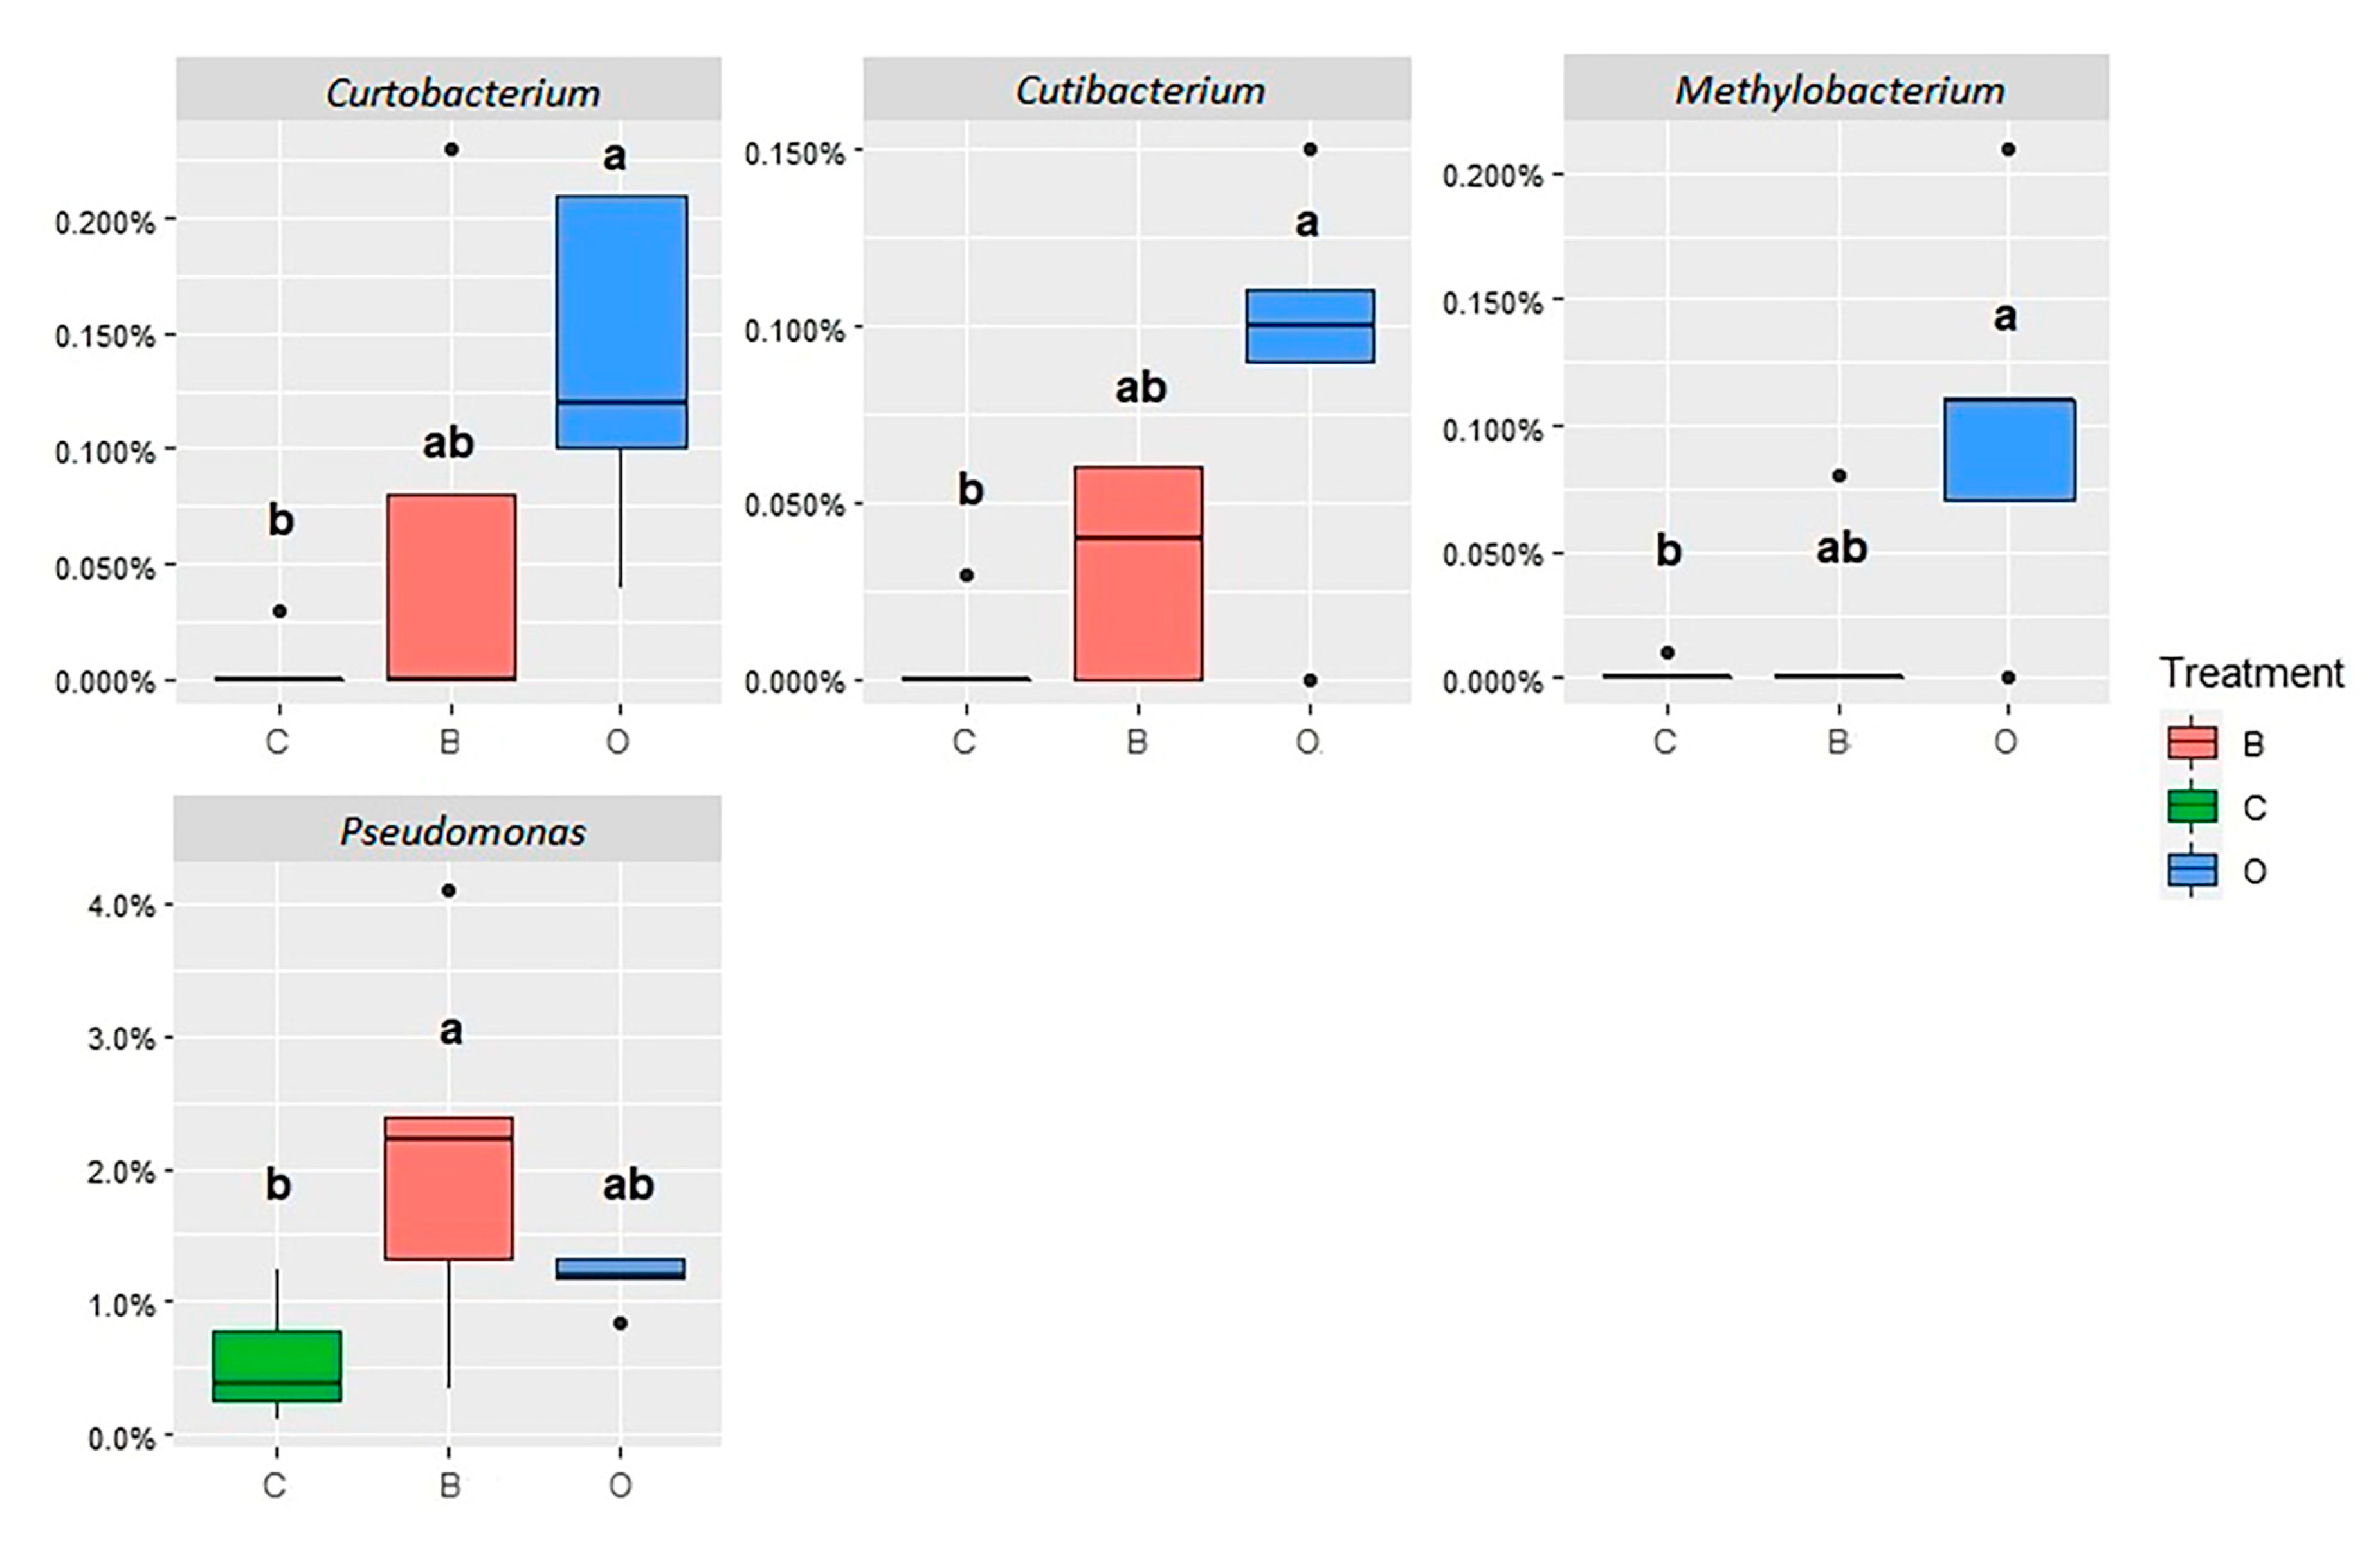
4.3.1. Jejunum Content Microbiota

No significant effect of the treatments had on the microbiota composition at phylum level. The dominant phylum was Firmicutes which is accordance with the previously published results. Usually, Bacteroidetes and Proteobacteria are the second and third biggest phyla. In our case, the abundance of these phyla was very low. Although not significantly, barley increased the ratio of Bacteroidetes about ten times.
At genus level in the B treatment group, a decrease in the relative abundance of Lactobacillus and Turicibacter and an increase in several other genera (e.g., Corynebacterium-1, Nosocomiicoccus, Aerococcus, Weissella, Escherichia-Shigella, Ruminococcus torques group, Erysipelatoclostridium, Bifidobacterium, and Streptococcus) was observed. The Dietzia and Christensenellaceae R-7 genus was found only in the barley fed group. The differences only in some cases were significant because of the high abundance variation. In this gut segment, the dietary microbiota, the changing pH, and the pancreatic secretion are all disturbing factors for the microbiota. Compared to the control diets, feeding oats, increased Lactobacillus, Corynebacterium-1, and Pantoea and decreased Romboutsia abundances. The only significant change due to the oat treatment was the increase of Curtobacterium.
Increased viscosity and slower passage rate of digesta reduces the oxygen in the jejunum and ileum, which in turn stimulates the growth of anaerobic microbiota [32,53]. Normally, the small intestine is colonized by higher proportion of facultative anaerobic than strict anaerobic microbiota [54,55]. The growth of these anaerobic microbiota is increased by viscosity. This means not only change in the composition but also higher bacterial count and more competition for nutrients between host and microbiota. Furthermore, favoring the growth of anaerobic microbiota over facultative anaerobic microbiota in the small intestine increases the bile salt hydrolase activity in the digesta, which in turn markedly reduces the digestion of fats [32,53]. Most of the gut microbiota evaluation is published on ceca and in some cases on the ileum. As far as the authors know, no barley or cereal beta glucan results are published from the jejunum yet. This gut segment was used in our case because the viscosity and all the impairments of digestion happen in the jejunum. The disadvantage of using jejunal contents is the high standard deviation of the parameters.

4.3.2. Jejunum Mucosa Microbiota

Similar to the gut content in the jejunum mucosa, Firmicutes was also the dominant phylum with abundances between 89 and 97%. Comparing with the gut content, the most important change is that the mucosa contained higher ratio of Proteobacteria and Bacteroidetes and less Actinobacteria. The mucosa is mostly anaerobic and it is the main environmental factor of the changes. Farkas et al. (2022) found similar bacterial composition in the mucosa and in the ceca in broiler chickens [56]. In their trial, the phylum Bacteroidetes increased until 30%. In this trial, the increase of Bacteroidetes was smaller. The abundance of these determinant phyla was also dietary treatment-dependent. Barley significantly decreased the abundance of Firmicutes but increased Proteobacteria significantly, and Bacteroidetes in tendency.
Similar to JC, in the JM barley, the relative abundance of Lactobacillus and Turicibacter also decreased and the ratio of several other genera (e.g., Corynebacterium-1, Bacteroides, Alistipes, Nosocomiicoccus, Weissella, Romboutsia, and Pseudomonas) increased. Like the jejunal content, oats increased Lactobacillus and Corynebacterium-1 and decreased Romboutsia abundances. Of the genera with a relative abundance above 1%, only Pseudomonas showed significant differences between treatment C and B. From the results, it can be concluded that there are similarities between the bacteriota composition of the jejunal gut content and the jejunal mucosa, but diet composition can slightly modulate it. The mechanism, how and which bacteria can translocate from the gut to the surface of the epithelial cells is not fully understood yet. Changes in gut viscosity can be a factor that modulate the mucosal wall of the small intestine [57] and viscous feedstuffs can damage the villi [57,58]. Moreover, the interactions of the soluble wheat arabinoxylans with the glycocalyx layer of the intestinal brush border can thicken the unstirred water layer of the mucosa. In this way, the absorption of nutrients along the small intestine is decreased [59,60,61,62].

4.3.3. Cecum Content Microbiota

In the ceca of birds, decreased Firmicutes and increased Bacteroidetes abundance is usually measured. The ratio of the two phyla, the Bacteroidetes:Firmicutes ratio, also correlates with the growth rate and fat deposition of humans and animals [37,63,64]. In this trial, Bacteroidetes increased to 8.2–11.3% and Firmicutes decreased to 84.2–89.6%. Only slight dietary effects were found in the ceca. Both Tenericutes and Actinobacteria increased significantly in the barley treatment. The increase of Tenericutes could be positive in the ceca, since it was positively correlated with the final body weight of chickens [56]. On genus level, the increase of Bacteroides and the decrease of Lactobacillus was the most important change of treatment B. Aside from that, significant differences were found only in the abundances of genera with low incidence, below 1%. Feeding the oat containing diets increased Streptococcus and GCA-900066225 (family Ruminococcaceae) abundances significantly compared to the control treatment.
Choct and Annison (1990) described that xylanase supplementation of broiler diets modify the composition of cecal microbiota in chickens [65]. Members of the family Lachnospiraceae and Ruminococcaceae become more abundant, and are efficient butyrate producers. β-glucan can reduce the colonization of Salmonella in the intestinal tract and promote the number of beneficial bacteria such as Bifidobacterium and Lactobacillus. It also has significant immune stimulatory effects against parasitic and viral diseases [66]. However, from these results it can be concluded that beta glucans and their shorter chain oligosaccharides only have a limited effect on butyrate production.

5. Conclusions

From the results, it can be concluded that viscous cereal grains, such as barley, can increase gut viscosity even if diets are supplemented with exogenous glucanase. It can affect digestion and also the changes in gut microbiota. In this trial, the barley-based diets had the highest soluble dietary fiber content and resulted in increased ileal viscosity and higher bacteriota diversity in the jejunum. Interestingly, barley reduced the bacterial diversity in the ceca and decreased the SCFA production. This result is in opposition to those that have been published on wheat and arabinoxylans. Oats had only a limited impact on the bacteriota at 20% inclusion and resulted only significant differences in some genera with low abundance. According to the results, it would be important to develop the fiber evaluation system of poultry diets and to use the real soluble fiber contents in the diet formulations. The dosage of exogenous enzymes should also be accommodated to the soluble fiber contents of the diets.

Supplementary Materials

The following supporting information can be downloaded at: https://www.mdpi.com/article/10.3390/agriculture13010169/s1. Figure S1: Diversity indices of the intestinal microbiota of broiler chickens; Figure S2: The most abundant phyla relative abundance of microbiota in the jejunum content (JC), jejunum mucosa (JM), and cecal content (CC) as affected by dietary treatments; Figure S3: Relative abundance of bacterial genera in the different sampling places of broiler chickens as affected by dietary treatments (%); Table S1: Relative abundance of bacterial genera in jejunum content of broiler chickens as affected by dietary treatments (%); Table S2: Relative abundance of bacterial genera in jejunum mucosa of broiler chickens as affected by dietary treatments (%).

Author Contributions

Conceptualization, M.A.R., V.F. and K.D.; methodology, M.A.R., L.M. and V.F.; and formal analysis, M.A.R. and K.D.; investigation, N.S., L.P., V.F., M.A.R., G.C. and Á.M.; data curation, L.M.; writing—original draft preparation, M.A.R., V.F. and K.D.; writing—review and editing, N.S., V.F. and K.D.; visualization, M.A.R. and V.F.; supervision, K.D.; project administration, M.A.R., V.F., K.D. and N.S.; funding acquisition, K.D. All authors have read and agreed to the published version of the manuscript.

Funding

This research was supported by the Hungarian Government and the European Union, with the co-founding of the European Regional Development Fund in the frame of Széchenyi 2020 Programme GINOP-2.3.2.-15-2016-00029 project. The researcher Mohamed Ali Rawash is funded by the Scholarship ID (70667/2018, Keszthely reg number (FI 80554) under the joint Executive program between Arab Republic of Egypt and Republic of Hungary.

Institutional Review Board Statement

The animal experiment was approved by the Institutional Ethics Committee (Animal Welfare Committee, Georgikon Campus, Hungarian University of Agriculture and Life Sciences) under the license number MÁB-10/2019.

Informed Consent Statement

Not applicable.

Data Availability Statement

Raw sequences data of 16S rRNA gene analysis were deposited at the National Center for Biotechnology Information (NCBI) Sequence Read Archive (SRA) under accession number PRJNA909494. All data generated or analyzed during this study are included in this published article.

Conflicts of Interest

All authors declare no conflict of interest.

References

  1. Svihus, B. The Gizzard: Function, Influence of Diet Structure and Effects on Nutrient Availability. World’s Poult. Sci. J. 2011, 67, 207–224. [Google Scholar] [CrossRef]
  2. Jiménez-Moreno, E.; Frikha, M.; de Coca-Sinova, A.; García, J.; Mateos, G.G. Oat Hulls and Sugar Beet Pulp in Diets for Broilers 1. Effects on Growth Performance and Nutrient Digestibility. Anim. Feed Sci. Technol. 2013, 182, 33–43. [Google Scholar] [CrossRef]
  3. Jeroch, H.; Dusel, G.; Kluge, H.; Nonn, H. The Effectiveness of Microbial Xylanase in Piglet Rations Based on Wheat, Wheat and Rye or Barley Respectively. Landbauforsch. Voelkenrode Sonderh. 1999, 193, 223–228. [Google Scholar]
  4. Smits, C.H.M.; Annison, G. Non-Starch Plant Polysaccharides in Broiler Nutrition—Towards a Physiologically Valid Approach to Their Determination. World’s Poult. Sci. J. 1996, 52, 203–221. [Google Scholar] [CrossRef]
  5. Bautil, A.; Verspreet, J.; Buyse, J.; Goos, P.; Bedford, M.; Courtin, C. Arabinoxylan-Oligosaccharides Kick-Start Arabinoxylan Digestion in the Aging Broiler. Poult. Sci. 2020, 99, 2555–2565. [Google Scholar] [CrossRef] [PubMed]
  6. Metzler-Zebeli, B.U.; Zebeli, Q. Cereal β-Glucan Alters Nutrient Digestibility and Microbial Activity in the Intestinal Tract of Pigs, and Lower Manure Ammonia Emission: A Meta-Analysis. J. Anim. Sci. 2013, 91, 3188–3199. [Google Scholar] [CrossRef] [PubMed]
  7. Moon, S.H.; Lee, I.; Feng, X.; Lee, H.Y.; Kim, J.; Ahn, D.U. Effect of Dietary Beta-Glucan on the Performance of Broilers and the Quality of Broiler Breast Meat. Asian-Australas. J. Anim. Sci. 2016, 29, 384–389. [Google Scholar] [CrossRef] [PubMed] [Green Version]
  8. De Marco Castro, E.; Calder, P.C.; Roche, H.M. β-1,3/1,6-Glucans and Immunity: State of the Art and Future Directions. Mol. Nutr. Food Res. 2021, 65, e1901071. [Google Scholar] [CrossRef]
  9. Friesen, O.; Guenter, W.; Marquardt, R.; Rotter, B. The Effect of Enzyme Supplementation on the Apparent Metabolizable Energy and Nutrient Digestibilities of Wheat, Barley, Oats, and Rye for the Young Broiler Chick. Poult. Sci. 1992, 71, 1710–1721. [Google Scholar] [CrossRef]
  10. Brenes, A.; Smith, M.; Guenter, W.; Marquardt, R.R. Effect of Enzyme Supplementation on the Performance and Digestive Tract Size of Broiler Chickens Fed Wheat- and Barley-Based Diets. Poult. Sci. 1993, 72, 1731–1739. [Google Scholar] [CrossRef]
  11. Lazaro, R.; Garcia, M.; Medel, P.; Mateos, G.G. Influence of Enzymes on Performance and Digestive Parameters of Broilers Fed Rye-Based Diets. Poult. Sci. 2003, 82, 132–140. [Google Scholar] [CrossRef] [PubMed]
  12. Jozefiak, D.; Rutkowski, A.; Fratczak, M.; Boros, D. The Effect of Dietary Fibre Fractions from Different Cereals and Microbial Enzyme Supplementation on Performance, Ileal Viscosity and Short-Chain Fatty Acid Concentrations in the Caeca of Broiler Chickens. J. Anim. Feed Sci. 2004, 13, 487–496. [Google Scholar] [CrossRef] [Green Version]
  13. Knudsen, K.E.B. Carbohydrate and Lignin Contents of Plant Materials Used in Animal Feeding. Anim. Feed Sci. Technol. 1997, 67, 319–338. [Google Scholar] [CrossRef]
  14. Jiménez-Moreno, E.; de Coca-Sinova, A.; González-Alvarado, J.M.; Mateos, G.G. Inclusion of Insoluble Fiber Sources in Mash or Pellet Diets for Young Broilers. 1. Effects on Growth Performance and Water Intake. Poult. Sci. 2016, 95, 41–52. [Google Scholar] [CrossRef] [PubMed]
  15. Hetland, H.; Svihus, B. Effect of Oat Hulls on Performance, Gut Capacity and Feed Passage Time in Broiler Chickens. Br. Poult. Sci. 2001, 42, 354–361. [Google Scholar] [CrossRef]
  16. Aerni, V.; El-Lethey, H.; Wechsler, B. Effect of Foraging Material and Food Form on Feather Pecking in Laying Hens. Br. Poult. Sci. 2000, 41, 16–21. [Google Scholar] [CrossRef]
  17. Carre, B.; Derouet, L.; Leclercq, B. The Digestibility of Cell-Wall Polysaccharides from Wheat (Bran or Whole Grain), Soybean-Meal, and White Lupin Meal in Cockerels, Muscovy Ducks, and Rats. Poult. Sci. 1990, 69, 623–633. [Google Scholar] [CrossRef]
  18. Denayrolles, M.; Arturo-Schaan, M.; Massias, B.; Bebin, K.; Elie, A.M.; Panheleux-Lebastard, M.; Urdaci, M.C. Effect of Diets with Different Fibrous Contents on Broiler Gut Microflora and Short-Chain Fatty Acid (SCFA) Production. In Proceedings of the World Poultry Science Association, 16th European Symposium on Poultry Nutrition, Strasbourg, France, 26–30 August 2007; pp. 269–272. [Google Scholar]
  19. Dunkley, K.D.; Dunkley, C.S.; Njongmeta, N.L.; Callaway, T.R.; Hume, M.E.; Kubena, L.F.; Nisbet, D.J.; Ricke, S.C. Comparison of In Vitro Fermentation and Molecular Microbial Profiles of High-Fiber Feed Substrates Incubated with Chicken Cecal Inocula. Poult. Sci. 2007, 86, 801–810. [Google Scholar] [CrossRef]
  20. Van Immerseel, F.; Eeckhaut, V.; Moore, R.J.; Choct, M.; Ducatelle, R. Beneficial Microbial Signals from Alternative Feed Ingredients: A Way to Improve Sustainability of Broiler Production? Microb. Biotechnol. 2017, 10, 1008–1011. [Google Scholar] [CrossRef] [Green Version]
  21. Donaldson, J.; Świątkiewicz, S.; Arczewka-Włosek, A.; Muszyński, S.; Szymańczyk, S.; Arciszewski, M.B.; Siembida, A.Z.; Kras, K.; Piedra, J.L.V.; Schwarz, T.; et al. Modern Hybrid Rye, as an Alternative Energy Source for Broiler Chickens, Improves the Absorption Surface of the Small Intestine Depending on the Intestinal Part and Xylanase Supplementation. Animals 2021, 11, 1349. [Google Scholar] [CrossRef]
  22. World’s Poultry Science Association Nutrition of the European Federation of Branches Subcommittee Energy of the Working Group. European Table of Energy Values for Poultry Feedstuffs, 3rd ed.; WPSA: Beekbergen, The Netherlands, 1989. [Google Scholar]
  23. Ross-Broiler Management Handbook. Available online: https://en.aviagen.com/assets/Tech_Center/Ross_Broiler/Ross-BroilerHandbook2018-EN.pdf (accessed on 3 March 2018).
  24. Atteh, J.O.; Onagbesan, O.M.; Tona, K.; Decuypere, E.; Geuns, J.M.C.; Buyse, J. Evaluation of Supplementary Stevia (Stevia rebaudiana, Bertoni) Leaves and Stevioside in Broiler Diets: Effects on Feed Intake, Nutrient Metabolism, Blood Parameters and Growth Performance. J. Anim. Physiol. Anim. Nutr. 2008, 92, 640–649. [Google Scholar] [CrossRef] [PubMed]
  25. Klindworth, A.; Pruesse, E.; Schweer, T.; Peplies, J.; Quast, C.; Horn, M.; Glöckner, F.O. Evaluation of General 16S Ribosomal RNA Gene PCR Primers for Classical and Next-Generation Sequencing-Based Diversity Studies. Nucleic Acids Res. 2013, 41, e1. [Google Scholar] [CrossRef] [PubMed]
  26. Bolyen, E.; Rideout, J.R.; Dillon, M.R.; Bokulich, N.A.; Abnet, C.C.; Al-Ghalith, G.A.; Alexander, H.; Alm, E.J.; Arumugam, M.; Asnicar, F.; et al. Reproducible, Interactive, Scalable and Extensible Microbiome Data Science Using QIIME 2. Nat. Biotechnol. 2019, 37, 852–857. [Google Scholar] [CrossRef] [PubMed]
  27. Amir, A.; McDonald, D.; Navas-Molina, J.A.; Kopylova, E.; Morton, J.T.; Zech Xu, Z.; Kightley, E.P.; Thompson, L.R.; Hyde, E.R.; Gonzalez, A.; et al. Deblur Rapidly Resolves Single-Nucleotide Community Sequence Patterns. mSystems 2017, 2, e00191-16. [Google Scholar] [CrossRef] [PubMed] [Green Version]
  28. Quast, C.; Pruesse, E.; Yilmaz, P.; Gerken, J.; Schweer, T.; Yarza, P.; Peplies, J.; Glöckner, F.O. The SILVA Ribosomal RNA Gene Database Project: Improved Data Processing and Web-Based Tools. Nucleic Acids Res. 2013, 41, D590–D596. [Google Scholar] [CrossRef]
  29. Chong, J.; Liu, P.; Zhou, G.; Xia, J. Using MicrobiomeAnalyst for Comprehensive Statistical, Functional, and Meta-Analysis of Microbiome Data. Nat. Protoc. 2020, 15, 799–821. [Google Scholar] [CrossRef]
  30. R: The R Project for Statistical Computing. Available online: https://www.r-project.org/ (accessed on 16 December 2022).
  31. Svihus, B.; Sacranie, A.; Denstadli, V.; Choct, M. Nutrient Utilization and Functionality of the Anterior Digestive Tract Caused by Intermittent Feeding and Inclusion of Whole Wheat in Diets for Broiler Chickens. Poult. Sci. 2010, 89, 2617–2625. [Google Scholar] [CrossRef]
  32. Choct, M. Enzymes for the Feed Industry: Past, Present and Future. World’s Poult. Sci. J. 2006, 62, 5–16. [Google Scholar] [CrossRef]
  33. Bedford, M.; Classen, H. Reduction of Intestinal Viscosity through Manipulation of Dietary Rye and Pentosanase Concentration Is Effected through Changes in the Carbohydrate Composition of the Intestinal Aqueous Phase and Results in Improved Growth Rate and Food Conversion Efficiency. J. Nutr. 1992, 122, 560–569. [Google Scholar] [CrossRef]
  34. Bao, Y.M.; Choct, M. Dietary NSP Nutrition and Intestinal Immune System for Broiler Chickens. World’s Poult. Sci. J. 2010, 66, 511–518. [Google Scholar] [CrossRef]
  35. Shakouri, M.D.; Iji, P.A.; Mikkelsen, L.L.; Cowieson, A.J. Intestinal Function and Gut Microflora of Broiler Chickens as Influenced by Cereal Grains and Microbial Enzyme Supplementation. J. Anim. Physiol. Anim. Nutr. 2009, 93, 647–658. [Google Scholar] [CrossRef] [PubMed]
  36. Konieczka, P.; Smulikowska, S. Viscosity Negatively Affects the Nutritional Value of Blue Lupin Seeds for Broilers. Animal 2018, 12, 1144–1153. [Google Scholar] [CrossRef]
  37. Wang, H.; Ni, X.; Qing, X.; Zeng, D.; Luo, M.; Liu, L.; Li, G.; Pan, K.; Jing, B. Live Probiotic Lactobacillus Johnsonii BS15 Promotes Growth Performance and Lowers Fat Deposition by Improving Lipid Metabolism, Intestinal Development, and Gut Microflora in Broilers. Front. Microbiol. 2017, 8, 1073. [Google Scholar] [CrossRef] [PubMed] [Green Version]
  38. Virden, W.S.; Kidd, M.T. Physiological Stress in Broilers: Ramifications on Nutrient Digestibility and Responses. J. Appl. Poult. Res. 2009, 18, 338–347. [Google Scholar] [CrossRef]
  39. Larbier, M.; Chagneau, A.M.; Geraert, P.A. Influence of Ambient Temperature on True Digestibility of Protein and Amino Acids of Rapeseed and Soybean Meals in Broilers. Poult. Sci. 1993, 72, 289–295. [Google Scholar] [CrossRef] [PubMed]
  40. Kaldhusdal, M.; Hofshagen, M. Barley Inclusion and Avoparcin Supplementation in Broiler Diets.: 2. Clinical, Pathological, and Bacteriological Findings in a Mild Form of Necrotic Enteritis. Poult. Sci. 1992, 71, 1145–1153. [Google Scholar] [CrossRef]
  41. Awad, W.A.; Molnár, A.; Aschenbach, J.R.; Ghareeb, K.; Khayal, B.; Hess, C.; Liebhart, D.; Dublecz, K.; Hess, M. Campylobacter Infection in Chickens Modulates the Intestinal Epithelial Barrier Function. Innate Immun. 2015, 21, 151–160. [Google Scholar] [CrossRef]
  42. Matos, M.; Dublecz, K.; Grafl, B.; Liebhart, D.; Hess, M. Pancreatitis Is an Important Feature of Broilers Suffering from Inclusion Body Hepatitis Leading to Dysmetabolic Conditions with Consequences for Zootechnical Performance. Avian Dis. 2017, 62, 57–64. [Google Scholar] [CrossRef]
  43. Nguyen, H.T.; Bedford, M.R.; Wu, S.-B.; Morgan, N.K. Soluble Non-Starch Polysaccharide Modulates Broiler Gastrointestinal Tract Environment. Poult. Sci. 2021, 100, 101183. [Google Scholar] [CrossRef]
  44. Molnár, A.; Hess, C.; Pál, L.; Wágner, L.; Awad, W.A.; Husvéth, F.; Hess, M.; Dublecz, K. Composition of Diet Modifies Colonization Dynamics of Campylobacter Jejuni in Broiler Chickens. J. Appl. Microbiol. 2015, 118, 245–254. [Google Scholar] [CrossRef]
  45. Choct, M.; Annison, G. Anti-Nutritive Effect of Wheat Pentosans in Broiler Chickens: Roles of Viscosity and Gut Microflora. Br. Poult. Sci. 1992, 33, 821–834. [Google Scholar] [CrossRef] [PubMed]
  46. Alemka, A.; Corcionivoschi, N.; Bourke, B. Defense and Adaptation: The Complex Inter-Relationship between Campylobacter jejuni and Mucus. Front. Cell. Infect. Microbiol. 2012, 2, 15. [Google Scholar] [CrossRef] [PubMed] [Green Version]
  47. Gorham, J.B.; Kang, S.; Williams, B.A.; Grant, L.J.; McSweeney, C.S.; Gidley, M.J.; Mikkelsen, D. Addition of Arabinoxylan and Mixed Linkage Glucans in Porcine Diets Affects the Large Intestinal Bacterial Populations. Eur. J. Nutr. 2017, 56, 2193–2206. [Google Scholar] [CrossRef] [PubMed]
  48. Jha, R.; Rossnagel, B.; Pieper, R.; Van Kessel, A.; Leterme, P. Barley and Oat Cultivars with Diverse Carbohydrate Composition Alter Ileal and Total Tract Nutrient Digestibility and Fermentation Metabolites in Weaned Piglets. Animal 2010, 4, 724–731. [Google Scholar] [CrossRef] [PubMed] [Green Version]
  49. Jozefiak, D.; Rutkowski, A.; Kaczmarek, S.; Jensen, B.B.; Engberg, R.M.; Højberg, O. Effect of β-Glucanase and Xylanase Supplementation of Barley- and Rye-Based Diets on Caecal Microbiota of Broiler Chickens. Br. Poult. Sci. 2010, 51, 546–557. [Google Scholar] [CrossRef] [PubMed]
  50. Pieper, R.; Jha, R.; Rossnagel, B.; Van Kessel, A.G.; Souffrant, W.B.; Leterme, P. Effect of Barley and Oat Cultivars with Different Carbohydrate Compositions on the Intestinal Bacterial Communities in Weaned Piglets. FEMS Microbiol. Ecol. 2008, 66, 556–566. [Google Scholar] [CrossRef] [PubMed] [Green Version]
  51. González-Ortiz, G.; Bedford, M.R.; Bach Knudsen, K.E.; Courtin, C.M.; Classen, H.L. The Value of Fibre: Engaging the Second Brain for Animal Nutrition; Wageningen Academic Publishers: Wageningen, The Netherlands, 2019; ISBN 978-90-8686-342-6. [Google Scholar]
  52. Koh, A.; De Vadder, F.; Kovatcheva-Datchary, P.; Bäckhed, F. From Dietary Fiber to Host Physiology: Short-Chain Fatty Acids as Key Bacterial Metabolites. Cell 2016, 165, 1332–1345. [Google Scholar] [CrossRef] [PubMed] [Green Version]
  53. Feighner, S.D.; Dashkevicz, M.P. Effect of Dietary Carbohydrates on Bacterial Cholyltaurine Hydrolase in Poultry Intestinal Homogenates. Appl. Environ. Microbiol. 1988, 54, 337–342. [Google Scholar] [CrossRef] [Green Version]
  54. Lu, J.; Idris, U.; Harmon, B.; Hofacre, C.; Maurer, J.J.; Lee, M.D. Diversity and Succession of the Intestinal Bacterial Community of the Maturing Broiler Chicken. Appl. Environ. Microbiol. 2003, 69, 6816–6824. [Google Scholar] [CrossRef] [Green Version]
  55. Salanitro, J.P.; Blake, I.G.; Muirehead, P.A.; Maglio, M.; Goodman, J.R. Bacteria Isolated from the Duodenum, Ileum, and Cecum of Young Chicks. Appl. Environ. Microbiol. 1978, 35, 782–790. [Google Scholar] [CrossRef] [Green Version]
  56. Farkas, V.; Csitári, G.; Menyhárt, L.; Such, N.; Pál, L.; Husvéth, F.; Rawash, M.A.; Mezőlaki, Á.; Dublecz, K. Microbiota Composition of Mucosa and Interactions between the Microbes of the Different Gut Segments Could Be a Factor to Modulate the Growth Rate of Broiler Chickens. Animals 2022, 12, 1296. [Google Scholar] [CrossRef] [PubMed]
  57. Rakowska, M.; Rek-Ciepły, B.; Slot, A.; Lipińska, E.; Kubiński, T.; Barcz, I.; Afanasjew, B. The Effect of Rye, Probiotics and Nisine on Faecal Flora and Histology of the Small Intestine of Chicks. J. Anim. Feed Sci. 1993, 2, 73–81. [Google Scholar] [CrossRef] [Green Version]
  58. Smulikowska, S. Relationship between the Stage of Digestive Tract Development in Chicks and the Effect of Viscosity Reducing Enzymes on Fat Digestion. J. Anim. Feed Sci. 1998, 7, 125–134. [Google Scholar] [CrossRef] [Green Version]
  59. Choct, M.; Hughes, R.J.; Wang, J.; Bedford, M.R.; Morgan, A.J.; Annison, G. Increased Small Intestinal Fermentation Is Partly Responsible for the Anti-Nutritive Activity of Non-Starch Polysaccharides in Chickens. Br. Poult. Sci. 1996, 37, 609–621. [Google Scholar] [CrossRef] [PubMed]
  60. Classen, H.L. Cereal Grain Starch and Exogenous Enzymes in Poultry Diets. Anim. Feed Sci. Technol. 1996, 62, 21–27. [Google Scholar] [CrossRef]
  61. Johnson, I.T.; Gee, J.M. Effect of Gel-Forming Gums on the Intestinal Unstirred Layer and Sugar Transport in Vitro. Gut 1981, 22, 398–403. [Google Scholar] [CrossRef] [PubMed] [Green Version]
  62. Meng, X.; Slominski, B.A.; Guenter, W. The Effect of Fat Type, Carbohydrase, and Lipase Addition on Growth Performance and Nutrient Utilization of Young Broilers Fed Wheat-Based Diets. Poult. Sci. 2004, 83, 1718–1727. [Google Scholar] [CrossRef]
  63. Duncan, S.H.; Lobley, G.E.; Holtrop, G.; Ince, J.; Johnstone, A.M.; Louis, P.; Flint, H.J. Human Colonic Microbiota Associated with Diet, Obesity and Weight Loss. Int. J. Obes. 2008, 32, 1720–1724. [Google Scholar] [CrossRef] [Green Version]
  64. Salaheen, S.; Kim, S.-W.; Haley, B.J.; Van Kessel, J.A.S.; Biswas, D. Alternative Growth Promoters Modulate Broiler Gut Microbiome and Enhance Body Weight Gain. Front. Microbiol. 2017, 8, 2088. [Google Scholar] [CrossRef]
  65. Choct, M.; Annison, G. Anti-nutritive Activity of Wheat Pentosans in Broiler Diets. Br. Poult. Sci. 1990, 31, 811–821. [Google Scholar] [CrossRef]
  66. Shao, Y.; Wang, Z.; Tian, X.; Guo, Y.; Zhang, H. Yeast β-d-Glucans Induced Antimicrobial Peptide Expressions against Salmonella Infection in Broiler Chickens. Int. J. Biol. Macromol. 2016, 85, 573–584. [Google Scholar] [CrossRef] [PubMed]
Figure 1. Principal coordinate analysis (PCoA) based on Bray–Curtis dissimilarity matrix of the three sampling places (A) and dietary effects in the ileal chymus (B), ileal mucosa (C), and cecal content (D). Permutational multivariate analysis of variance (PERMANOVA) was used to analyze spatial variation in beta diversity of the samples.
Agriculture 13 00169 g001
Figure 2. Boxplots showing significant changes in the genera of the jejunum contents. C: Control: maize-based diet; B: barley-based diet; O: oat-based diet. Results of Kruskal–Wallis test and the post hoc Dunn’s multiple comparisons test with Bonferroni correction. a,b values marked with different lowercase letters were significantly different (p < 0.05). Results between 0.05 and 0.1 (0.05 < p < 0.10) were considered as a trend (T). Dots represent the outlier values.
Agriculture 13 00169 g002
Figure 3. Boxplots showing significant changes in the genera of the jejunum mucosa. C: Control: maize-based diet; B: barley-based diet; O: oat-based diet. Results of Kruskal–Wallis test and the post hoc Dunn’s multiple comparisons test with Bonferroni correction. a,b values marked with different lowercase letters were significantly different (p < 0.05). Results between 0.05 and 0.1 (0.05 < p < 0.10) were considered as a trend (T). Dots represent the outlier values.
Agriculture 13 00169 g003
Table 1. Chemical composition of barley and oats.
DMc. Proteinc. Fatc. FiberAshNFECaPStarchNDFADFAMEn *
winter barley
(MvHV05-17)
91.129.571.473.592.1574.340.070.3551.1418.174.4110.77
92.6210.965.311.352.3962.620.090.336.9929.7614.069.92
winter oat
(MV HÓPEHELY)
91.129.571.473.592.1574.340.070.3551.1418.174.4110.77
92.6210.965.311.352.3962.620.090.336.9929.7614.069.92
* AMEn values were calculated according to the equations of the European Table of Energy Values for Poultry Feedstuffs, 1989 [22].
Table 2. Composition of experimental diets (g/kg as fed).
Starter DietsGrower DietsFinisher Diets
CBOCBOCBO
Maize430.028.0219.0400.092.0277.0459.0152.0336.0
Wheat 100.0 100.0
Extracted soybean meal464.0435.0444.0397.0382.0392.0342.0327.0337.0
Sunflower oil56.088.086.059.084.088.057.081.085.0
Limestone18.018.017.015.015.014.014.015.014.0
MCP16.015.017.015.013.015.014.012.014.0
Barley 400.0 400.0 400.0
Oats 200.0 200.0 200.0
Lysine2.02.02.01.01.01.01.01.01.0
DL-methionine4.04.04.03.03.03.03.02.03.0
Threonine1.01.01.01.01.01.00.50.50.5
Valine 0.5
Premix 15.05.05.05.05.05.05.05.05.0
NaCl3.03.03.03.03.03.03.03.03.0
NaHCO31.01.01.01.01.01.01.01.01.0
Phytase 20.10.10.10.10.10.10.10.10.1
NSP enzyme 30.10.10.10.10.10.10.10.10.1
1 Premix was supplied by UBM Ltd. (Pilisvörösvár, Hungary). The active ingredients in the premix were as follows (per kg of diet): retinyl acetate—5.0 mg, cholecalciferol—130 μg, dl—alpha—tocopherol—acetate—91 mg, menadione—2.2 mg, thiamin—4.5 mg, riboflavin—10.5 mg, pyridoxin HCL—7.5 mg, cyanocobalamin—80 μg, niacin—41.5 mg, pantothenic acid—15 mg, folic acid—1.3 mg, biotin—150 μg, betaine—670 mg, Ronozyme® NP—150 mg, monensin—Na—110 mg (only grower), narasin—50 mg (only starter), nicarbazin—50 mg (only starter), antioxidant—25 mg, Zn (as ZnSO4·H2O)—125 mg, Cu (as CuSO4·5H2O)—20 mg, Fe (as FeSO4·H2O)—75 mg, Mn (as MnO)—125 mg, I (as KI)—1.35 mg, Se (as Na2SeO3)—270 μg. 2 Phytase: Quantum Blue® (AB Vista, Marlborough, UK). 3 NSP enzyme: beta—glucanase, Econase GT 200 P® (AB Vista, Marlborough, UK).
Table 3. The measured nutrient content of experimental diets (%).
Starter DietsGrower DietsFinisher Diets
CBOCBOCBO
DM89.3089.5489.9489.6389.8390.1889.7190.4291.21
crude protein22.8723.2421.8821.4322.3821.3619.9119.9619.63
crude fat8.199.1812.448.4610.0611.778.1410.0211.99
crude fiber3.714.144.972.713.684.522.514.095.06
soluble dietary fiber2.132.542.32.132.512.332.082.662.49
ash6.496.676.575.716.156.125.705.825.74
NFE48.0445.3144.0851.3247.5646.4153.4550.5348.79
Ca0.981.071.100.860.950.970.850.890.90
P0.710.750.720.690.670.720.700.600.66
starch32.9425.8526.7335.5729.2329.0239.4133.8633.18
NDF17.0818.8419.9313.0712.6116.6513.9116.1628.99
ADF5.976.827.204.715.165.785.417.106.16
AMEn (MJ/kg) *12.3911.8312.6812.7612.4312.8013.1212.8713.33
CYS0.350.40.360.330.380.370.320.350.35
MET0.710.710.650.610.590.580.50.430.46
THR0.90.930.840.810.840.830.740.720.72
VAL1.081.151.031.021.081.030.890.920.89
ILE0.920.950.890.820.850.820.70.680.69
PHE1.121.221.091.041.080.990.980.990.97
HIS0.60.640.570.520.580.50.550.540.52
LYS1.511.481.411.221.271.241.070.971.03
ARG1.581.611.521.481.441.551.381.281.34
* AMEn values were calculated according to EU regulation 152/2009.
Table 4. Effects of dietary treatments on ileal viscosity and cecal short-chain fatty acid concentrations.
Dietary Treatmentsp—Value
C
Mean ± SD
B
Mean ± SD
O
Mean ± SD
IleumViscositymPa.s3.29 ± 0.151 b4.97 ± 0.250 a3.44 ± 0.155 b<0.001
CecumAcetateSCFA
µmol/g
49.71 ± 7.63 a36.54 ± 15.95 b35.81 ± 17.17 ab0.041
Propionate7.27 ± 2.36 a3.23 ± 1.95 b6.46 ± 3.85 ab0.007
n-Butyrate0.49 ± 0.180.38 ± 0.230.50 ± 0.250.318
Butyrate13.54 ± 3.999.81 ± 4.9210.03 ± 5.370.191
n-Valerate0.46 ± 0.250.34 ± 0.290.55 ± 0.310.201
Valerate0.81 ± 0.16 ab0.49 ± 0.28 b0.79 ± 0.40 a0.026
Total SCFA72.29 ± 11.07 a50.79 ± 22.14 b54.15 ± 26.17 ab0.037
C: Control: maize-based diet; B: barley-based diet; O: oat-based diet. The values are the mean of relative abundances ± SD (standard deviation). Results of Kruskal–Wallis test (K–W) and the post hoc Dunn’s multiple comparisons test with Bonferroni correction. a,b values within the mean columns with different lowercase letters were significantly different (p < 0.05).
Table 5. Diversity indices of the intestinal microbiota of broiler chickens.
Chao1
Mean ± SD
Shannon
Mean ± SD
Simpson
Mean ± SD
JCC129.94 ± 23.95 B2.30 ± 0.410.83 ± 0.05
B184.85 ± 26.21 A2.68 ± 0.490.85 ± 0.10
O157.93 ± 43.21 B2.27 ± 0.300.81 ± 0.07
K–W Sig0.0560.3360.404
JMC209.99 ± 96.052.73 ± 0.47 B0.87 ± 0.05
B164.21 ± 89.543.44 ± 0.44 A0.92 ± 0.03
O144.92 ± 27.012.94 ± 0.36 B0.89 ± 0.04
K–W Sig0.3570.0930.177
CCC501.04 ± 18.95 a4.64 ± 0.08 ab0.98 ± 0.004
B406.75 ± 28.01 b4.40 ± 0.14 b0.97 ± 0.01
O496.48 ± 18.59 a4.72 ± 0.14 a0.98 ± 0.01
K–W Sig0.0090.0170.459
C: Control: maize-based diet; B: barley-based diet; O: oat-based diet. The values are the mean of relative abundances ± SD (standard deviation). Results of Kruskal–Wallis test (K–W) and the post hoc Dunn’s multiple comparisons test with Bonferroni correction. a,b values within the mean columns with different lowercase letters were significantly different (p < 0.05). A,B  p values between 0.05 and 0.1 were considered as a trend.
Table 6. Relative abundance of bacterial phyla in the different sampling places (%).
ActinobacteriaActinobacteriaBacteroidetesCyanobacteriaDeinococcus—ThermusFirmicutesPatescibacteriaProteobacteriaTenericutesVerrucomicrobia
JCC0.001.850.010.150.0097.930.010.050.000.00
B0.004.750.130.120.0094.860.010.130.000.00
O0.003.190.010.080.0096.590.020.110.000.00
Pooled SEM0.001.050.070.070.001.050.010.040.000.00
Asymp. Sig.1.0000.1790.4260.7791.0000.2080.5800.2300.3680.368
JMC0.010.441.030.050.0097.69 a0.010.76 b0.00 b0.01
B0.012.363.870.700.0389.42 b0.003.47 a0.11 a0.02
O0.001.530.480.050.0696.24 ab0.011.62 ab0.00 b0.00
Pooled SEM0.010.881.450.250.031.180.010.350.060.01
Asymp. Sig.0.4090.1850.2810.4260.1610.0040.5810.0060.0320.291
CCC0.000.29 ab9.280.100.0089.590.000.200.07 ab0.46
B0.006.73 a8.200.070.0084.210.000.250.53 a0.01
O0.000.17 b11.320.240.0087.640.000.400.07 b0.15
Pooled SEM0.000.951.430.050.001.290.000.080.060.23
Asymp. Sig.1.0000.0080.2100.0611.0000.0691.0000.3100.0070.193
C: Control: maize-based diet; B: barley-based diet; O: oat-based diet. The values are the mean of relative abundances ± SEM (standard error of the mean). Results of Kruskal–Wallis test and the post hoc Dunn’s multiple comparisons test with Bonferroni correction. a,b values within the mean rows with different lowercase letters were significantly different (p < 0.05). Results between 0.05 and 0.1 (0.05 < p < 0.10) were considered a trend (T).
Table 7. Relative abundance of bacterial genera in cecum content of broiler chickens as affected by dietary treatments (%).
Phylum
Class
FamilyGenusCBOPooled
SEM
Sig.
Actinobacteria
Actinobacteria
BifidobacteriaceaeBifidobacterium0.21 ab6.63 a0.09 b0.9500.005
Bacteroidetes
Bacteroidia
BacteroidaceaeBacteroides6.614.906.221.0930.677
RikenellaceaeAlistipes2.673.305.100.9920.326
Firmicutes
Bacilli
LactobacillaceaeLactobacillus10.4811.058.891.3770.533
StreptococcaceaeStreptococcus4.74 a2.54 ab0.67 b0.6950.009
Firmicutes
Clostridia
ChristensenellaceaeChristensenellaceae R-7 gr.1.68 ab1.16 b2.31 a0.2160.026
PeptostreptococcaceaeRomboutsia4.964.103.450.9210.275
LachnospiraceaeCHKCI0014.311.082.971.1080.164
Ruminococcus torques gr.2.193.822.260.7210.228
Sellimonas1.10 b1.41 ab1.90 a0.1640.032
Eubacterium hallii gr.0.561.050.980.1450.080
Anaerostipes0.22 b1.30 a0.48 b0.2150.010
Eubacterium ventriosum gr.0.02 a0.00 b0.00 b0.0040.031
Marvinbryantia0.09 ab0.07 b0.19 a0.0260.047
Blautia2.911.422.520.4860.059
Lachnoclostridium0.370.700.500.0820.071
Lachnoclostridium 50.030.060.010.0200.097
RuminococcaceaeFaecalibacterium7.819.3412.361.3930.125
Ruminococcaceae UCG-0040.16 b0.19 ab0.28 a0.0240.035
Ruminococcaceae UCG-0054.55 a1.15 b3.77 a0.6630.009
Ruminococcaceae UCG-0081.00 ab0.00 b1.48 a0.3530.008
Ruminococcaceae UCG-0143.70 ab1.87 b4.39 a0.5250.034
Ruminococcaceae NK4A214 gr.0.32 b0.23 b0.75 a0.0640.006
Subdoligranulum2.763.932.620.5200.196
Butyricicoccus2.001.821.480.4540.887
Ruminococcus 20.58 a0.02 b0.50 a0.1090.008
Ruminiclostridium 51.091.731.050.2310.176
Eubacterium coprostanoligenes gr.0.780.691.010.1470.405
Anaerotruncus0.03 ab0.004 b0.06 a0.0090.016
Anaerofilum0.08 ab0.02 b0.09 a0.0230.025
GCA-9000662250.14 a0.065 ab0.058 b0.0230.038
Family XIIIFamily XIII UCG-0010.0020.020.000.0060.088
Clostridiales vadin-BB60 groupuncultured Clostridia bacterium0.040.200.140.0620.080
Firmicutes
Erysipelotrichia
Erysipelotrichaceae
Turicibacter3.001.691.100.5270.112
Erysipelatoclostridium2.57 b7.35 a3.94 ab0.7980.016
Not Assigned 18.6717.2217.840.9000.357
Other genera 7.567.868.561.758
100.00100.00100.00
C: Control: maize-based diet; B: barley-based diet; O: oat-based diet. The values are the mean of relative abundances ± SEM (standard error of the mean). Results of Kruskal–Wallis test and the post hoc Dunn’s multiple comparisons test with Bonferroni correction. a,b values within the mean rows with different lowercase letters were significantly different (p < 0.05). Results between 0.05 and 0.1 (0.05 < p < 0.10) were considered a trend (T).
Disclaimer/Publisher’s Note: The statements, opinions and data contained in all publications are solely those of the individual author(s) and contributor(s) and not of MDPI and/or the editor(s). MDPI and/or the editor(s) disclaim responsibility for any injury to people or property resulting from any ideas, methods, instructions or products referred to in the content.

