Article

A Study on the Calibration of Wheat Seed Interaction Properties Based on the Discrete Element Method

1
College of Mechanical and Electronic Engineering, Northwest A&F University, Xianyang 712100, China
2
College of Water Resources and Architectural Engineering, Northwest A&F University, Xianyang 712100, China
3
Technical Faculty, Saken Seifullin Kazakh Agrotechnical University, Nur-Sultan 010000, Kazakhstan
4
College of Mechatronic Engineering, North Minzu University, Yinchuan 750021, China
5
Department of Science, Zhangir Khan West-Kazakhstan Agrarian-Technical University, Uralsk 090009, Kazakhstan
*
Author to whom correspondence should be addressed.
Agriculture 2022, 12(9), 1497; https://doi.org/10.3390/agriculture12091497
Submission received: 25 August 2022 / Revised: 13 September 2022 / Accepted: 15 September 2022 / Published: 18 September 2022
(This article belongs to the Section Agricultural Technology)

Abstract

:
The interaction properties of the seeds have to be calibrated to simulate the realistic behavior of the seed bulk. Here, a simple and accurate calibration method of DEM interaction properties of seeds with adequate equipment to simulate each seed’s behavior remains a challenge. In this research, the rotary drum is chosen as simple equipment to calibrate particle–particle and particle–material interaction properties, as there is a lack of research on whether the rotary drum is adequate equipment to calibrate particle–material interaction properties. Therefore, this article calibrates particle–particle and particle–material static and rolling interaction coefficients using a rotary drum. The calibration of particle–material static and rolling friction coefficients are described using the rotating drum with a 45 degrees inclination. The particle–particle static and rolling friction coefficients were calibrated according to the angle of repose when the rotary drum is vertical.

1. Introduction

Wheat is the staple food mostly used for human consumption in many areas of the world. Therefore, it is important to investigate wheat seeds’ interactions with various materials when developing seeding machines, sorting machines, or transport. When providing various operations, wheat seeds contact with various materials. For example, the seed boxes and colters of the wheat seeding machines are made of steel. In contrast, the metering devices, including the roller, are made of acrylic PLA material printed on a 3D printer [1,2].
The discrete element method (DEM), a numerical technique for simulating the mechanical behavior of granular assemblies, has the advantage of data tracking, such as the trajectories, velocities, and transient forces of all particles at any stage of the process [3]. Moreover, DEM simulation is economically profitable since there is no need to carry out real experiments when optimizing equipment parameters since manufacturing equipment with different parameters is an additional cost [4]. Therefore, the DEM has been applied to simulate the bulk behavior of agricultural seeds, granular particles, and pharmaceutical tablets at the individual particle scale, not providing high-cost actual experiments that need expensive sensors to observe the experiment process [5,6,7,8,9]. The simulation accuracy of the DEM bulk behavior depends on the chosen DEM model depending on the particle moisture [10] and input properties that need to be calibrated. In this article, wheat seeds’ interaction properties are calibrated as calibration is necessary for the simulation. The accurate measurement of the interaction properties does not simulate actual bulk behavior because it is impossible to generate every particle’s exact shape and size in the DEM [11]. Scientists have developed equipment for calibrating interaction properties on DEM [12]. The types of equipment to calibrate particle–particle interaction properties on DEM are well studied [13,14,15]. However, developing simple equipment for calibrating particle–material interaction properties on DEM is still a challenge.
Rotating drum equipment has been used to calibrate the particle-to-particle and particle-to-material static and rolling friction coefficients, in rotating drums with diameters of 300 mm and 130 mm, where the dynamic angle of repose of the upward and downward flow of particles is measured [16,17]. However, there is no information on particle–material static and rolling friction properties calibration using rotating drum equipment. There is a matter of whether the exact angle of repose (AOR) can be used as a response to calibrate particle–particle and particle–material static and rolling friction coefficients [18]. This study hypothesized that the tilt of the rotating drum is an important factor in improving the particle-to-material interaction properties. The initial function of the inclined rotary drum is to granulate the powder fertilizers [19,20,21]. The behavior of the particles on the surface of the pile adjacent to the material depends on the rotating drum inclination. When the rotating drum is vertical, the mass of particles is downward, and contact with the material depends on whether adjacent particles are pushed toward the material. When the rotating drum is inclined, the mass of particles is directed toward the material contacting it. Therefore, this research aimed to determine the rotating drum test conditions to calibrate particle–material static and rolling friction coefficients. Calibration is typically performed using a “trial and error” approach or optimization algorithms [22]. Here, we adopt the central composite plan (CCP) as an optimization algorithm.

2. Materials and Methods

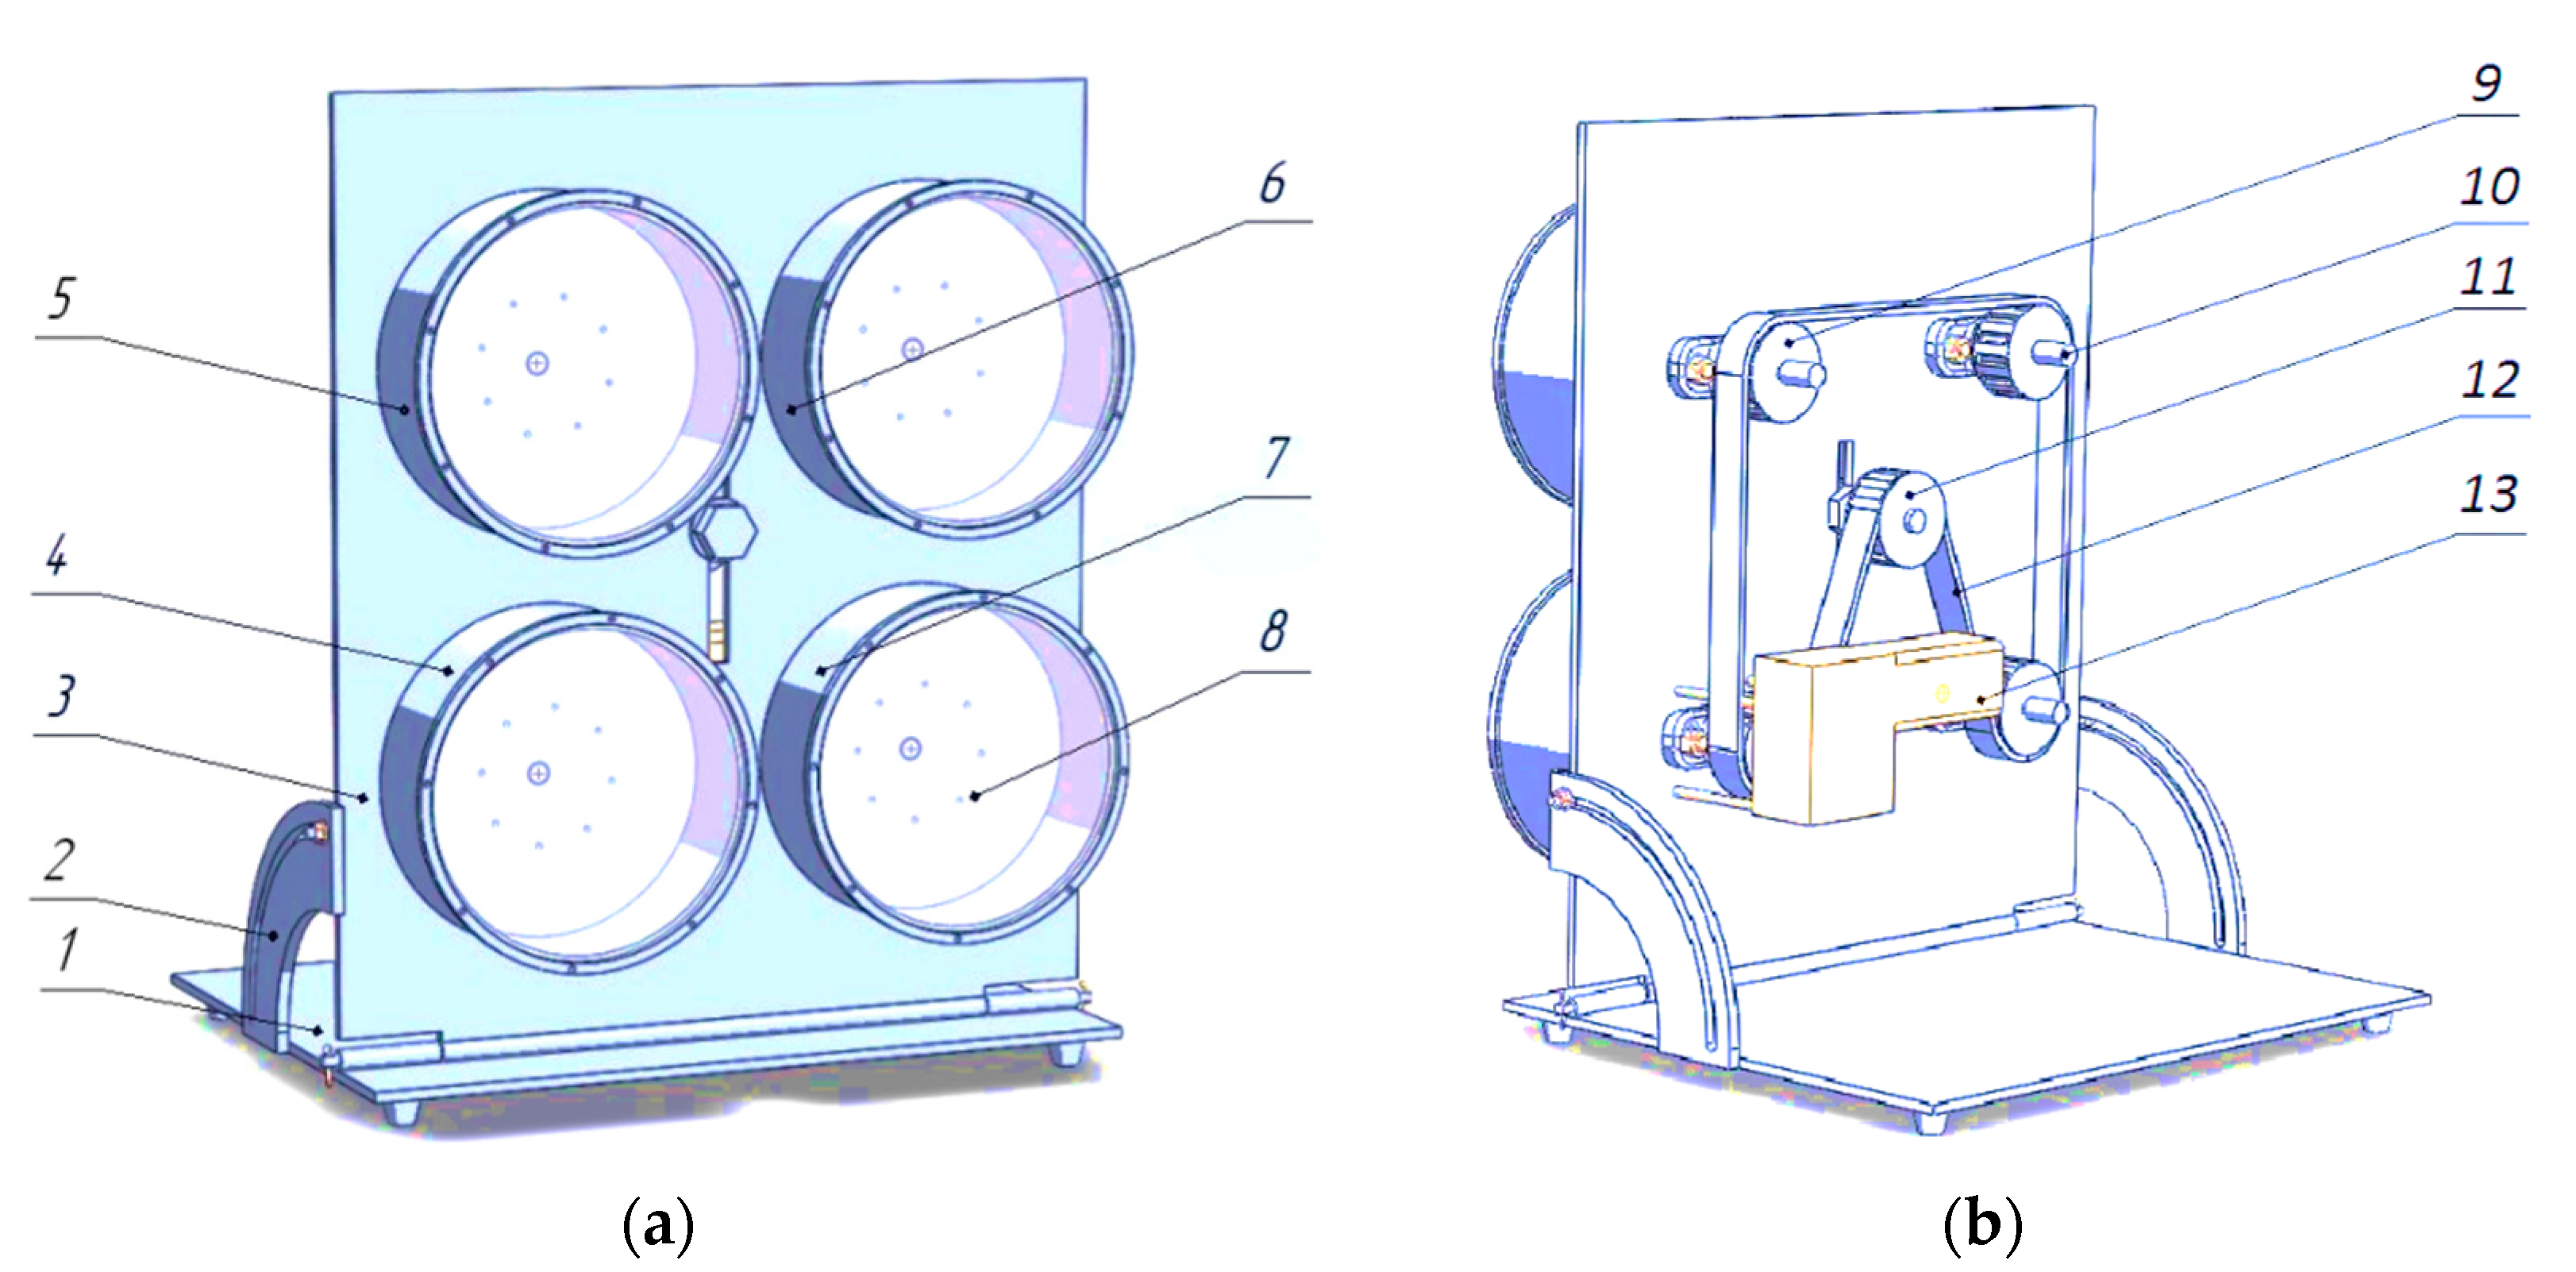
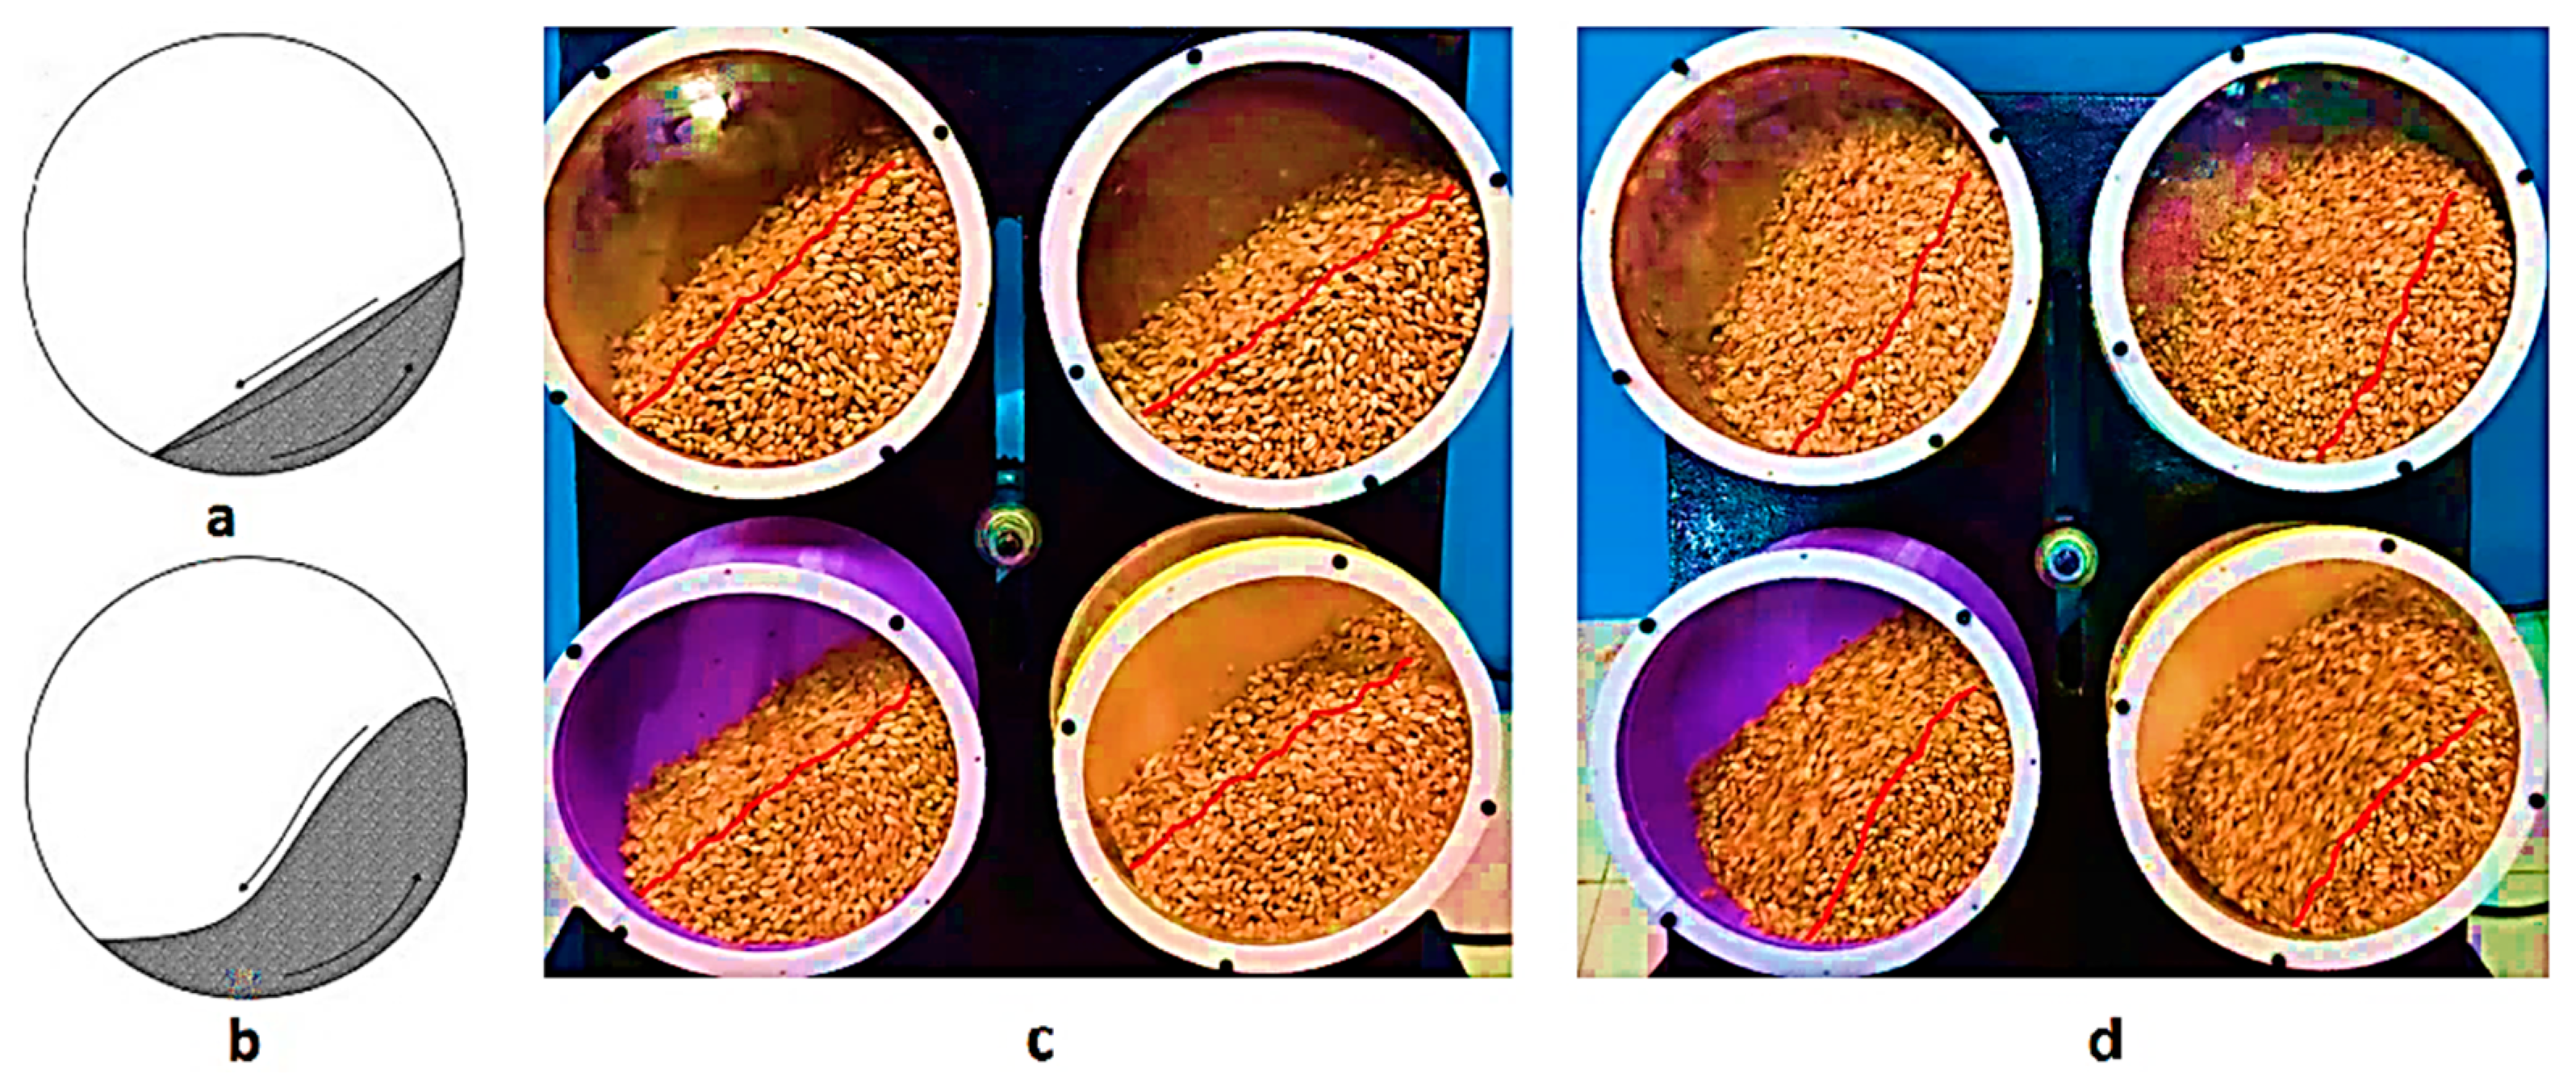
2.1. Rotary Drum Equipment

The experiments were provided with rotary drum equipment (Figure 1). All the rotary drum equipment parts were set on a stand (1). The angle retainer (2) was fixed to the stand, and the angle retainer regulated the inclination of the plane plate (3). The bearings were set on the plain plate holding four drums. The PLA drum (4) is printed with a 3D printer. The soil drum (5) was prepared by gluing the soil particles into the PLA drum. Soil particles covered all the surfaces of the glue. Steel (6) and acrylic (7) drums were made of steel and acrylic materials. The inner diameters and the inner length of the drums were 150 and 50 mm, respectively. The drums were covered by an acrylic drum cover (8) so that the behavior of the wheat seed particles was visible inside the drum. The drums were rotated using the pulley (9) fixed to the drum shaft (10). The drum shafts are fixed to the plane plate through the bearings and moved with it. The traction pulley (11) tightened the belt (12) that connects all the pulleys. The stepper motor with gear (13) was fixed to the plane plate and clockwise rotating one of the bottom pulleys. As all the pulleys were the same and connected by a belt, the drums rotated clockwise with the same speed.

2.2. Experimental Procedure

2.2.1. Real Experiment Procedure

First, to determine the weight of the seeds filled to fifty percent of the drum volume, the drum was filled with seeds, and the weight of the seeds, excluding the weight of the drum, was measured with a scale. Half the measured weight of the seeds was taken as fifty percent to fill the drum for the experiment. When the drums were half full, they were covered with an acrylic drum cover. Four drums of different materials were filled with the same mass of wheat seeds. The rotary drums are made of various materials to investigate if the material influences the wheat pile AOR depending on the plain plate position. Second, the tilt of the rotating drum was adjusted by tilting the plain plate and securing the plain plate in this position with a corner retainer. Third, the drum began to rotate clockwise, and a high-speed camera captured the behavior of the seeds. In this study, drum speed was not chosen as a factor because it was believed that a slow rotation would eliminate particle-to-particle and particle-to-material collisions. The rotational speed is determined experimentally not allowing cascading regime but a rolling regime of wheat seed particles [23,24]. The experiments were performed when the plane plate position was vertical and was inclined at a 45-degree angle. When the AOR of the seed pile was chosen as the response for the experiment, the angle of the plain plate was considered a single factor for the experiment. The results of the single-factor experiment were analyzed to determine if the plain plate angle influences the calibration of the particle–particle and particle–material interaction properties of the wheat seeds. If the difference is insignificant, the hypothesis that the tilt of the rotating drum is an important factor in improving the particle-to-material interaction properties is rejected. If the difference is significant, wheat seeds’ particle–particle and particle–material interaction properties are calibrated on DEM using rotary drum equipment.

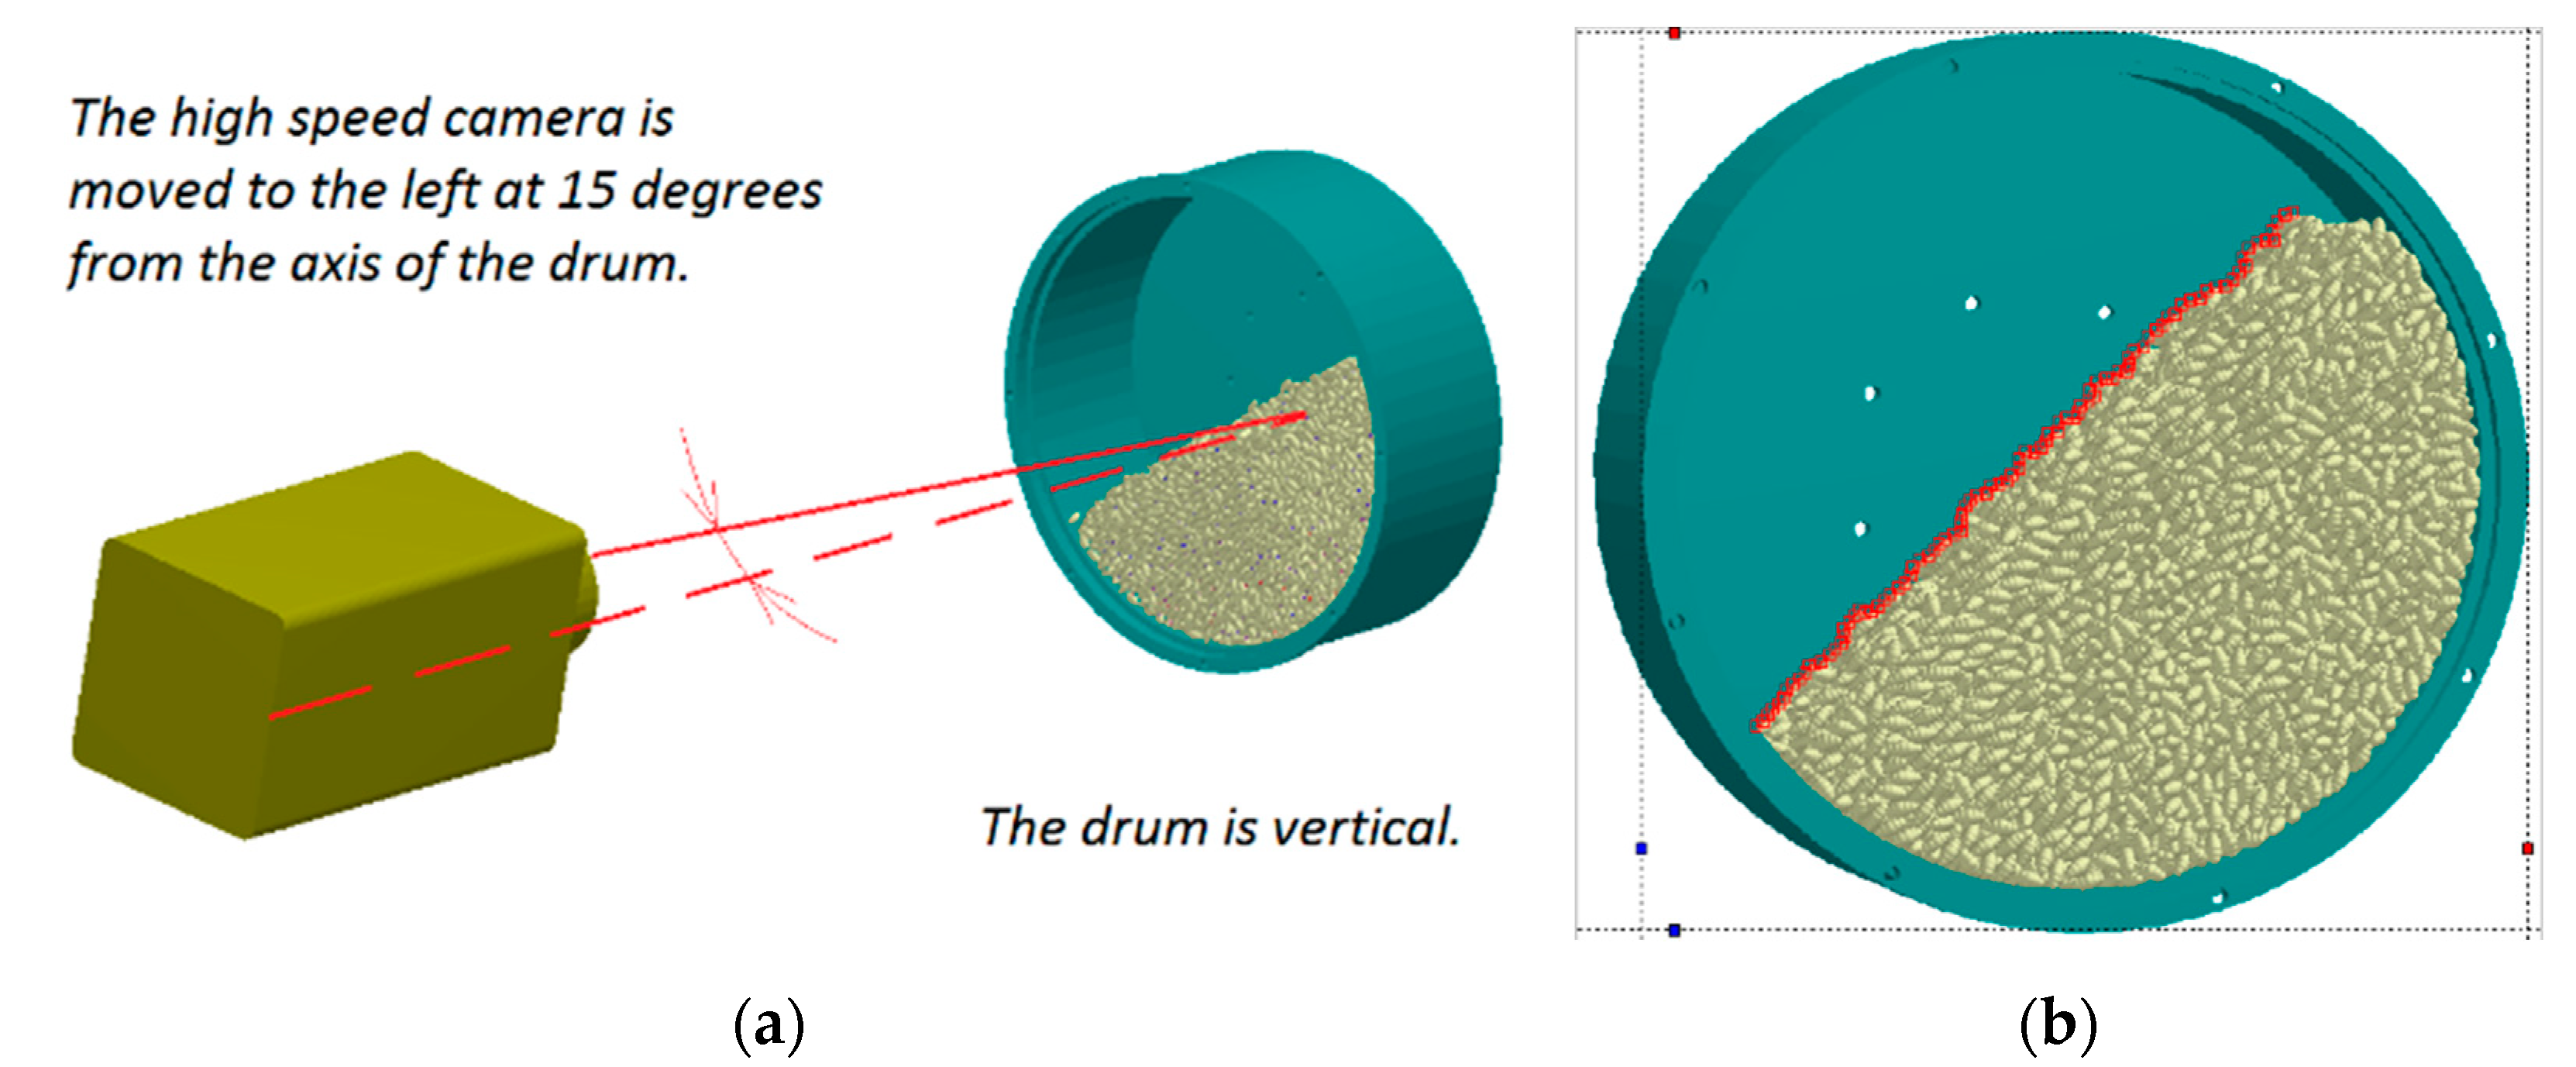
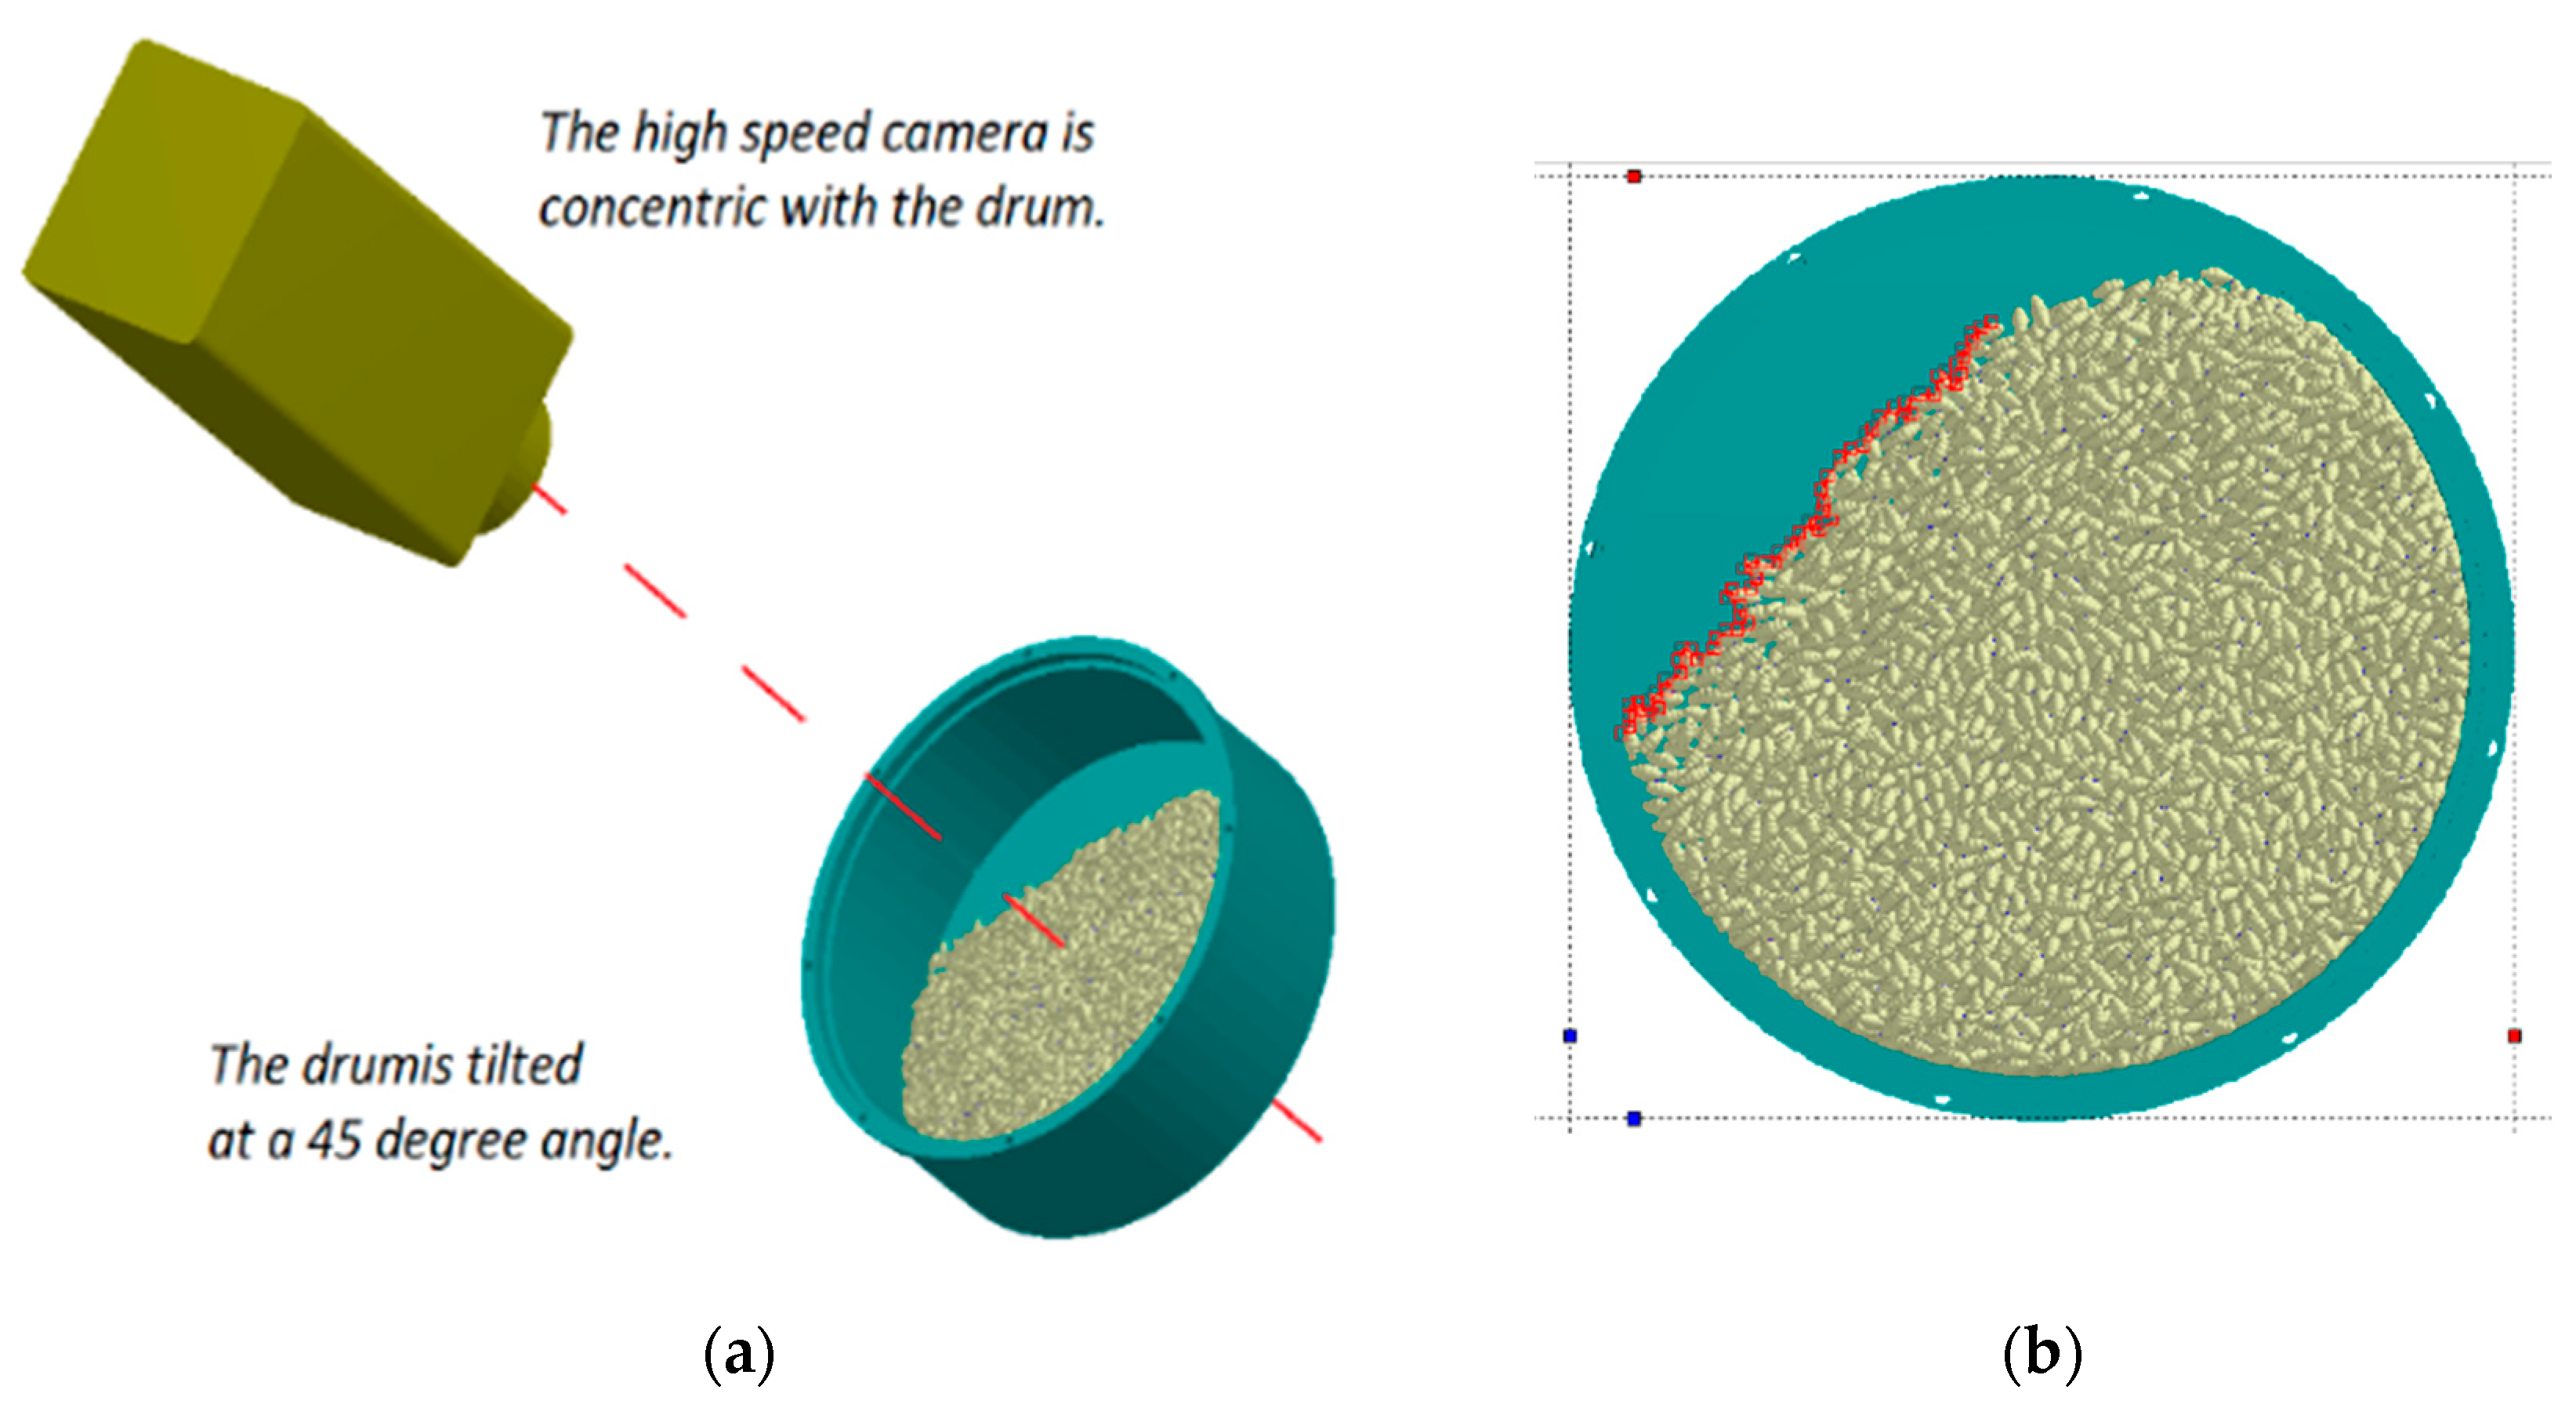
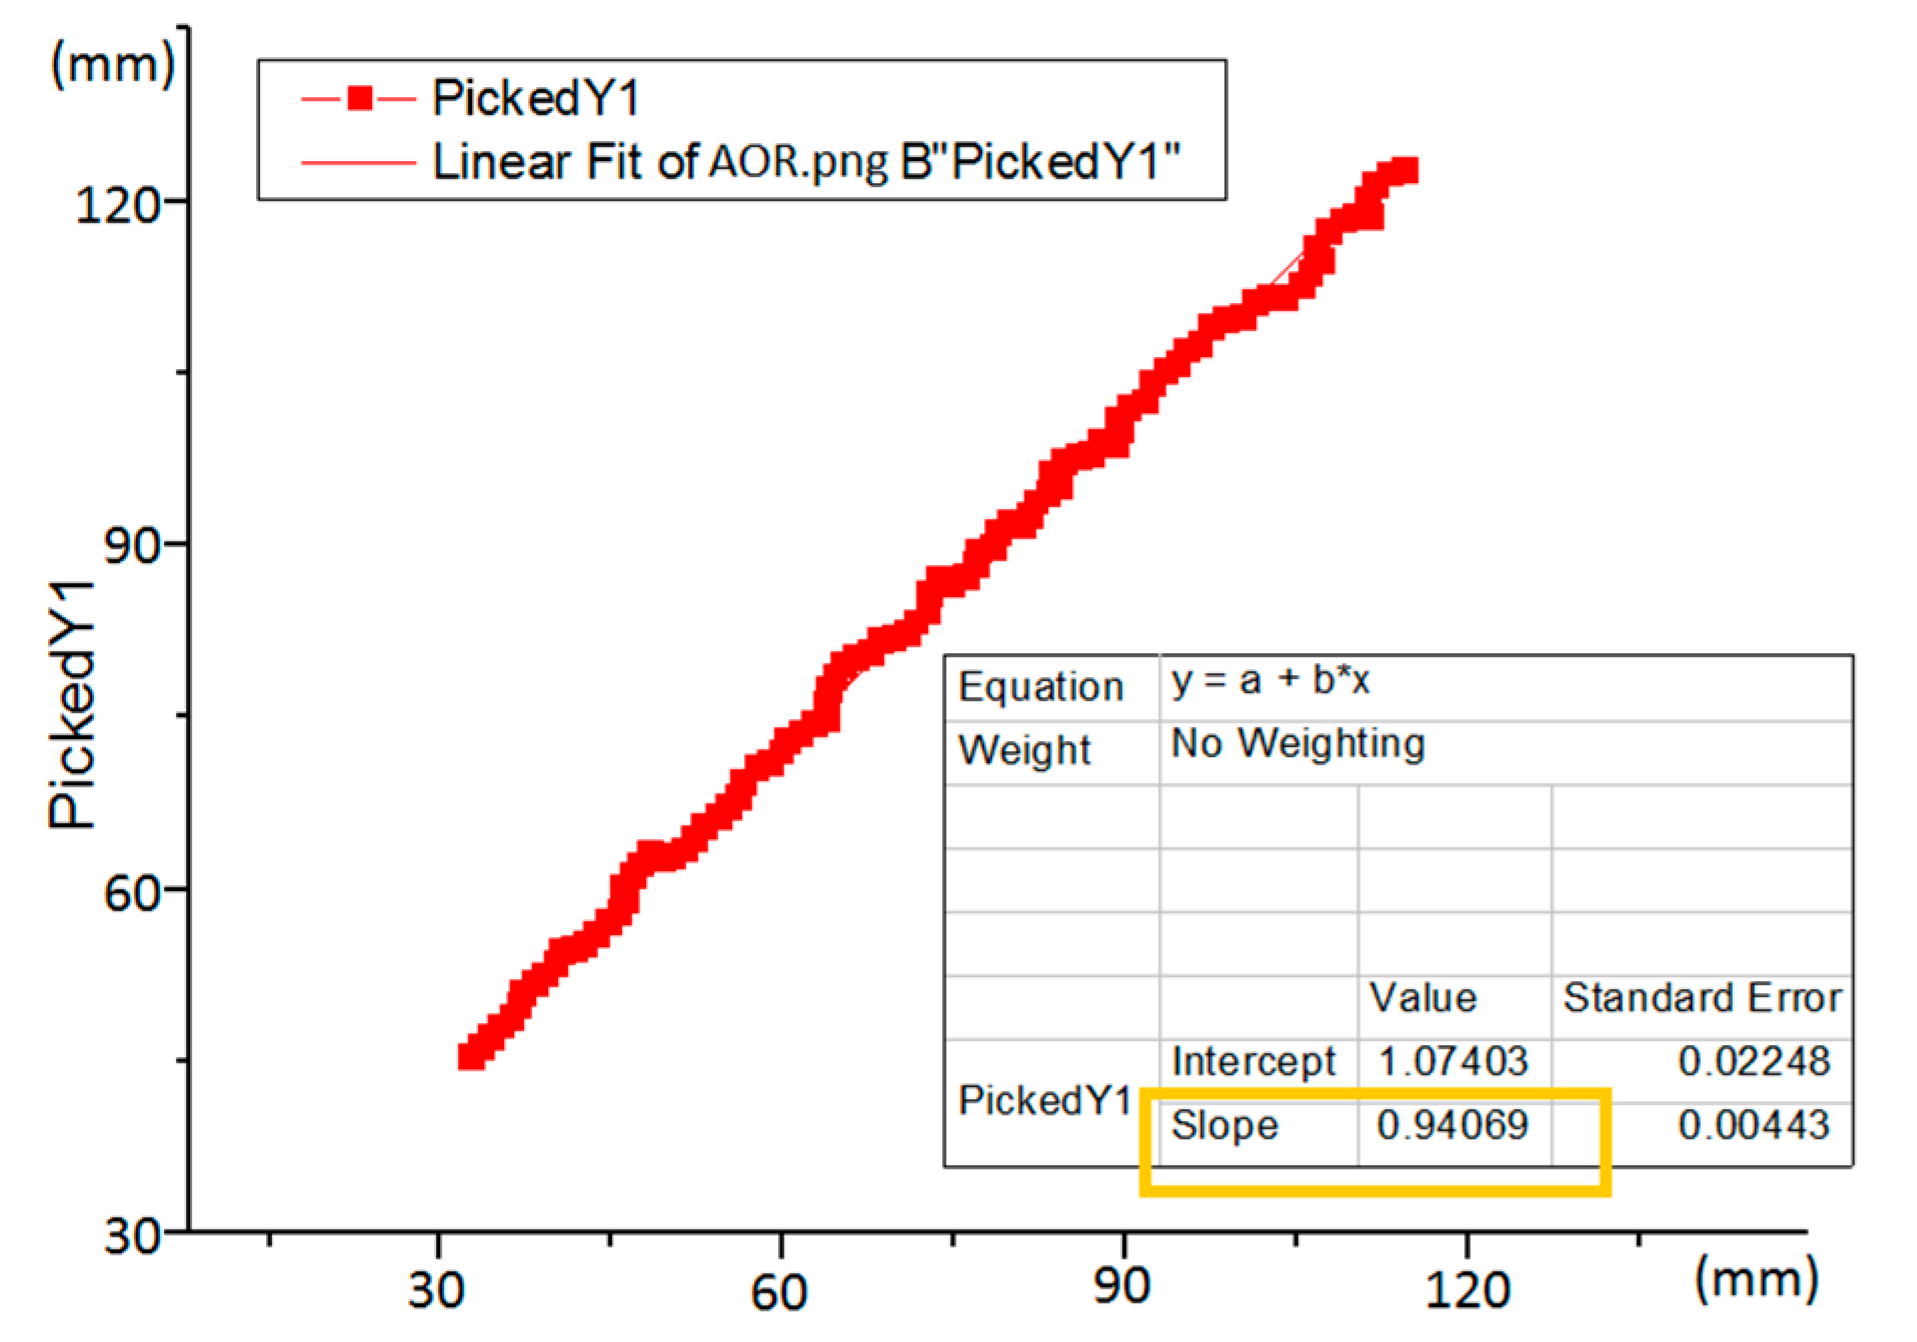
2.2.2. Measurement of the AOR of the Seeds Pile Depending on Rotary Drum Tilt

Images of the rotating drum were captured using the high-speed camera to determine the AOR of the seed pile in Cartesian coordinates employing OriginPro software. The AOR of the particles was measured adjacent to the material side to determine the influence of the material. When the rotary drum position was vertical, the particle pile adjacent to the material was invisible. Therefore, the high-speed camera is moved to the left 15 degrees from the axis of the drum (Figure 2a). Moving the camera to the left does not influence the results as the data are digitalized in Cartesian coordinates (Figure 2b). When the rotating drum is tilted at 45 degrees, the camera is concentric as the particle pile adjacent to the material is visible (Figure 3a,b). The pictures were digitized in Cartesian coordinates. The digitized sample points adjacent to the material in the images are linearly fitted to determine the slope of the pile (Figure 4). The arctangent of the slope was taken as an AOR of the conical pile of the particles. It should be noted that linear regression depends on the number of points sampled along the border. The number of sampling points was considered sufficient in this study because the distance between the sampling points was 0.05 mm. It should be noted that all the conditions to determine the AOR were identical. The four pictures were randomly chosen from the pictures taken by a high-speed camera to determine the wheat pile AOR. The average of four values of the AOR in the experiment was considered the target value to calibrate the interaction properties.

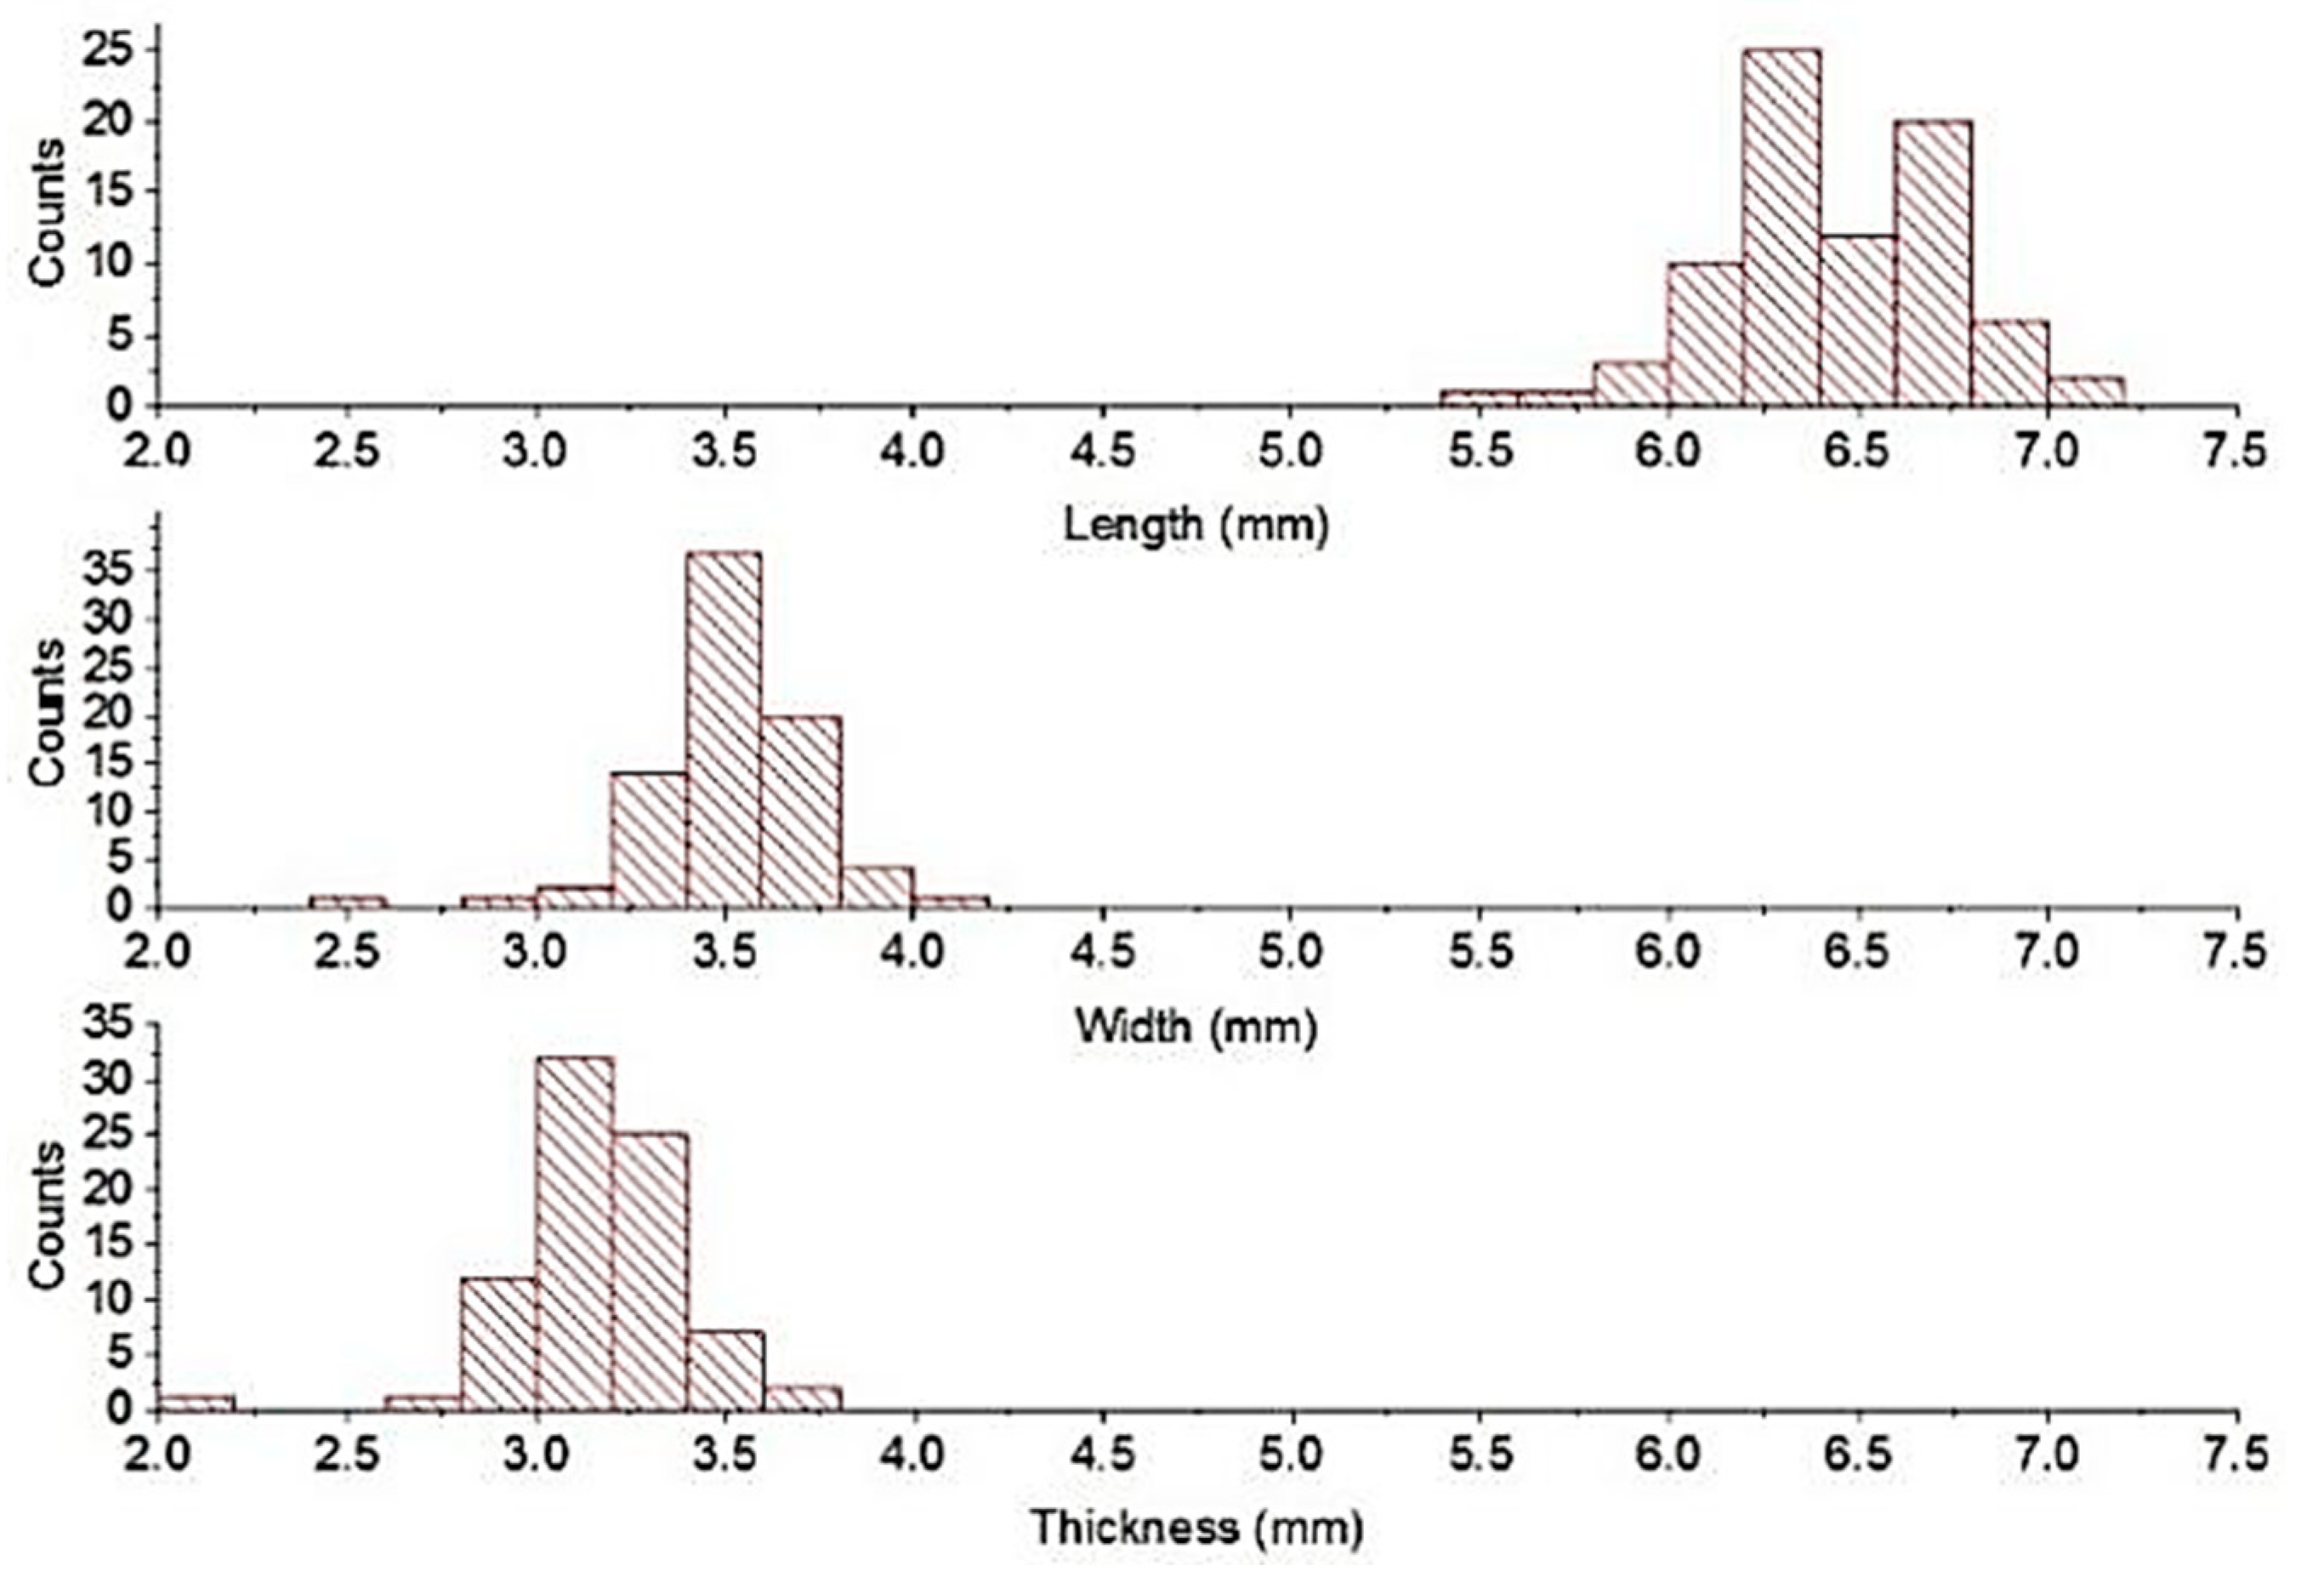
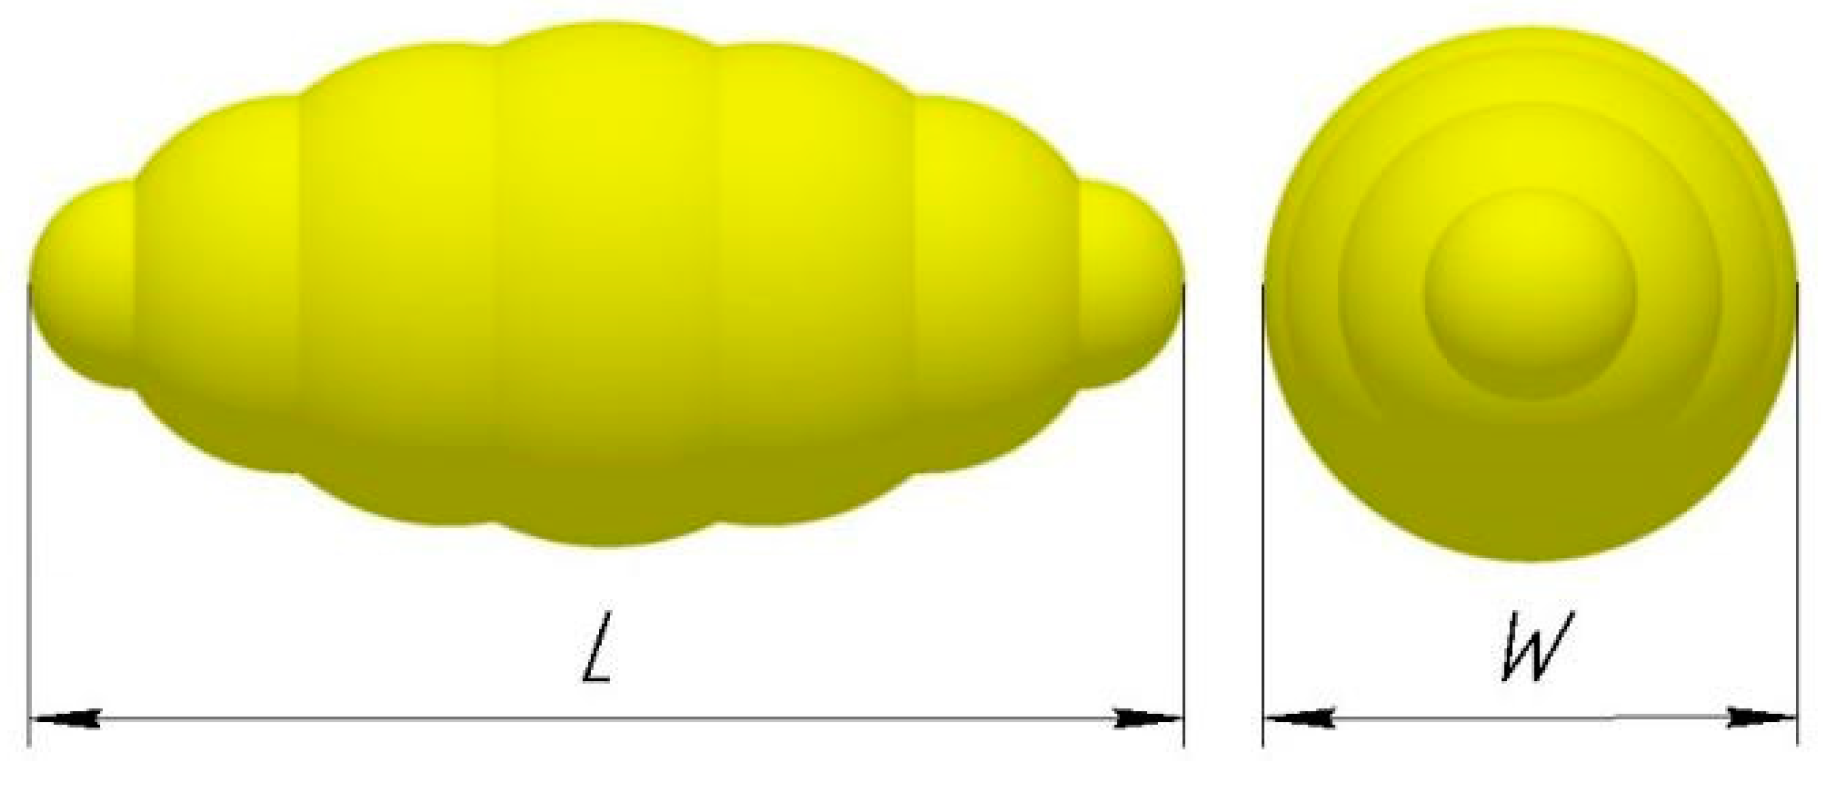
2.2.3. Measurement of Seed Sizes and Seed Generation on DEM

A dial caliper was used to measure three orthogonal dimensions of 80 randomly selected seeds of wheat. The largest of the three dimensions was the length, the second largest was the width, and the smallest was the thickness. The sphericity of the particles was calculated using Equation (1) [25]:
S = L W T 3 L
where L, W, and T are the seeds’ length, width, and thickness (mm); S is the sphericity of the seeds (dimensionless). The data of 80 randomly selected wheat seeds were analyzed according to the normal distribution, and seven sizes of the wheat seeds were generated on DEM.
The liquid displacement method was used to determine the density of the wheat seeds. A cylinder with an inner radius of 47.5 mm and a height of 45 mm was loaded with wheat seeds, and the weight was determined with an electronic scale (accuracy of 0.01 g). A wetting agent (polyethylene glycol tert-octylphenyl ether) was added to the water at a concentration of 1.5 g/L. The wetting agent prevents the wheat seeds from absorbing water by reducing the surface tension. Water was poured into the seed-filled cylinder to cover the seeds, and the volume of the poured water was considered free space between the seeds. The density of the seeds was determined as:
ρ s = m s V c V s
where m s is the mass of the seeds in the cylinder in g; V c is the volume of the cylinder in mm3; and V s is the free space between the seeds in mm3. The moisture of the seeds was measured before each test with a moisture analyzer.

2.2.4. DEM Input Parameters

The simulation was carried out on DEM. The particle size distribution must be known to determine the particle–particle and particle–material interaction properties significantly affecting the experimental results. The boundary conditions were not specified, since how the particles behave when leaving the domain is out of the scope of this manuscript. In the Hertz–Mindlin no-slip model, the Euler was selected as a time integration method. The Raleigh time-step was 30%. The estimated cell radius of the simulator grid was 3 mm.
Particle flow inside the rotating drum consists of two types of motion: translational and rotational and the equations are governed by Newton’s second law of motion [26,27,28].
m i d v i d t = j = 1 k F c , i j + m i g
I i d w i d t = j = 1 k M i j
where v i and w i are the translational and angular velocities of particle i , respectively, m i and I i are the mass and moment of inertia of particle i , m i g is the gravitational force acting on particle i , F c , i j and M i j are the contact force and torque acting on particle i by particle j or drum walls, respectively.
The particle–particle and particle–wall collision forces should be treated carefully since granular flow in the rotating drum is contact-dominated. Here, the popularly used Hertz–Mindlin model is used to describe the contact force. According to the model, the contact forces can be expressed as [27]
F c , i j = F c n , i j + F c t , i j
where F c n , i j is the normal contact force, while F c t , i j is the tangential contact force. They comprise two components: elastic and damping. The magnitudes of the elastic and damping normal forces are given by
F c n e = 4 3 E R δ n ( 3 / 2 )
F c n d = 2 5 6 β S n m V n r e l ¯
where the equivalent of Young’s modulus E , the equivalent radius R are defined as
1 E = 1 v i 2 E i + 1 v j 2 E j
1 R = 1 R i + 1 R j
where E i , v i , and R i are Young’s modulus, Poisson ratio, and particle radius. In Equation (7), V n r e l ¯ is the normal component of the relative velocity. m , β , and S n are equivalent mass, the factor of the coefficient of restitution, and the normal stiffness, respectively, and given by
1 m = 1 m i + 1 m j
β = ln e ln 2 e + π 2
S n = 2 E R δ n
where e is the coefficient of restitution, and δ n is the normal overlap.
The tangential contact force F c t , i j also consists of two components: elastic and damping. The magnitudes of the two components are, respectively, given by
F c t e = 2 G R δ n δ t
F c t d = 2 5 6 β S t m V t r e l ¯
where G is the equivalent shear modulus, and V t r e l ¯ is relative tangential velocity. The tangential force is limited by Coulomb friction F c t = μ s F n , where μ s is the friction coefficient, and F n is the normal force. The torque consists of the one from the tangential contact force and the so-called rolling friction. The rolling friction normally contributes to the settlement of particles from a dynamic into a static state. A more detailed discussion of the force models can be seen in [27].

2.2.5. Verification of the Shape, Size, and Density of the Wheat Seeds and Simulation on DEM

Wheat seeds in seven sizes were generated on DEM according to the normal distribution of the real wheat seeds. The size distribution and density of the particles were validated by comparing the mass of the wheat seeds in the vessel and that in the DEM simulation for an identical vessel. After validating the wheat seeds on DEM, the identical equipment is inserted into the DEM drawn by CAD. Each drum contained 9000 wheat particles, determined according to the weight of wheat seeds in a real experiment. The simulation of the generated wheat seeds and measuring the AOR of the wheat seed pile is identical to the real experiment. The coefficients of the particle–particle and particle–material interaction properties of the wheat seeds are varied when simulating on DEM according to CCP. The interaction coefficients’ low, mid, and high levels combinations were determined using the Design-Expert software to develop the CCP. Choosing the low and high levels is essential. If the range between the minimum and maximum values is large, there may not be sufficient points. If the range is small, some points may be outside of the range. During the simulation on DEM, the particle–particle and particle–material restitution coefficients were considered eliminated as the drums were rotating slowly. The restitution coefficients elimination decreases the number of simulations to calibrate other coefficients.

3. Results and Discussion

3.1. Results of Real Experiments and One-Way ANOVA of the Results of Real Experiments

The actual experiment results show that at 5 rpm of the drum the behavior of the wheat seeds is a rolling regime than the cascading regime (Figure 5a,b). The rolling regime allows the comparison of the experimental results according to a single AOR. Therefore, the experiments were provided when the drums were rotating at 5 rpm. The behavior of wheat seeds in the drums is demonstrated when the drums are inclined 90 degrees and 45 degrees and the red lines show the front line of the wheat seeds pile (Figure 5c,d).
The single factor actual experiment results varying the drum inclination angle with five replications are shown in Table 1. From the table, we can see that the AOR of the wheat pile increases when the plain plate is inclined 45 degrees independently of the material when the plain plate position is vertical.
One-way ANOVA of the single-factor experiment is shown in Table 2. When the drum inclination angle is 90 degrees, the p-value of the wheat was 0.68, more than 0.05. Therefore, according to the null hypotheses, the mean of the five replications can be considered equal to each other. This means the influence of the material is weak and can be neglected when the drum is inclined to 90 degrees. Thus, the average of sixteen samples was considered the target AOR for calibrating the particle–particle static friction and rolling coefficients for wheat 36.17 degrees. When the drum inclination angle was 45 degrees, the wheat p-value was less than 0.00. Therefore, the null hypothesis is rejected in favor of the alternate. It means that the influence of the material is strongly significant when the drum is inclined to 45 degrees. Thus, the average of four samples with various materials was considered the target AOR for calibrating the particle–material static friction and rolling friction coefficients. To calibrate wheat’s static and rolling friction coefficients with soil, steel, PLA, and acrylic, the target AORs were 61.32 degrees, 46.30 degrees, 40.31 degrees, and 43.65 degrees, respectively.

3.2. Results of the Seed Size Measurement and Generation on DEM

The sizes of eighty seeds were measured, and the normal distribution of the sizes of the seeds is shown in Figure 6. The range between maximum and minimum wheat length, width, and thickness was 1.56, 1.51, and 1.60 mm, respectively. The length of the wheat seed is much more than the width and thickness and the width more than the thickness. Pearson’s correlation coefficients of seed sizes are shown in Table 3. Pearson’s correlation coefficients of the wheat seed sizes show a significant correlation between length and thickness and between thickness and width. The significance of the correlation means that the width depends on the length: the longer the wheat, the wider it became, and the wider the wheat, the thicker it is. However, there were cases when the thickness was more than the width. Moreover, there were cases when the wheat width was more than another wheat width though the wheat length was less than another. The significance means that the number of cases is little and can be neglected. If the number of cases is high, Pearson’s correlation coefficients were not significant. The wheat length and width are chosen to generate wheat seeds on DEM (Figure 7). The generated wheat width depended on wheat length, which was increased depending on the increase of wheat length. The dimensions of the seven wheat seeds generated on DEM and their distribution is shown in Table 4. Each wheat seed particle was generated by combining seven spherical particles in one axis: one central spherical particle and three spherical particles from each side. The diameters of the three spherical particles have decreased to 0.30 mm, 0.80 mm, and 1.60 mm from the central spherical particle. The diameter of the central spherical particle was chosen depending on the length of the wheat seed. The distribution of wheat seeds was determined by the percentage depending on counts.

3.3. DEM Input Parameters

The simulation was carried out in the DEM. The values of the material properties used in the Hertz–Mindlin no-slip numerical model for the DEM simulations were obtained from the literature as the density and humidity of the experimental wheat seeds coincided (Table 5). AK58 variety of wheat seeds with a moisture content of 14% was used in the experiment. When simulating the drums on DEM, the material values were various consistent with the real experiment. The particle size distribution must be known to determine the particle–particle and particle–material interaction properties significantly affecting the experimental results. The boundary conditions were not specified since we were not interested in how the particles behave when leaving the domain.
The levels of static and rolling friction coefficients according to CCP are shown in Table 6. High levels of friction coefficients were determined by conducting experiments with DEM that the simulation results were far from the actual results of the experiment. Moreover, when the coefficient of friction is increased by more than 0.60, wheat seeds will behave like a cohesive material, while the behavior of real wheat seeds will not be cohesive. During the DEM simulation, particle–particle (C) and particle material (D) restitution coefficients were not considered a factor, and the middle levels were used to simulate. First and foremost, particle–particle static (A) and rolling (B) friction coefficients were calibrated. Second, A and B’s calibrated coefficients were used to calibrate particle–material static (D) and rolling (E) friction coefficients. When calibrating particle–particle static (A) and rolling (B) friction coefficients, the particle–material static (D) and rolling (E) friction coefficients are taken in the middle level as the real experiment analysis showed the negligible impact of the material on the wheat pile AOR when the drum was in the vertical position.

3.4. Simulation Results

Simulation results on DEM according to CCP with two factors and five levels when the plain plate was vertical and was inclined at 45 degrees are shown in Table 7 and Table 8, respectively. Each sample was simulated once, and the average wheat pile AOR of four drums was taken.

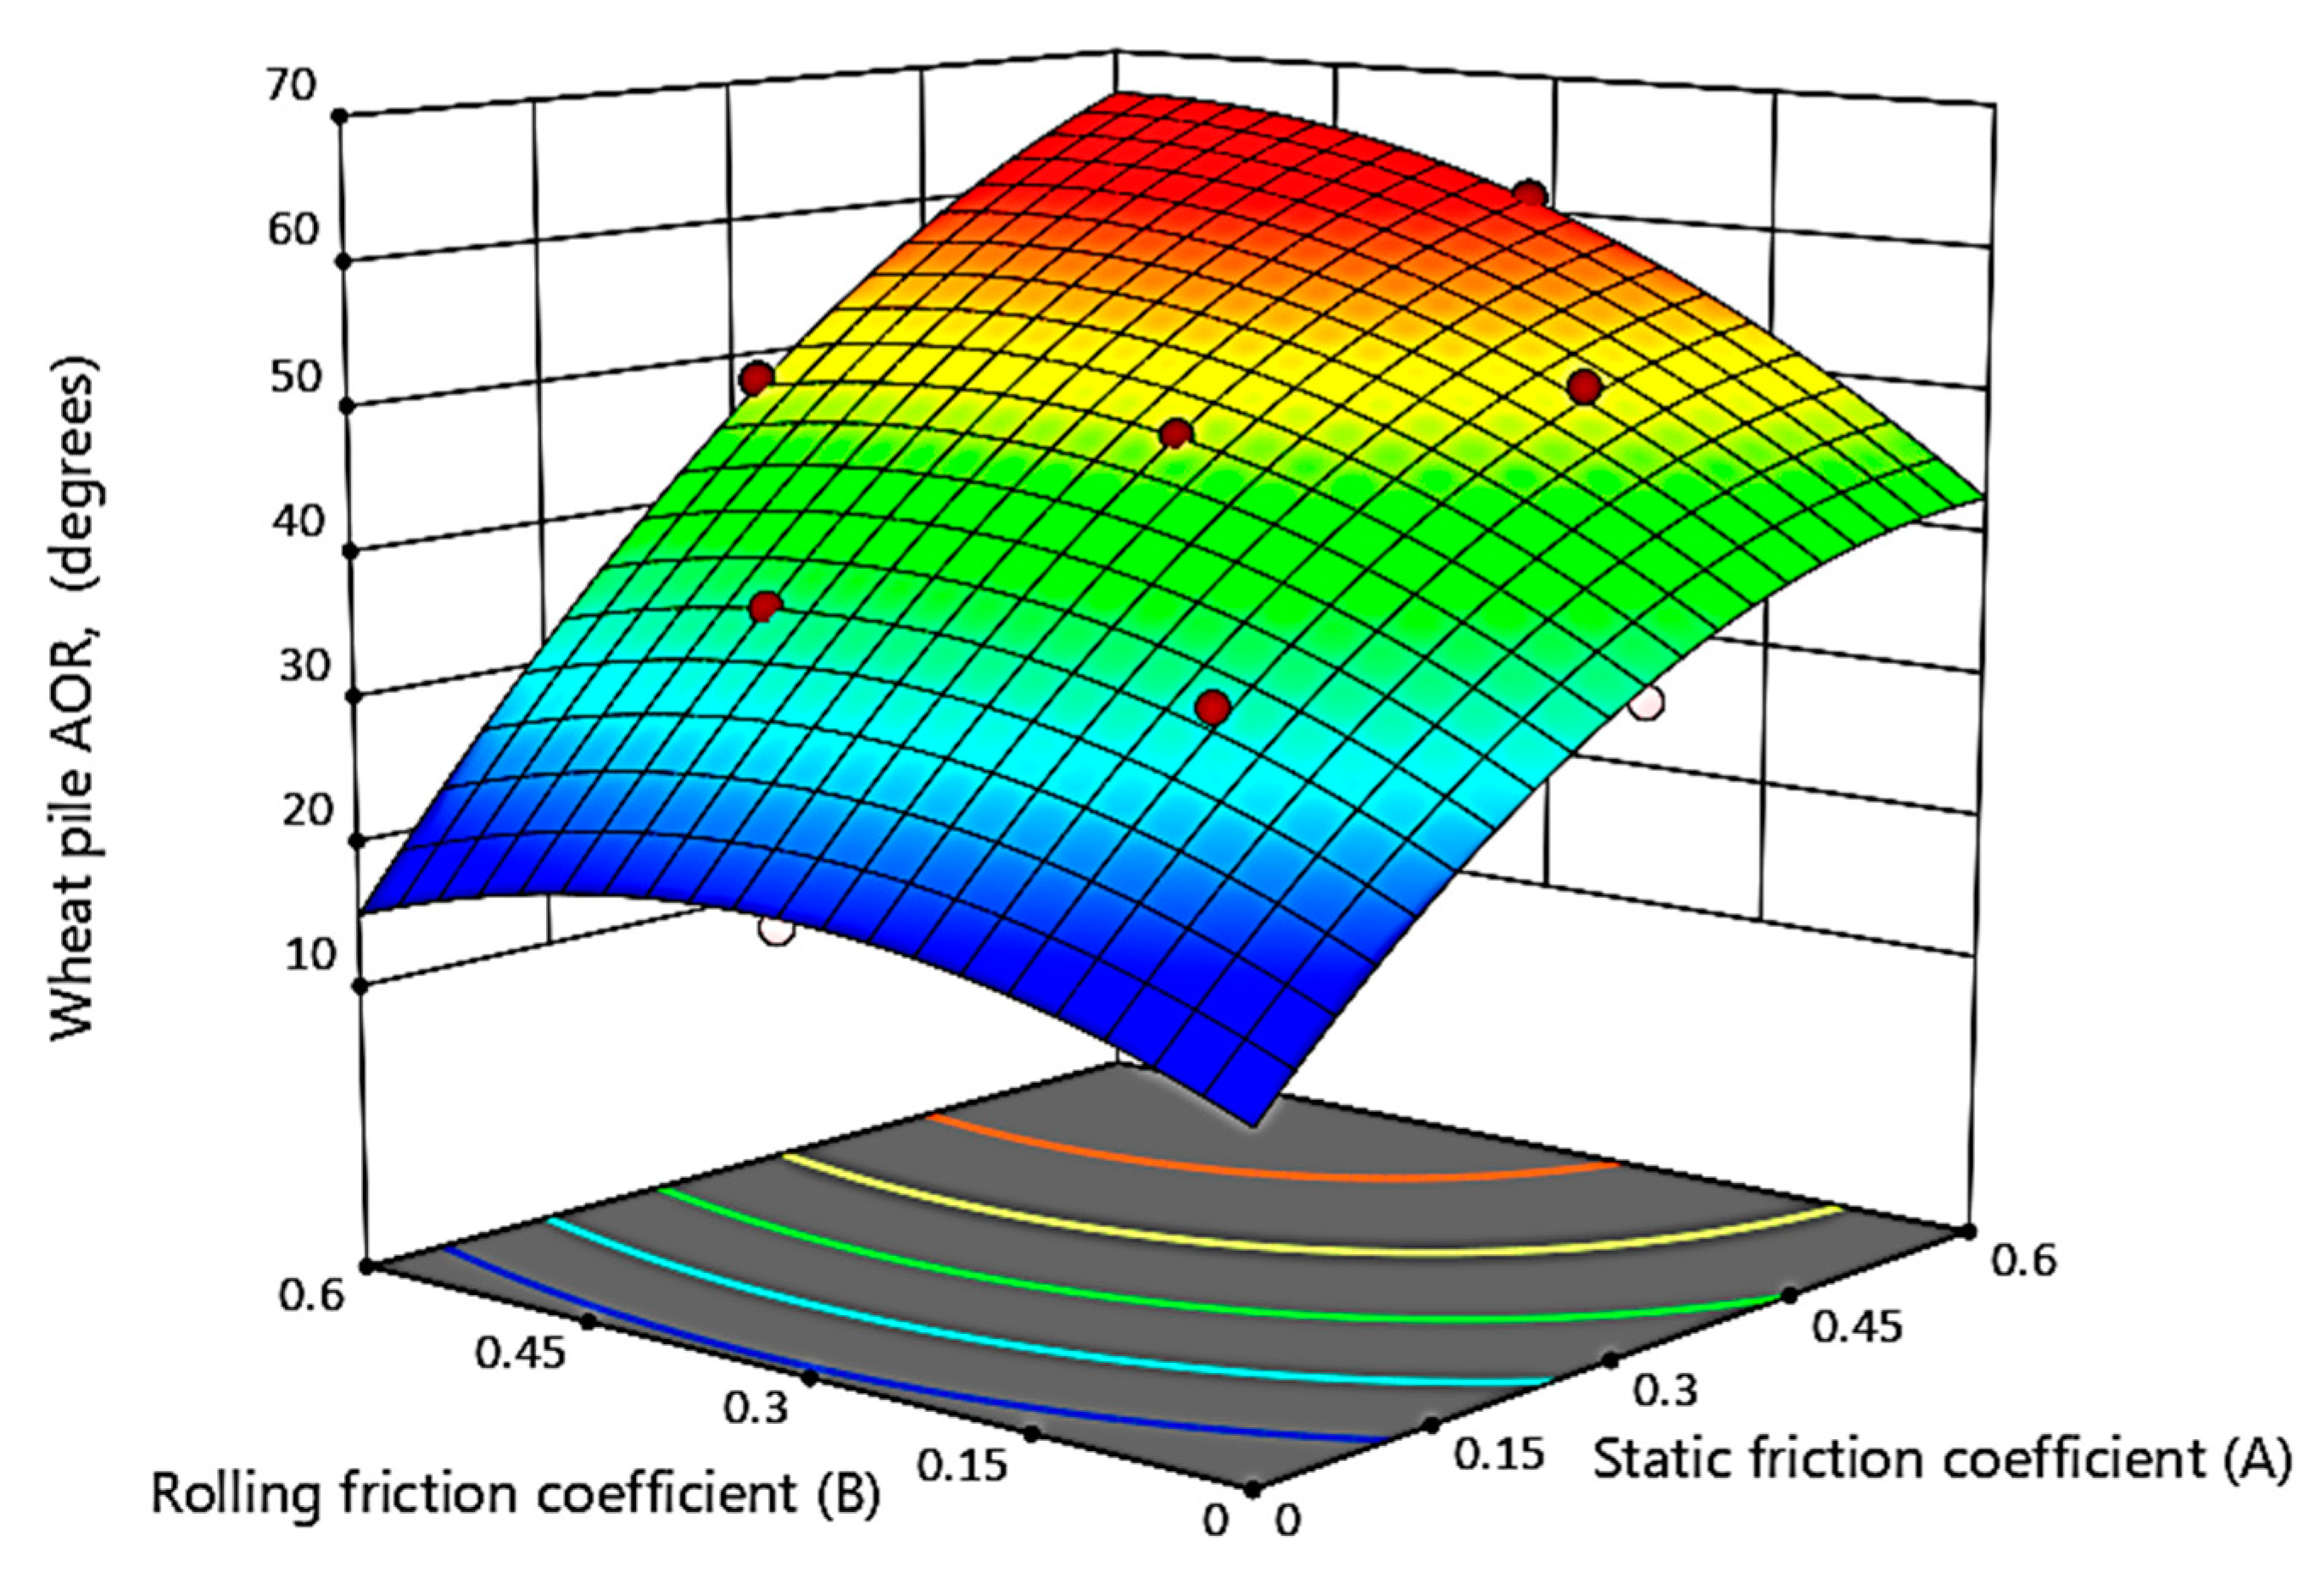
3.4.1. ANOVA of the Simulation Results of the Particle–Particle Interaction Properties

ANOVA of the wheat pile AOR simulated on DEM shows that particle–particle static friction coefficient (A), rolling friction coefficient (B), and their interaction (AB) significantly influence wheat pile formation (Table 9). A final equation in terms of coded factors is shown to identify the relative impact of the factors by comparing the factor coefficients and to make predictions about the response for given levels of each factor (Equation (15)). The equation shows that particle–particle static friction (A) has more influence than particle–particle rolling friction coefficient (B). It is suggested because of the wheat shape. If the particles were close to spherical particles, the rolling friction coefficient would be more significant than the static friction coefficient. The interaction of the two factors is shown in Figure 8. According to AB interaction, the increase in both coefficients increases wheat pile AOR. When the particle–particle rolling friction coefficient is zero, the increase of the particle–particle static friction coefficient increases wheat pile AOR. However, increasing the particle–particle rolling friction coefficient (B) does not increase wheat pile AOR when the particle–particle static friction coefficient is zero.
AOR = 47.55 + 10.2 A + 3.28 B + 1.38 AB 1.72 A 2 1.58 B 2
Since the target value was 36.17 degrees obtained in a real experiment to calibrate the coefficients between wheat particles, the optimization showed that the static friction coefficient (A) and the rolling friction coefficient (B) were 0.15 and 0.36, respectively. However, Figure 8 demonstrates that the goal can be achieved using various combinations of static (A) and rolling friction (B) coefficients. However, these are the values chosen by Design-Expert as the most desirable. The calibration result shows that the rolling friction coefficient (B) is greater than the static friction coefficient (A), which means that the wheat seeds in the mass will slide rather than rotate due to their non-spherical shape.

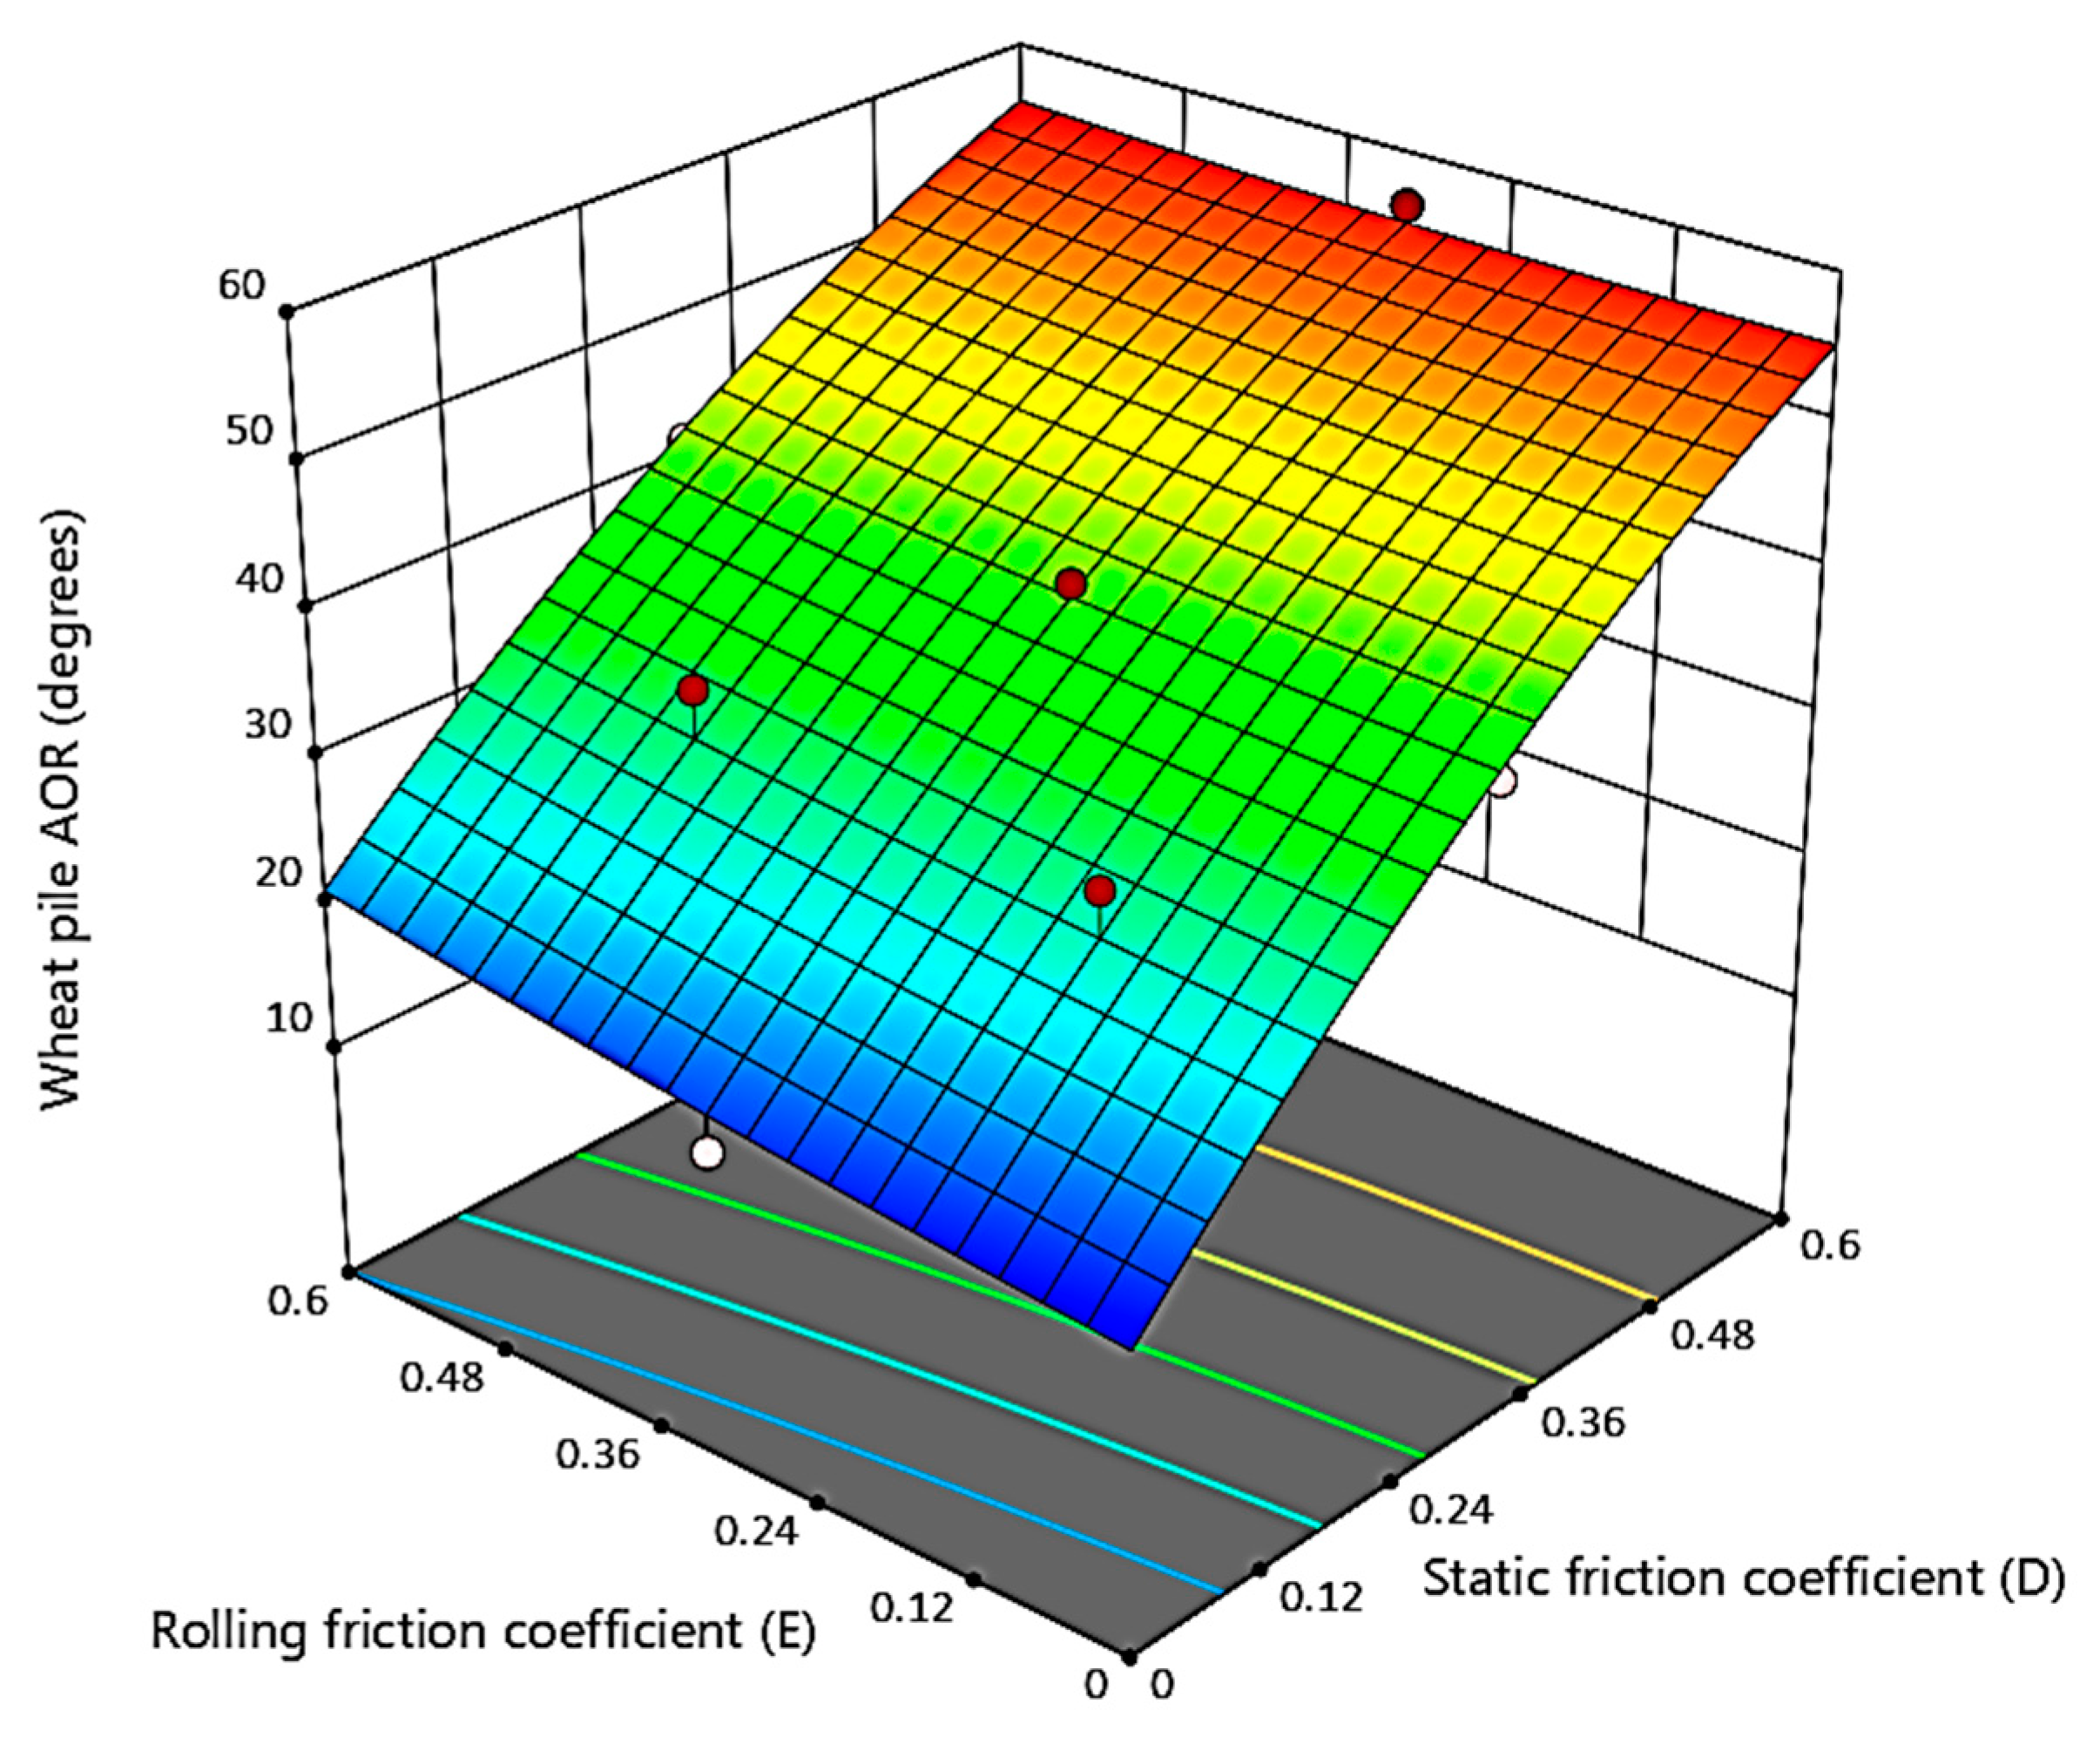
3.4.2. ANOVA of the Simulation Results of the Particle–Material Interaction Properties

ANOVA of the wheat pile AOR simulated on DEM shows that only particle–material static friction coefficient (D) significantly influences wheat pile formation (Table 10). The strong influence of the particle–material static friction coefficient (D) over the particle–material rolling friction coefficient (E) is demonstrated in Figure 9. Wheat pile AOR increases dramatically when the particle–material static friction coefficient (D) increases, eliminating the particle–material rolling friction coefficient (E). It is believed that wheat seeds, due to their shape, tend to slide rather than rotate.
According to the real experiment’s target values, the calibrated particle–material interaction properties on Design-Expert software are shown in Table 11. The calibrated values show that the particle–material static (D) and rolling (E) friction coefficients depend on materials. It is considered that static friction coefficient and rolling friction coefficient are dependent parameters. Therefore, the particle–material rolling friction coefficient (E) was calibrated together with the particle–material static friction coefficient (D), although the particle–material rolling friction coefficient (E) is not significant.

4. Conclusions

The interparticle interaction properties of wheat seeds and interaction properties of wheat seeds with various materials were calibrated using rotary drum equipment. The real experiment results showed that the rotary drum tilt at 45 degrees plays a dramatic role in determining the influence of drum material on the wheat pile AOR than the rotary drum in the vertical position. In the vertical position of the rotary drum, the target AOR of the wheat pile was 36.17 degrees. Therefore, first, particle–particle interaction properties were calibrated on DEM when the rotary drum position was vertical. Second, after calibrating the interparticle interaction properties, the particle–material interaction properties are calibrated when the rotary drum is inclined 45 degrees. To calibrate wheat’s static and rolling friction coefficients with soil, steel, PLA, and acrylic, the target AORs were 61.32 degrees, 46.30 degrees, 40.31 degrees, and 43.65 degrees, respectively. When calibrating interaction properties, it is adequate to choose several experiment responses to compare than a single response, as various combinations of factors can achieve the same target value. The calibrated interaction properties can be used to simulate wheat seeds with various equipment; however, the concern should be to use the same size and distribution of wheat seeds. The wheat seeds generated on DEM tend to slide rather than rotate on the material surface and interconnecting with other wheat seeds because of the shape.

Author Contributions

Conceptualization, A.S. and G.-R.H.; methodology, A.S.; software, Y.D.; validation, B.M., Z.M. and R.I.; formal analysis, Z.M.; investigation, A.S.; resources, M.M.; data curation, J.C.; writing—original draft preparation, Y.C.; writing—review and editing, S.Z.; visualization, L.B.; supervision, J.C.; project administration, A.S.; funding acquisition, J.C. All authors have read and agreed to the published version of the manuscript.

Funding

This research was funded by the National Key Research and Development Program of China [grant number 2018YFD0701102].

Institutional Review Board Statement

Not applicable.

Data Availability Statement

Not applicable.

Conflicts of Interest

The authors declare no conflict of interest.

References

  1. Sugirbay, A.; Zhao, J.; Nukeshev, S.; Chen, J. Determination of pin-roller parameters and evaluation of the uniformity of granular fertilizer application metering devices in precision farming. Comput. Electron. Agric. 2020, 179, 105835. [Google Scholar] [CrossRef]
  2. Chen, Y.; Cheng, Y.; Chen, J.; Zheng, Z.; Hu, C.; Cao, J. Design and Experiment of the Buckwheat Hill-Drop Planter Hole Forming Device. Agriculture 2021, 11, 1085. [Google Scholar] [CrossRef]
  3. Cundall, P.A.; Strack, O.D.L. A discrete numerical model for granular assemblies. Géotechnique 1979, 29, 47–65. [Google Scholar] [CrossRef]
  4. Richter, C.; Will, F. Introducing Metamodel-Based Global Calibration of Material-Specific Simulation Parameters for Discrete Element Method. Minerals 2021, 11, 848. [Google Scholar] [CrossRef]
  5. Golshan, S.; Sotudeh-Gharebagh, R.; Zarghami, R.; Mostoufi, N.; Blais, B.; Kuipers, J. Review and implementation of CFD-DEM applied to chemical process systems. Chem. Eng. Sci. 2020, 221, 115646. [Google Scholar] [CrossRef]
  6. Blagoeva, E.; Karkov, B.; Stoimenov, N. Review and Analysis of Robotized Feeding Systems. In Proceedings of the 2021 International Conference Automatics and Informatics (ICAI), Varna, Bulgaria, 30 September–2 October 2021; pp. 341–344. [Google Scholar]
  7. Alpeissov, Y.; Iskakov, R.; Issenov, S.; Ukenova. Obtaining a formula describing the interaction of fine particles with an expanding gas flow in a fluid layer. Eastern-European J. Enterp. Technol. 2022, 2, 87–97. [Google Scholar] [CrossRef]
  8. Nukeshev, S.; Eskhozhin, D.; Mamyrbayeva, I.; Karaivanov, D.; Gubasheva, A.; Tleumbetov, K.; Kosatbekova, D. Substantiation of the Parameters of Universal Scatterer for Bulk Materials. J. Comput. Theor. Nanosci. 2020, 17, 2975–2982. [Google Scholar] [CrossRef]
  9. Nukeshev, S.; A Kakabaev, N.; Romanyuk, N.N.; Troyanovskaya, I.P.; A Smelik, V.; A Voinash, S. Design and rationale for parametres of the seed-fertilizer seeder coulter for subsoil broadcast seeding. IOP Conf. Series Earth Environ. Sci. 2021, 677, 052010. [Google Scholar] [CrossRef]
  10. Roessler, T.; Richter, C.; Katterfeld, A.; Will, F. Development of a standard calibration procedure for the DEM parameters of cohesionless bulk materials—Part I: Solving the problem of ambiguous parameter combinations. Powder Technol. 2018, 343, 803–812. [Google Scholar] [CrossRef]
  11. Barrios, G.K.P.; de Carvalho, R.M.; Kwade, A.; Tavares, L.M. Contact parameter estimation for DEM simulation of iron ore pellet handling. Powder Technol. 2013, 248, 84–93. [Google Scholar] [CrossRef]
  12. Coetzee, C. Review: Calibration of the discrete element method. Powder Technol. 2017, 310, 104–142. [Google Scholar] [CrossRef]
  13. Sugirbay, A.; Zhao, J.; Sayakhat, N.; Chen, J.; Nikolay, Z.; Bu, L.; Sugirbayeva, Z.; Hu, G.; Marat, M.; Wang, Z. Calibration Strategy to Determine the Interaction Properties of Fertilizer Particles Using Two Laboratory Tests and DEM. Agriculture 2021, 11, 592. [Google Scholar]
  14. Fan, G.; Wang, S.; Shi, W.; Gong, Z.; Gao, M. Simulation Parameter Calibration and Test of Typical Pear Varieties Based on Discrete Element Method. Agronomy 2022, 12, 1720. [Google Scholar] [CrossRef]
  15. Fang, W.; Wang, X.; Han, D.; Chen, X. Review of Material Parameter Calibration Method. Agriculture 2022, 12, 706. [Google Scholar] [CrossRef]
  16. Ye, F.; Wheeler, C.; Chen, B.; Hu, J.; Chen, K.; Chen, W. Calibration and verification of DEM parameters for dynamic particle flow conditions using a backpropagation neural network. Adv. Powder Technol. 2018, 30, 292–301. [Google Scholar] [CrossRef]
  17. Cabiscol, R.; Finke, J.H.; Kwade, A. Calibration and interpretation of DEM parameters for simulations of cylindrical tablets with multi-sphere approach. Powder Technol. 2018, 327, 232–245. [Google Scholar] [CrossRef]
  18. Liu, F.; Zhang, J.; Li, B.; Chen, J. Calibration of parameters of wheat required in discrete element method simulation based on repose angle of particle heap. Trans. Chin. Soc. Agric. Eng. 2016, 32, 247–253. [Google Scholar]
  19. Linskson, P.B. Granulation of superphosphate in a rotary drum. Can. J. Chem. Eng. 1969, 47, 519–521. [Google Scholar] [CrossRef]
  20. Elmisaoui, S.; Khamar, L.; Benjelloun, S.; Khamar, M.; Ghidaglia, J.-M. Numerical Study of fertilizer granules dynamics within rotary drum granulator. In Computer Aided Chemical Engineering; Türkay, M., Gani, R., Eds.; Elsevier: Amsterdam, The Netherlands, 2021; pp. 327–332. [Google Scholar]
  21. Obraniak, A.; Orczykowska, M.; Olejnik, T.P. The effects of viscoelastic properties of the wetting liquid on the kinetics of the disc granulation process. Powder Technol. 2018, 342, 328–334. [Google Scholar] [CrossRef]
  22. Tan, Y.; Yu, Y.; Fottner, J.; Kessler, S. Automated measurement of the numerical angle of repose (aMAoR) of biomass particles in EDEM with a novel algorithm. Powder Technol. 2021, 388, 462–473. [Google Scholar] [CrossRef]
  23. Mellmann, J. The transverse motion of solids in rotating cylinders—Forms of motion and transition behavior. Powder Technol. 2001, 118, 251–270. [Google Scholar] [CrossRef]
  24. Rodrigues, R.F.; Leite, S.R.; Santos, D.A.; Barrozo, M.A. Drum granulation of single super phosphate fertilizer: Effect of process variables and optimization. Powder Technol. 2017, 321, 251–258. [Google Scholar] [CrossRef]
  25. Mohsenin, N.N. Physical Properties of Plant and Animal Materials; Routledge: Abingdon-on-Thames, UK, 1986. [Google Scholar]
  26. Zhu, H.P.; Zhou, Z.Y.; Yang, R.Y.; Yu, A.B. Discrete particle simulation of particulate systems: A review of major applications and findings. Chem. Eng. Sci. 2008, 63, 5728–5770. [Google Scholar] [CrossRef]
  27. Zhu, H.P.; Zhou, Z.Y.; Yang, R.Y.; Yu, A.B. Discrete particle simulation of particulate systems: Theoretical developments. Chem. Eng. Sci. 2007, 62, 3378–3396. [Google Scholar] [CrossRef]
  28. Widhate, P.; Zhu, H.; Zeng, Q.; Dong, K. Mixing of Particles in a Rotating Drum with Inclined Axis of Rotation. Processes 2020, 8, 1688. [Google Scholar] [CrossRef]
  29. Zhang, J.; Liu, F.; Chen, J. Virtual vibration screening experiments of grain cleaning sieve based on DEM. Agric. Mech. Res. 2019, 2, 36–42. [Google Scholar]
  30. Li, H.; Zeng, S.; Luo, X.; Fang, L.; Liang, Z.; Yang, W. Design, DEM Simulation, and Field Experiments of a Novel Precision Seeder for Dry Direct-Seeded Rice with Film Mulching. Agriculture 2021, 11, 378. [Google Scholar] [CrossRef]
  31. Marigo, M.; Stitt, E.H. Discrete Element Method (DEM) for Industrial Applications: Comments on Calibration and Validation for the Modelling of Cylindrical Pellets. KONA Powder Part. J. 2015, 32, 236–252. [Google Scholar] [CrossRef]
  32. Moysey, P.; Thompson, M. Determining the collision properties of semi-crystalline and amorphous thermoplastics for DEM simulations of solids transport in an extruder. Chem. Eng. Sci. 2007, 62, 3699–3709. [Google Scholar] [CrossRef]
Figure 1. Rotary drum equipment: (a) front view; (b) back view; 1. stand; 2. corner retainer; 3. plane plate; 4. PLA drum; 5. soil drum; 6. steel drum; 7. acrylic drum; 8. acrylic drum cover; 9. pulley; 10. drum shaft; 11. traction pulley; 12. belt; 13. stepper motor with gear.
Agriculture 12 01497 g001
Figure 2. Filming the vertical drum: (a) High-speed camera position when the rotary drum is vertical; (b) digitizing the pile slope in Cartesian coordinates.
Agriculture 12 01497 g002
Figure 3. Filming the inclined drum: (a) High-speed camera position when the rotary drum is tilted at a 45-degree angle; (b) digitizing the pile slope in Cartesian coordinates.
Agriculture 12 01497 g003
Figure 4. Determining the wheat pile slope in Cartesian coordinates.
Agriculture 12 01497 g004
Figure 5. Comparison of wheat seed behavior in the drum: (a,b). Rolling and cascading regime. Retrieved from [24]; (c) the actual experiment of drums inclined 90 degrees; (d) the actual experiment of drums inclined 45 degrees.
Agriculture 12 01497 g005
Figure 6. Normal distribution of measured wheat sizes.
Agriculture 12 01497 g006
Figure 7. The dimensions of wheat seeds generated on DEM.
Agriculture 12 01497 g007
Figure 8. Interaction of particle–particle static (A) and rolling (B) friction coefficients.
Agriculture 12 01497 g008
Figure 9. Interaction of particle–material static (D) and rolling (E) friction coefficients.
Agriculture 12 01497 g009
Table 1. Single-factor experiment results varying the drum inclination angle with five replications.
α = 90°α = 45°
1234512345
(°)(°)(°)(°)(°)(°)(°)(°)(°)(°)
Soil36.6436.8637.9538.1444.2956.7561.7458.3063.8865.96
Steel31.0032.0533.0533.2737.1345.7446.0146.5448.1845.04
PLA34.6337.6336.8138.7536.9939.7939.6638.344.8638.96
Acrylic36.4333.6733.1037.8037.3742.9643.0039.7446.2546.30
Table 2. One-way ANOVA of the single-factor experiment.
Source of VariationSSdfMSFp-ValueF Crit
α = 90°Between Groups14.5334.840.490.683.23
Within Groups155.71169.73
Total170.2519
α = 45°Between Groups1348.483449.4952.69<0.003.23
Within Groups136.46168.52
Total1484.9519
Table 3. Pearson’s correlation coefficients of the sizes of the seeds.
Wheat
LengthWidthThickness
Length10.310.48
Width0.3110.46
Thickness0.4830.461
Table 4. Generated on DEM wheat seed dimensions and distribution.
Generated Wheat Particle Numbers
1234567
Length, mm5.756.006.256.506.757.007.25
Width, mm2.753.003.253.503.754.004.25
Distribution, %3.7512.5032.5015.0025.007.503.75
Table 5. Mechanical properties of the materials obtained from the literature.
Intrinsic ParametersShear Modulus (Pa)Poisson’s RatioDensity (kg m−3)
Wheat1.13 × 107 a0.22 a1370
Soil106 b0.38 b1850 b
Steel8.23 × 1010 b0.30 b7850 b
Acrylic1.15 × 109 c0.35 c1385 c
PLA2.42 × 108 d0.36 d1050 d
a [29] b [30] c [31] d [32].
Table 6. The levels of the interaction parameters according to CCP to simulate on DEM.
SymbolInteraction ParametersLow LevelHigh Level
AThe particle–particle static friction coefficient00.60
BThe particle–particle rolling friction coefficient00.60
CThe particle–particle restitution coefficient0.200.60
DThe particle–material static friction coefficient00.60
EThe particle–material rolling friction coefficient00.60
FThe particle–material restitution coefficient0.200.60
Table 7. Simulation results of particle–particle interaction properties on DEM according to CCP.
STD OrderABα = 90°
1234Average
(°)(°)(°)(°)(°)
10.150.1534.5433.8133.4233.1233.72
20.450.1551.1550.7850.1250.9450.75
30.150.4536.5836.0634.8336.5636.01
40.450.4558.5558.4758.6658.5058.55
50.000.3020.5419.3319.2519.6419.69
60.600.3062.0461.8359.0561.5461.12
70.300.0034.6234.2132.7433.0633.66
80.300.6049.1850.2045.3248.5648.32
90.300.3047.2446.9547.5747.3447.28
100.300.3048.6447.5247.3047.1047.64
110.300.3047.0048.1946.2947.2847.19
120.300.3046.7647.8047.5847.1047.31
130.300.3047.1547.3047.9347.0047.35
Table 8. Simulation results of particle–material interaction properties on DEM according to CCP.
STD OrderDEα = 45°
1234Average
(°)(°)(°)(°)(°)
10.150.1531.7232.5830.2230.7631.32
20.450.1547.5045.8146.8548.9847.29
30.150.4534.2533.0935.1034.5434.25
40.450.4548.6748.9948.6348.4048.67
50.000.3013.4514.7514.5615.6114.59
60.600.3056.6556.5855.4156.6856.33
70.300.0037.1038.4037.7037.6037.70
80.300.6042.8140.5842.5939.5941.39
90.300.3041.1337.4537.5440.5439.17
100.300.3038.0639.5137.7537.7238.26
110.300.3039.2041.0342.1740.3740.69
120.300.3038.7137.9140.0238.9838.91
130.300.3037.6538.4139.5640.7639.10
Table 9. ANOVA of particle–particle interaction properties simulation results simulated on DEM.
SourceSum of SquaresdfMean SquareF-Valuep-Value
Model1483.405296.68366.70<0.00 **
A1248.7411248.741543.44<0.00 **
B129.351129.35159.87<0.00 **
AB7.6017.609.390.01 *
A268.16168.1684.25<0.00 **
B257.12157.1270.59<0.00 **
Residual5.6670.80
Lack of Fit5.5531.8563.250.00 **
Pure Error0.1140.02
Cor Total1489.0612
R2 = 0.99; Adj R2 = 0.99; Pred R2 = 0.96; Adeq precision = 66.77; CV = 2.20%.
Note: * shows that the item is significant (p < 0.05); ** shows that the item is extremely significant (p < 0.01).
Table 10. ANOVA of particle–material interaction properties simulation results simulated on DEM.
SourceSum of SquaresdfMean SquareF-Valuep-Value
Model1114.815222.9643.39<0.00 **
D1080.5311080.53210.30<0.00 **
E11.39111.392.220.18
DE0.6010.600.110.74
D218.84118.843.670.09
E20.3010.300.050.81
Residual35.9775.14
Lack of Fit32.77310.9213.670.01 *
Pure Error3.2040.79
Cor Total1150.7712
R2 = 0.96; Adj R2 = 0.94; Pred R2 = 0.73; Adeq precision = 24.64; CV = 5.80%.
Note: * shows that the item is significant (p < 0.05); ** shows that the item is extremely significant (p < 0.01).
Table 11. Calibrated interaction properties of wheat seeds with various materials.
SoilSteelPLAAcrylic
Particle–material static friction coefficient (D)0.510.400.300.36
Particle–material rolling friction coefficient (E)0.380.330.350.29
Publisher’s Note: MDPI stays neutral with regard to jurisdictional claims in published maps and institutional affiliations.

