Article

Study on Modeling Method of a Multi-Parameter Control System for Threshing and Cleaning Devices in the Grain Combine Harvester

1
Key Laboratory of Modern Agricultural Equipment and Technology, Jiangsu University, Zhenjiang 212013, China
2
School of Agricultural Engineering, Jiangsu University, Zhenjiang 212013, China
3
College of Automobile and Traffic Engineering, Nanjing Forestry University, Nanjing 210037, China
*
Author to whom correspondence should be addressed.
Agriculture 2022, 12(9), 1483; https://doi.org/10.3390/agriculture12091483
Submission received: 15 August 2022 / Revised: 7 September 2022 / Accepted: 14 September 2022 / Published: 16 September 2022
(This article belongs to the Section Agricultural Technology)

Abstract

:
In order to realize the demand for high-quality and high-efficiency harvest in modern agriculture, the grain combine harvesters must have the ability to intelligently adjust the operation parameters. The difficult problem is to establish the multi-parameter control system model for threshing and cleaning devices. The threshing and cleaning devices are located in the same rack space, and the interaction mechanism among agricultural material movement, mechanical structure, and airflow field is very complex. In view of the difficulties in the theoretical modeling of threshing and cleaning devices, a large number of operating parameters and performance indicators, strong coupling, and high requirements for real-time control, the system identification method was used to model the threshing and cleaning system in this paper. Firstly, the amplitude modulated PRBS input signals were designed as the input parameters of the system identification test, and the output signals acquisition test was carried out in the field. Then, the multi-input and multi-output signals of the system were used as training data, and the fusion method of the PSO (particle swarm optimization) algorithm and WNN (wavelet neural network) was proposed to identify it, and the optimal state-space model was obtained. Finally, the model identification and verification experiments were carried out on the threshing and cleaning system of various crops during the actual harvest. The VAF (variance-accounted-for) values of system identification model verification results were greater than or equal to 81.7%, and the RMSE (root mean square error) values were less than or equal to 0.602. The modeling method has high accuracy and adaptability, which laid a good foundation for realizing multi-parameter coordinated control of threshing and cleaning devices.

1. Introduction

The grain combine harvester is agricultural equipment that integrates multiple subsystems such as walking, cutting, threshing, cleaning, and grain collection. Its operational performance is composed of three parts: first, the grain loss rate, which comes from header loss, unthreshed loss, entrainment loss, cleaning loss, and grain leakage loss, and the entrainment and cleaning losses account for more than 80% of the total harvest loss [1,2], which were greatly affected by the threshing and cleaning devices; The second is the grain impurity rate, which is also mainly affected by threshing and cleaning devices; The third is the grain damage rate, which is mainly affected by the threshing device. Therefore, the performance of the threshing and cleaning system could represent the operational performance of the whole machine to a certain extent. According to the operational performance feedback data monitored by a variety of sensors, the operation parameters of the threshing and cleaning system are adjusted in real time so that the operational performance is always in a better range. This is an important link to achieving high-quality harvest. It can solve the bottleneck problems such as large fluctuation of operational performance and high manipulation intensity when the traditional combine harvester is harvesting in the field, and the premise of realizing these control functions is to establish an accurate threshing and cleaning system model. There are many threshing and cleaning performance indexes and influencing parameters of a combine harvester, which belongs to a multi-input and multi-output system, and the variables are coupled with each other. In addition, the system has the characteristics of nonlinearity, time-varying, and lag.
Many foreign scholars and agricultural machinery enterprises have studied the modeling method of threshing and cleaning systems. In 2008, Craessaerts et al. [3,4] established the prediction model of grain impurity rate in grain tanks by using fuzzy theory and concluded that there was a certain nonlinear relationship between grain impurity rate and fan speed and upper screen opening. Then, in 2010, they developed a parameter fuzzy system model for cleaning devices based on expert experience. The system model took into account the cleaning loss of the screen surface and the impurity rate in the grain tank. First, whether the loss and impurity were within the target range was judged. If not, the fan speed was changed. If within the range, the opening of the upper and lower screens were changed to maintain the loss and impurity near the optimal value. In 2015, Alan et al. [5] invented a constant pressure concave screen of a combine harvester, modeled the threshing device by using the method of data acquisition and test, and realized the automatic control of the expansion and contraction of the piston rod of the hydraulic cylinder to adjust the concave gap, to keep the pressure on the concave screen constant. At present, large agricultural machinery enterprises are selling high-end combine harvesters, such as New Holland CX8.90, CASE IH Axial-Flow 9250, CLAAS LEXION 8900, etc. are equipped with threshing and cleaning parameters control systems, but their control system models are strictly confidential and are not suitable for China’s crop varieties and combine harvesters [6].
In recent years, domestic scholars have also performed some research on the control system model of threshing and cleaning devices. In 2015, Ning Xiaobo et al. [7] established the dynamic model of a threshing device through theoretical derivation and combined the model with a fuzzy logic controller to build the drum speed control system. The computer simulation and test results showed that the accuracy of the model was high. When the feeding amount increased by about 15%, the drum speed could be effectively adjusted within 5 s and reached a stable state. In 2018, Zhang Yawei [8] established the threshing control model based on the research on the impact mechanism of threshing and separation quality of combine harvester, and took low loss rate and low crushing rate as the objectives, concave gap and drum speed as the inputs, and adopted double-input single-output Mamdani fuzzy controller structure to realize the control of threshing and separation quality. In 2019, Li Wei [9] took all input and output variables of the cleaning system as the input part of fuzzy rules and the increment of output variables as the output part of fuzzy rules. Based on the field experiment and combined with the actual harvest experience of the manipulator, the incremental fuzzy control model of the cleaning system could be quickly and efficiently established in the corresponding area. Then, the rationality of the model was verified by experiments. In 2020, according to the real-time data of field operation parameters, harvest performance, and expert experience, Lian Yi [10] proposed a harvest performance reasoning method based on BP neural network technology. The harvest performance values were automatically generated by using the monitoring data of concave gap, drum speed, and forward speed. The reasoning model was applied to the simulation of the operation parameter control system of a rice combine harvester, and the multiple operation parameters adaptive control of the threshing device was realized.
The above research and other relevant research basically only aimed at the single system modeling of threshing devices or cleaning devices. However, the parameters and performance indexes of threshing and cleaning devices have strong correlations and coupling, and there are even contradictions between some parameters or performance indexes. Therefore, it is necessary to study the threshing and cleaning devices as an overall modeling system. In addition, most of the input and feedback conditions of the cleaning or threshing control models in these studies came from the predicted values or the rotating speed of working parts. Due to the lack of corresponding operation quality monitoring sensors, these parameters belong to indirect inputs, which may cause a large deviation between the system model and the actual situation.
In order to solve these problems, the multi-input and multi-output system of threshing and cleaning devices for grain combine harvesters were taken as the research object in this paper, in which the cleaning entrainment loss rate, the grain impurity rate, and the grain-crushing rate were taken as the output parameters, and the screen opening, the airflow inlet area of fan and the threshing gap were taken as the input parameters, and the real-time acquisition and adjustment methods of each parameter were discussed respectively. Then, the amplitude modulated PRBS (pseudo-random binary sequence) input signals were designed as the inputs of the system identification test, and the output signals acquisition test was carried out in the field. The multi-input and multi-output signals were used as the training data. The fusion method of the PSO algorithm and WNN was proposed to identify it, and the optimal state-space model was obtained. Finally, the model identification and verification tests of the threshing and cleaning system of many crops were also carried out.

2. Materials and Methods

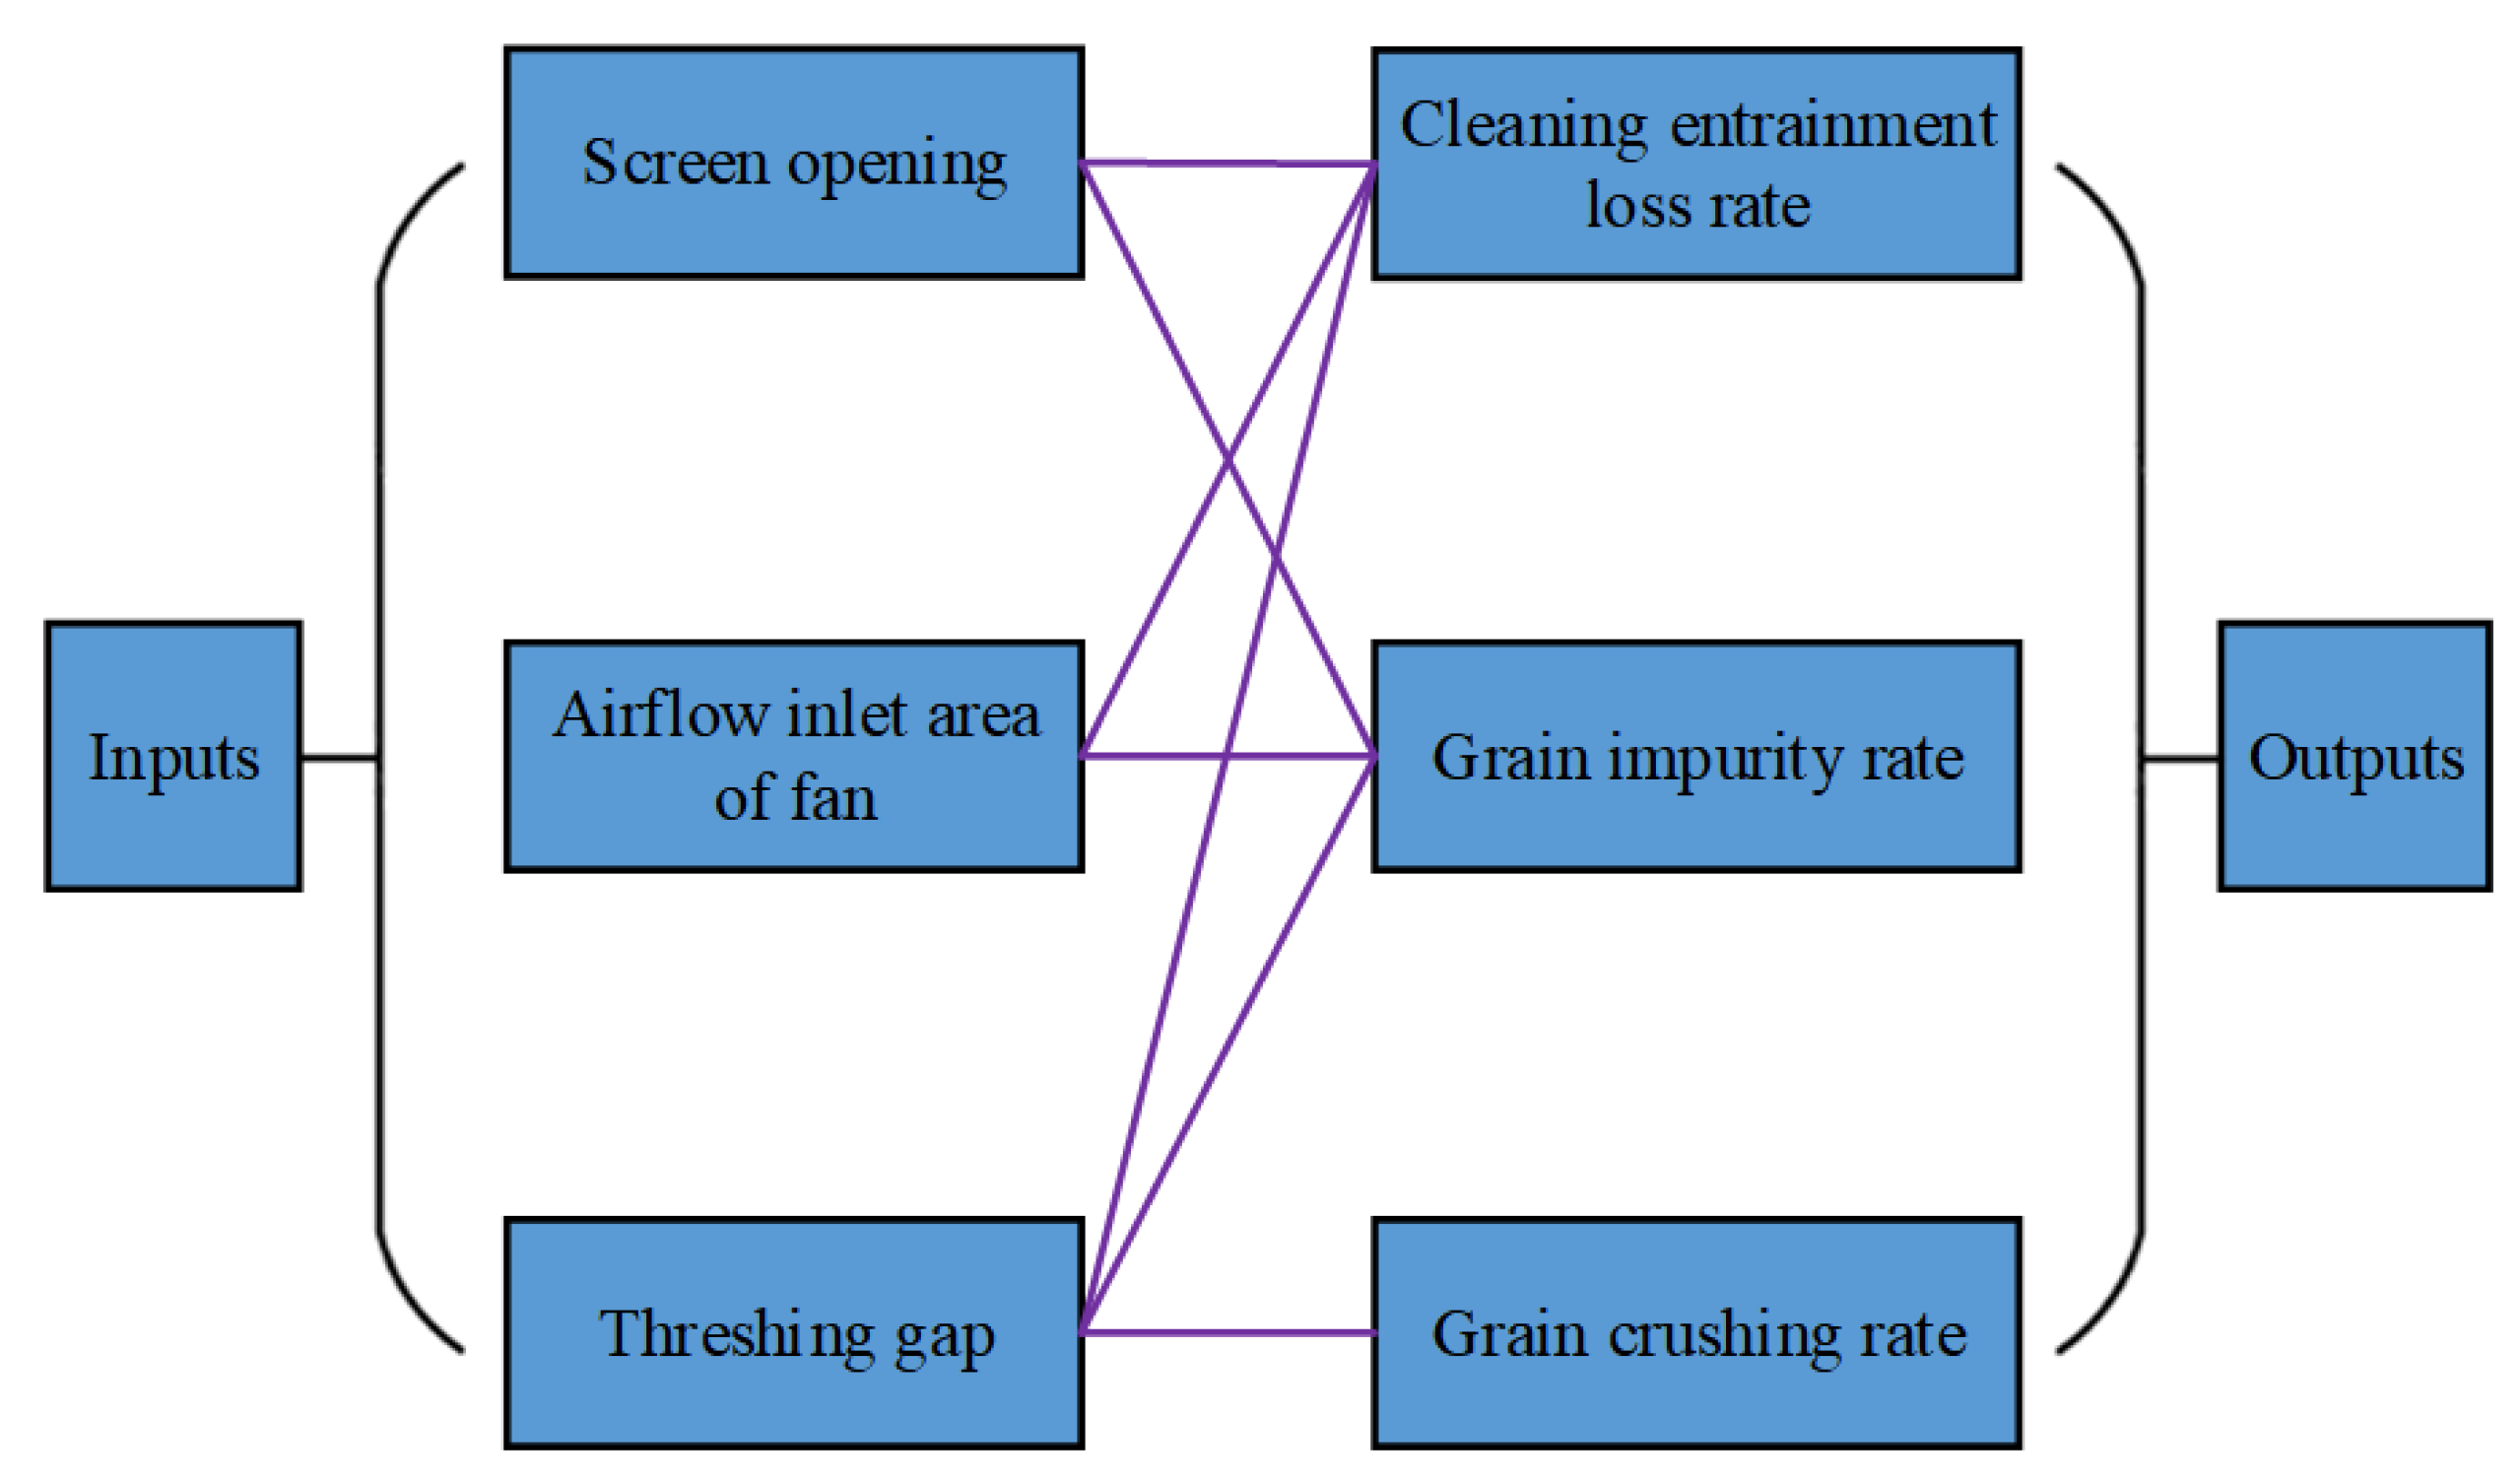
2.1. Composition of the Multi-Input and Multi-Output System for Threshing and Cleaning Devices

The 4LZ-6A multi-functional grain combine harvester produced by Jiangsu World Agricultural Machinery Co., Ltd. was used as the experimental prototype of threshing and cleaning system modeling. The purpose of modeling the threshing and cleaning system in this study was to lay a model foundation for realizing the cooperative regulation of multiple operating parameters of combine harvester, that is, the operation parameters of the threshing and cleaning devices (e.g., screen opening, airflow inlet area of fan and threshing gap) could be automatically adjusted according to the real-time monitoring data of the main operation performance (e.g., cleaning loss rate, entrainment loss rate, grain impurity rate, and grain-crushing rate). The traditional theoretical modeling method could not reflect the characteristics of this complex system; thus, the system identification method was used to establish the mathematical model of the threshing and cleaning system. Specifically, certain test signals were applied to the system as the inputs, the output responses of the system were recorded, and then the system model structure or parameters were determined by analyzing the input and output data [11].
The cleaning loss rate and entrainment loss rate belong to a part of the total harvest loss rate (one of the three indicators of operation performance, namely loss rate, impurity rate, and crushing rate) and account for a large proportion. Therefore, in the process of modeling the threshing and cleaning multi-parameter system of the combine harvester, the cleaning loss rate and entrainment loss rate were added and combined into the operation performance index of the cleaning entrainment loss rate to characterize the total loss rate. On the test prototype, the threshing and cleaning multi-parameter system could be expressed as a three-input and three-output system, as shown in Figure 1. It could be seen that the couplings between threshing and cleaning operation parameters and performance indicators were strong. The change of screen opening could affect the cleaning entrainment loss rate and grain impurity rate. The change of airflow inlet area of the fan could also affect the cleaning entrainment loss rate and grain impurity rate. The change in the threshing gap could affect the three operating performance indicators. Thus, it was a complex multi-input multi-output system.

2.2. Real-Time Acquisition or Adjustment Device for Each Parameter

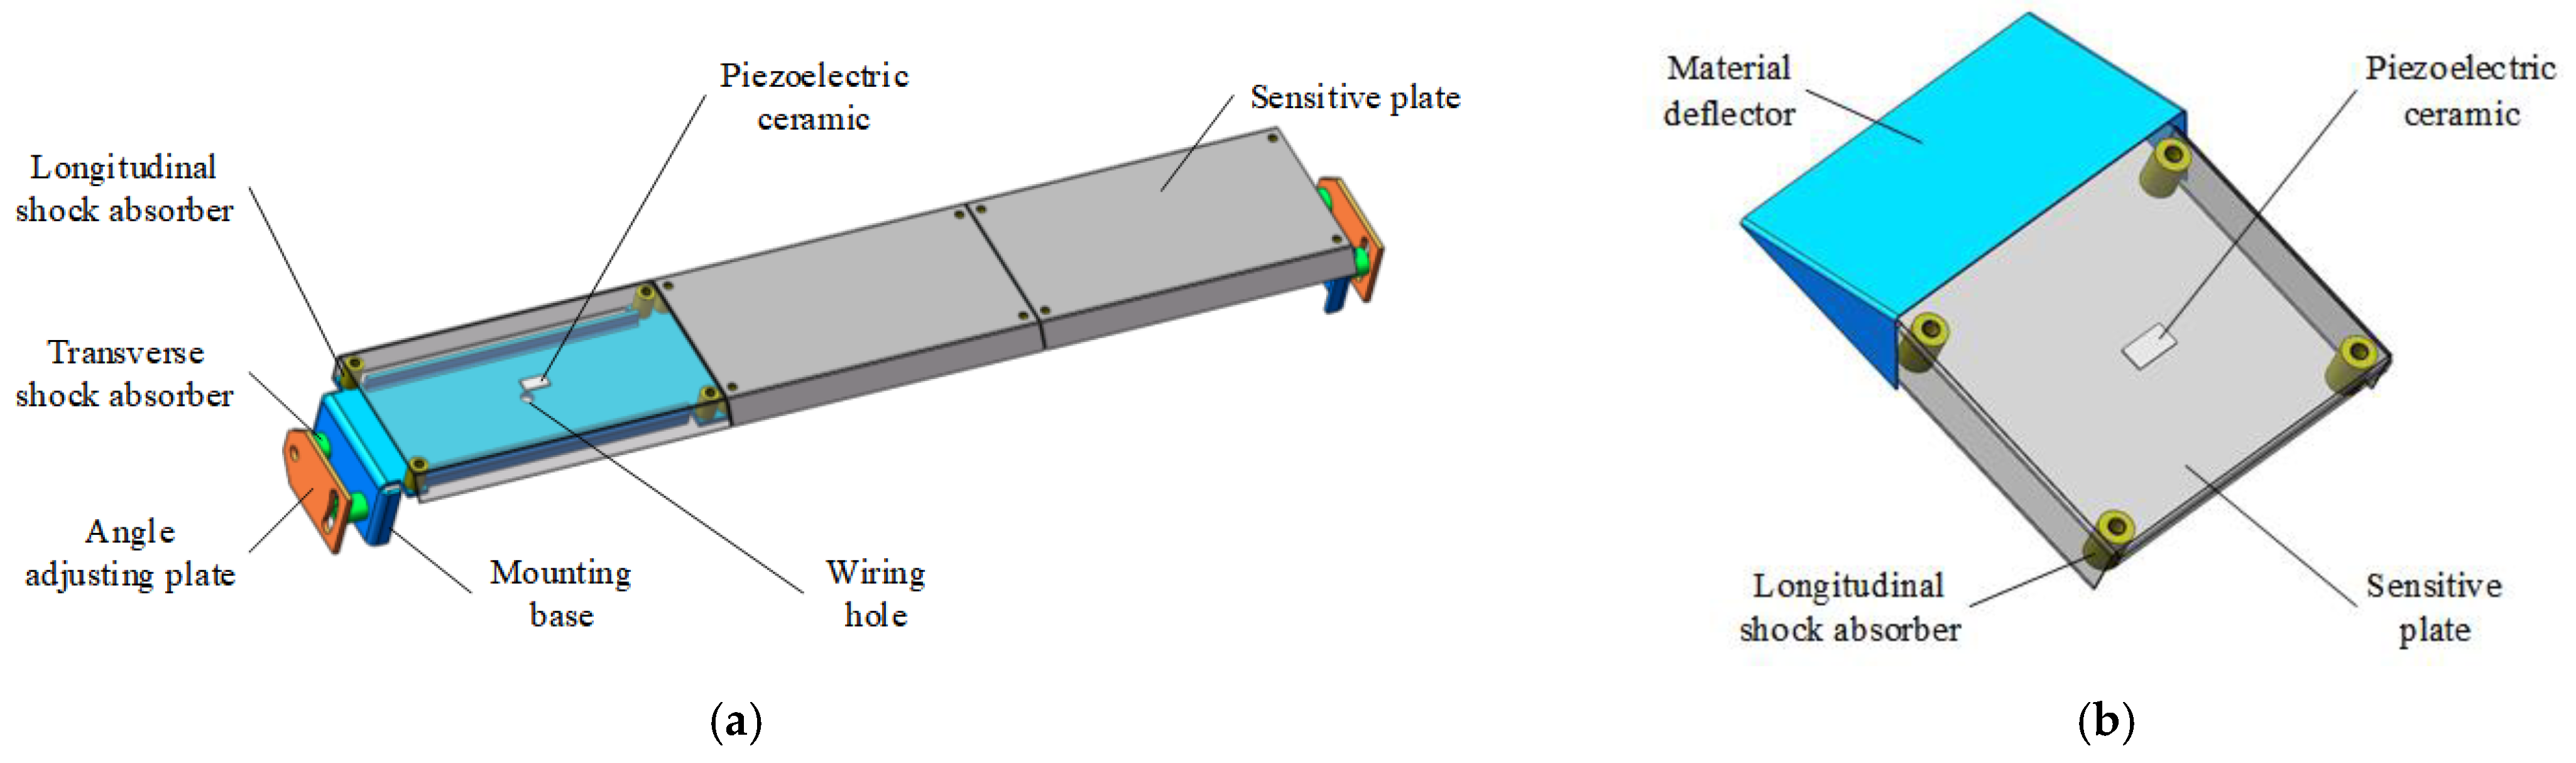
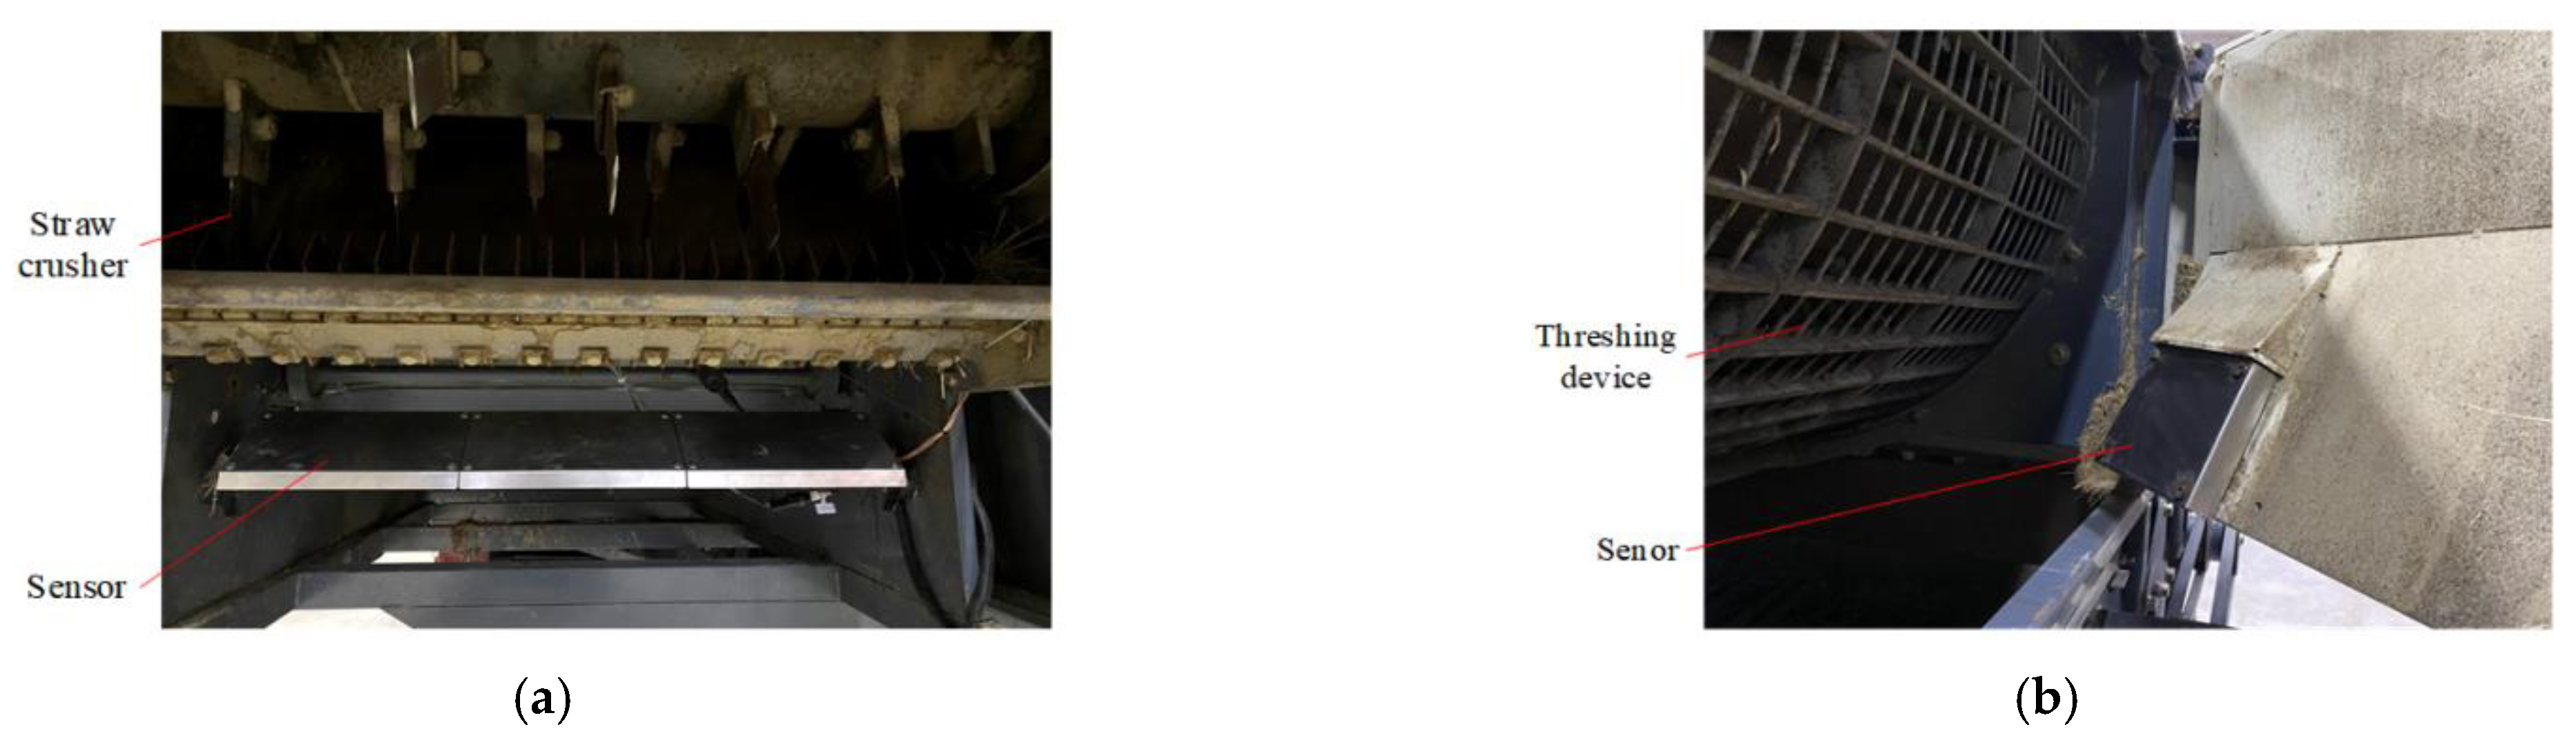
2.2.1. Cleaning and Entrainment Loss Rate Monitoring Sensors

Based on the piezoelectric principle, the structures of integrated multi-plate cleaning loss monitoring sensors and single-plate entrainment loss monitoring sensors were developed, as shown in Figure 2. The cleaning loss sensor was installed at the tail outlet of the vibrating screen and was located below the straw crusher. The entrainment loss sensor was installed at the tail of the threshing device and was located below the threshing concave screen. The installation diagram is shown in Figure 3. In addition, the random forest algorithm was used to cluster and classify the main characteristics of piezoelectric signals, and the corresponding signal processing system was developed, as shown in Figure 4. Thus, the high-precision real-time monitoring of cleaning loss and entrainment loss for rice, wheat, rape, corn, soybean, and other crops was realized, and the monitoring accuracy was greater than 92.0% [12,13].
The output data of the above cleaning loss and entrainment loss monitoring sensors were the number of grains. Combined with the monitoring loss proportion formula [14], the actual cleaning loss and entrainment loss grains were calculated in the MCU of the embedded system. However, they could not fully reflect the magnitude of the cleaning entrainment loss rate. This was because the machine’s forward speed, cutting height, crop density, and other parameters would fluctuate during the harvest process, resulting in a continuous change of grain output per unit time. To solve this problem, based on the grain flow sensor developed by our research group [15], the grain flow information was collected in real-time through the cleaning entrainment loss monitoring embedded system. The monitoring accuracy of this grain flow sensor was more than 95.7%. Then the actual cleaning entrainment loss mass and the grain output in the grain tank within 1 s sampling time were compared to obtain the real-time cleaning entrainment loss rate.

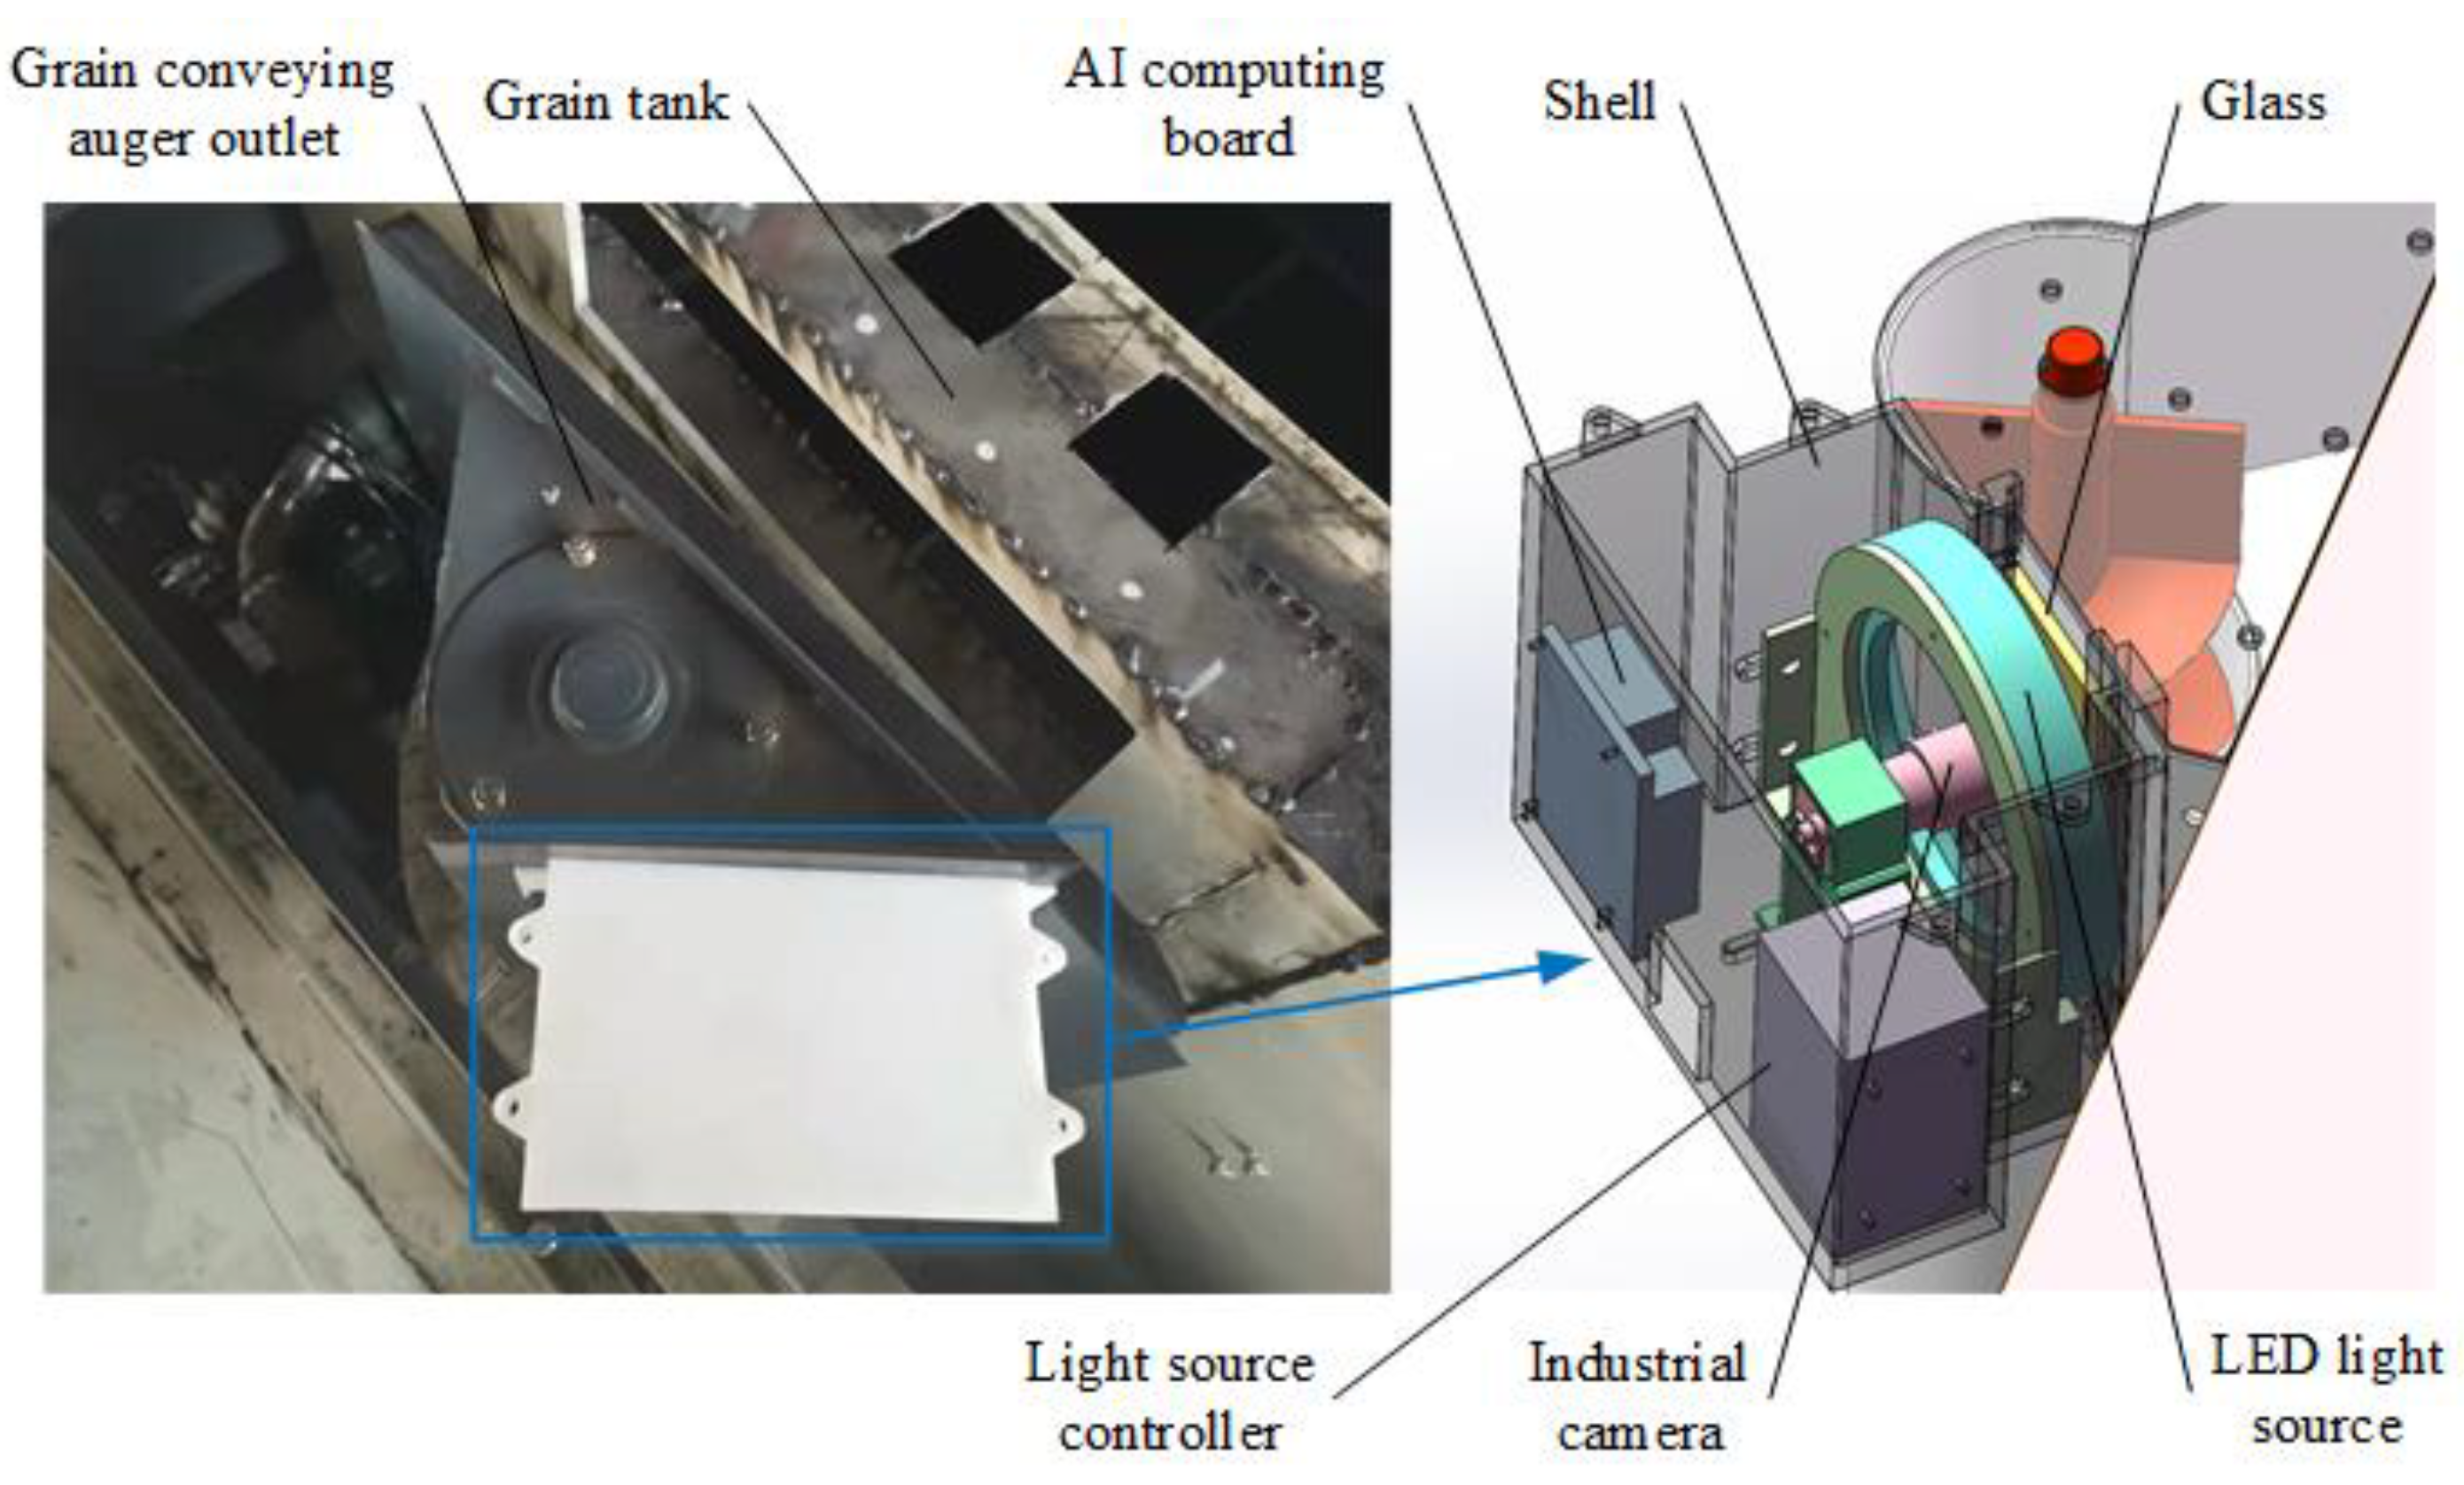
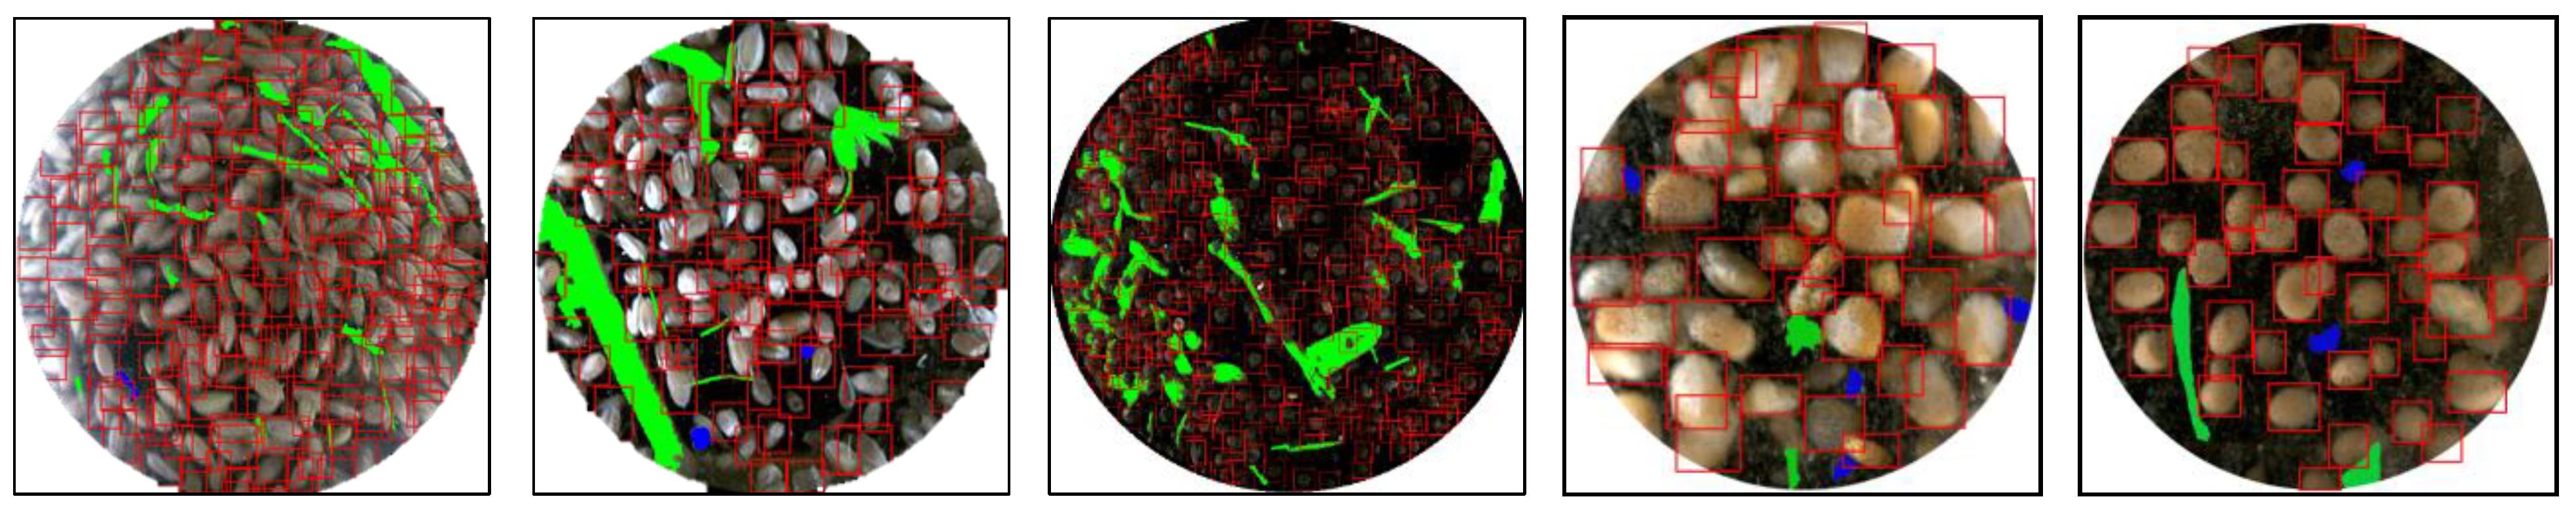
2.2.2. Grain Impurity Rate and Crushing Rate Monitoring Sensor

Based on the principle of image recognition, the developed monitoring sensor for grain impurity rate and crushing rate was integrated outside the top of the auger conveying drum of the combine harvester [16]. This method avoided the serious impact of dust in the grain tank on the camera and image quality and did not occupy the position in the grain tank. The sensor was mainly composed of industrial camera, ring LED light source, light source controller, glass, NVIDIA Jetson Xavier NX professional AI computing board, 3D printing shell, etc., as shown in Figure 5.
The industrial camera collected the material image at the auger outlet and transmitted the image to the AI computing board for processing. Firstly, the improved VGG convolution neural network model was used to classify the crop categories, and the image entered the corresponding impurity crushing rate detection program according to the categories; Then, the distortion correction, median filtering, and other preprocessing operations were carried out. According to the different pixel areas, colors, and rectangles of crushing grains, impurities, and healthy grains, the information on impurities and crushing grains was extracted. Then the improved YOLO V4 target detection algorithm was used to obtain the number of healthy grains. Finally, the established mathematical model was used to calculate the grain impurity rate and crushing rate in the image, and the data were transmitted to the CAN bus. The single image processing results of various crops were shown in Figure 6, and on the original 1024 × 1280-pixel image, almost all grains and impurities could be detected and box selected. Red represented healthy grains, blue represented crushing grains, and green represented impurities.
The field performance tests of the sensor were carried out many times. During the test, the data of grain impurity rate and crushing rate generated by the sensor during the advance of the harvester were collected and compared with the data of impurity rate and crushing rate obtained by manually analyzing the images at the same time. It was calculated that the measurement errors of grain impurity rate and grain-crushing rate were less than 5.8% and 7.3%. It showed that the sensor has stable performance and high measurement accuracy, which could meet the monitoring needs in this study.

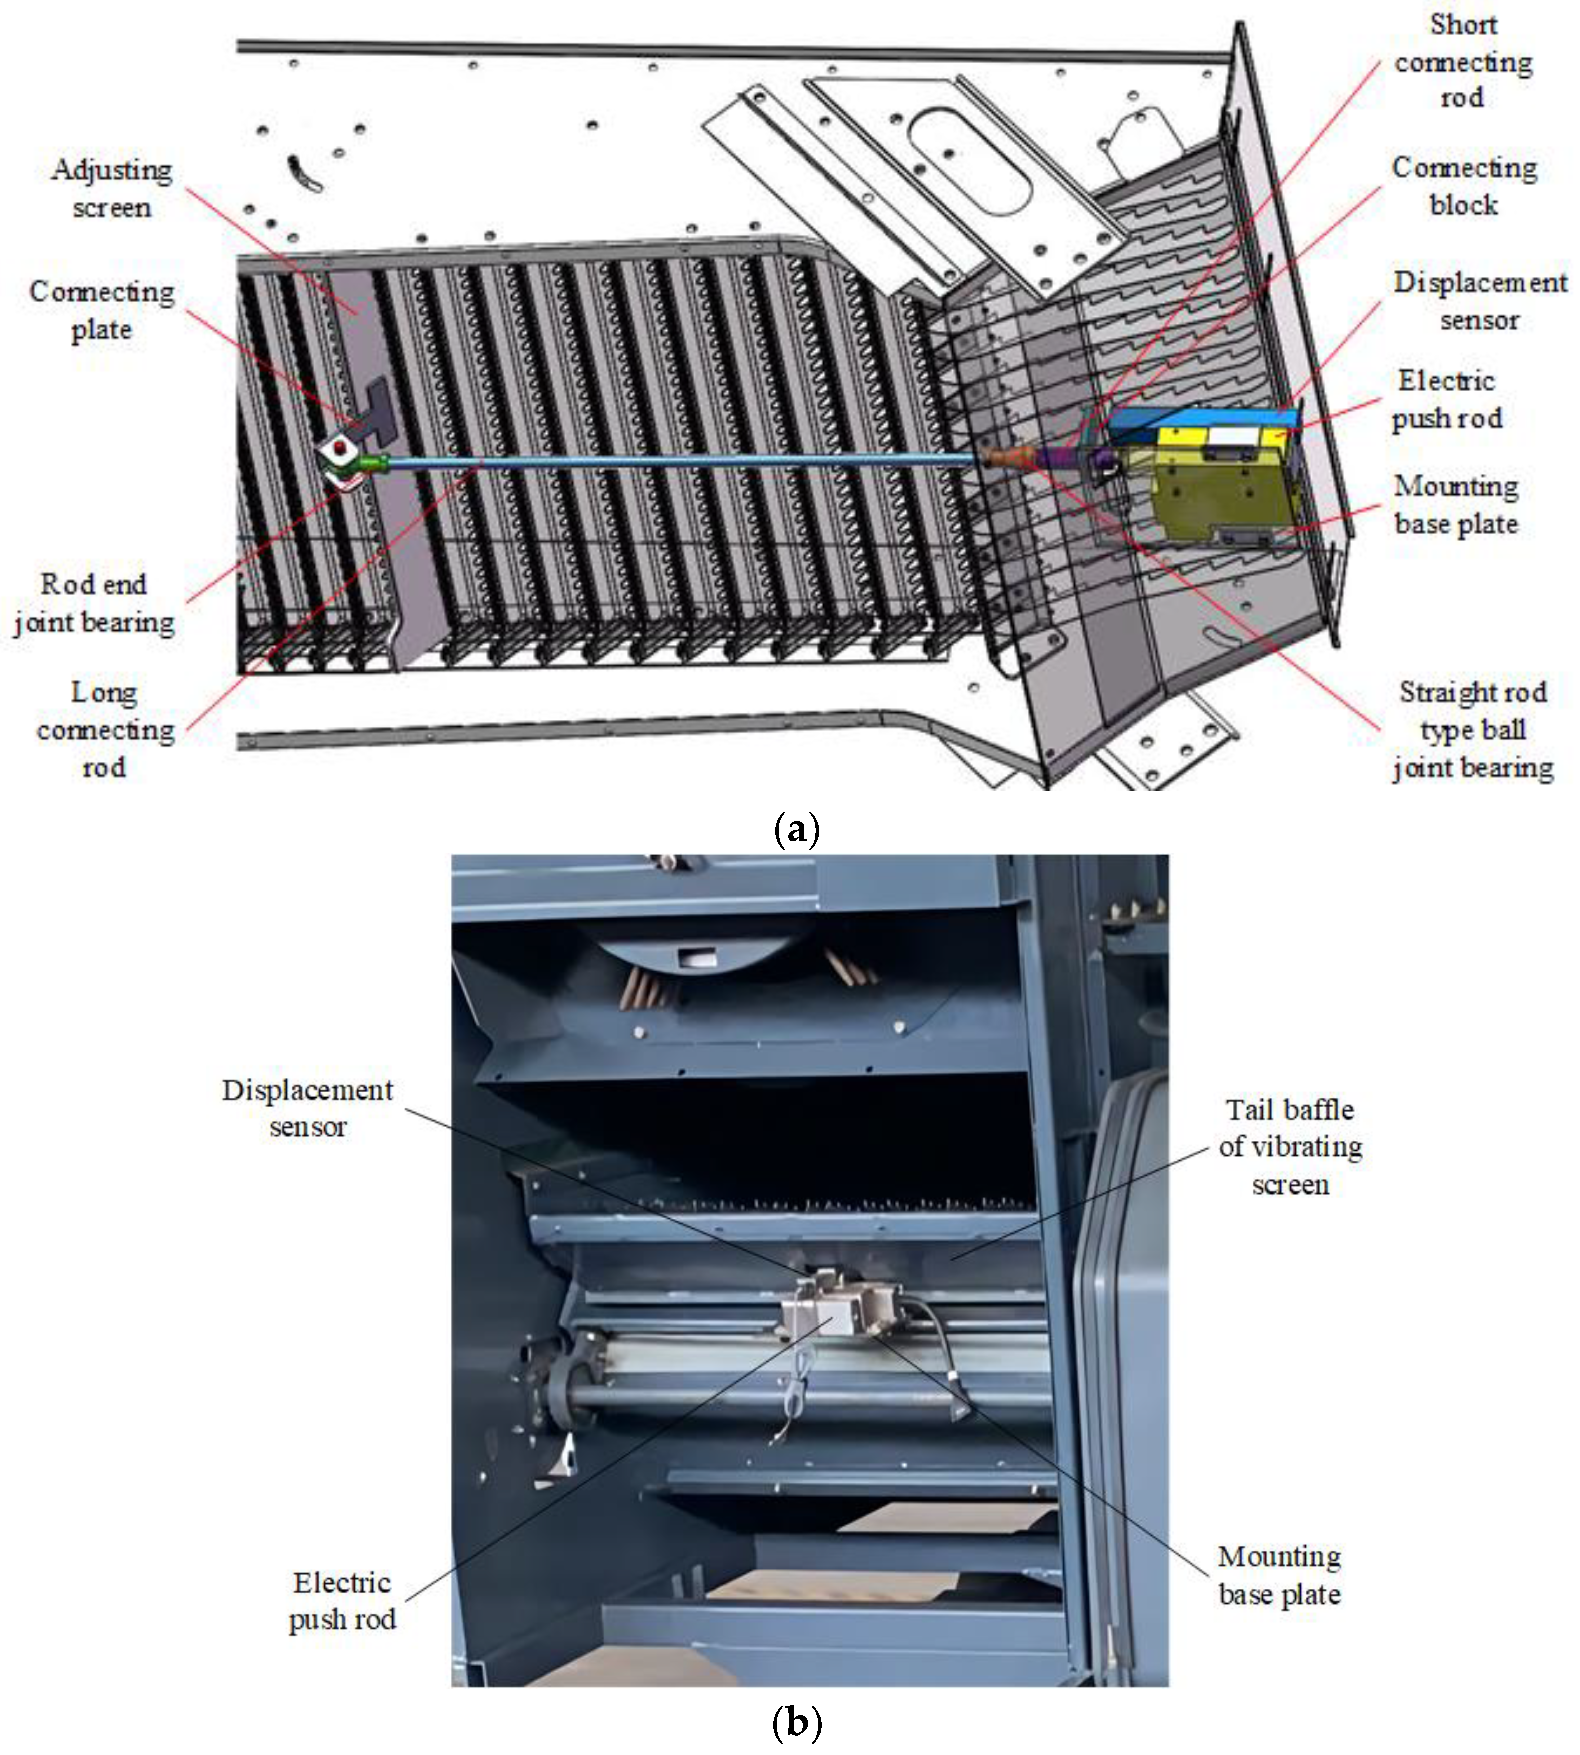
2.2.3. Screen Opening Adjustment Device

The structure of the electric adjusting device for the screen opening is shown in Figure 7. The device was composed of adjusting screen, connecting plate, pin, joint bearing, connecting rod, displacement sensor, electric push rod, etc. The electric push rod and the mounting base plate were fastened together by a multilateral u-clamp, and the mounting base plate was welded at the tail baffle of the vibrating screen. The displacement sensor was fixed above the electric push rod through a small clamp, and the extended end of the displacement sensor and the short connecting rod were fixed together through a connecting block to ensure the synchronous movement of the extended end of the sensor and the push rod. The internal thread at one end of the short connecting rod was screwed together with the external thread at the protruding end of the electric push rod, and the internal thread at the other end of the short connecting rod was fastened with the external thread at the movable ball joint of the straight rod type ball joint bearing. The internal thread at the other end of the bearing was fastened with the external thread at one end of the long connecting rod, and the external thread at the other end of the long connecting rod was fastened with the internal thread of the rod end joint bearing, and the movable joint at the other end of the bearing was fixed with the connecting plate through a pin. The connecting plate was welded on the adjusting screen, which was located in the middle of the vibrating screen and could drive the whole group of the screens to rotate synchronously. The adjustable range of the opening was 18–30 mm.

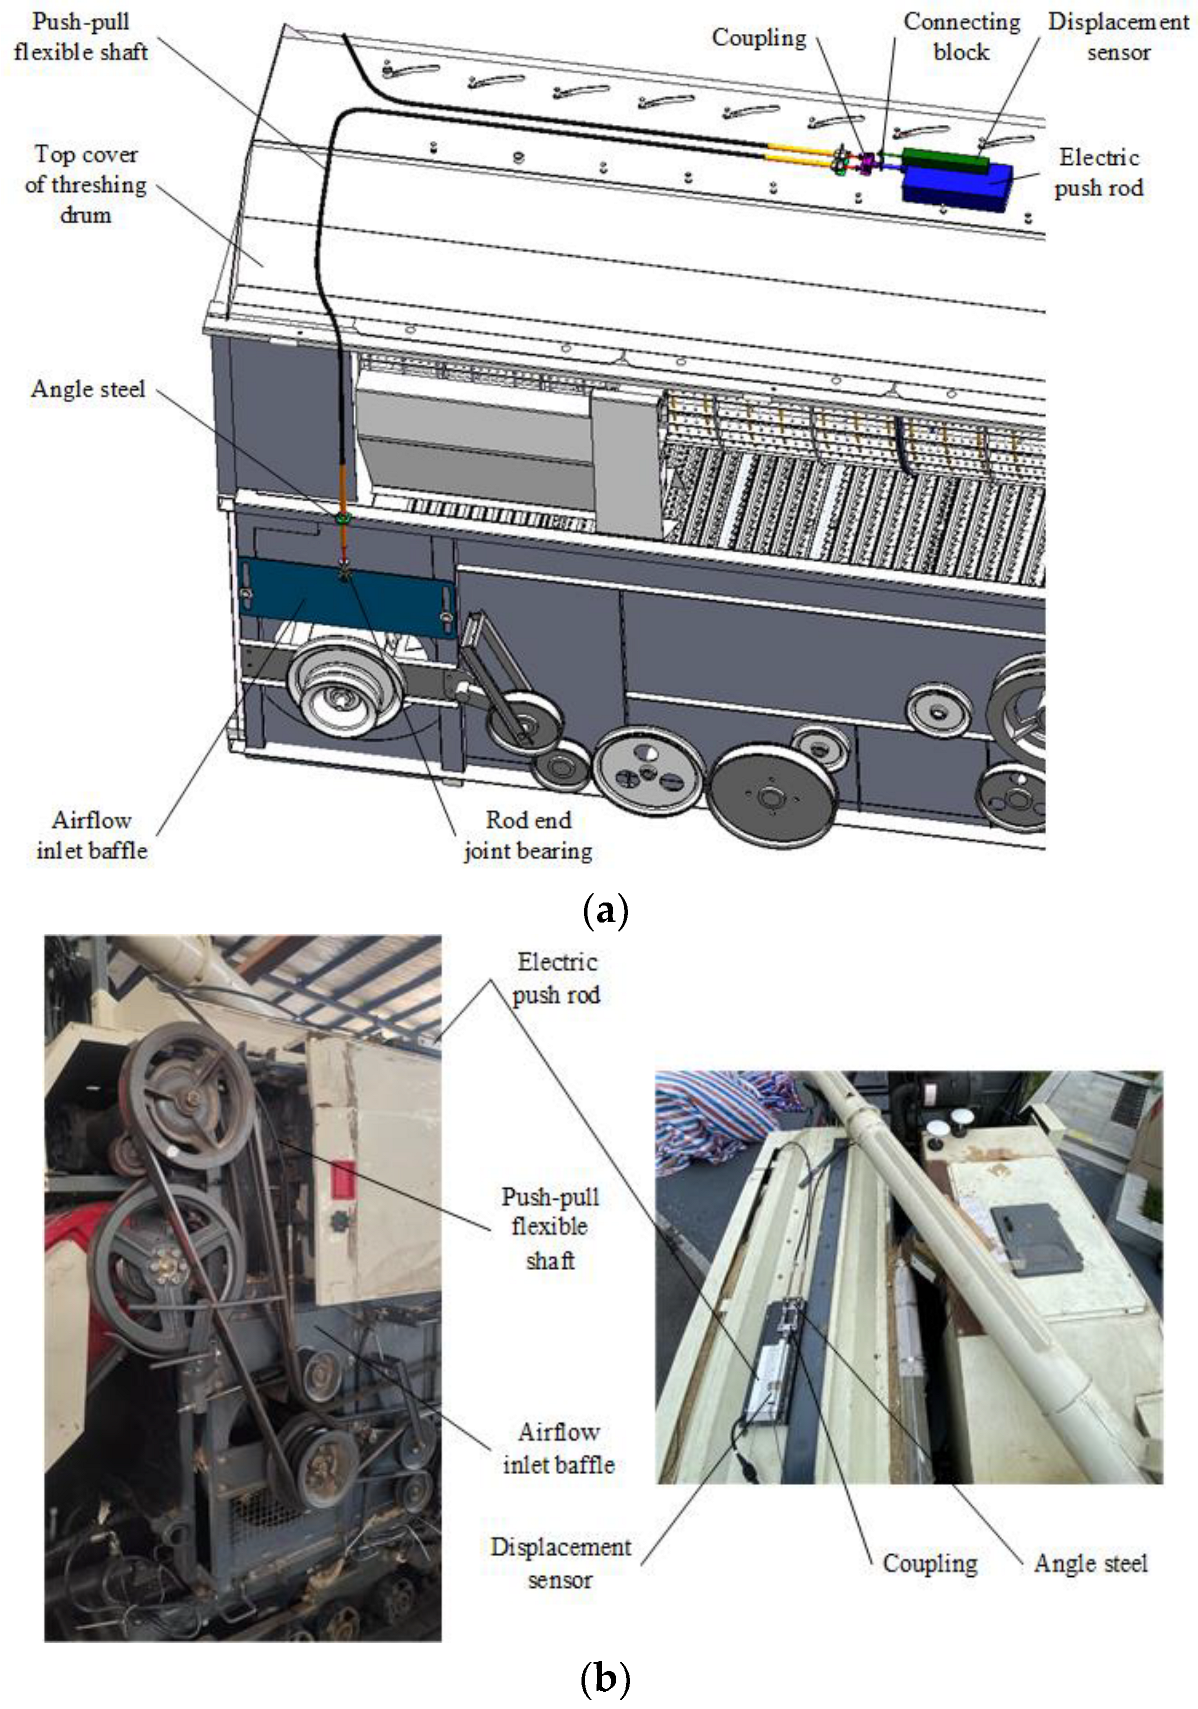
2.2.4. Airflow Inlet Area Adjustment Device

The structure of the designed electric airflow inlet area adjustment device is shown in Figure 8. The device was composed of airflow inlet baffles, push–pull flexible shafts, electric push rod, displacement sensor, coupling, etc. The electric push rod was fixed above the top cover of the threshing drum. The displacement sensor was fixed on the electric push rod, and its protruding end and the protruding end of the electric push rod were fastened through a connecting block to ensure synchronous movement. The hard rod parts of the two push–pull flexible shafts were fixed on the top cover of the threshing drum and the middle cross beam through angle steels. The protruding ends on one side of them were jointly connected with the protruding end of the electric push rod through the coupling, and the protruding ends on the other side were respectively connected with the air inlet baffles on both sides of the backpack through the rod end joint bearings and pins. The left- and right-side notches of the air inlet baffles were connected with the vertical beams next to the fan through pins to limit the shaking of the baffles to a certain extent. The transformation of the moving distance of the electric push rod (displacement sensor) into the airflow inlet area was realized through experimental calibration. The limit moving distance of the electric push rod was divided into 60 parts, and the airflow inlet area corresponding to each grid distance was obtained through measurement and geometric calculation. The adjustable range of the airflow inlet area was 70–100%.

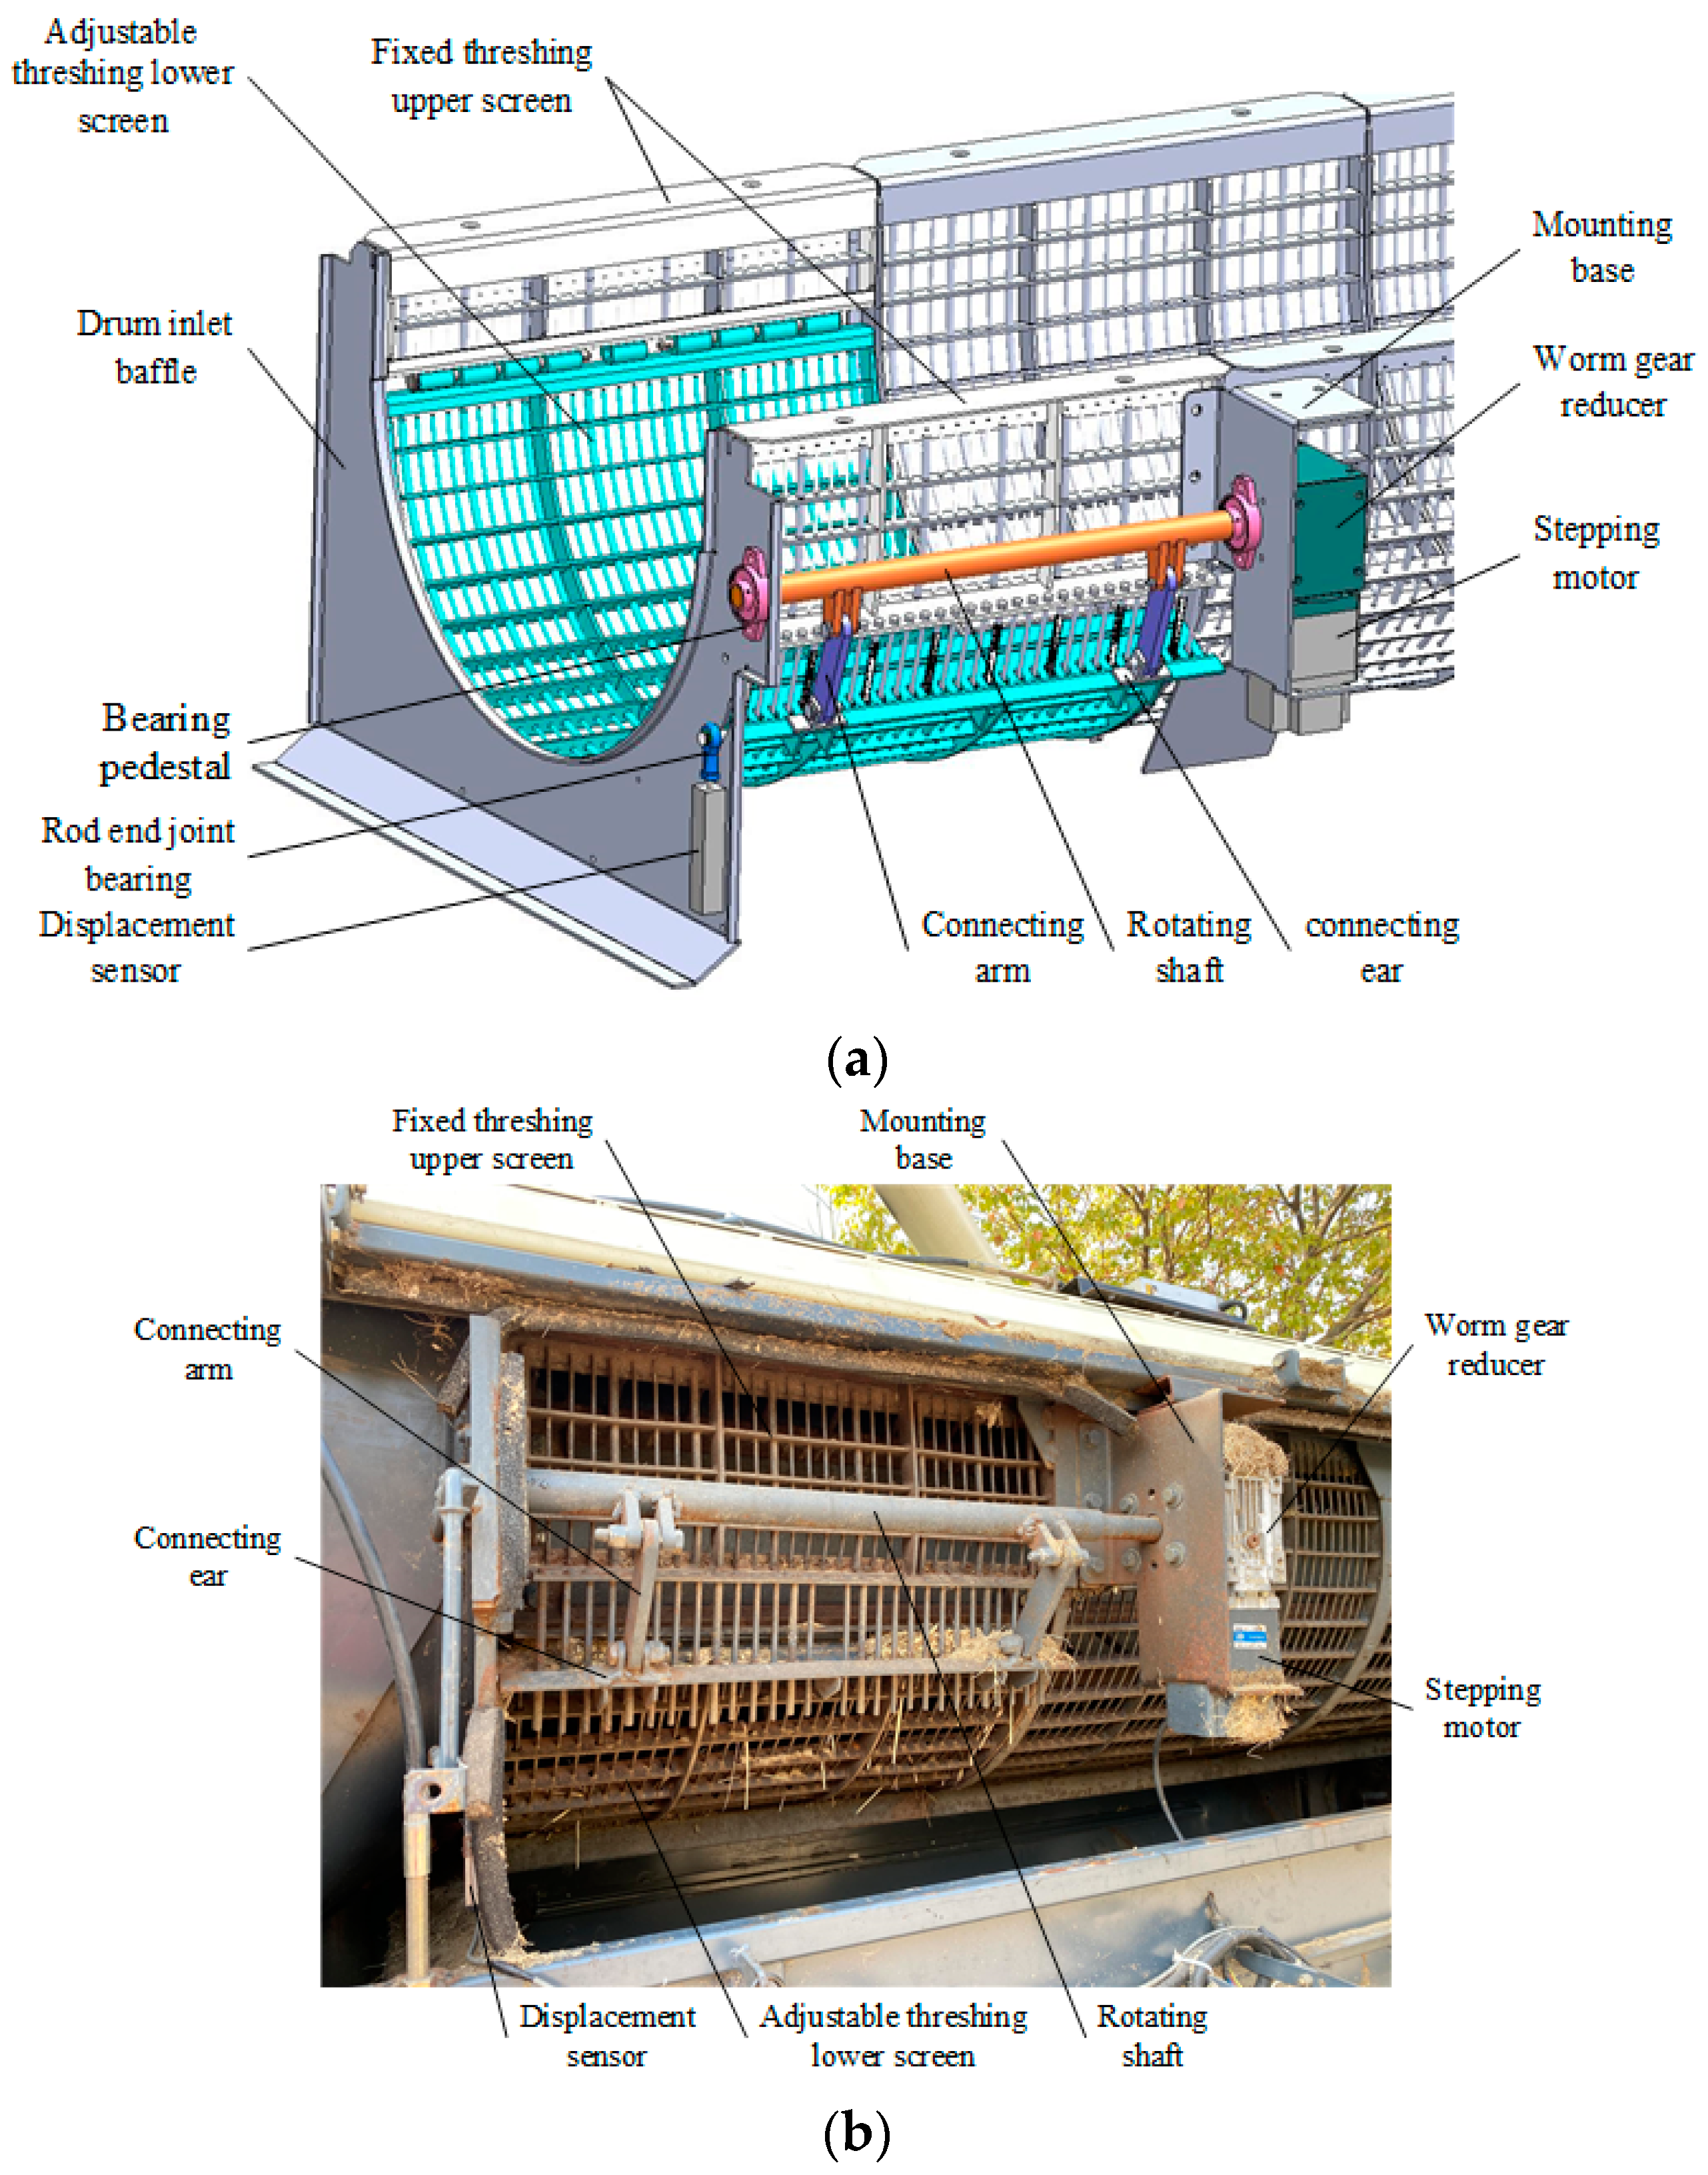
2.2.5. Threshing Gap Adjustment Device

The structure of the designed threshing gap electric adjusting device is shown in Figure 9. The device was composed of adjustable threshing lower screen, stepping motor, worm gear reducer, rotating shaft, connecting arms, displacement sensor, etc. The stepping motor and the worm gear reducer were fixedly connected to provide adjustment power for the mechanism. They were fixed on the mounting base, which was fixed on the side wall of the threshing drum. The output end of the worm gear reducer was a flat key hollow groove. One end of the rotating shaft passed through the bearing fixed on the mounting base and was fixed with the output end of the reduction gearbox through a flat key. The other end of the rotating shaft was matched with the bearing fixed on the drum inlet baffle. One end of the adjustable threshing lower screen was connected with the fixed threshing upper screen through pin shafts, and the other end was fixedly connected with the connecting ears. The connecting ears were connected with one end of the connecting arms through pins, and the other end of the connecting arms was also connected with the rotating shaft through pins. The displacement sensor was fixed on the outside of the drum inlet baffle. The external thread of its protruding end was fixedly connected with the internal thread of the rod end joint bearing. The movable joint at the other end of the bearing was connected with a long pin, which was welded on the beam of the adjustable threshing lower screen. An arc groove was opened on the drum inlet baffle to ensure that the movement of the long pin did not interfere when adjusting the threshing gap. The adjustable range of the threshing gap was 14–36 mm.

2.3. System Identification Test Design

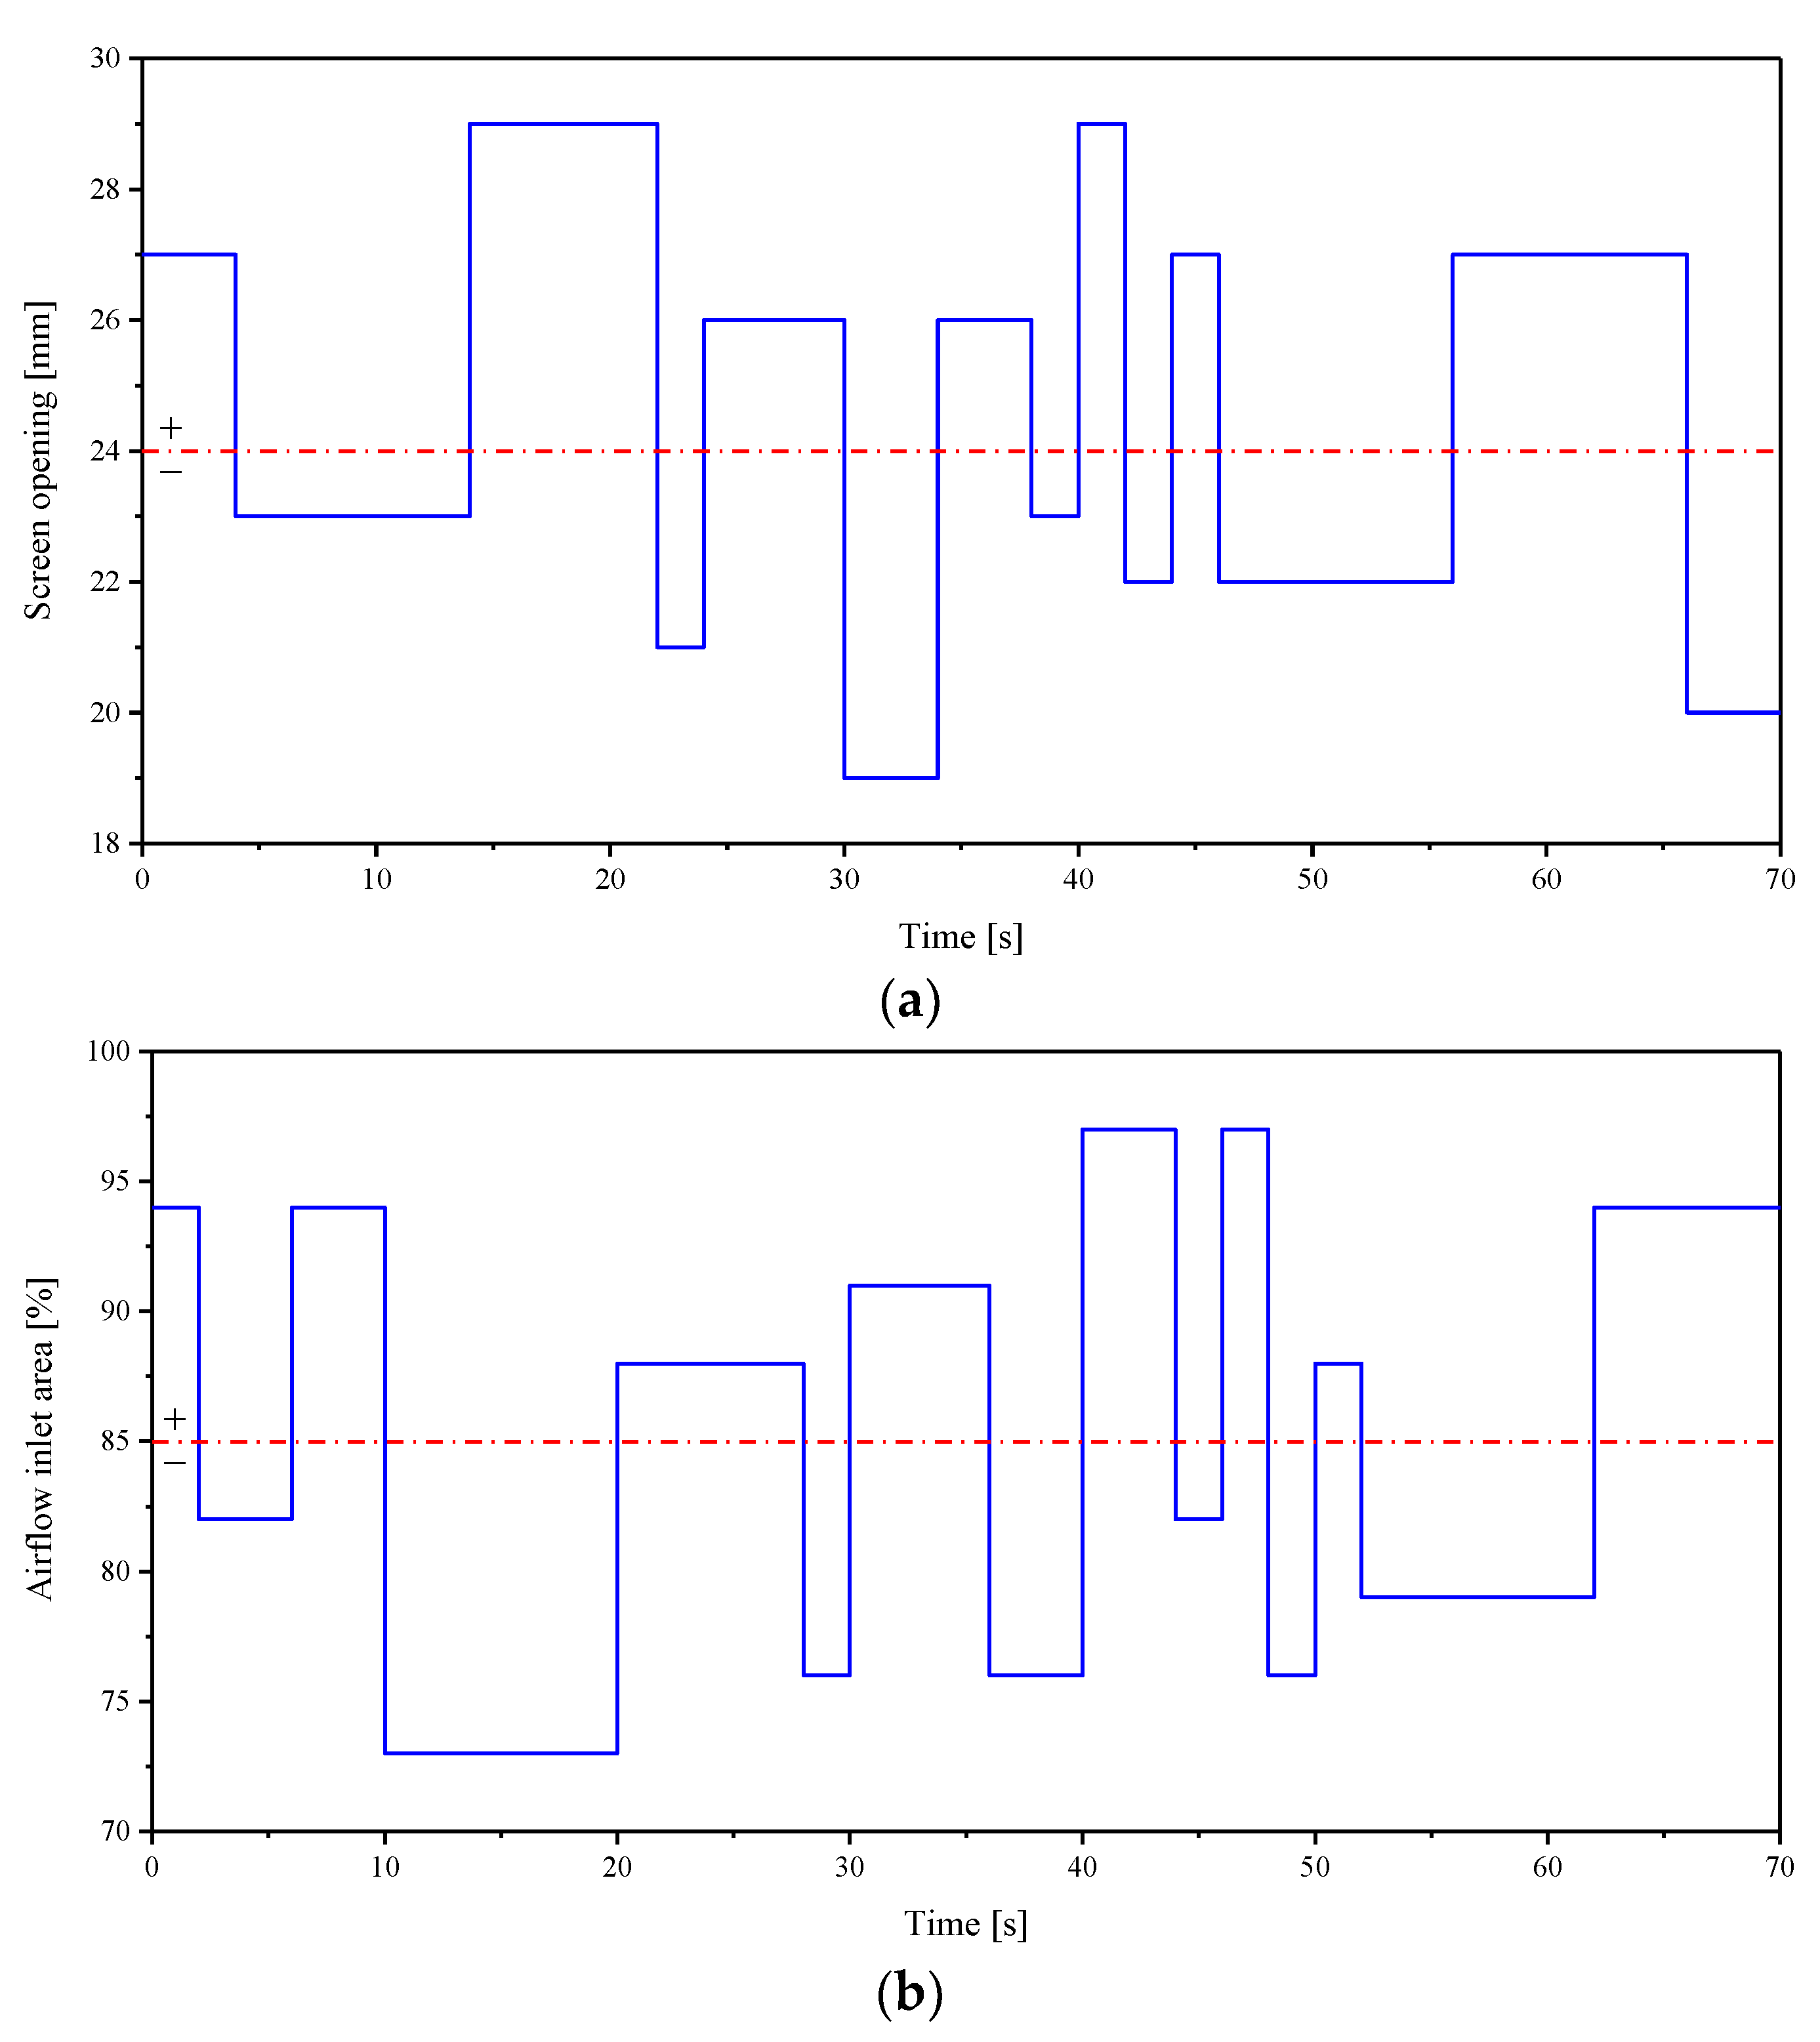
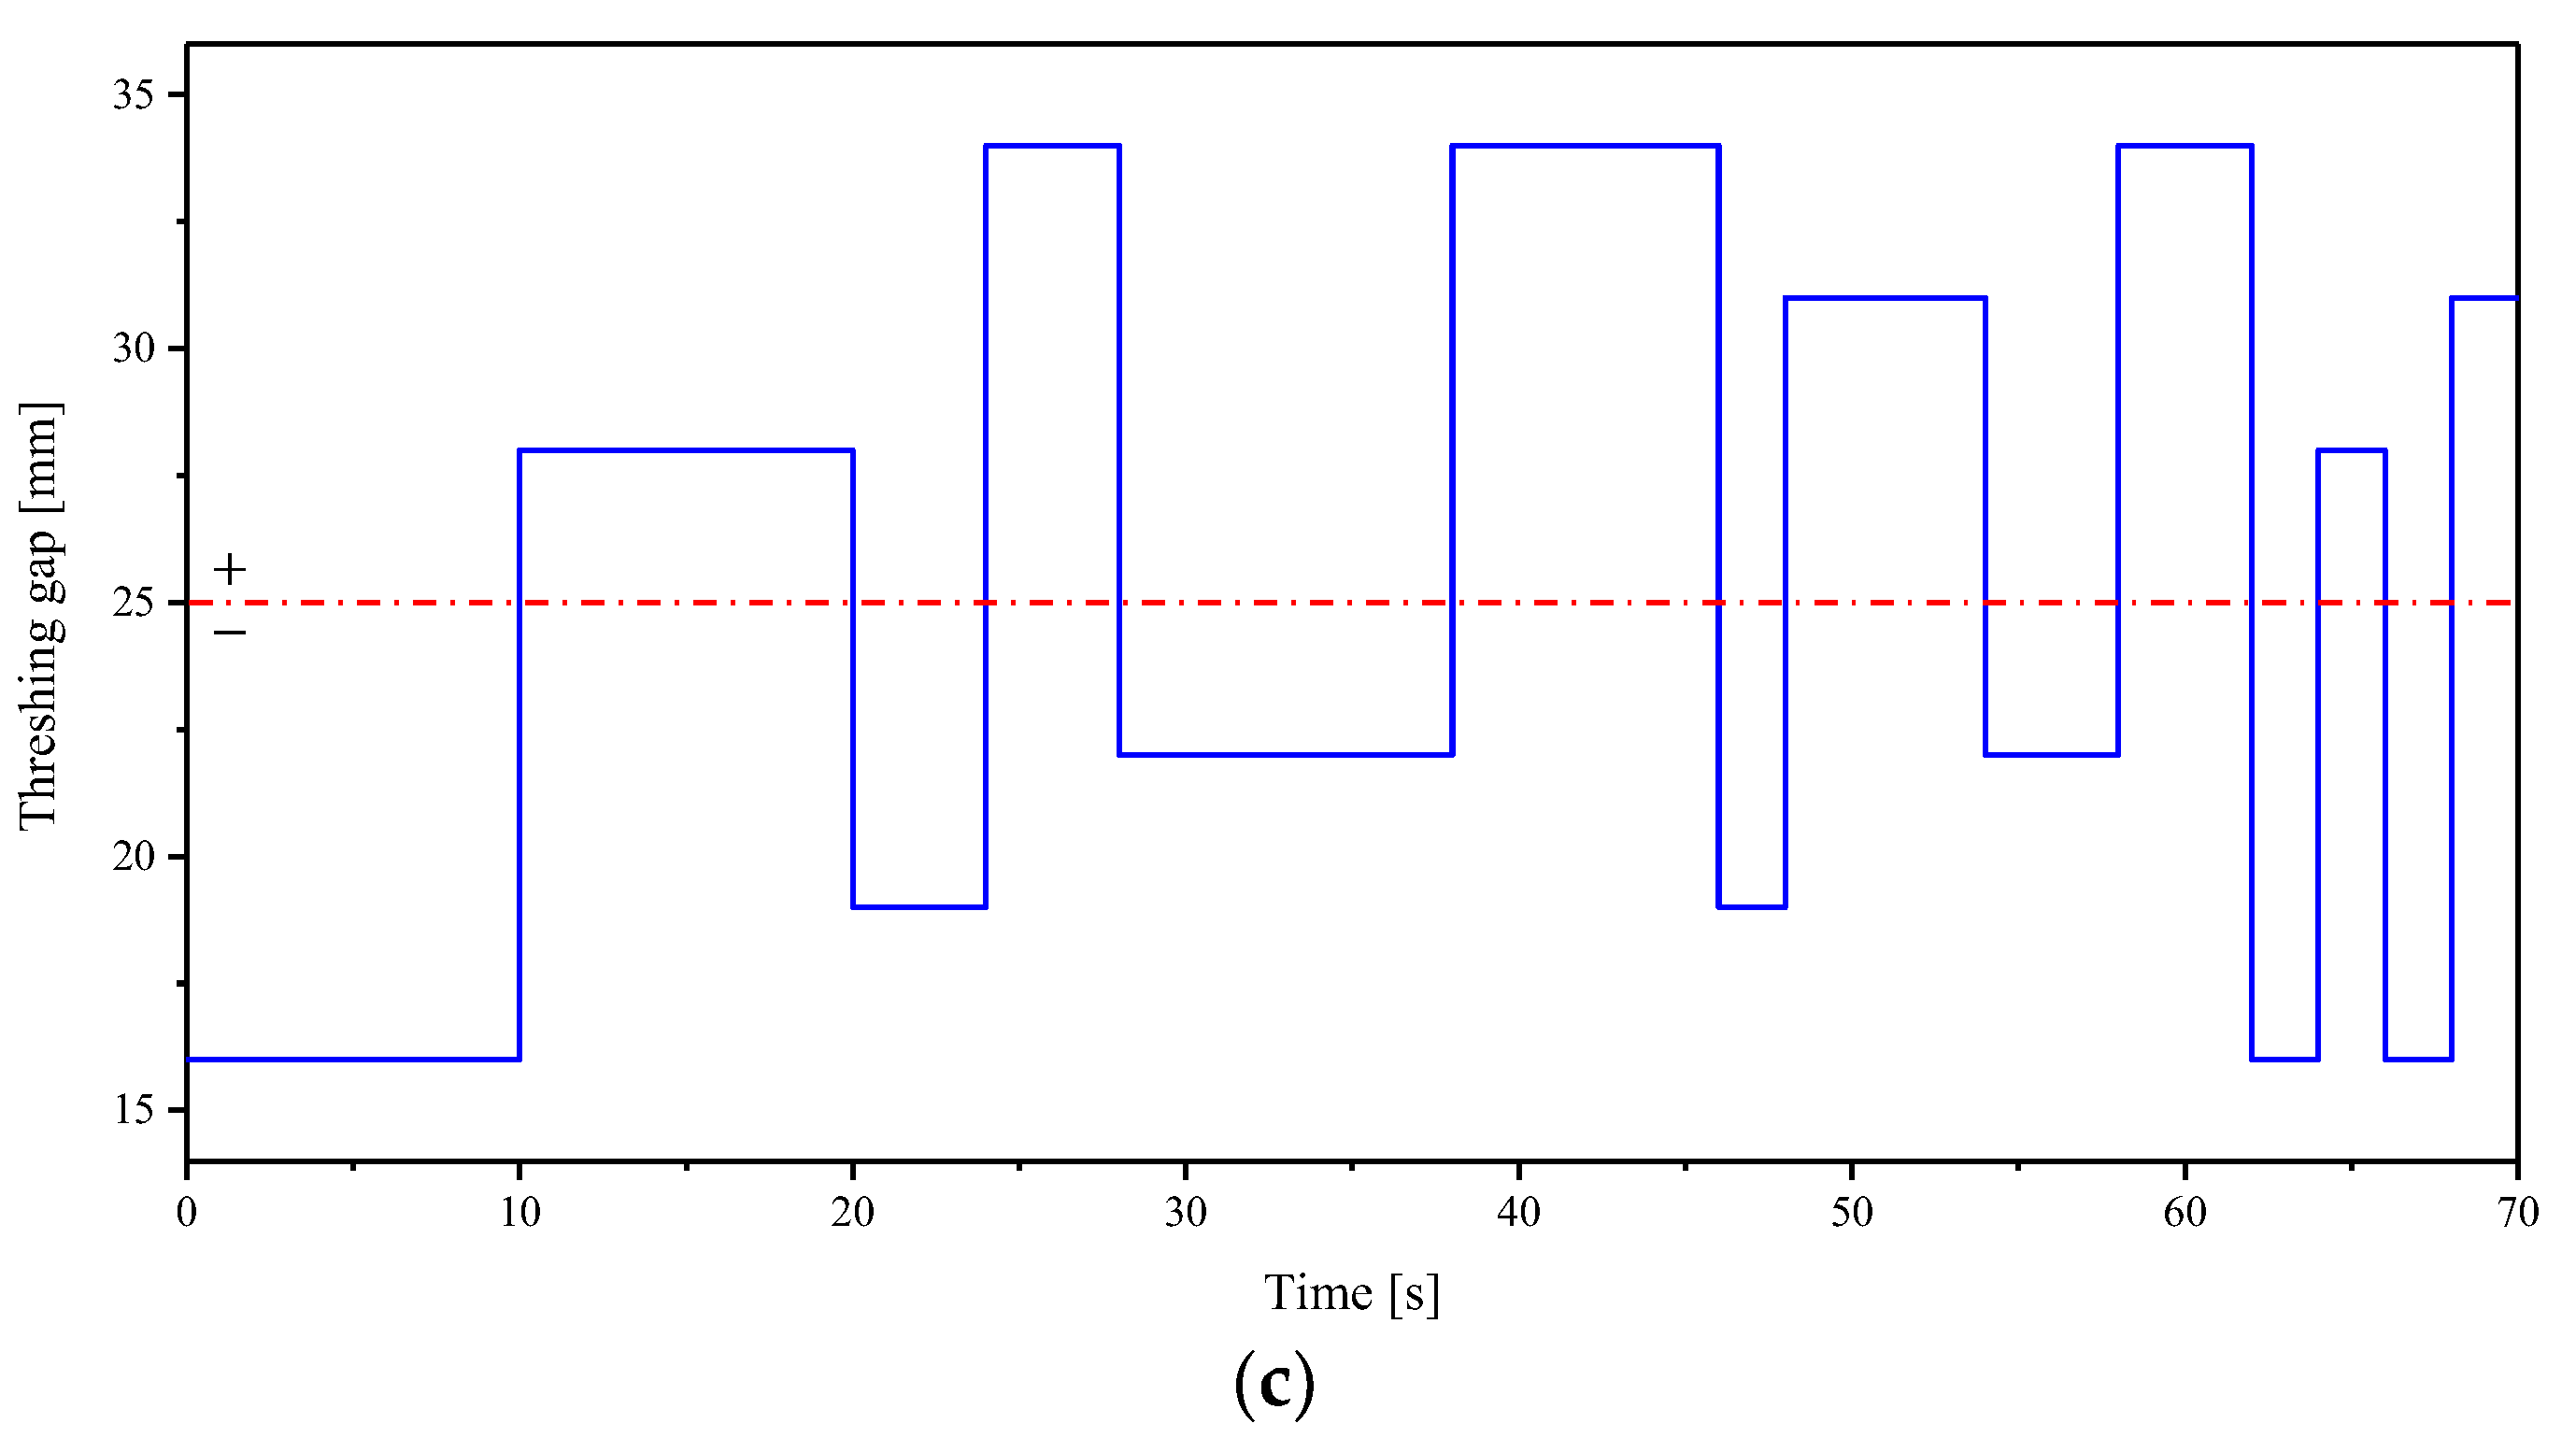
2.3.1. Input Signal Setting

In order to make the dynamic process identifiable, the input signal should meet certain conditions; that is, all the modes of the process in the whole observation cycle must be continuously and fully excited by the input signal. The specific requirements are that the data length should be sufficient, and the input signal changes quickly and greatly. Generally, white noise sequences or PRBS are selected as input signals to meet the requirements of better signal excitation. In this study, the amplitude modulated PRBS [17] was used as the input signal; that is, the input range was divided into equal intervals based on PRBS, and the random number generator was used to select the values in this range to meet the model identification requirements of nonlinear system.
The amplitude, shift pulse period, and cycle period of each input variable PRBS were determined according to the actual working conditions. The screen opening, airflow inlet area, and threshing gap PRBS input signals were generated through MATLAB code. Since the system adjustment had a time delay of about 4 s, an additional 8 s was added based on one cycle, and a total time of 70 s was used as the sampling time of the PRBS input signals to meet the complete cycle excitation. The results are shown in Figure 10.

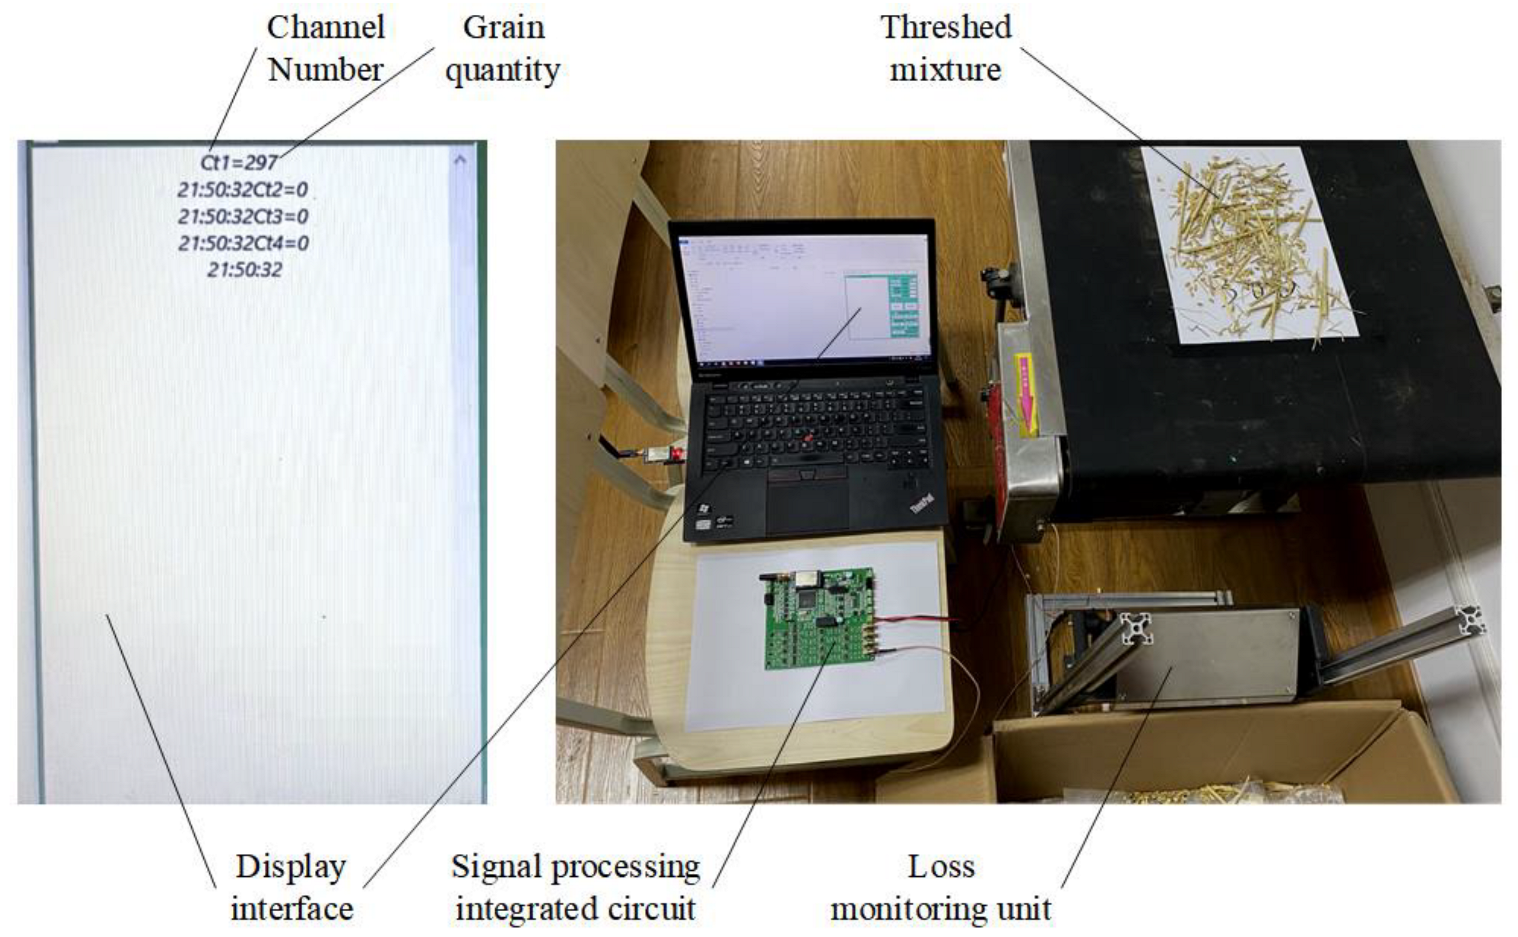
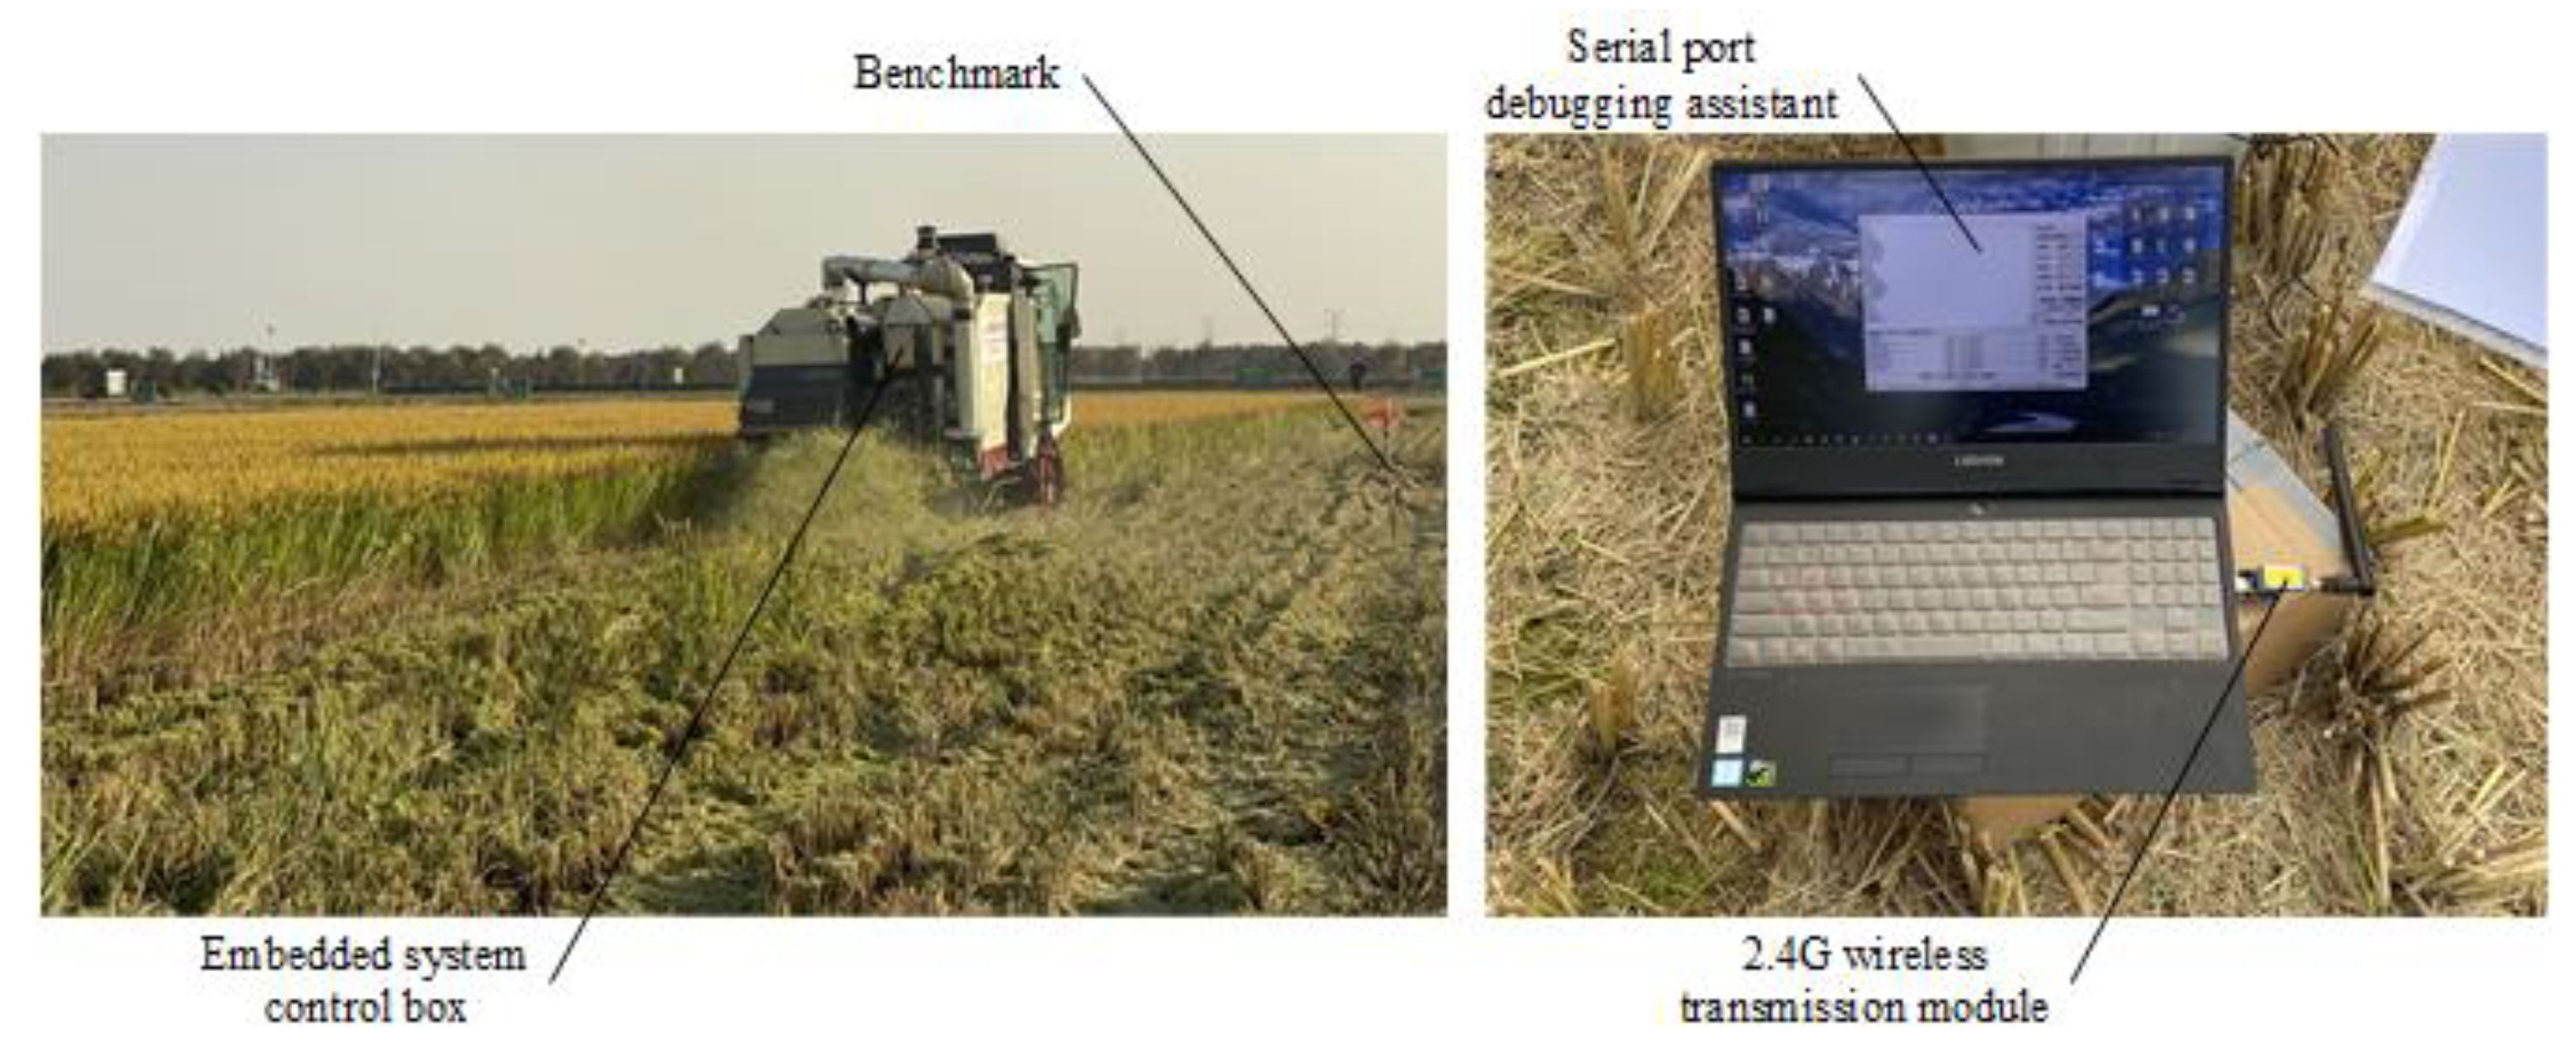
2.3.2. Output Signal Acquisition

The rice harvest test conducted on the farm of Zhenjiang City in November 2020 was taken as an example. The output signal acquisition method of the threshing and cleaning system was as follows: The combine harvester advanced at the rated harvesting speed of 1.5 m/s, requiring a forward length of 105 m. The planting length of 115 m was measured, and the benchmarks were inserted at 10 m and the endpoint. The first 10 m was used as the buffer zone to ensure that the forward speed of the harvester and the rotating speed of all working parts reached the rated values. In the 10–115 m signal acquisition section, it was necessary to ensure the full cutting width of the harvester and the consistency of stubble height as far as possible. The start and end instructions of the signal acquisition program were sent through the serial port debugging assistant and the 2.4 G wireless transmission module at the computer. The signal acquisition program was written in C language. Its function was to make the screen opening, the airflow inlet area, and the threshing gap perform corresponding actions at each sampling time and receive the data of the cleaning entrainment loss rate, grain impurity rate, and grain-crushing rate in the CAN bus, and send them to the computer in real-time. In addition, the signal acquisition program was burned in the MCU of the cleaning entrainment loss monitoring embedded system. They shared the same set of peripheral circuits and data transmission interfaces, reducing the cost and complexity of embedded hardware. The output signal acquisition schematic diagram of the threshing and cleaning system of the combine harvester is shown in Figure 11. The collected threshing and cleaning output signals are shown in Figure 12.

2.4. Fusion Identification Method Based on PSO and WNN

Considering the real-time calculation and cost requirements of the cooperative control system for threshing and cleaning in the combine harvester, the state-space model, which has been successfully applied in the practical engineering field, was selected in this study. The state-space model of a discrete-time system could be expressed as the following equation:
{ x ( k + 1 ) = A x ( k ) + B u u ( k ) + B d d ( k ) y c ( k ) = C c x ( k ) + D u ( k )
where, x ( k ) R n x was the state variable; u ( k ) R n u was the control input variable; y c ( k ) R n c was the controlled output variable; d ( k ) R n d was the measurable external disturbance variable; A , B u , B d , C c , and D were the constant matrices.
It could be seen that the upper part of the model structure was the state equation, and the lower part was the output equation. The identification of the state-space model was equivalent to the process of determining the parameters of each constant matrix.
The neural network could approximate almost any function and has been widely used in the identification of complex systems. The WNN was a kind of feedforward neural network based on wavelet analysis; that is, the nonlinear wavelet basis was used to replace the usual Sigmoid function, which greatly avoided the local optimization problem in the training process of the neural network. In general, the gradient descent method was used to train the network, but the convergence speed of this method was slow, and the results of this method used for learning high-order wavelet networks were not satisfactory [18,19]. To solve this problem, the PSO algorithm and WNN were combined in this study. The PSO algorithm was used to optimize the connection weight, translation factor, and other parameters in the WNN. In the PSO algorithm, a group of particles needed to be initialized randomly. Each particle had an initial position and velocity and updated itself by tracking two positions. One was the optimal solution (Pbest) found by the particle itself, that was, the individual optimal value. The other was the optimal solution (Gbest) found by the whole population, that was, the global optimal value. The basic steps of the PSO-WNN optimization algorithm were as follows:
(1)
Initializing each particle in the population, determining the number of all particles, and randomly generating the initial velocity v i and initial position X i of each particle; Determining the maximum number of iterations; Setting the current optimal position of each particle to p b i = X i and the global optimal position to g b i = min i p b i .
(2)
Giving the basic structure and input and output data of WNN training model; Setting the wavelet basis function. In this paper, the Morlet wavelet function after cosine modulation was used as the basis function of, namely: ϕ ( x ) = cos ( 1.75 x ) e x 2 2 .
(3)
After one step of PSO iteration, the position and velocity of each particle were updated by using the particle update formula in the PSO algorithm.
(4)
The current fitness value of each particle was calculated and compared with the fitness values of the previous individual optimal position Pbest and global optimal position Gbest; then, the Pbest and Gbest were updated [20,21].
(5)
Continue iterating, constantly updating the position and velocity of each particle.
(6)
When the error reached the initial set value, or the iteration reached the maximum value, it stopped training. Otherwise, it returned to step (4) to continue training until the requirements were met.
(7)
The final global optimal values were substituted into the connection weight, scaling factor, and other parameters of the WNN, and the network output was calculated.

3. Results and Discussion

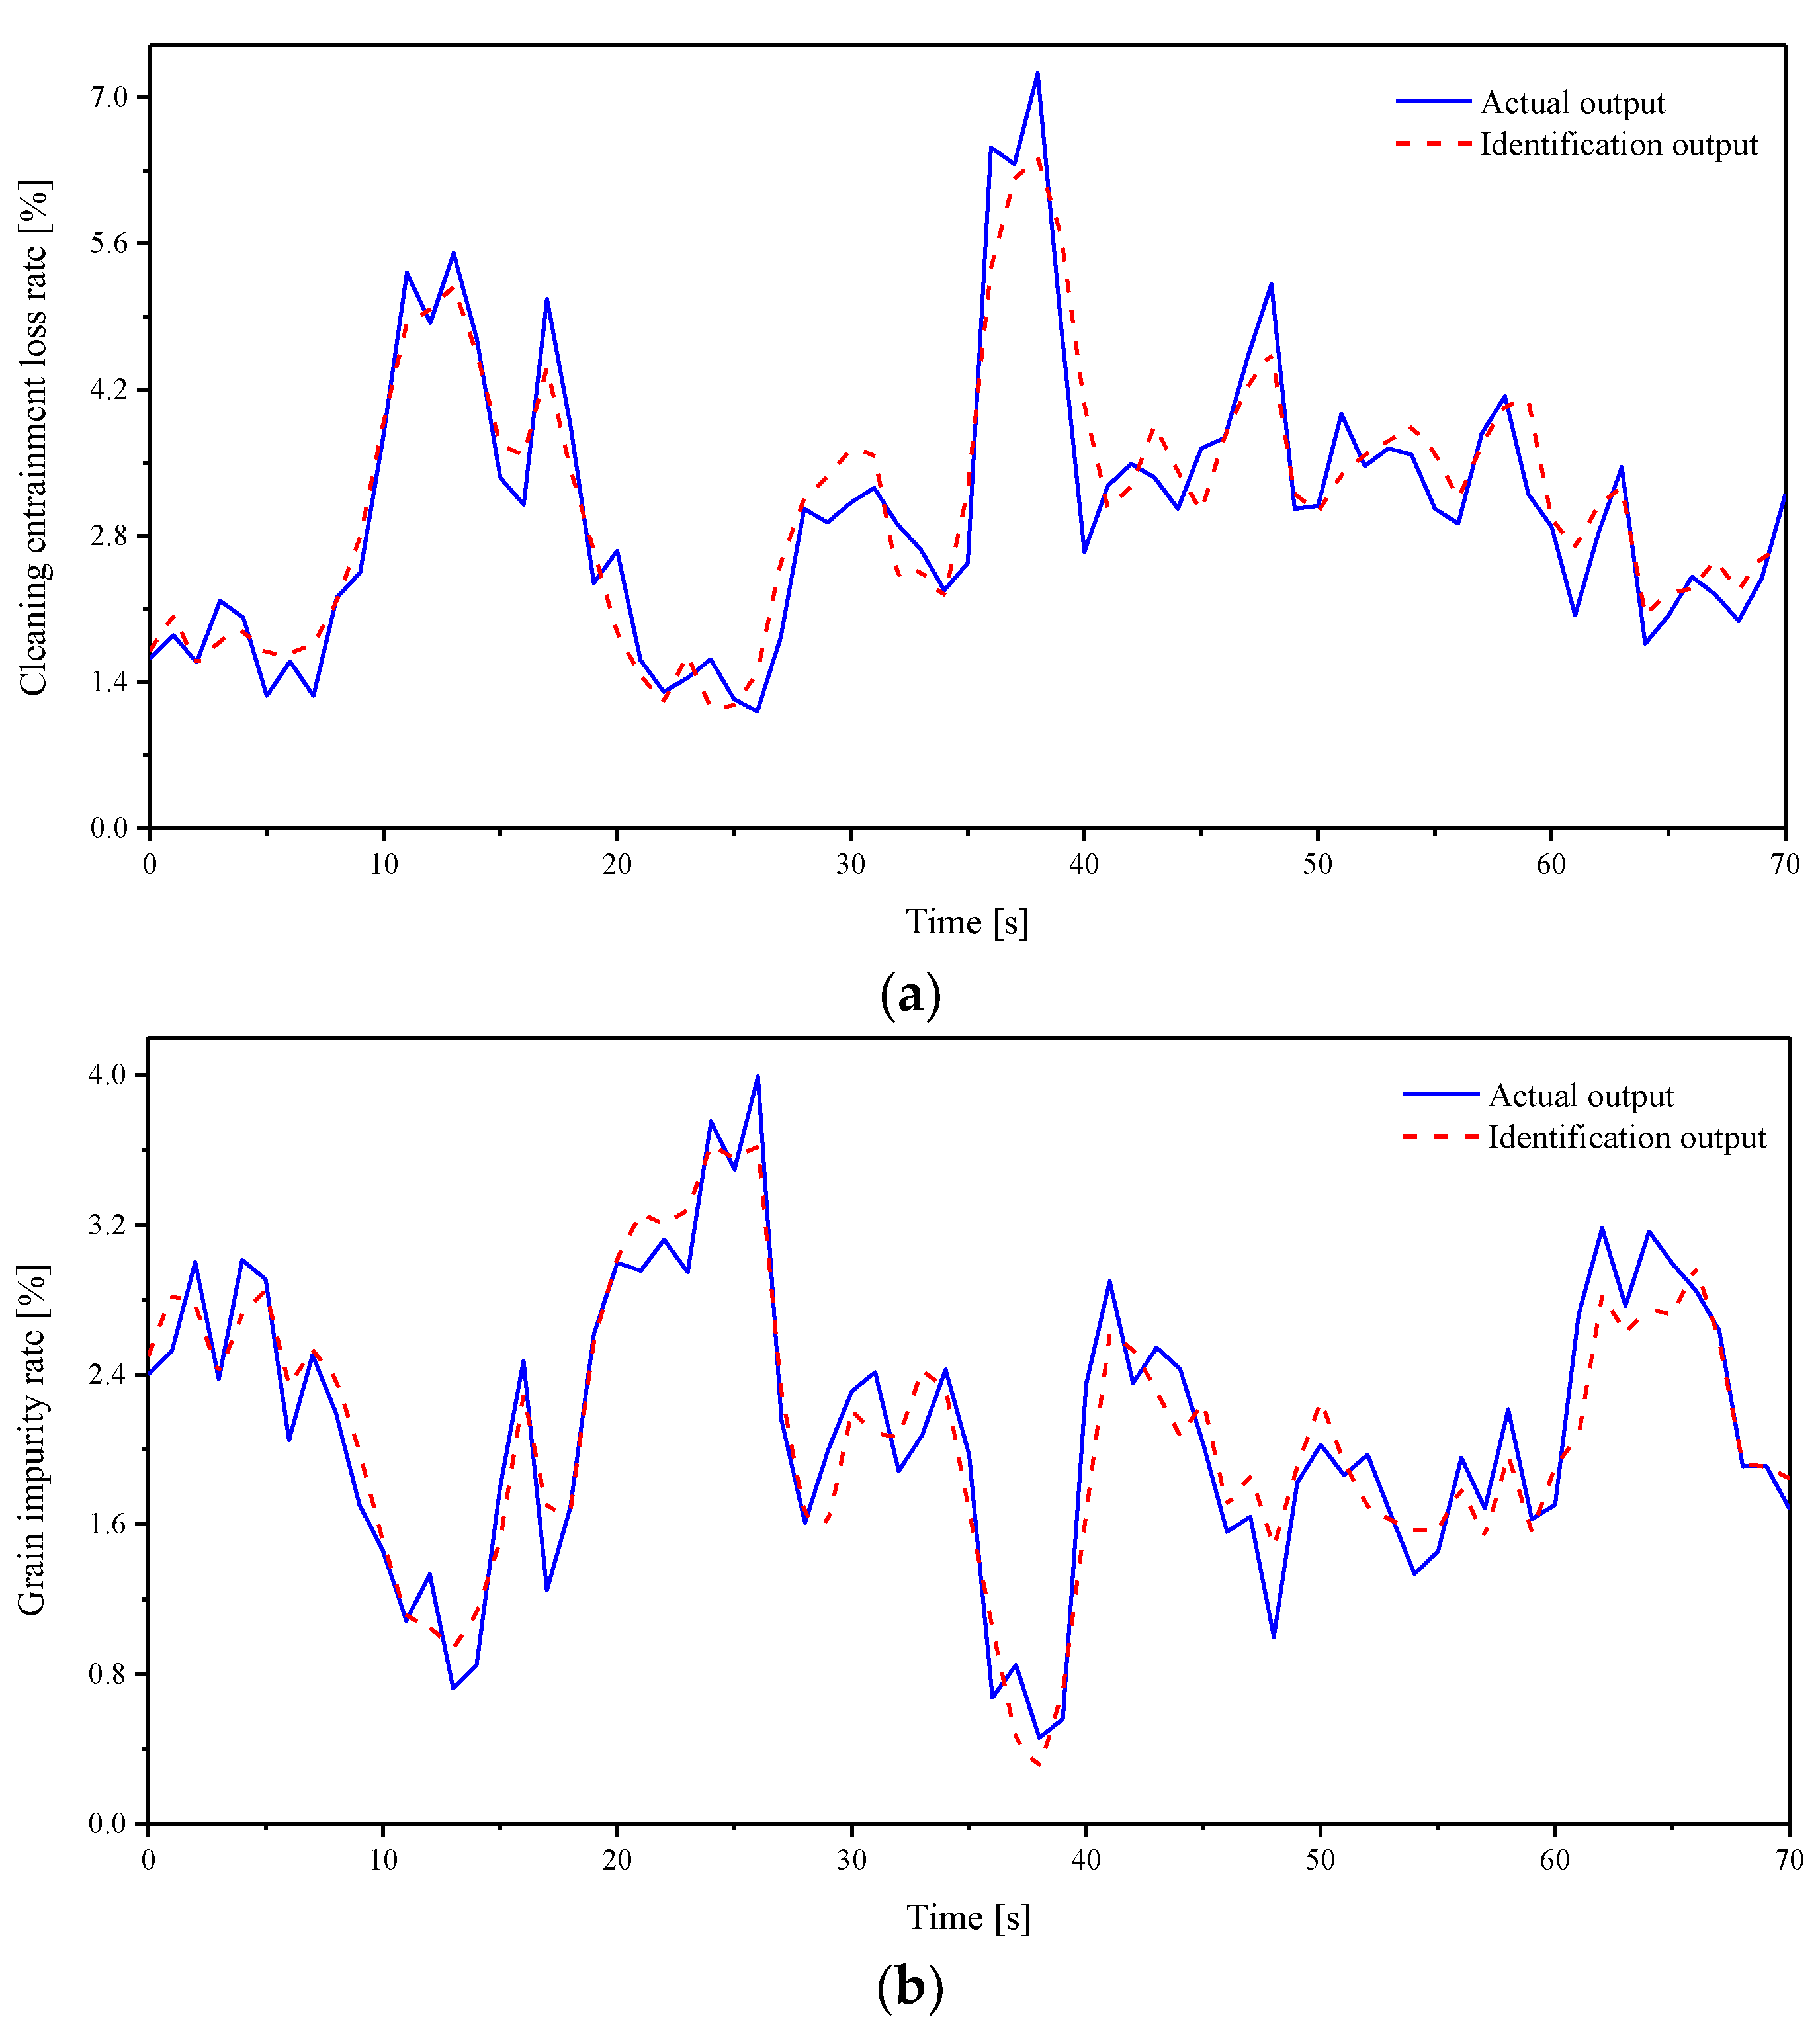
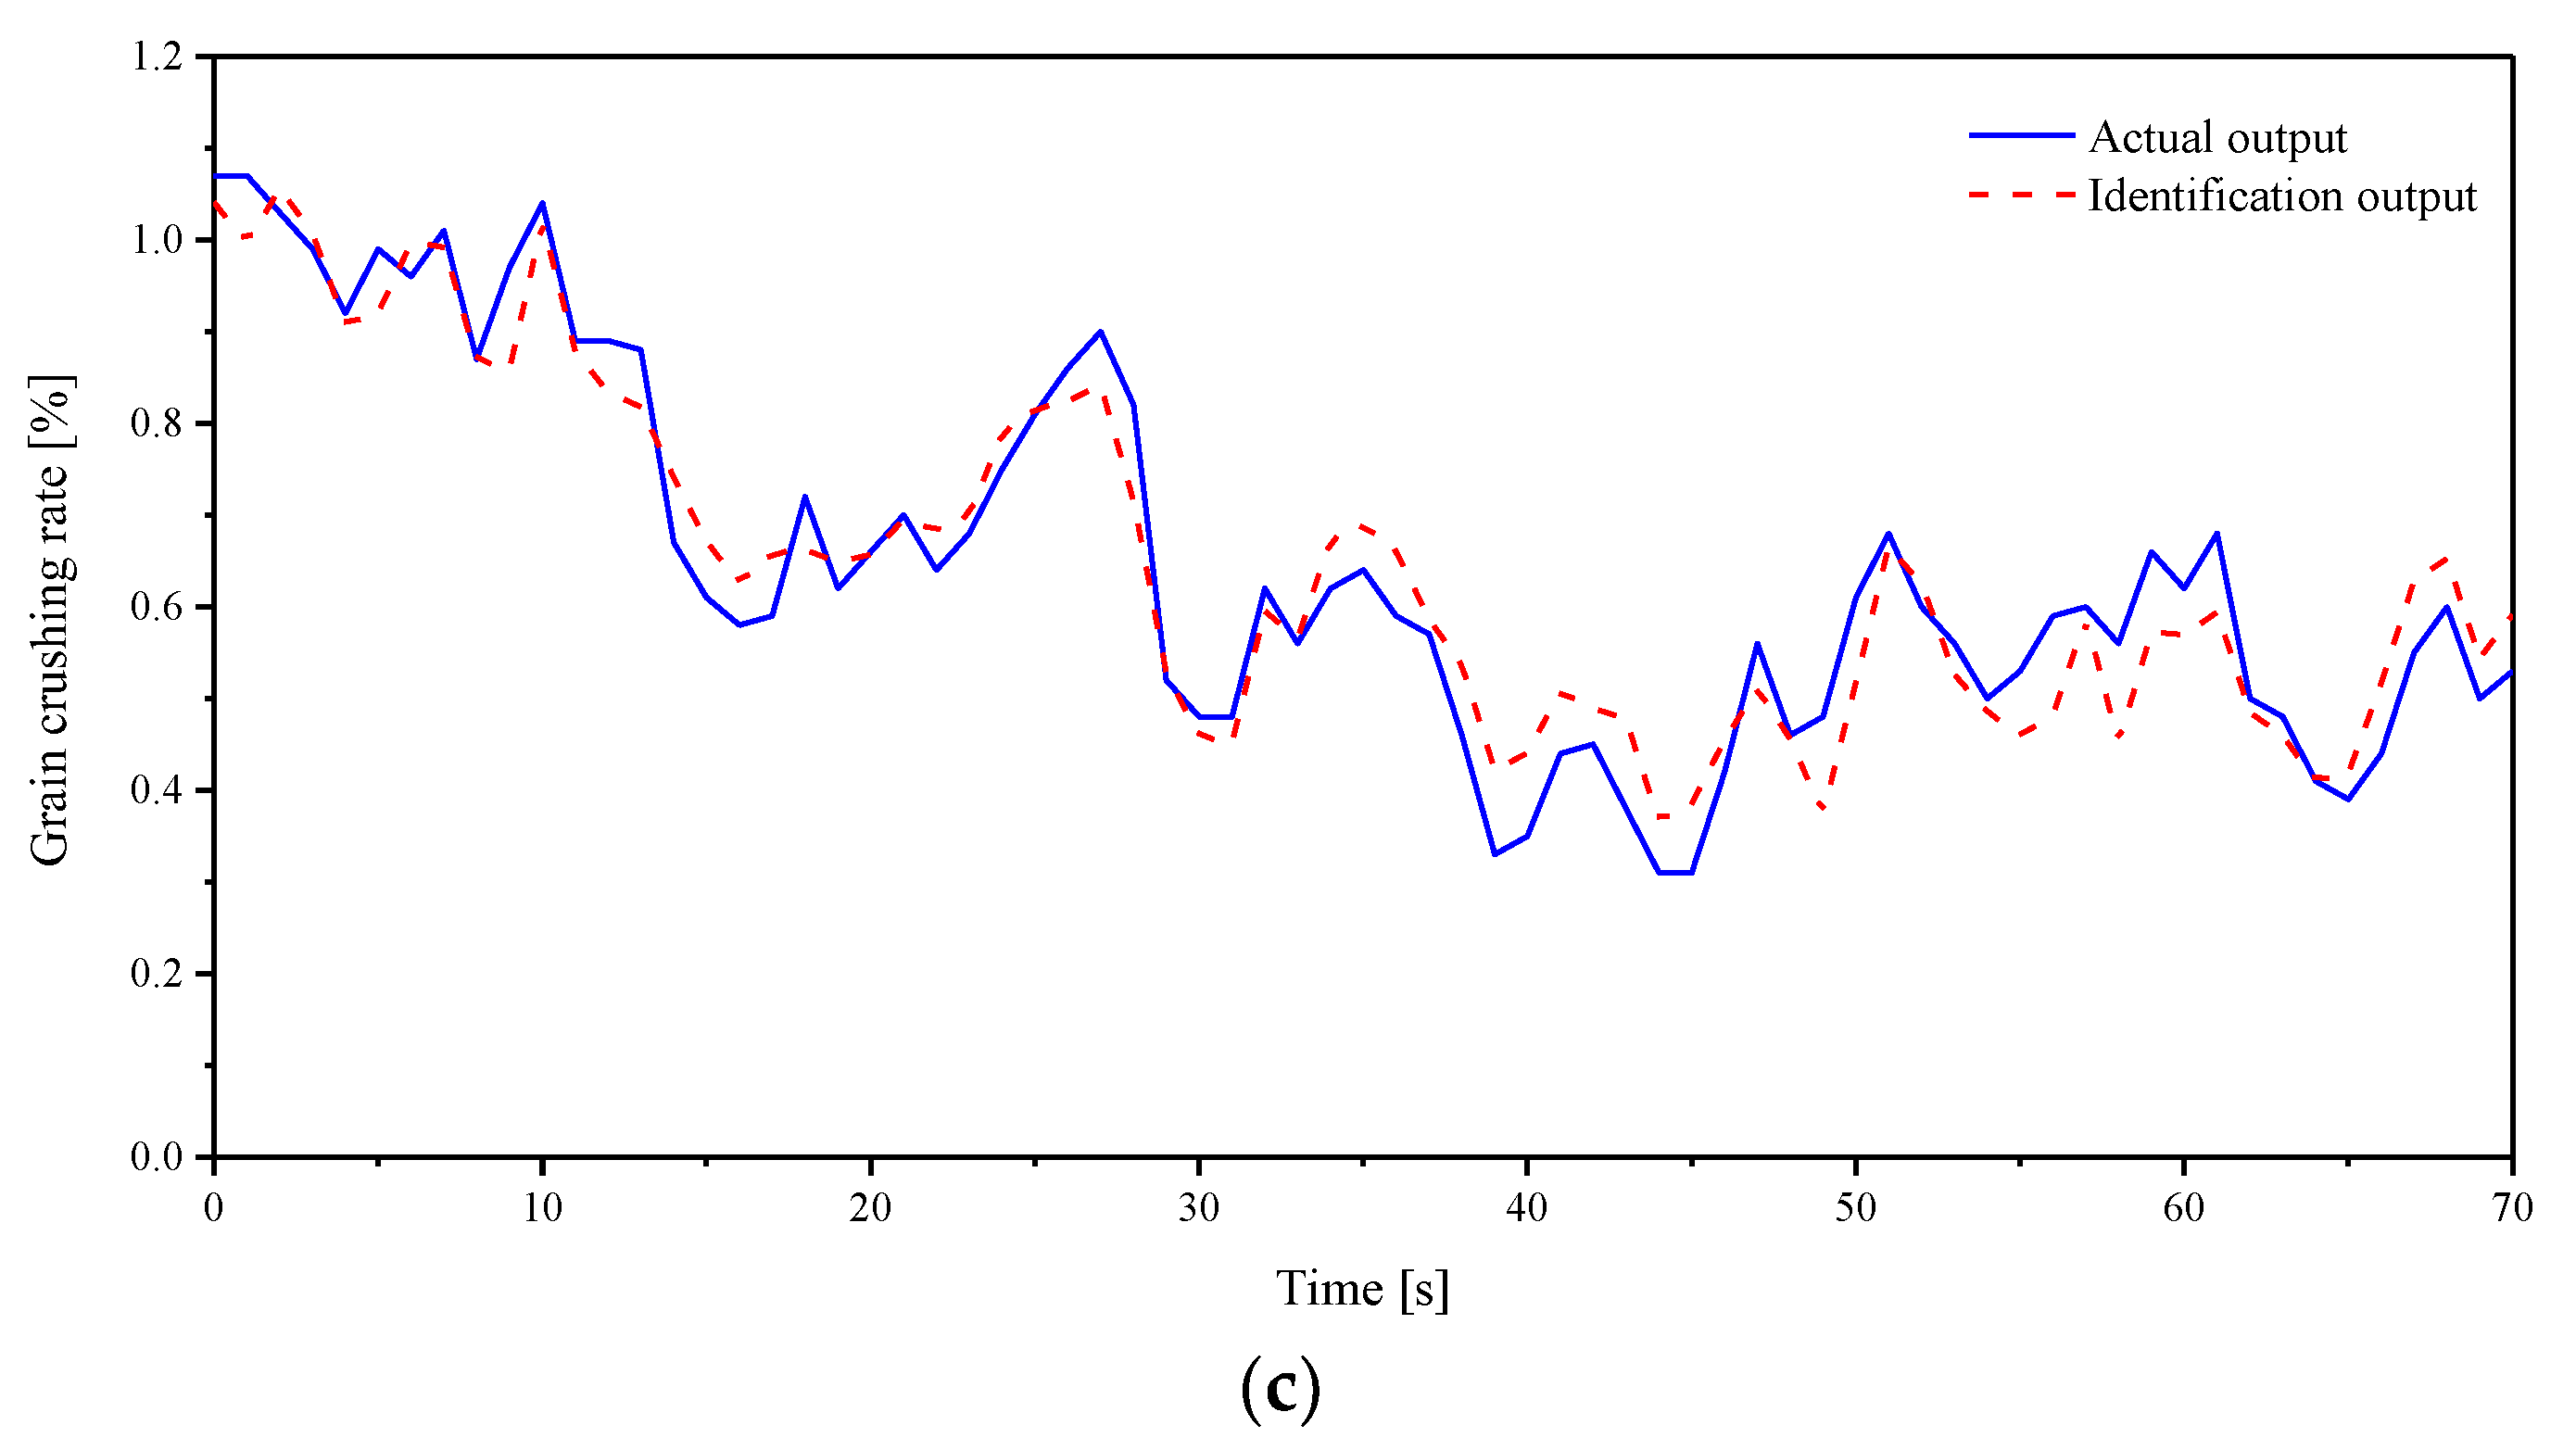
3.1. System Identification Results

According to the PSO-WNN optimization algorithm steps in the previous section, the identification algorithm file was written in M language in MATLAB software. The state-space model was set as the basic structure of the training model. The input data were set as the PBRS signals of screen opening, airflow inlet area, and threshing gap (in Section 2.3.1). The output data were set as the collected signals of grain cleaning entrainment loss rate, grain impurity rate, and grain-crushing rate (in Section 2.3.2). The identification calculation process and output results were carried out and exported in the MATLAB software environment at the PC, and the running time of a single identification calculation was less than or equal to 8 s. To better test the identification performance of the PSO-WNN, the root mean square error (RMSE) was used to measure the discreteness of the error at each sampling point of the model, and the signal variance accounted for (VAF) was used to measure the degree that the model was close to the actual system, as follows:
R M S E = 1 N i = 1 N ( y t r u e , i y m o d e l , i ) 2
V A F = [ 1 var ( y t r u e y m o d e l ) var ( y t r u e ) ] × 100 %
where, N was the number of data sampling points; y t r u e , i was the actual output value of the system; y m o d e l , i was the identification output value; var ( ) represented variance. The smaller the value of RMSE, the smaller the error fluctuation between the identified model and the actual model. The larger the value of VAF, the closer the identified model was to the actual system.
After the system identification of the state-space model based on the fusion of the PSO algorithm and WNN, the output results are shown in Figure 13 and Table 1:
At the same time, each constant matrix in the optimal state-space model was obtained as follows:
A = [ 0.027   0.376   0.064   0.493   0.284   0.082 0.656   1.083   0.480   1.862   0.597   0.179 0.060   0.404   0.119   0.639   0.375   0.106 0.137   0.243   0.192   0.832   0.051   0.104 0.233   0.516   0.038   2.223   0.376   1.067 0.358   1.361   0.845   1.378   0.903   0.525 ] ;   B u = [ 0.026   0.001   0.005 0.180   0.008   0.016 0.011   0.001   0.000 0.004   0.003   0.011 0.148   0.010   0.011 0.119   0.005   0.041 ] ; B d = [ 0.153   0.016   0.160 0.021   0.767   1.471 0.029   0.085   0.175 0.009   0.052   0.704 0.169   0.367   0.682 0.074   0.488   0.002 ] ;   C c = [ 0.501   1.695   1.411   2.121   0.378   2.479 0.401   0.694   0.894   1.284   0.204   2.040 0.629   0.161   0.553   0.053   0.411   0.009 ] ;   D = [ 0   0   0 0   0   0 0   0   0 ]
It could be seen from Figure 13 that the state-space model identification output curves were similar to the actual output curves, and the VAF values in Table 1 also verify this, which were 88.6%, 88.7%, and 92.1%, respectively. All of them were above 88.0%; that is, the identification model was in good agreement with the actual model. In addition, it could be seen from Table 1 that the RMSE values of the state-space model identification output were all less than 0.5. It showed that the identification method could well control the error fluctuations between each sampling point of the identification model and the corresponding sampling point of the actual model output.

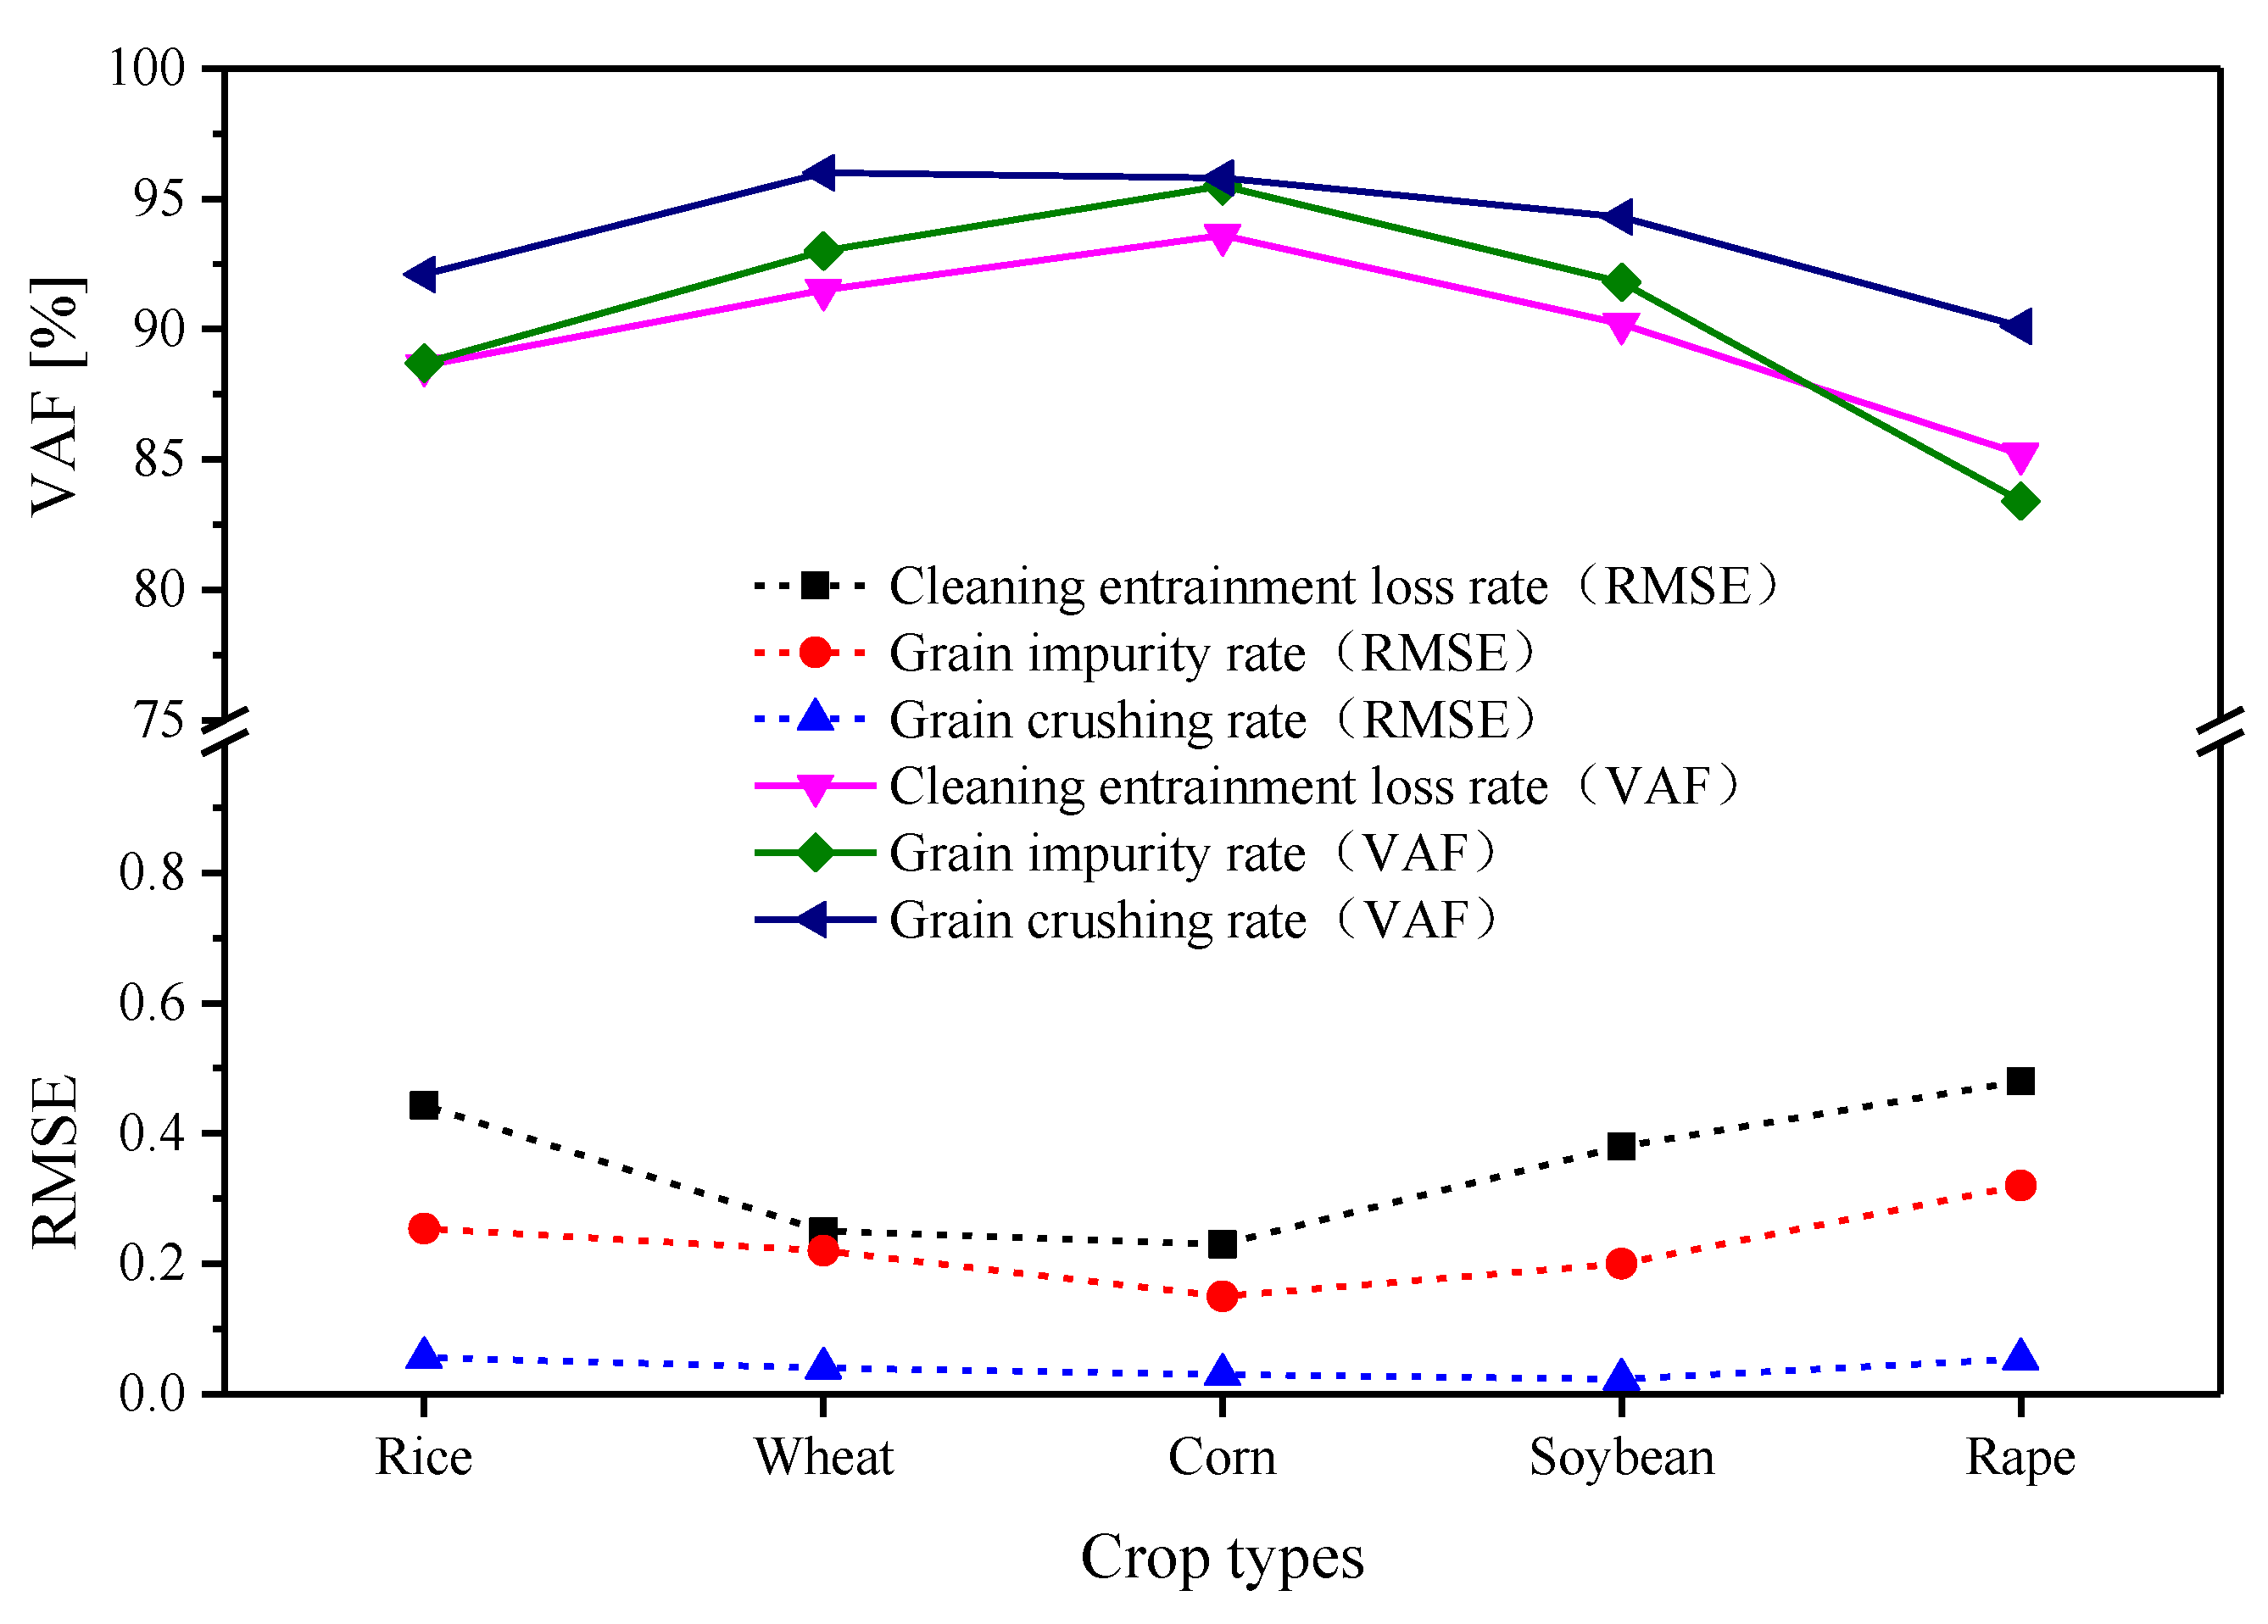
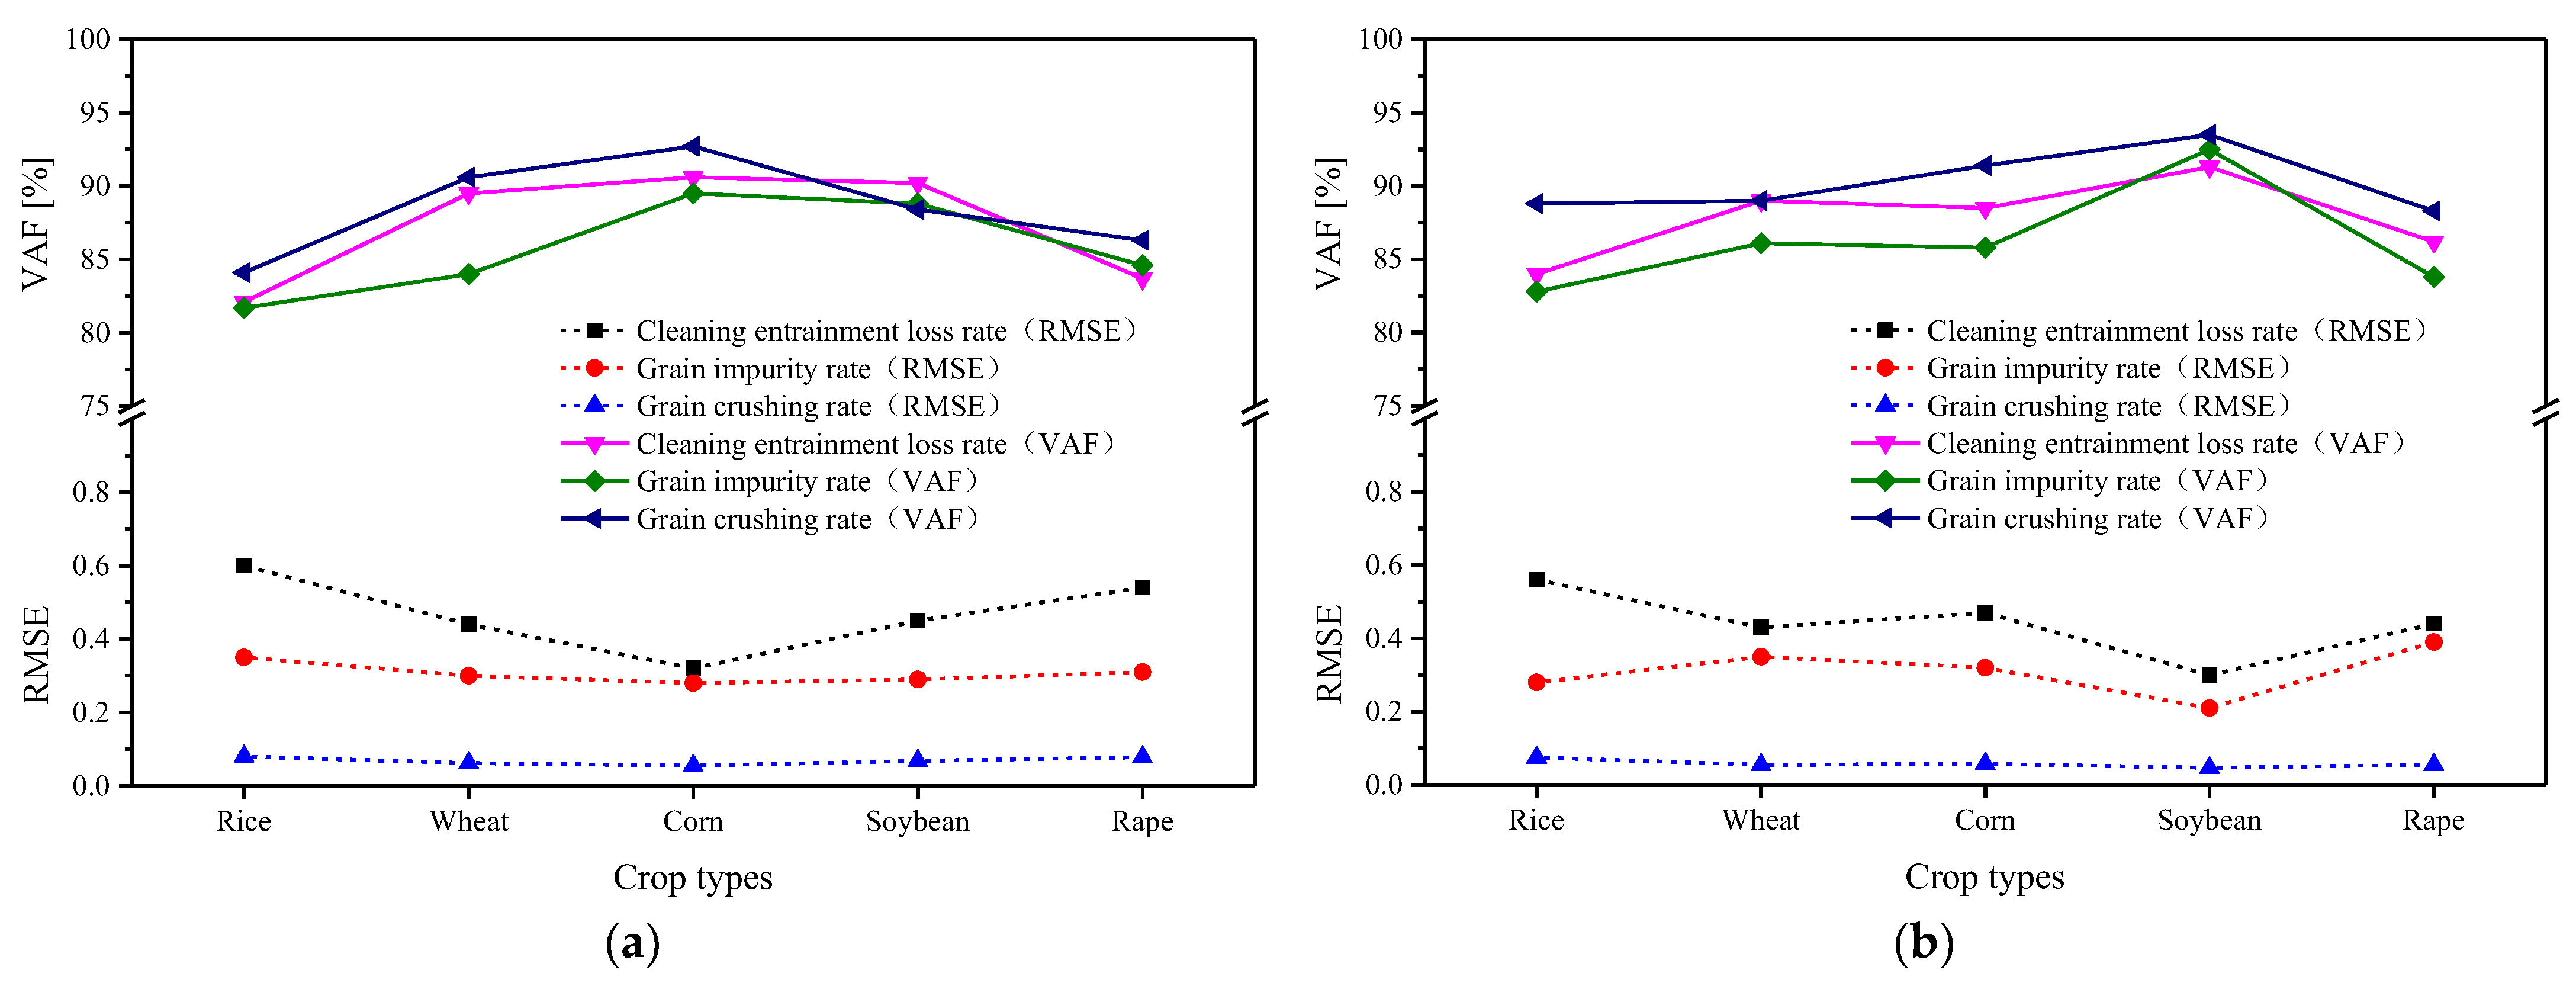
3.2. Verification Results of System Identification Model

To further test the accuracy and adaptability of the identification method in the modeling of the threshing and cleaning system of the combine harvester, many model validation tests were required. Firstly, the random number generator was used to select the values of each amplitude of the screen opening, airflow inlet area, and threshing gap in Figure 10, and it was repeated twice, that was, two groups of PRBS with amplitude modulation different from the previous text were obtained as the input signals of identification model verification. Then, based on these two sets of input data, the output data were collected in the rice test field according to the output signal acquisition process in Section 2.3.2. Finally, the two sets of input data were substituted into the identified optimal state space model through the MATLAB identification toolbox to obtain two sets of model outputs and then compared with the previously collected output data to calculate their RMSE values and VAF values.
This method was also used to verify the identification models of the threshing and cleaning devices of wheat, corn, soybean, and rape, except rice at harvests. Tests were conducted on farms in various regions of Jiangsu Province in 2021. Each test result also included a set of RMSE and VAF values between the model identification output and the actual output, as well as two sets of RMSE and VAF values between the model verification output and the actual output. The identification results and verification results of the threshing and cleaning system models for five crops are shown in Figure 14 and Figure 15.
It could be seen from Figure 14 that under different crop harvesting environments, the VAF values between the identification output and the actual output of the threshing and cleaning system were greater than or equal to 83.4%, and the RMSE values were less than or equal to 0.481, indicating that the method of identifying the threshing and cleaning state space model based on PSO-WNN had good adaptability to a variety of crops or harvested fields, and the identified models were relatively close to the actual systems. The VAF values of the system identification model verification results in Figure 15a,b were greater than or equal to 81.7%, and the RMSE values were less than or equal to 0.602, which further verified that the effect of this method for identifying the threshing and cleaning system model was relatively stable.
From the comparisons between Figure 14 and Figure 15a,b, it could be seen that in the same crop harvesting environment, the RMSE values between the two groups of model verification output and actual output were generally greater than the RMSE values between the model identification output and actual output, with the maximum difference of 0.247, while the VAF values were on the contrary, with the maximum difference of 9.1%, indicating that the accuracy of the model verification results compared with the initial identification results was reduced. This was because the input signals used in the model verification process were not completely consistent with that in the initial identification. Moreover, the planting density, growth potential, stubble height, and other factors of crops in the same field will fluctuate, resulting in the identified threshing and cleaning system model could not fully adapt to the input and output data during model verification. However, its accuracy could still represent the state of threshing and cleaning systems in this field.

4. Conclusions

Based on the results of the above study, the following main conclusions could be drawn:
  • The multi-parameter control system of threshing and cleaning devices in a combine harvester was taken as the research object, in which the cleaning entrainment loss rate, the grain impurity rate, and the grain-crushing rate were taken as the output parameters, and the screen opening, the airflow inlet area of fan and the threshing gap were taken as the input parameters. The real-time acquisition or adjustment method of each parameter was developed. Among them, the monitoring accuracy of loss was greater than 92.0%; The monitoring accuracy of impurity rate was greater than 94.2%; The monitoring accuracy of crushing rate was greater than 92.7%. Their monitoring accuracy and stability could meet the needs of the control system.
  • In order to obtain the training data required for system identification, the PRBS input signals with amplitude modulation were designed as the inputs, and the output signals acquisition test was carried out in the field. Then, a fusion method of PSO and WNN was proposed to identify the system based on the state-space model. It was concluded that the identified system model was highly similar to the actual model. The VAF values between the two model outputs were greater than 88.0%. Moreover, the higher identification accuracy was proved by several groups of model verification tests. The VAF values of different crop system identification model verification results were greater than or equal to 81.7%, and the RMSE values were less than or equal to 0.602. In conclusion, this method laid a good model foundation for realizing the coordinated control of multi-parameter of threshing and cleaning.

Author Contributions

In the research of this article, Y.L. mainly completed the writing and experimental part of the paper. L.X. and L.L. provided the guidance of scientific research funds and experimental scheme. Y.S. and X.Y. assisted me in completing the experimental research. All authors have read and agreed to the published version of the manuscript.

Funding

This research was funded by [National Natural Science Foundation of China], grant number [51875260]; [Six Talent Peaks Project in Jiangsu Province], grant number [TD-GDZB-005]; [Postgraduate Research and Practice Innovation Program of Jiangsu Province], grant number [KYCX20_3035]. And, the APC was funded by [51875260].

Institutional Review Board Statement

Not applicable.

Informed Consent Statement

Not applicable.

Data Availability Statement

Not applicable.

Conflicts of Interest

We ensured that there was no conflict of interest.

References

  1. Qipeng, H. Empirical Study on Farmers’ Rice Harvest Losses and Influencing Factors; Jiangnan University: Wuxi, China, 2017. [Google Scholar]
  2. Zuo, Q.; Cao, S.; Yang, S.; Huang, H.; Liao, Q.; Leng, S.; Wu, J.; Zhou, G. Effects of nitrogen fertilizer and planting density on yield loss percentage of mechanical harvesting in rapeseed. Acta Agron. Sin. 2014, 40, 1109–1116. [Google Scholar] [CrossRef]
  3. Craessaerts, G.; Saeys, W.; Missotten, B.; De Baerdemaeker, J. Identification of the cleaning process on combine harvesters. Part I: A fuzzy model for prediction of the material other than grain (MOG) content in the grain bin. Biosyst. Eng. 2008, 101, 42–49. [Google Scholar] [CrossRef]
  4. Craessaerts, G.; de Baerdemaeker, J.; Missotten, B.; Saeys, W. Fuzzy control of the cleaning process on a combine harvester. Biosyst. Eng. 2010, 106, 103–111. [Google Scholar] [CrossRef]
  5. Alan, R.B.; Bernard, D.R. Constant Pressure Concave Assembly in a Combine Harvester Processing System. U.S. Patent 9220200B2, 29 December 2015. [Google Scholar]
  6. Chai, X.; Xu, L.; Li, Y.; Qiu, J.; Li, Y.; Lv, L.; Zhu, Y. Development and experimental analysis of a fuzzy grey control system on rapeseed cleaning loss. Electronics 2020, 9, 1764. [Google Scholar] [CrossRef]
  7. Ning, X.; Chen, J.; Li, Y.; Wang, K.; Wang, Y.; Wang, X. Kinetic model of combine harvester threshing system and simulation and experiment of speed control. Trans. Chin. Soc. Agric. Eng. 2015, 31, 25–34. [Google Scholar]
  8. Yawei, Z. Mechanisms and Control Strategies Research on Threshing and Separating Quality of Combine Harvester; China Agricultural University: Beijing, China, 2018. [Google Scholar]
  9. Wei, L. Research on the Cleaning System of Intelligent Combine Harvester Based on Unmanned Aerial Vehicle Image; University of Science and Technology of China: Hefei, China, 2019. [Google Scholar]
  10. Yi, L. Study on Adaptive Control System of Operating Parameters for Threshing Device of Rice Wheat Combine Harvester; Jiangsu University: Zhenjiang, China, 2020. [Google Scholar]
  11. Xinyuan, H. Operation and Combustion Adjustment of Utility Boiler; China Electric Power Press: Beijing, China, 2007. [Google Scholar]
  12. Liang, Z.; Li, Y.; Xu, L.; Zhao, Z. Sensor for monitoring rice grain sieve losses in combine harvesters. Biosyst. Eng. 2016, 147, 51–66. [Google Scholar] [CrossRef]
  13. Jie, Q. Development and Experiment of Adaptive Control System for Rapeseed Seed Cleaning Loss; Jiangsu University: Zhenjiang, China, 2020. [Google Scholar]
  14. Zhenwei, L. Study on Designing Method of Multi-Duct Air-and-Screen Cleaning Unit and Grain Sieve Loss Monitoring and Controlling Technology; Jiangsu University: Zhenjiang, China, 2018. [Google Scholar]
  15. Yingfeng, W. Design and Experimental Study on Grain Flow Monitoring System of Rice Wheat Oil Combine Harvester; Jiangsu University: Zhenjiang, China, 2022. [Google Scholar]
  16. Qibing, C. On-line Monitoring Method and Experimental Study on Impurity and Broken Rate of Rice, Wheat and Rapeseed; Jiangsu University: Zhenjiang, China, 2022. [Google Scholar]
  17. Doyle, F.J.; Pearson, R.K.; Ogunnaike, B.A. Identification and Control Using Volterra Models; Springer: London, UK, 2002. [Google Scholar]
  18. Wang, S.; Feng, N.; Li, A. A BP networks learning algorithm based on PSO. Comput. Appl. Softw. 2003, 6, 74–76. [Google Scholar]
  19. Diwei, Y.; Shaohua, L.; Yuantong, S. Wavelet neural network learning algorithm based on particle swarm optimization. Chin. J. Eng. Geophys. 2007, 4, 529–532. [Google Scholar]
  20. Hou, R.M.; Liu, R.Z.; Gao, Q.; Wang, L. Application of particle swarm optimization wavelet neural network on AC servo system. J. Syst. Simul. 2014, 26, 881–885, 896. [Google Scholar]
  21. Alfi, A. PSO with adaptive mutation and inertia weight and its application in parameter estimation of dynamic systems. Acta Autom. Sin. 2011, 37, 541–549. [Google Scholar] [CrossRef]
Figure 1. Threshing and cleaning multi-parameter system.
Agriculture 12 01483 g001
Figure 2. Structure diagram of loss monitoring sensors. (a) Cleaning loss sensor; (b) Entrainment loss sensor.
Agriculture 12 01483 g002
Figure 3. Installation diagram of loss monitoring sensors. (a) Cleaning loss sensor; (b) Entrainment loss sensor.
Agriculture 12 01483 g003
Figure 4. Schematic diagram of signal processing system.
Agriculture 12 01483 g004
Figure 5. Installation diagram of grain impurity rate and crushing rate monitoring sensor.
Agriculture 12 01483 g005
Figure 6. Image processing results of various crops (rice, wheat, rape, corn and soybean).
Agriculture 12 01483 g006
Figure 7. Structure and installation diagrams of electric adjusting device for screen opening. (a) Structure diagram; (b) Installation diagram.
Agriculture 12 01483 g007
Figure 8. Structure and installation diagrams of electric adjusting device for airflow inlet area. (a) Structure diagram; (b) Installation diagram.
Agriculture 12 01483 g008
Figure 9. Structure and installation diagrams of electric adjusting device for threshing gap. (a) Structure diagram; (b) Installation diagram.
Agriculture 12 01483 g009
Figure 10. Schematic diagrams of amplitude modulated PRBS input signals. (a) Screen opening input signal; (b) Airflow inlet area input signal; (c) Threshing gap input signal.
Agriculture 12 01483 g010aAgriculture 12 01483 g010b
Figure 11. Schematic diagram of output signal acquisition.
Agriculture 12 01483 g011
Figure 12. Schematic diagrams of collected output signals. (a) Cleaning entrainment loss rate output signal; (b) Grain impurity rate output signal; (c) Grain crushing rate output signal.
Agriculture 12 01483 g012
Figure 13. Schematic diagrams of comparisons between identification outputs and actual outputs. (a) Cleaning entrainment loss rate; (b) Grain impurity rate; (c) Grain crushing rate.
Agriculture 12 01483 g013aAgriculture 12 01483 g013b
Figure 14. Identification results of threshing and cleaning system for various crops.
Agriculture 12 01483 g014
Figure 15. Verification of identification results of threshing and cleaning system for various crops. (a) Verification result I; (b) Verification result II.
Agriculture 12 01483 g015
Table 1. Identification results of state-space model.
Model OutputRMSEVAF
Grain cleaning entrainment loss rate0.44388.6%
Grain impurity rate0.25488.7%
Grain-crushing rate0.05692.1%
Publisher’s Note: MDPI stays neutral with regard to jurisdictional claims in published maps and institutional affiliations.

