1. Introduction
Tobacco budworm,
Chloridea virescens (formerly
Heliothis virescens), and bollworm,
Helicoverpa zea (Lepidoptera: Noctuidae), are economically important agricultural pests in the United States [
1,
2]. In the southeastern US, bollworm and tobacco budworm are responsible for a large portion of the annual insect pest damage to cotton when these insects are not controlled [
1,
2]. The larvae feed on a wide variety of different agricultural products including cotton, corn, tomato, tobacco, soybean, wheat, and even plants in home gardens [
1,
2,
3]. In cotton, they are controlled using transgenic plants expressing insecticidal Cry proteins from the bacterium
Bacillus thuringiensis (Bt) augmented with foliar chemical insecticide sprays as needed. Unfortunately, resistance to Cry proteins has become widespread and is increasing [
4,
5,
6,
7].
H. zea requires a higher dose of the commercialized Bt Cry proteins compared to
C. virescens for mortality [
7,
8]. When
H. zea eggs are found on Bt cotton, foliar chemical sprays are needed in addition to the Bt protein toxins produced by the plant [
8,
9], increasing the overall economic and environmental cost for their control.
The first step in the pest management of the US bollworm–tobacco budworm complex in cotton is the identification of the pest; this allows for the application of the appropriate management technique for that particular insect [
10,
11,
12]. Prior to Bt Cry protein resistance in
H. zea, the economic threshold (the point at which a grower would apply insecticide chemical sprays) for bollworm in cotton was based on either the presence of live larvae or damaged plant reproductive tissue [
11,
13]. However, once
H. zea evolved Bt resistance, these thresholds produced unacceptable injury levels. As a result, egg-based thresholds were adopted to determine when to spray [
13]. Unlike
H. zea,
C. virescens is well controlled by Bt cotton, and foliar insecticide treatments are not needed [
14].
Unfortunately, the eggs of
C. virescens and
H. zea are almost identical in color, size, and shape, with only small differences in the surface structure of the egg [
15]. Typically, egg identification requires a high-quality, high-magnification, bright-field microscope and someone with expert training to identify the presence or absence of minor cuticular ridges on the egg surface. This method is not practical when managing everyday pest populations where high numbers of samples from different fields over large geographical areas are collected, and where rapid decisions are needed regarding insecticide applications. Today, you can buy a lens system such as the Foldscope [
16], or a lens attachment coupled to a high-quality camera sensor on a smartphone, and by using the phone’s computational and net-working power you could potentially obtain a rapid egg identification.
Deep learning is increasingly being used in the biological sciences to solve challenges such as this. Repetitive image classifications can be obtained by applying convolutional neural networks (CNNs) [
17,
18,
19] to digital images. Initial traction for this technique spawned from the successful uses of AlexNet to accurately identify thousands of different images of one thousand different classes including animals, plants, and common objects [
20], and later ResNet to improve the feasible depth of neural architectures [
21]. Insect identification using neural networks has been described before for insect stages where major differences in color and morphology can be found, e.g., in butterflies, caterpillars, beetles, bees, mantids, and cicadas [
22,
23,
24]. Imaging and the traditional analysis of insect eggs is significantly more challenging because of their small size, minute differences in their size or color between species in some cases, and in general lack of easily distinguishable features. To our knowledge insect egg identification using CNNs has never been investigated.
The objective of this study was to build a dataset of images of
C. virescens and
H. zea eggs using a Multi-Camera Array Microscope (MCAM™) [
25], and then with these data develop a machine learning methodology to rapidly differentiate between species. The subtle and difficult morphological differences between the two species makes this a prime test case to determine the usefulness and efficiency of machine learning for species identification of insect eggs. Benefits of this technique include rapid, unbiased, reproducible analysis, low cost, high-throughput, and in the case of pest control, a route to improve sustainability of insect management. This paper examines the proof of concept for this approach.
2. Materials and Methods
2.1. Moth Rearing and Egg Harvesting
Bollworm,
Helicoverpa zea (Lepidoptera: Noctuidae), and tobacco budworm,
Chloridea virescens (Lepidoptera: Noctuidae), pupae (50 of each species; sex ratio of each species approximately 50:50) were purchased from Benzon Inc. (Carlisle, PA, USA). Pupae were allowed to emerge in separate 4.5 L plastic containers (ovipositional chambers) with the open top end of the container covered with cloth. The black textile cloth cover was an ultra-fine synthetic knit of 80% polyamide of 20 denier count and 20% elastane of 15 denier count with a weight of 82 g/m
2. Its pattern was a jersey plated knit structure of 78 wales and 104 courses per 2.54 cm (Case 1, T2, [
26]). The pore diameter of the textile was reduced using a 1 m-wide, laboratory oil-heated, Stork laminator (Stork GmbH, Bavaria, Germany) to heat set the fabric in the Dyeing and Finishing Pilot Plant at NC State University. The temperature was 190 °C (lower than the Tg of the polyamide) with a 120 s duration, producing a final pore size ranging from 10 µm to 16 µm with a thickness of 0.26 mm. The cloth was held in place over the opening of the plastic 4.5 L containers using a rubber band stretched over the cloth and the outside of the container. Each container was provisioned with a paper towel folded to stand upright from the bottom to about 4 cm above the top of a 30 mL plastic cup that was fixed to the bottom of the ovipositional chamber with double stick tape (two feeding stations per ovipositional chamber). One of the feeding stations in each ovipositional chamber was filled to wick saturation and to the top of the 30 mL cup with glass-distilled water, and the other feeding station with a 50:50 (volume:volume) mixture of raw, unfiltered honey (Food Lion, Salisbury, NC, USA) in glass-distilled water. Each day, water and the 50:50 honey:water mixture was added to maintain the level of liquid to the top edge of the 30 mL cup. The pupae were placed on the inside floor of the 4.5 L plastic container.
The ovipositional chambers were incubated at 27 °C and 60% relative humidity with a 16:8 Light:Dark cycle. The side of the ovipositional chamber and the cloth top reduced but did not block light exposure to the pupae, moths, or eggs. Eggs laid on the black cloth were collected each morning 1–2 h after the beginning of the photophase. The ovipositional chambers were placed in a refrigerator at 7 °C for 30 min to immobilize the moths to prevent them from flying from the chamber during the removal and replacement of new black cloth. The eggs and cloth were immediately placed in separate, 4.5 L zip lock bags (S.C. Johnson and Son, Inc., Racine, WI, USA) for each species, placed on ice and immediately transported to Ramona Optics, Durham, NC, USA and imaged with the MCAM™. The ovipositional chamber, cloth, and zip lock bags were labeled with the moth species to prevent cross-contamination, and eggs were imaged each day for three days during the moth’s peak ovipositional period. Eggs were imaged within 2 h after their removal from the ovipositional chamber and not reused.
2.2. Preliminary Photography
Preliminary photographs (
Figure 1) were taken of
H. zea and
C. virescens eggs to confirm the insect species and provide the first photographic, published, digital validation of the differences in egg morphology between species described by Neunzig [
15]. The images were taken with a Canon 60D DSLR camera (Canon Inc., Tokyo, Japan) equipped with a 20× microscope objective attached to the camera using extension tubes. The camera was mounted to a Cognisys Stackshot Macro Rail (Cognisys Inc., Traverse City, MI, USA) for automated z-stacking of the eggs. Forty-five image layers were taken of each egg and processed into a single image using Zerene Stacker software (Zerene Systems LLC, Richland, WA, USA) (
http://zerenesystems.com/cms/stacker, accessed on 23 November 2020). Eggs used for these photographs were stored at −40 °C until just prior to the photography and only used for this set of imaging experiments. Different backgrounds of black plastic and white plastic were used for these preliminary photos. The
C. virescens eggs were frozen for a longer amount of time than the
H. zea eggs, which caused differences in shape and coloration but did not affect the morphological characters used for species identification.
2.3. Image Data Construction
On three consecutive days, newly-laid eggs were imaged on the black cloth described earlier using a MCAM™ Kestrel (Ramona Optics, Durham, NC, USA). This system has 24 camera sensors each with a field-of-view of 9 mm capturing 3072 × 3072 pixel, three channel images, resulting in a pixel resolution of 2.93 µm/pixel. The red color channel of each image was selected, and its data were copied to the other two channels. Pixel values were zero-centered and normalized to one, transforming the range of pixel values from [0, 255] to [−1.0, 1.0]. The resulting image was used as the input for subsequent image analysis procedures. On each day, the black cloth with eggs of each species was cut into four pieces of approximately 8 × 8 cm. Each acquisition from the MCAM™ Kestrel acquires approximately 240 MP of image data. During the image capture procedure, each piece is moved in 3 dimensions (laterally in X and Y, and axially in Z) to ensure that an in-focus image of each egg is acquired. Image acquisitions of the eggs were captured for each section under two different lighting conditions using reflection-based LED panels set to color temperature 4600 K and 5700 K. Images from three of the quadrants were designated at random for creation of the training and validation sets, and the remaining quadrant was used as a test set for species diagnosis. Approximately 3 TB of imaging data of the two species were collected over 3 days.
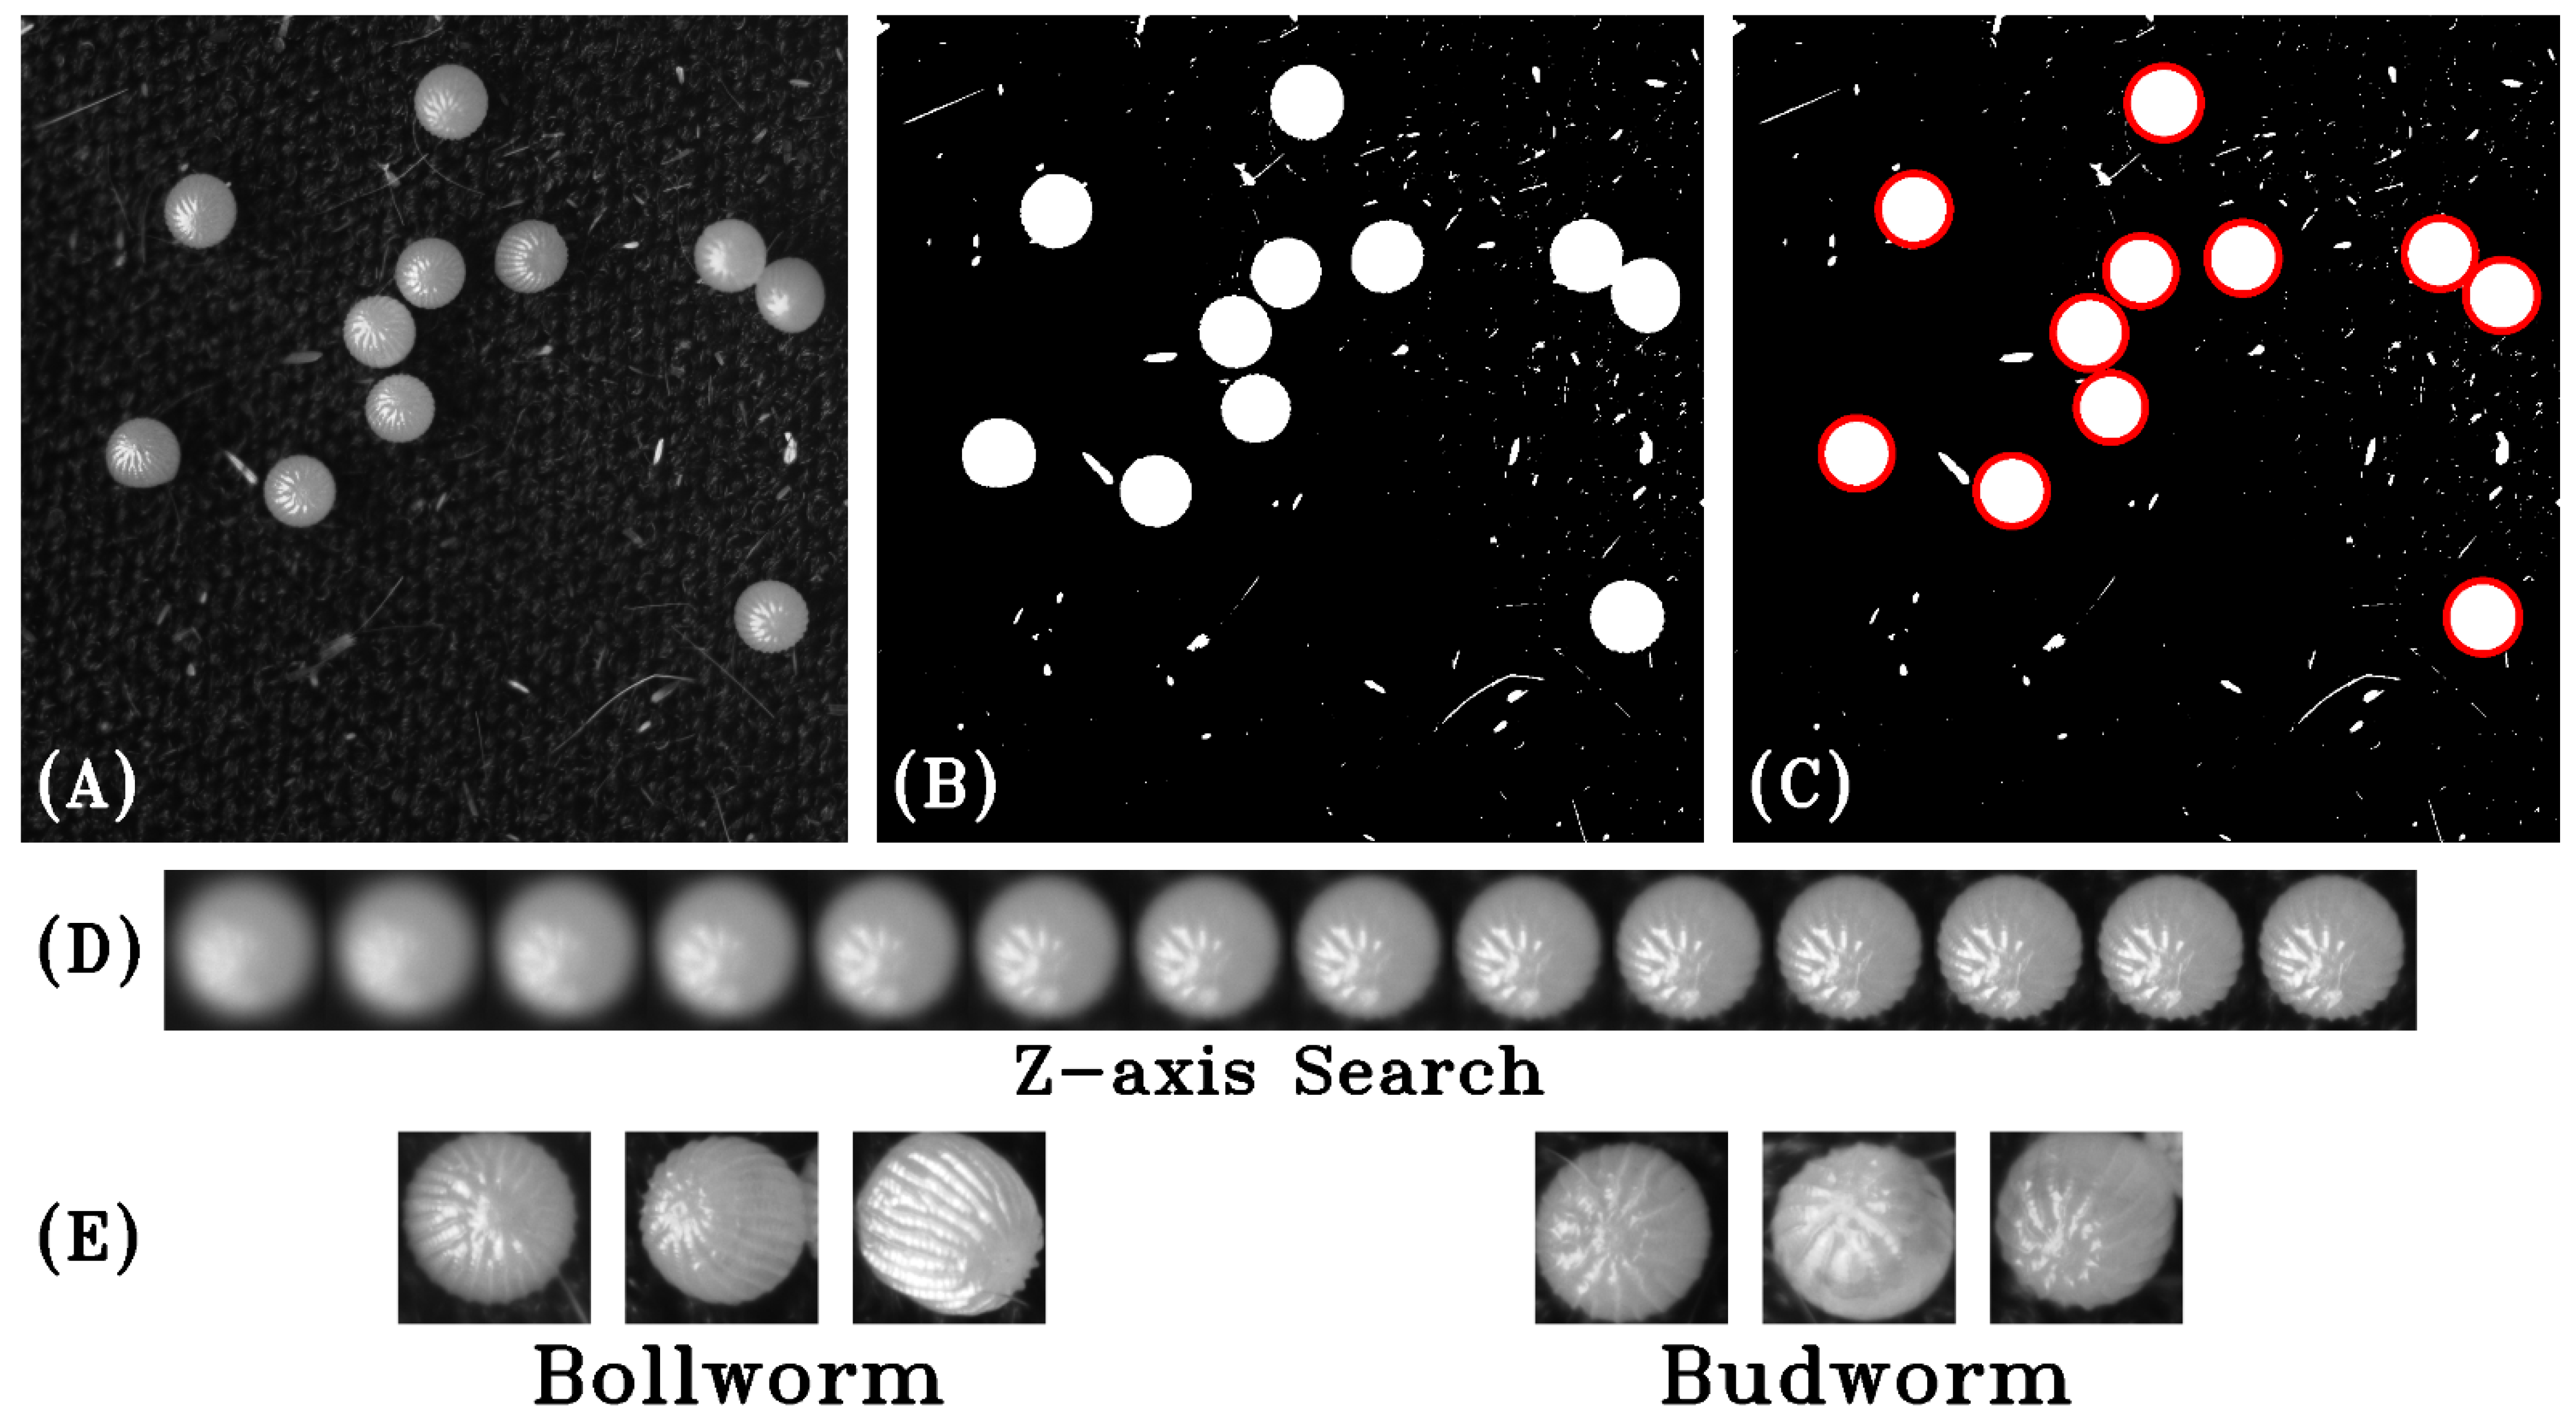
To identify the eggs within the acquired images, a short preprocessing algorithm was developed to search the overall three-dimensional data space for in-focus images of caterpillar eggs using a standard pixel intensity threshold, a circle detection algorithm, and a measurement of pixel variance within regions of interest (
Figure 2). The pixel intensity threshold created a binary mask highlighting regions with high probability of finding an egg. Pixel intensity values below the defined threshold became zero (black) and pixel intensities above the threshold became 255 (white). Next, a Hough circle detection algorithm was used to find the edges in the image with high gradients defining the circular edge of the egg and returning the centroid and radius of each detection as a (x, y, sigma) tuple [
27]. Sigma in this case defines the Gaussian distribution of the blurring filter used during circle detection and, as such, can be used to gauge the radius of the circles. Once a candidate for a caterpillar egg was located, a Laplacian transform was applied to the original image to determine pixel variance of the encompassed region throughout the
Z-axis of the image stack to locate the most in-focus image, which was then saved as a Portable Network Graphic (.png) image, a lossless image format. Training and test images were processed separately to ensure the impossibility of cross-contamination between datasets. Images were organized into two folders representing the two different species classifications of
H. zea and
C. virescens. Finally, the datasets were reviewed and cleaned, removing any images that did not contain an egg that were mistakenly extracted. Out-of-focus images were retained unless no morphological features were distinguishable.
2.4. Neural Network Architecture
The image data were analyzed using a multi-layered convolutional neural network (
Figure 3). Layers were assembled to first accept a 224 × 224 × 3 image into the first convolution layer. Each of the five convolution blocks consisted of a convolution layer using the well described Rectified Linear Unit (ReLU), non-linear activation function [
28] followed by a max pooling layer that down sampled the tensor output by a factor of two along each dimension using a 2 × 2 max pooling kernel (stride = 2). Prior to convolution, images were automatically padded using the “same” method, which extends image borders using the pixel values that exist at these borders so that the convolution operation does not degrade the shape of images. Each block in the series used an increasing number of 3 × 3 convolution filters beginning with 32 and multiplied by a factor of two for each additional block. Through these five convolution blocks, learned pixel-wise features were extracted. One dropout layer following the convolution blocks randomly excluded 40% of the output connections to reduce over-fitting [
28]. The resulting output was then flattened to a one-dimensional vector and classified by a densely connected layer with two output classes, one each for the two species. Softmax activation was used for the final binary output. Adam [
29] was used for gradient optimization with a learning rate of 1E-4, and categorical cross-entropy was used as the loss function [
30]. The Keras (v2.8.0,
https://keras.io/, accessed on 4 June 2022) and Tensorflow Python packages (v2.8.0,
https://www.tensorflow.org/, accessed on 4 June 2022) were used for this implementation and their built-in augmentation methods utilized to add random augmentations to the training and validation datasets to increase the effective quantity of training samples and add further realistic variability. Dataset augmentations included rotations of the input images by up to 20 degrees, vertical and horizontal translations by up to 10% of the respective dimension’s length, and horizontal and vertical flips of the image.
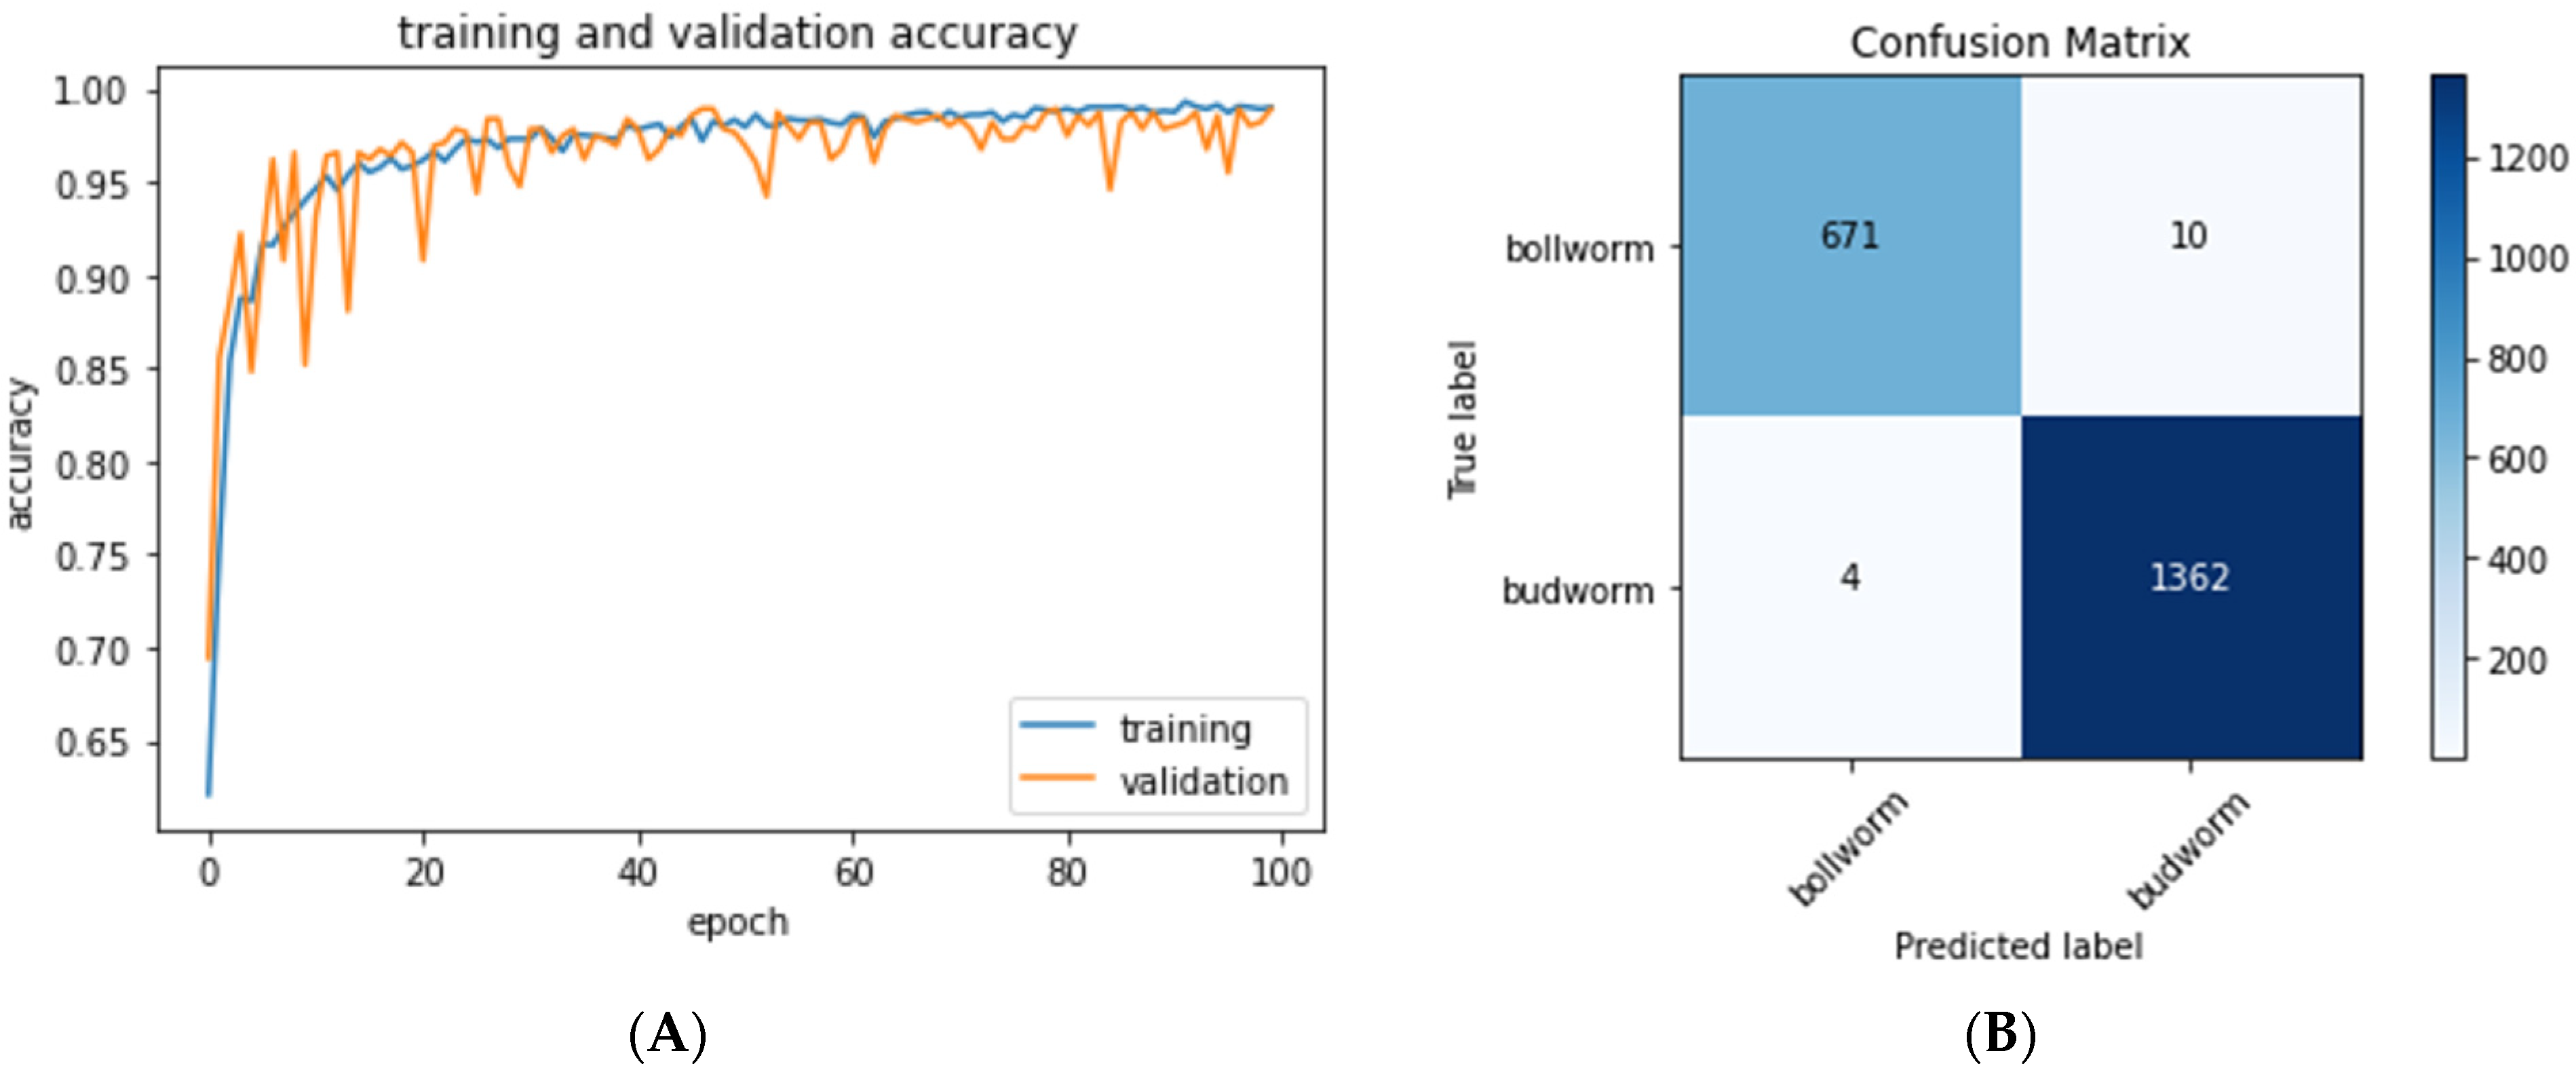
The neural network was trained for 100 epochs (40 min with a NVidia GeForce GTX 1080Ti GPU,
Figure 4A). During each epoch, pixel-wise features are extracted and learned from the training dataset. Progress was gauged by comparing the model’s predictions of the validation set to the ground truth classification of these images, and this process was repeated 100 times to optimize the model. The model was saved only when validation set inference accuracy increased. For the model to be useful for classifying new images of caterpillar eggs, it must be able to correctly classify images it has never seen in the training phase. To this end, once training was completed, the test dataset, never used before during training, was used to quantify the accuracy of the final model.
3. Results
Figure 1 depicts the initial Canon DSLR photographs on white versus black backgrounds to validate the morphological differences between
Chloridea virescens and
Helicoverpa zea; the morphological differences were originally described with line drawings by Neunzig [
15]. Differences are predominantly in the micropyle region of the egg (
Figure 1, MP) where the primary ribs (
Figure 1, PR) end before touching the rosette (R) in
C. virescens forming a “gap” (G). In
H. zea the primary ribs continue to the rosette. Additionally, there are cross ribs (
Figure 1, CR) present in
H. zea that are absent in
C. virescens, and in
C. virescens, there are small points (P) present on the egg surface that are absent in
H. zea. Our photos confirmed the previously reported egg morphology of
C. virescens and
H. zea.
An example of the image-processing pipeline is shown in
Figure 2. Each image captured from the MCAM™ was passed through the preprocessing steps as described previously to extract in-focus images of caterpillar eggs. A total of 5502 images of eggs were acquired, extracted, and organized with 3455 images in the training set and 2047 in the test set. A subset of the training data was further partitioned for use as a validation set. Final image counts are shown in
Table 1, considering the distribution of both training, validation, and test sets for the two species of caterpillar eggs.
A tree structure representing the overall dataset organization for training, validation, and testing of the bollworm and budworm classes is shown in
Figure 3A and was analyzed using a multi-layer convolutional neural network (
Figure 3B).
Our trained convolutional model was used to identify a test set of 2047
H. zea and
C. virescens egg images that the model had not seen during the training phase, and 99.3% of these images were inferred correctly. Each individual image takes less than 1.5 ms to classify. A confusion matrix was then used to visualize the accuracy of our model with predicted labels on the horizontal axis and true labels on the vertical (
Figure 4B). Correct predictions are on the diagonal from top left to bottom right.
4. Discussion
Identification of
H. zea versus
C. virescens eggs on cotton is important for Bt cotton pest management in the southeastern United States [
10,
11,
12].
C. viresens larvae that hatch from the eggs are killed by ingesting the Bt protein toxins produced by Bt cotton [
14]. However, because of natural
H. zea Bt tolerance and Bt resistance that has evolved, the Bt toxins in cotton can no longer prevent economic levels of pest damage, and supplemental insecticide spraying is needed [
4,
5,
6,
7]. Economic egg thresholds were developed in these cases to inform when additional pesticide applications are needed [
13].
Egg species identification is based on small differences in the surface morphology of the egg. This identification requires the use of an expensive microscope and a trained expert in egg morphology. Even so, identification is subject to mistakes, sample throughput is low, and time delays are problematic. Eggs must be transported to a laboratory from the field, each egg positioned under a microscope and rotated to view specific regions of the egg for identifying features [
15], and the data summarized and sent to decision makers for each farming operation. Each farming operation could consist of many different field plots with egg identification needed over these plots at the same time. The current best method for egg identification is scanning electron microcopy [
15], which is even less practical. Alternatively, immunoassay methods were developed to distinguish internal protein differences between eggs for
C. virescens and
H. zea [
31]. These immunoassays require multiple assay steps best conducted by someone experienced in biochemistry. Technically, these tests could be conducted in the field but, typically, they are implemented in a laboratory because of harsh outdoor conditions during summer months and large time requirements needed to conduct all of the steps in the assay. Additionally, the high cost of the immunoassay kits makes them too expensive to be practical. There is also the challenge of formulating new test kits each year. The shelf life of the kits is limited and anticipating kit demand months in advance of their use often results in kit shortages.
The objective of our research was to establish proof of concept for using high-resolution photography and machine learning for egg identification. A computer vision methodology for this purpose would provide an easily accessible, reproducible identification that may be otherwise unavailable during the narrow window of time needed for pest management decisions. For example, one possible solution could be a high-resolution smartphone photo of an insect egg to determine insect species. Proof of concept for this approach was demonstrated in this paper. We found that a machine learning algorithm could accurately classify images of eggs from two species of caterpillars with 99.3% accuracy. The two species studied were a worst-case scenario where only subtle morphological differences occur between species. Previously, the identification of these caterpillar eggs required the use of microscopy to view subtle morphological differences or species-specific anti-body kits [
15,
31]. These current methods require labor intensive, subjective analysis while the proposed deep learning technique requires only a representative high-resolution digital image from the user and produces an automated, unbiased output. This is the first description of species identification of insect eggs using deep learning methodologies that would also be of consequence for other important pest management problems.
Insect identification algorithms have been described before [
21,
22,
23]. However, they were limited to later stages of development than the egg, at which point identification by eye is more feasible relying on distinguishable characteristics such as color, shape, and gross morphological features. Artificial intelligence is increasingly being used in this commercial space, and multiple machine learning techniques have been described for crop protection using optical sensors to identify weeds [
32,
33]. This year, Carbon Robotics (Seattle, WA, USA) released a robot with machine learning-based detection software that automatically identifies weeds in crop fields and eliminates the weed with lasers. While this is an extreme case, it exemplifies an automated, sustainable (in terms of toxin resistance) use of this technique for the control of weeds. Another example of machine learning is the application iNaturalist (
www.iNaturalist.org, accessed on 13 June 2022), which uses an algorithm and user-based identifications to identify photos of plants, animals, and insects. Use of machine learning and digital imaging in agriculture and entomology is expected only to grow [
34,
35]. Regarding applications such as iNaturalist, public accessibility to identification and learning tools is a significant boost to fostering interest in entomology in general and conservation efforts in the future. In addition to those previously described, advanced remote sensing image classification and recognition applications have been described and yield a rich field of ongoing research that will likely have widespread utility in agricultural and environmental pursuits [
36,
37].
While our model demonstrated a high degree of accuracy in egg identification, there are limitations that need consideration as would be the case for most classification algorithms. The model so far expedites one task: identification between two species of caterpillar eggs under ideal laboratory conditions on an artificial textile background. The neural network was trained with limited variables excluding differences that could occur in nature with a leaf or other organic background, differences in the age of the egg as the embryo develops, and differences between laboratory-reared versus field-grown insects. Thus, it cannot be assumed that our model can generalize to field use at this juncture. We purposely used different lighting conditions to vary our training data to make the model more robust to realistic use. All the images in this dataset were acquired using a specific imaging system, the MCAM™, and thus the model is now expecting to see an array of pixel intensity values similar to others generated by this image sensor with similar quantization of the real world to digital signals and with a similar quantity of noise present. Because our dataset is specific, we cannot expect our algorithm to identify either type of egg when any variable is altered outside of the conditions of training, except for perhaps lighting. However, proof of concept was demonstrated in our work and more practical training will be needed next.
The MCAM™ is a unique imaging system enabling rapid dataset acquisition and organization. With many miniature microscopes stacked together, it can capture many images quickly in an automated, mappable fashion that accelerated the construction of the dataset used in these experiments. High-resolution is necessary to see the ridge-like structures making up the defining features of H. zea and C. virescens. With the MCAM™, we captured thousands of images (3 TB) in just a few hours and then were able to search the entire imaging data space for the best images. By separating our image classes by both species as well as training and test data subsets during acquisition and then searching the resulting data space, we were able to extract and organize the complete dataset of 5502 images in less than six hours of processing time.
If our end goal is to build a system that will function with smartphone cameras, we will need to examine if this platform is scalable, adaptable, and generalizable in functionality between systems. For example, we need to examine if a dataset that is representative of all or most of the variable conditions between devices can be attained. Many different camera sensors are potentially applicable depending on the phone vendor, and data from these sensors will need to be integrated into the overall dataset. A diverse set of images representing typical field variables will need to be collected by multiple biologists and entomologists to successfully identify insect species in situ. Most newer phones have a 4K resolution camera sensor adequate for the high-quality imaging that is required and using the methodology described here, automated identification of caterpillar egg species is possible.


 and
and 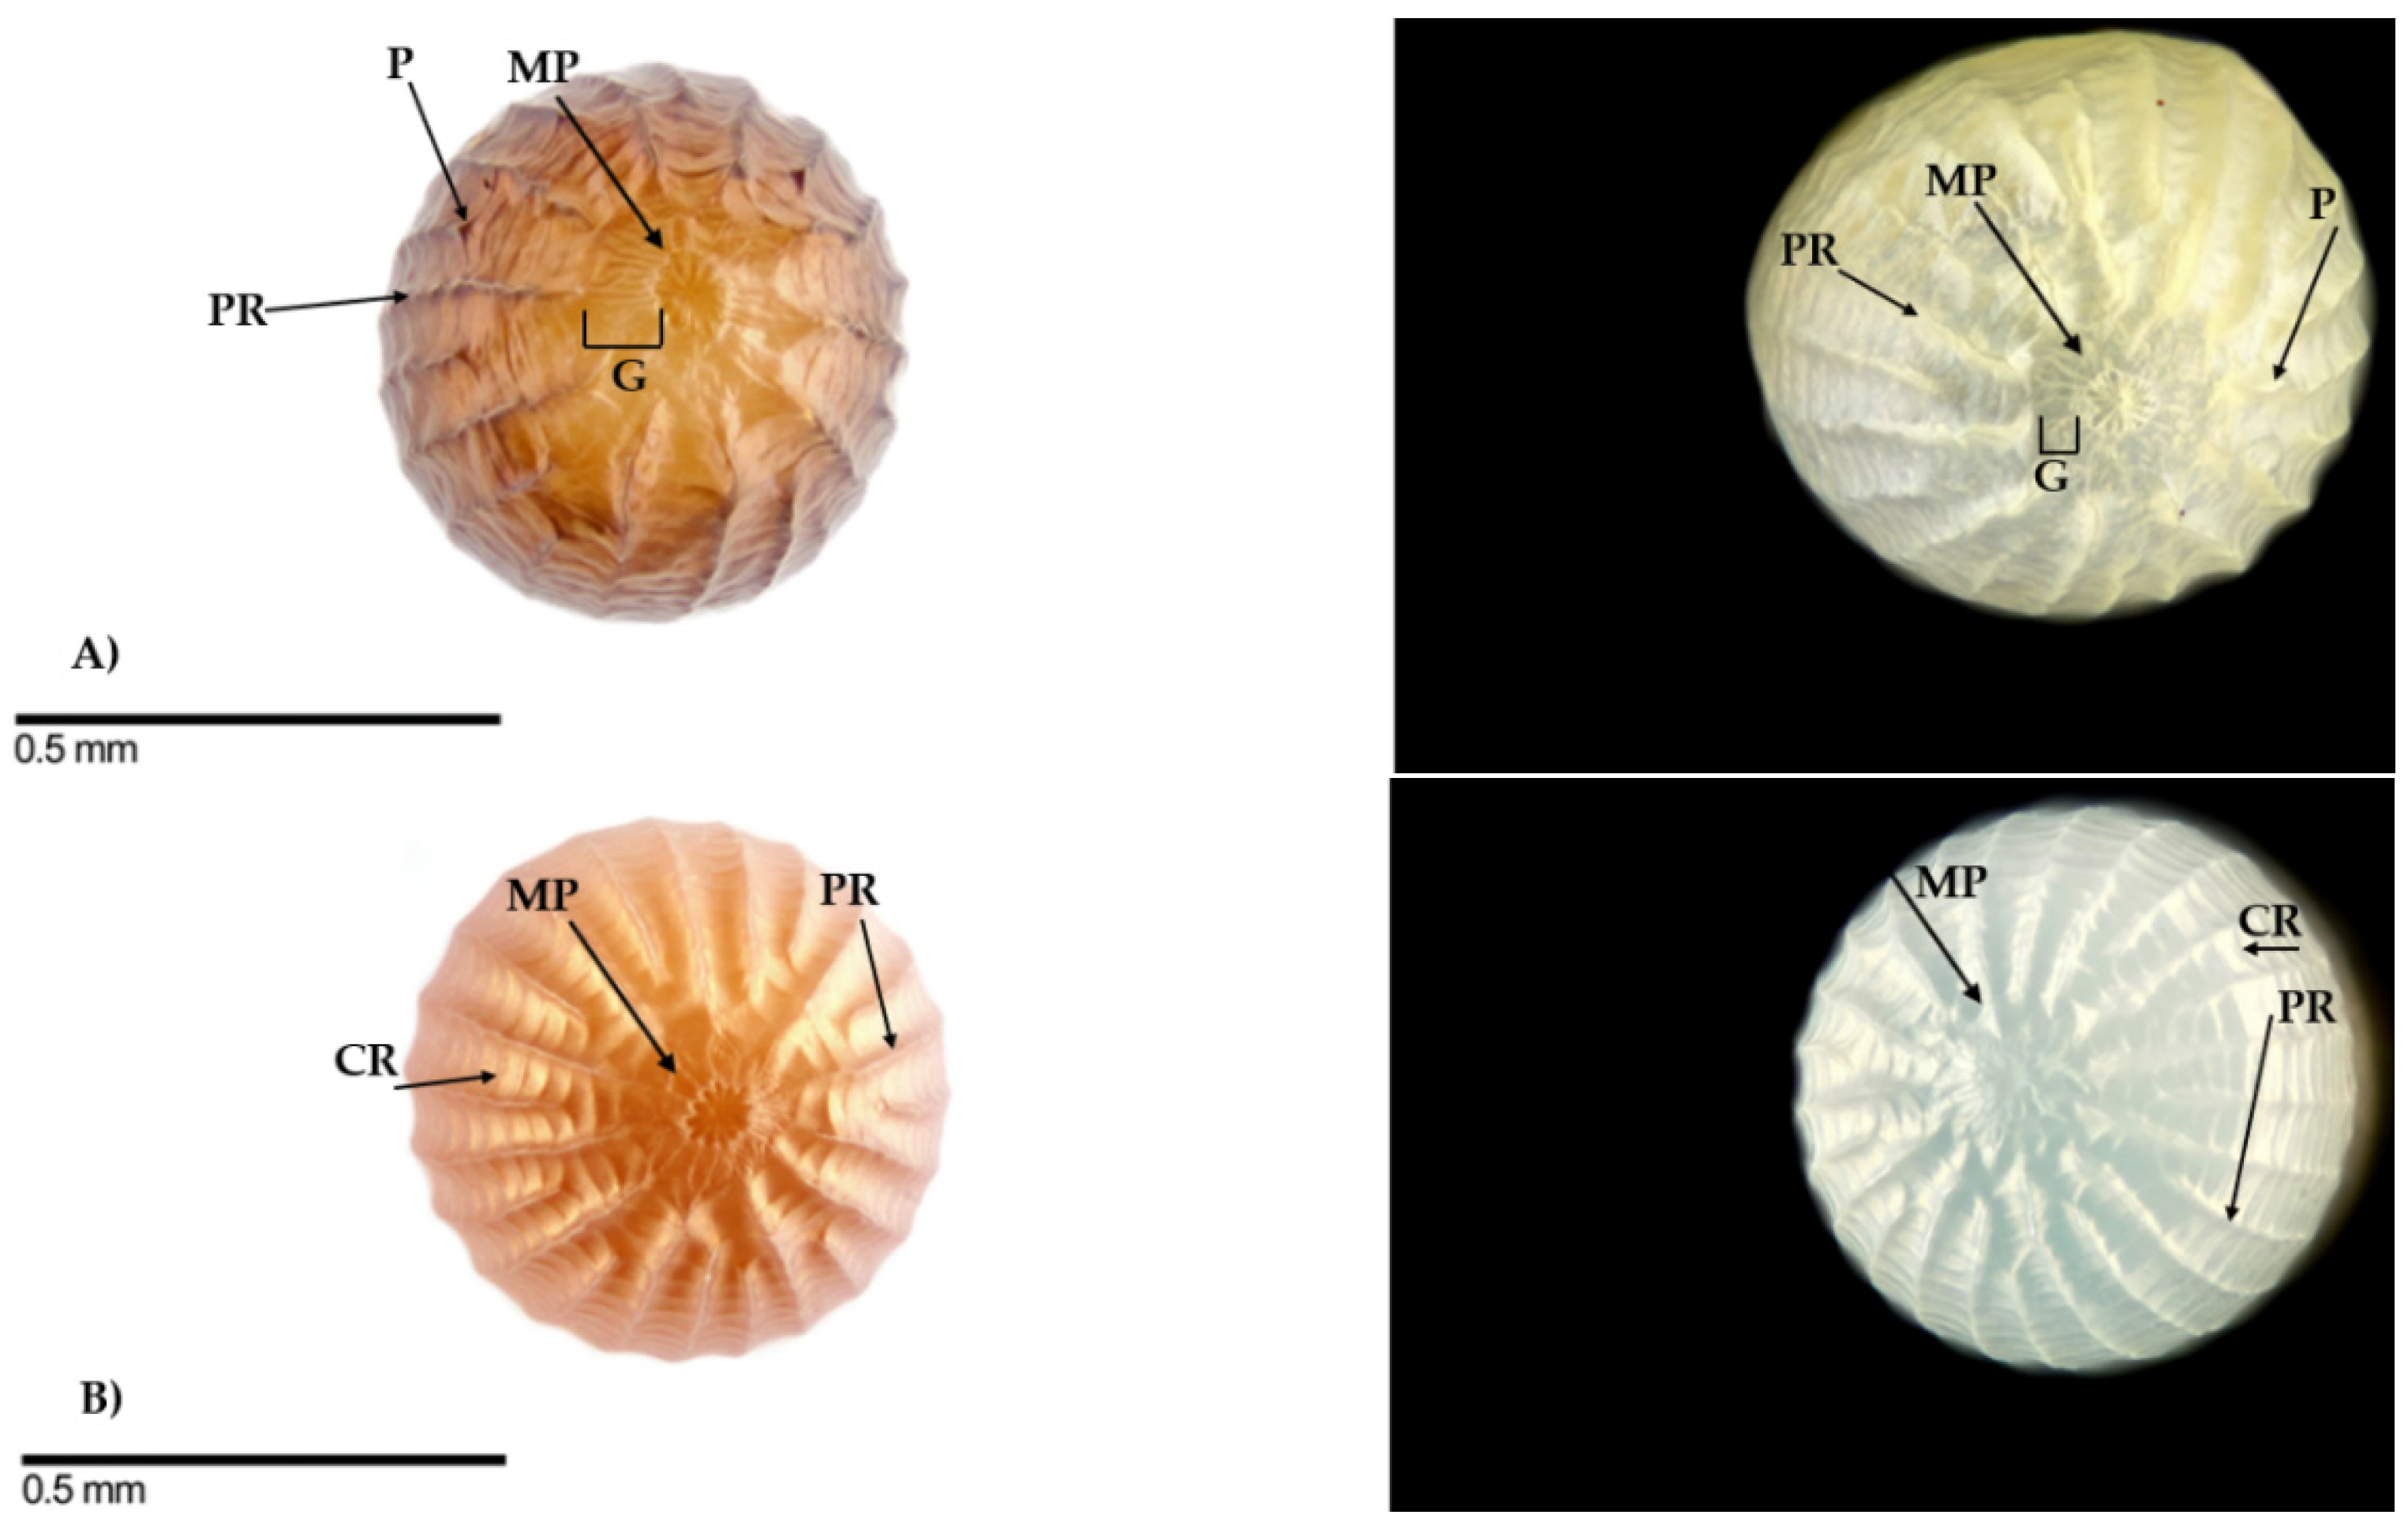


