Article

Response of Soil Microbial Community Composition and Diversity at Different Gradients of Grassland Degradation in Central Mongolia

1
Key Laboratory of Forage and Endemic Crop Biotechnology, Ministry of Education, School of Life Sciences, Inner Mongolia University, Hohhot 010010, China
2
State Key Laboratory of Reproductive Regulatory and Breeding of Grassland Livestock, Inner Mongolia University, Hohhot 010010, China
3
Botanic Garden and Research Institute, Mongolian Academy of Sciences, Ulaanbaatar 13330, Mongolia
*
Author to whom correspondence should be addressed.
Agriculture 2022, 12(9), 1430; https://doi.org/10.3390/agriculture12091430
Submission received: 6 July 2022 / Revised: 25 August 2022 / Accepted: 5 September 2022 / Published: 9 September 2022
(This article belongs to the Special Issue Restoration of Degraded Grasslands and Sustainable Grazing)

Abstract

:
Vegetation and soil microorganisms are important components of terrestrial ecosystems and play a crucial role in ecosystem functioning. However, little is known about the synergistic changes in soil microbial community with aboveground plants in grassland degradation and the role of the microbial community in the process of vegetation restoration succession. In this study, we investigated the characteristics of soil microbial communities and diversities in the different levels of grassland degradation using Illumina MiSeq high-throughput sequencing. The dominant bacteria phyla were: Actinobacteriota, 31.61–48.90%; Acidobacteriota, 7.19–21.73%; Chloroflexi, 9.08–19.09%; and Proteobacteria, 11.14–18.03%. While the dominant fungi phyla were: Ascomycota, 46.36–81.58%; Basidiomycota, 5.63–33.18%; and Mortierellomycota, 1.52–37.69%. Through RDA/CCA, the effects of environmental factors on the differences in the soil microbial community between different sites were interpreted. Results showed that the pH was the most critical factor affecting soil microbial communities in seriously degraded grassland; nevertheless, soil microbial communities in non-degraded grassland and less degraded grasslands were mainly affected by the soil moisture content and soil enzyme activities (sucrase activity, alkaline phosphatase activity and catalase activity). We systematically demonstrated the soil microbial communities of different grassland degradation gradients in Mongolia, which provided valuable information for grassland degradation reduction and vegetation restoration succession.

1. Introduction

Mongolia is located in the Mongolian plateau in Central Asia, and the terrain gradually decreases from west to east with an average altitude of 1580 m. Most areas have an arid/semi-arid climate, with obvious seasonal variation, and the annual average precipitation is approximately 120–250 mm [1]. The vegetation in Mongolia is composed of Siberian coniferous forest in the north and Central Asia steppes and desert in the south. Among them, the steppes account for approximately 70% of the land area comprising mountain steppes, steppes and desert steppes [2], and the main plant genera in steppes are Stipa, Festuca, Agropyron, Koeleria, Cleistogenes and Helictotrichon [3]. The typical steppe is the most widely distributed and the most representative, in which the main utilization mode is grazing. The number of livestock has increased from 30 years ago, resulting in the serious degradation of vegetation [2]. Due to long-term over-grazing, grassland degradation is widespread, as well as desertification in the southern steppes with the decrease in rainfall and the increase in temperature. Grassland desertification is mainly caused by grassland degradation, the unreasonable utilization of farmland, the excessive use of forest resources, water resource loss and mineral exploitation. Consequently, studying the changes in vegetation and soil microbial communities in different gradients of grassland degradation is essential for the protection and restoration of degraded grassland [4].
Soil microorganisms are an important part of the soil ecosystem, including bacteria, archaea, fungi, viruses, protozoa and microalgae, which are not clearly visible to the naked eye [5,6]. Soil microorganisms can be regarded as the driving force of nutrient transformations in soil, such as nitrogen fixation, nitrification, denitrification, decomposition and the synthesis of humus. Additionally, these nutrient and organic matter transformations have been carried out in cooperation with soil enzymes [7,8]. The soil microbiome governs the nutrients and other elements vital for plant growth and animal life, thus affecting the ecosystem and environment. Previous studies have found that soil microbial communities had significant effects on soil fertility and vegetation, and the processes of microbial nutrient metabolism can supply energy and nutrients to aboveground plants [9]. Moreover, during organic matter decomposition, microbial metabolism function dominated nutrient transformation owing to their rapid rates of decomposition, resulting in the efficient recycling of nutrient reserves [10]. Therefore, comprehending the composition of the soil microbial community structure is crucial to illuminate the nutrient limitation of microorganisms and vegetation growth in grassland degradation succession.
Previous studies on soil microbial communities and diversities mainly focused on the response to nutrient limitation, grassland utilization type and environmental factors affecting soil microorganisms. Recent results revealed that Micrococcales, Micrococcaceae and Herpotrichiellaceae were significantly correlated with microbial N limitations and Thermoleophilia were significantly correlated with microbial P limitations [9]. In the process of natural vegetation restoration, the imbalanced soil C/N ratio may determine the metabolic limitations of soil microorganisms and further regulate the changes in plant nutrient limitation [11]. Different mowing patterns had different effects on soil microbial communities in the semiarid grassland ecosystem [12,13]. Moreover, how plant identity correlated with soil microbial communities was determined using the biotic and abiotic environments. The bacterial community was more sensitive to changes in precipitation than the fungal community in a meadow steppe, and the dominance of the microbial community change from bacteria to fungi increased annual precipitation [14]. Soil microbes in wetlands have more specialized associations with host plants than soil microbes in drier environments [15]. Our recent research indicated that the diversity of aboveground vegetation and change in constructive species affected the structure of the belowground microbial community in the eastern Inner Mongolian grasslands [16]. Furthermore, it is extremely critical to maximize the microbial functions in grassland ecosystems and agroecosystems in the era of ecosystem degradation and climate change. The researchers tried to increase the resource-efficiency and stress-resistance of agroecosystems by capitalizing on core microbiomes [17].
The composition and diversity of the soil microbial community are affected by many factors, such as soil physical and chemical properties, enzyme activities and aboveground vegetation growth. Soil pH was a key factor affecting the diversity, structure, interaction, and function of rhizosphere bacterial communities [18]. In addition to pH, soil organic carbon and light fraction organic matter were key drivers of the microbial community structure [19]. The soil moisture content can directly affect the growth of aboveground plants; there were direct and indirect correlations between soil microorganisms and soil moisture content [20]. At the same time, the mineral content involved in the biological cycle also plays an important role in the growth of microorganisms. Studies have shown that the diversity of the bacterial community was higher in leaf biochar-amended forest soil than others, probably because the contents of soluble phosphorus, nitrogen and calcium in the soil were significantly higher [21]. Moreover, enzymes involved in the soil nutrient cycle, such as sucrase and urease, are closely related to the release and storage of various nutrients and humus formation in soil, thus affecting the carbon utilization capacity and diversity of the soil microbial community. The bacterial biomass was increased in the invasive plants rhizosphere soils through the CO2 efflux, N mineralization rate and enzyme activities stimulating nutrient cycling in soil systems [22]. The environmental impact factors of soil microorganisms are different in different habitats; it is necessary to explore the main impact factors to understand the structure and function of the soil microbial community. Soil microorganisms can promote the growth of aboveground vegetation; the study of the soil core microbial community structure and core microorganisms in the process of grassland degradation will contribute to the restoration of grassland and improve its production capacity and ecological function.
Here, the composition, diversity and function of the soil microbial community in native meadow vegetation and desertification grassland vegetation in Central Mongolia have not been studied, and the response mechanism during the degradation succession process and main influencing factors are not clear. A comparative study on the changes in soil microbial communities and core microorganisms at different gradients of grassland degradation has a far-reaching impact on reducing the degradation of the grassland ecological environment caused by anthropogenic causes. Therefore, we examined the community composition and diversity of soil bacteria and fungi at different deterioration degrees in native meadow grassland and arid areas using Illumina MiSeq high-throughput sequencing. We also measured the physicochemical properties and enzyme activities of soil to explore the main environmental factors affecting the soil microbial community. In brief, we tried to solve the following problems: 1. How do soil microbial communities and diversity respond to different grassland degradation gradients? 2. What causes these responses?

2. Materials and Methods

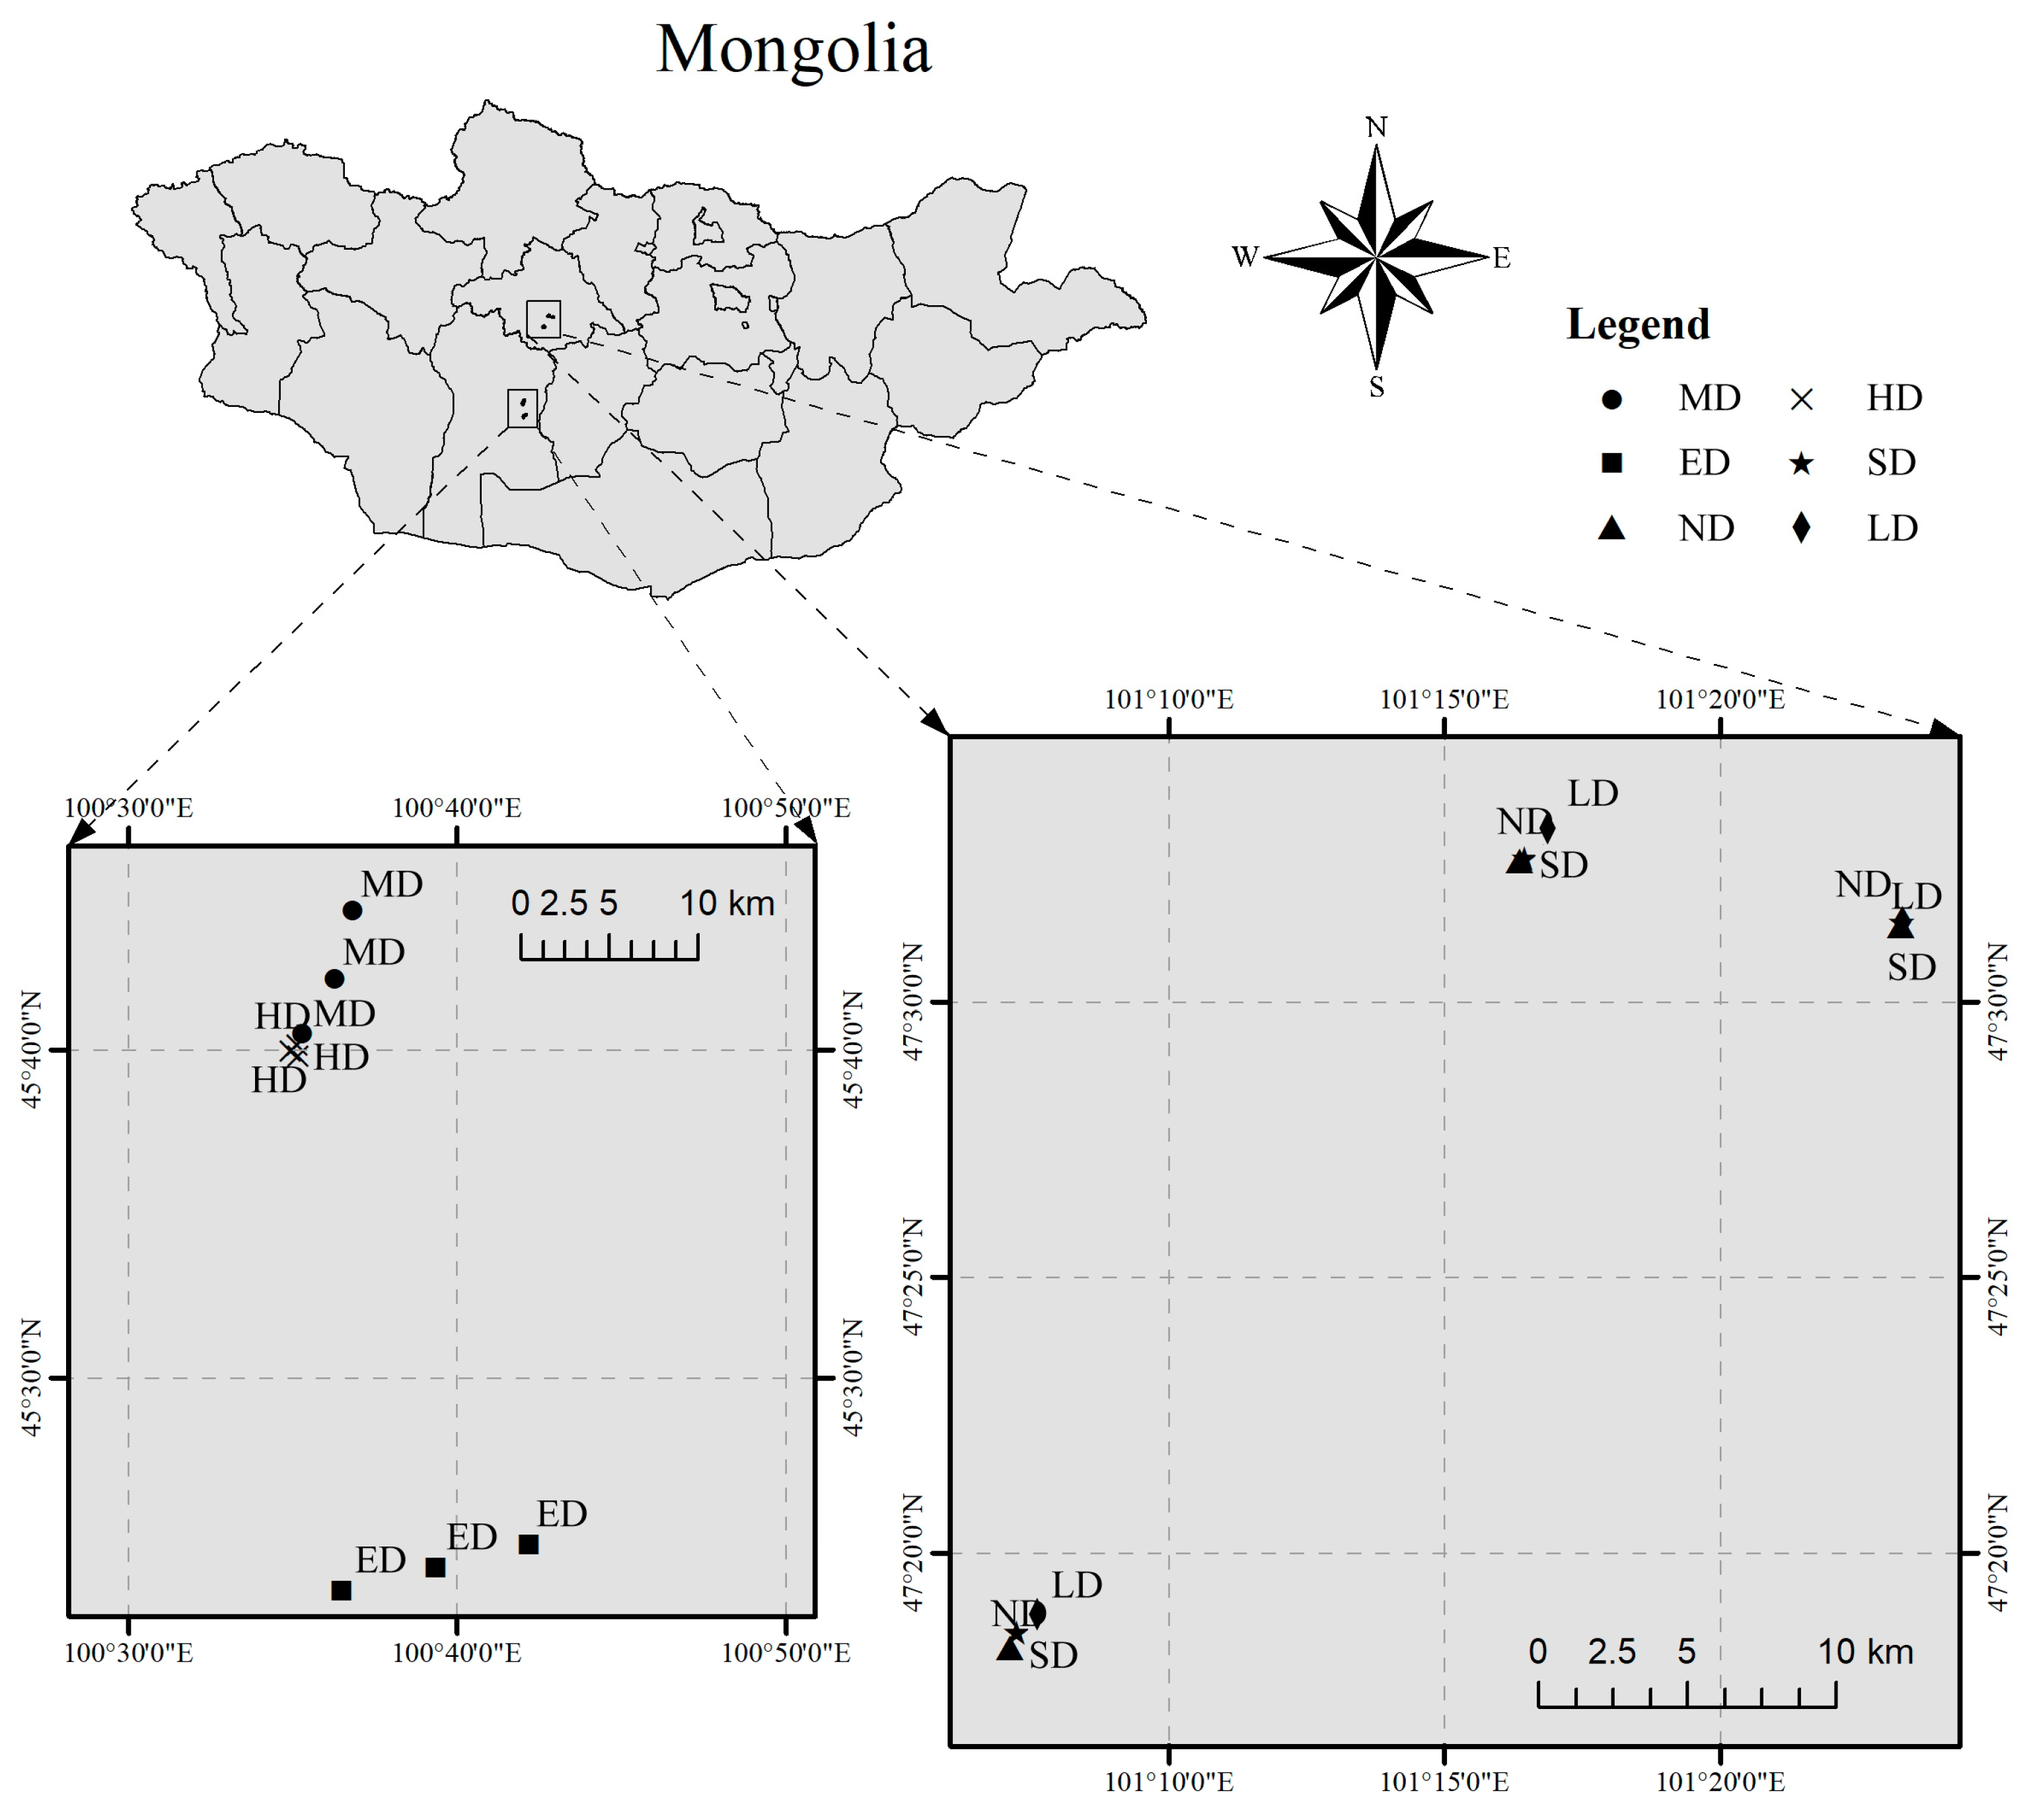
2.1. Soil Sampling and Preparation

Soil samples were collected from 18 sites in the Bayanhongor and ArKhangai provinces of Mongolia (Figure 1), which spanned from 100°34′54.84″ E–101°23′18.60″ E longitude and 45°24′14.76″ N–47°33′08.28″ N latitude. These sites belong to six different grassland degradation gradients, which were non-degraded grassland (ND), slightly degraded grassland (SD), lightly degraded grassland (LD), moderately degraded grassland (MD), heavily degraded grassland (HD) and extremely degraded grassland (ED), respectively. Between the lightly degraded grassland and moderately degraded grassland lies the Hangayn Mountains, with climate change and overgrazing resulting in widespread degradation. The judgment of the grassland degradation degree was mainly based on vegetation coverage. The altitudes of these sites ranged from 1390.5 to 1993.5 m, and the vegetation coverage ranged from 5 to 90 (Table S1). Each sampling site had three bulk soils taken randomly from a depth of 0–30 cm, and a total of 54 bulk soil samples, mixed into one for microbial analyses and further use. Additionally, bulk soil samples for microbial analyses were stored at −20 °C before soil DNA extraction and the rest were kept at 4 °C for chemical/physical properties analyses.

2.2. Soil Chemical/Physical Properties and Enzyme Activities

All the soil chemical/physical properties were measured for mixed bulk soil after filtering through a 100-mesh screen, except moisture content. Soil moisture content was measured in the field using a WET2 sensor type with an HH2 moisture meter from Delta-T devices company. Soil pH was determined using a Palintest SKW500 PT162 sensor from GE Panametrics at a soil/ water mass ratio of 1:2.5. Soil total nitrogen (TN), total carbon (TC), total hydrogen (TH) and total sulfur (TS) were determined using an Elementar Vario MACRO cube after filtering through a 200-mesh screen; then, the C/N ratio and C/H ratio were calculated. Total phosphorus (TP) and inorganic phosphorus (IOP) were determined using the molybdenum blue method; the former was burned at 550 °C in a muffle furnace, and the content of organic phosphorus (OP) was calculated. The amounts of available phosphorus (AP), nitrate nitrogen (NN), ammonium nitrogen (AN), available potassium (AK) and soil organic matter (SOM) were measured using a corresponding commercial kit (SinoBestBio, Shanghai, China) according to the manufacturer’s instructions.
Soil sucrase activity (SC) was determined using sucrose as the substrate; the amount of glucose was measured after incubation at 37 °C for 24 h. Urease activity (UE) was determined via a measurement using urea as the substrate, and the amount of NH4+ was measured after incubation at 37 °C for 24 h. Catalase activity (CAT) was determined by measuring the O2 absorbed by KMnO4 after the addition of H2O2 to the samples. Soil acid phosphatase activity (ACP), neutral phosphatase activity (NP) and alkaline phosphatase activity (AKP) were measured using a corresponding commercial kit (Suzhou Comin Biotechnology Co., Ltd. Suzhou, China) according to the manufacturer’s instructions.
The mean, standard error of the mean and significant differences in soil chemical/physical properties and enzyme activities in six vegetation types of the sampling sites were analyzed by Excel 2010 and SPSS 26.0. The details of these sites are presented in Table 1. In the follow-up study, in order to obtain more accurate results, the correlation analysis between the soil microbial community composition and environmental factors used the soil chemical/physical properties and enzyme activities of 18 sampling sites.

2.3. DNA Extraction, Amplification and Sequencing

Triplicate genomics DNA was extracted from 18 mixed soil samples using the E.Z.N.A.® soil DNA Kit (Omega Bio-tek, Norcross, GA, USA) according to the manufacturer’s instructions. The DNA extraction quality was detected using 1% agarose gel electrophoresis (5 V/cm, 20 min), and quantified using a NanoDrop® 2000 UV-vis spectrophotometer (Thermo Scientific, Wilmington, NC, USA). In order to determine the community composition and diversity of soil microorganisms in each sample, an amplicon survey of the bacterial 16S rRNA gene hypervariable region V3-V4 and the fungal ITS region was performed. The bacterial 16S rRNA gene were amplified with primer pairs 338F (5′-ACTCCTACGGGAGGCAGCAG-3′) and 806R (5′-GGACTACHVGGGTWTCTAAT-3′) using an ABI GeneAmp® 9700 PCR thermocycler (ABI, Los Angeles, CA, USA), while the fungal ITS region were amplified with primers ITS1F (5′-CTTGGTCATTTAGAGGAAGTAA-3′) and ITS2R (5′-GCTGCGTTCTTCATCGATGC-3′. The PCR amplification procedure was performed as follows: initial denaturation at 95 °C for 3 min, followed by 27 cycles of denaturing at 95 °C for 30 s, annealing at 55 °C for 30 s, extension at 72 °C for 45 s, a single extension at 72 °C for 10 min and storage at 4 °C (ABI GeneAmp® 9700, Waltham, MA, USA). PCR was performed using a Techne TC-5000 thermocycler (Bibby Scientific Limited, Staffordshire, UK) in a 20 μL reaction system containing 4 μL 5× TransStart FastPfu buffer, 2 μL 2.5 mM dNTPs, 0.8 μL forward primer (5 μM), 0.8 μL reverse primer (5 μM), 0.4 μL TransStart FastPfu DNA Polymerase, 10 ng template DNA and, finally, ddH2O up to 20 μL. PCR reactions were performed in triplicate. The PCR products were detected on 2% agarose gels and purified using the AxyPrep DNA Gel Extraction Kit (Axygen Biosciences, Union City, CA, USA) according to the manufacturer’s instructions and quantified using Quantus™ Fluorometer (Promega, Madison, WI, USA).
After quantification, purified amplicons were pooled in equimolar quantities and paired-end sequenced (2 × 300) on an Illumina MiSeq platform (Illumina, San Diego, CA, USA) according to the standard protocols by Majorbio Bio-Pharm Technology Co. Ltd. (Shanghai, China).

2.4. Bioinformatics and Statistical Analysis

The raw sequences were quality filtered, trimmed, de-noised and merged using Mothur 1.30.2 [23]. Operational taxonomic units (OTUs) with a 97% similarity cutoff were clustered using the UPARSE algorithm, and chimeric sequences were identified and removed using the UCHIME de novo algorithm. The taxonomic analysis of each OTU was performed using the RDP Classifier (http://rdp.cme.msu.edu/, accessed on 27 July 2021) against sequences in the Silva database (version 138) for bacteria and the Unite database (version 8.0) for fungi using a confidence threshold of 0.7. Subsequently, the microbial community richness was evaluated using the Chao index and ACE index, and the microbial community diversity was evaluated using the Shannon index and phylogenetic diversity (Faith’s PD) index [24].
All the statistical analyses were performed using R (version 3.3.1) and conducted through a one-way analysis of variance (ANOVA) in IBM SPSS Statistics 26.0 (the significance thresholds were * p < 0.05, ** p < 0.01, and *** p < 0.001). We evaluated the significant differences in abundance at the genus level using one-way ANOVA with a Scheffe score of 0.95 and a multiple test correction of the p value using FDR to determine significant differences genera. The linear discriminant analysis (LDA) effect size (LEfSe) method was used to detect potential biomarkers at multiple taxonomical levels with an LDA score threshold of >3.5 and a factorial Kruskal–Wallis test to detect the abundance difference of p < 0.05. We defined the core microbiomes as the 100 most abundant genera among all of the samples. To reveal the genetic relationship of core microorganisms in the evolution process, phylogenetic trees were generated in IQ-TREE (version 1.6.8, http://www.iqtree.org/) by maximum likelihood method (bootstrap = 1000), which was used to visualize differences in the phylogenies with the iTOL (Interactive Tree of Life, http://itol.embl.de). Principal coordinate analysis (PCoA), redundancy analysis (RDA), canonical correlation analysis (CCA) and variance partitioning analysis (VPA) were performed using R (version 3.3.1).

3. Results

3.1. Microbial Community Composition and Diversity

Fifty-four composite soil samples were analyzed using Illumina MiSeq high-throughput sequencing. In this study, 6,146,537 sequence reads were obtained across all samples, including 2,653,635 bacterial reads (average of 49,141 per sample) and 3,492,902 fungal reads (average of 64,683 per sample). According to the lowest number of sequences detected among the assayed samples, 28,228 and 42,803 bacterial and fungal reads per sample were randomly selected for equitable comparisons, respectively. Total bacterial sequences were assigned to 970 genera belonging to 44 phyla; meanwhile, the fungal sequences were assigned to 1065 genera belonging to 16 phyla. The rarefaction curves of all the samples tended to be flat as shown in Figure S1, suggesting that the sequencing depth was sufficient to cover most species of the soil microbial community. The alpha-diversity indices (including chao1, ACE, the Shannon Wiener index and Faith’s PD) of the soil bacterial and fungal community are listed in Table S2. It can be seen that the alpha-diversity indices of bacteria were higher than those of fungi in all sampling sites. The values of chao1, ACE and Faith’s PD of the soil fungal community in sites such as the ND, SD and LD were significantly higher than those of the other three sites.
Forty-four bacterial phyla were identified, where the most dominant phylum was Actinobacteriota, accounting for 31.61–48.90% of the total sequences, followed by bacteria from the phyla Acidobacteriota (7.19–21.73%), Chloroflexi (9.08–19.09%), Proteobacteria (11.14–18.03%) and Gemmatimonadota (2.97–4.30%). The phylum Actinobacteriota accounted for a higher proportion in ED (48.90%) and HD (47.81%) than other sample plots (ND, 33.49%; SD, 31.88%; LD, 31.61; and MD, 39.28%) with relatively high vegetation coverage. However, the phylum Acidobacteriota with the second highest abundance had a relatively lowest proportion in the ED sample plot, which was approximately 7.19%, less than 1/3 of the proportion of LD plots (21.73%; Figure S2A). Sixteen fungal phyla were identified, where the dominant phyla included Ascomycota (46.36–81.58%), Basidiomycota (5.63–33.18%) and Mortierellomycota (1.52–37.69%). The common fungal phyla were unclassified_K_Fungi (0.97–3.80%), Glomeromycota (0.87–3.20%) and Chytridiomycota (0.64–3.62%). The average abundance of Ascomycota phylum in the three plots, namely, ND, SD and LD, accounting for 51.22%, were lower than that of the other three (77.77%). Among them, the low abundance part comprised Mortierellomycota, Basidiomycota and the above two together, respectively (Figure S2B). At the genus level, in addition, the dominant genera of bacteria were norank_f_67-14, RB41, norank_f_norank_o_Gaiellales and Rubrobacter, and the dominant genera of the fungi were Mortierella, Hygrocybe, Penicillium and Gibberella (Figure S2C,D). At the OTU level, there were 993, 297, 391, 410, 307 and 273 unique OTUs of the bacteria in ED, HD, MD, ND, SD and LD, respectively, and 1555 OTUs that were shared across all six group soils. The number of fungal unique OTUs were 406, 248, 309, 823, 650 and 618 in six groups, and 122 OTUs were shared across them (Figure S2E,F).
Principal coordinate analysis (PCoA) plots based on unweighted UniFrac distance metrics showed soil microbial similarity and a difference in six vegetation types using PC1 and PC2 (the explained variances of bacterial communities were 49.23% and 8.85%, and those of fungal communities were 22.74% and 19.48%, respectively) (Figure 2). The results showed that in both the bacterial and fungal PCoAs, the microbial community demonstrated an obvious change from extremely degraded grassland (ED) to moderately degraded grassland (MD). However, there were no such microbial community changes in non-degraded grassland to lightly degraded grassland. It can be observed from the dispersion of the distribution on the PC1-axis that the bacterial communities in the ED, HD and MD sites showed more obvious differences than the fungal communities in comparison with the ND, SD and LD sites. Furthermore, considering the difference in the sample plot location, the PCoAs secondary grouping of the ND, SD and LD sites were performed. Through the comparative analysis between secondary groups, the community composition of each sample was different, but there was no obvious substitution change.

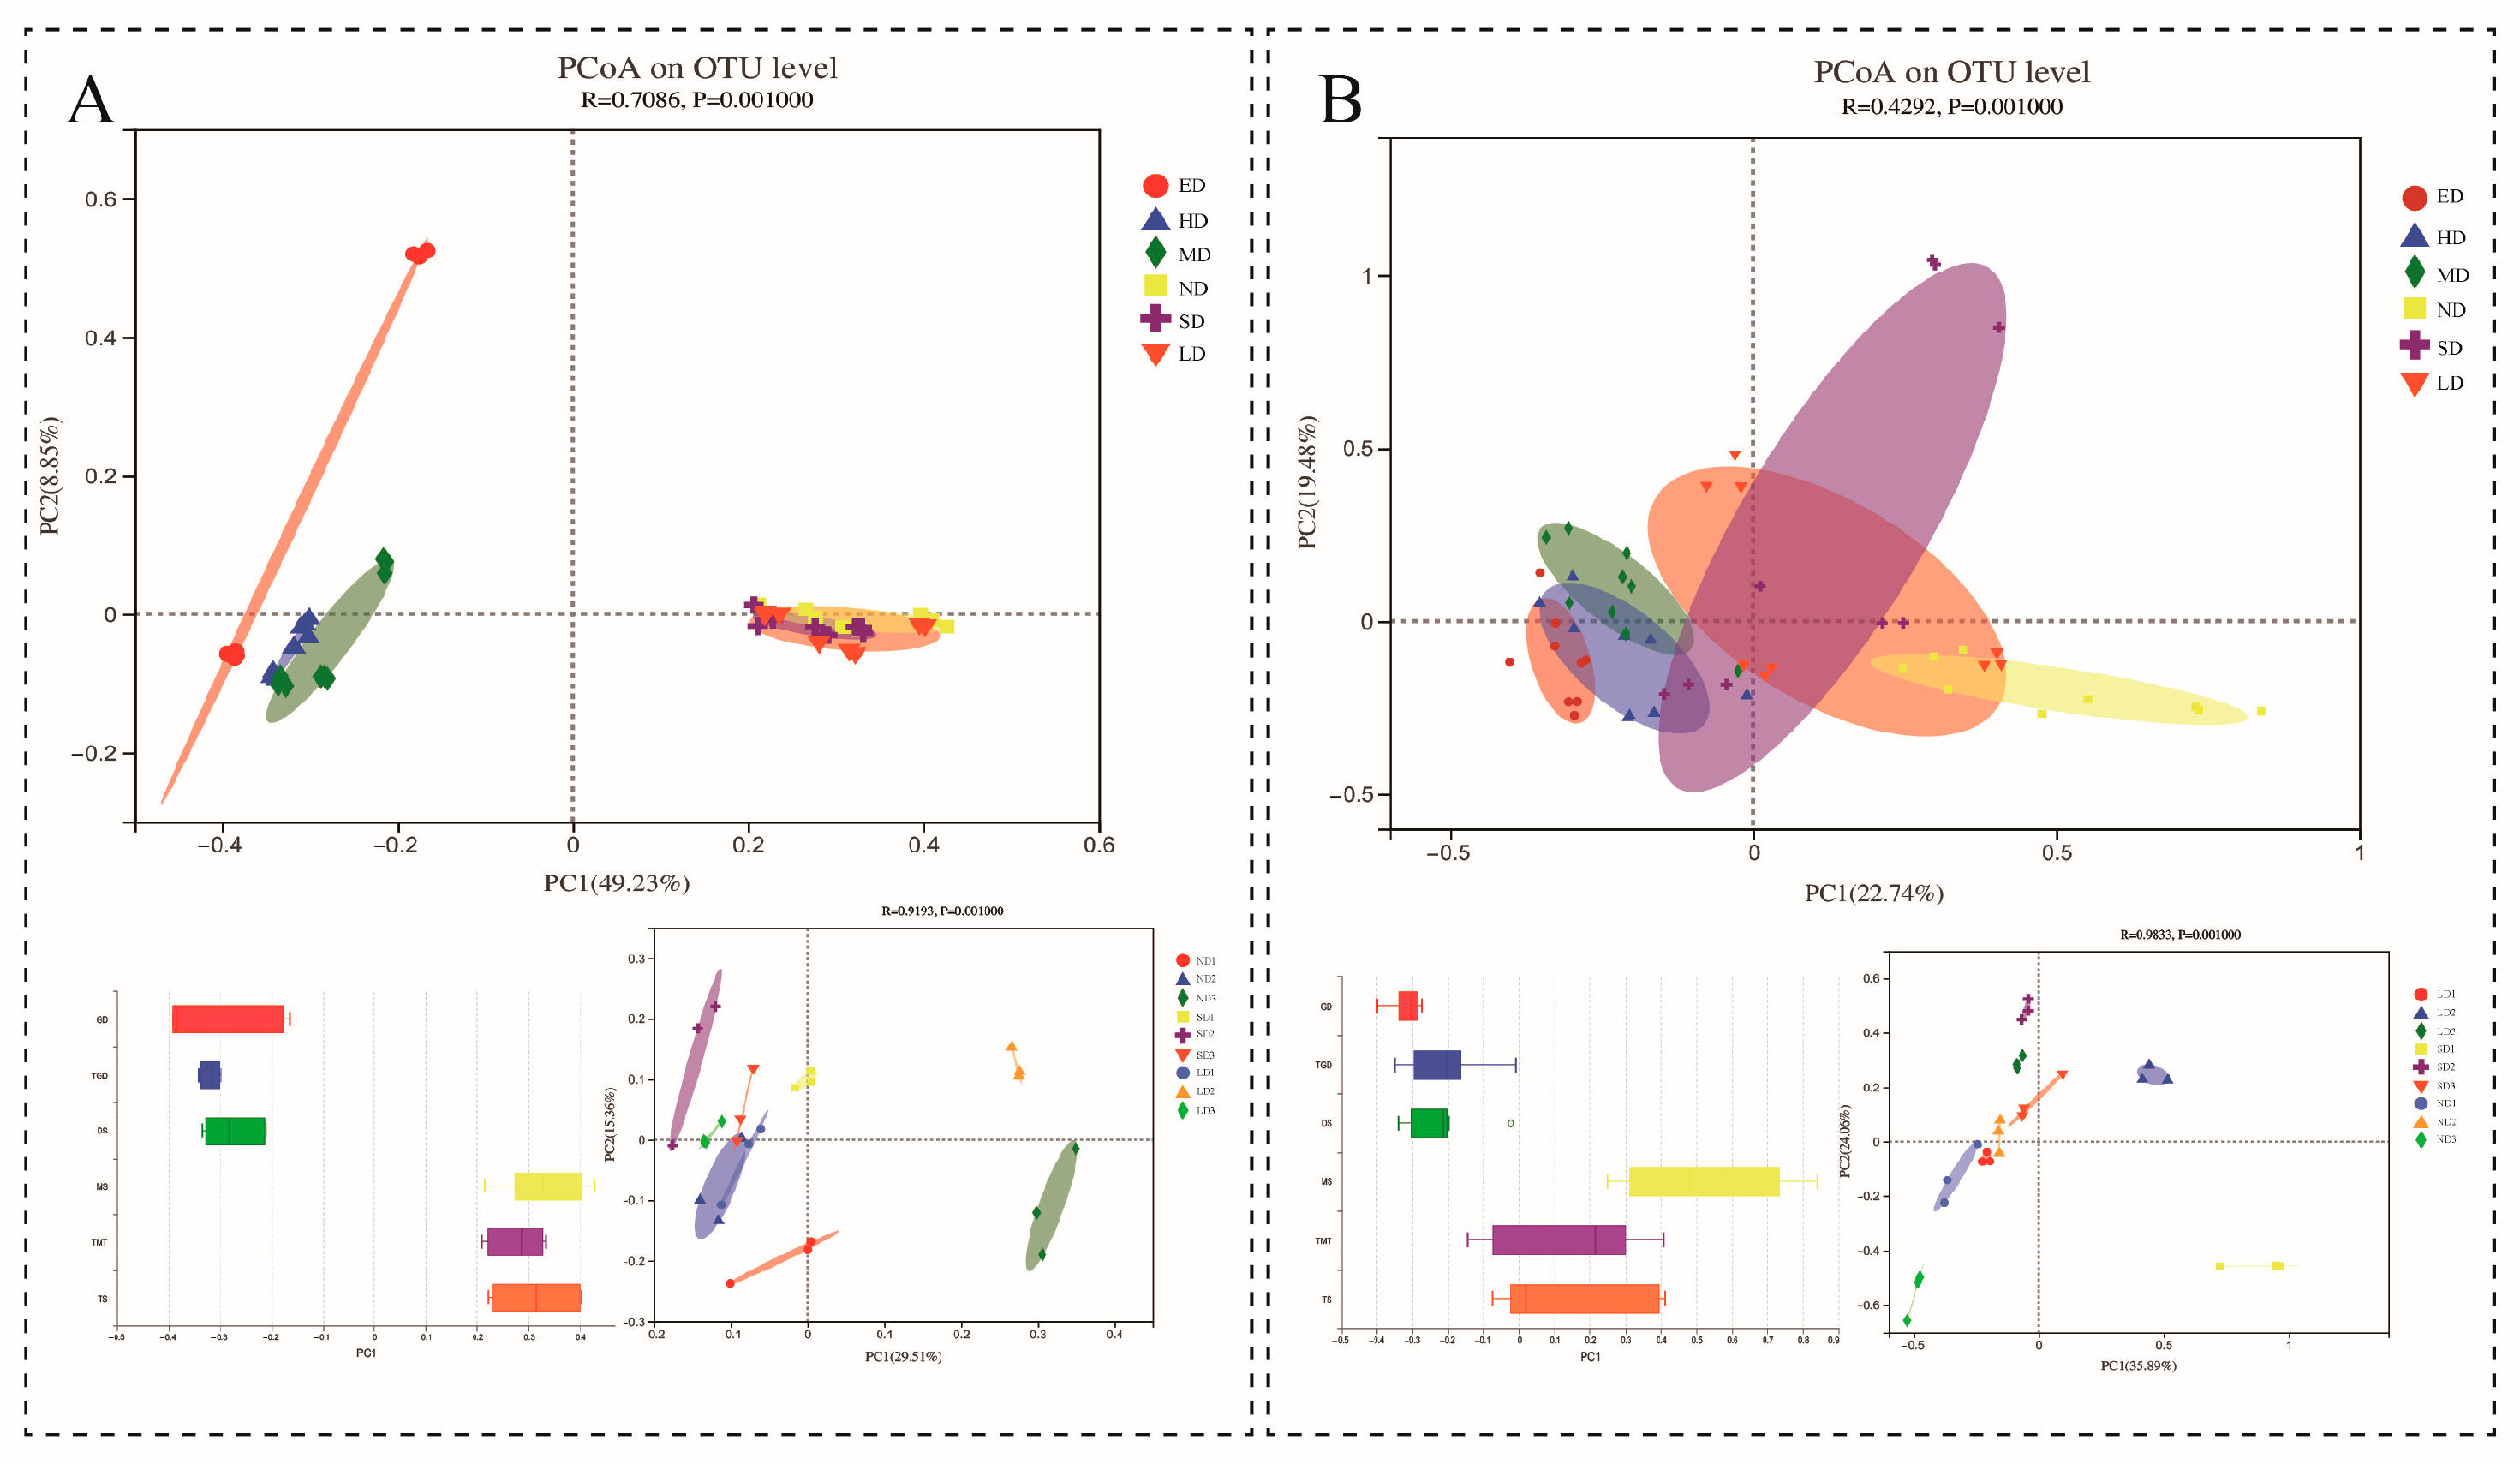
3.2. Soil Microbial Difference Analysis between Different Grassland Degradation Gradients

In this study, according to the geographical distribution, the results were divided into two grassland degradation gradients (from non-degraded grassland to lightly degraded grassland and from moderately degraded grassland to extremely degraded grassland) for analysis. One-way ANOVA was used as the test of difference significance between soil microbial communities. There were three kinds of bacteria with highly significant differences (p < 0.001) at the genus level between ED, HD and MD, which were RB41, norank_f_norank_o_0319-7L14 and Solirubrobacter (Figure 3A). There was no highly significant difference among microbial communities in the other sites (Figure 3C,E,G). In addition, there were four kinds of bacteria with significant differences (0.001 < p ≤ 0.01), which were norank_f_67-14, norank_f_Roseiflexaceae and norank_f_Vicinamibacteraceae between ED, HD and MD (Figure 3A) and Bradyrhizobium between ND, SD and LD (Figure 3C). We also observed that there were three kinds of fungi with significant differences (0.001 < p ≤ 0.01), which were Chaetomium between ED, HD and MD (Figure 3E); Trichocladium between ND, SD and LD (Figure 3G); and Mortierella between all six sites (Figure 3E,G). It is worth noting that the mean proportion of Mortierella showed a decreasing trend with the increase in grassland degradation levels; the specific proportions were 1.177% for ED, 3.154% for MD, 11.91% for LD and 37.68% for ND, respectively.
The LEfSe algorithm with an LDA score of 3.5 was used to identify soil microbes as potential biomarkers that characterized the differences in the different levels of grassland degradation. The results revealed that there were 11 bacterial genera belonging to Acidobacteriota, Actinobacteriota and Tistrellales (order level) significant enriched in ED, HD and MD (Figure 3B and Figure S3A,B). Additionally, in the soils of the ND, SD and LD sites, 11 main bacterial genera belonging to Proteobacteria, Chloroflexi and Gemmatimonadota were significantly abundant (Figure 3D and Figure S3C,D). The marker fungi in the ED soil contained Sordariales, Onygenales and Microascales (order level); the HD site included Mortierellomycota and the MD obtained Basidiomycota, respectively (Figure 3F and Figure S3E,F). Mortierellomycota and Rozellomycota were enriched in ND, Basidiomycota was abundant in SD and Corticiales (order level) was included in LD (Figure 3H and Figure S3G,H). Overall, there were forty-seven fungal genera that can be used as a biomarker in the research area.

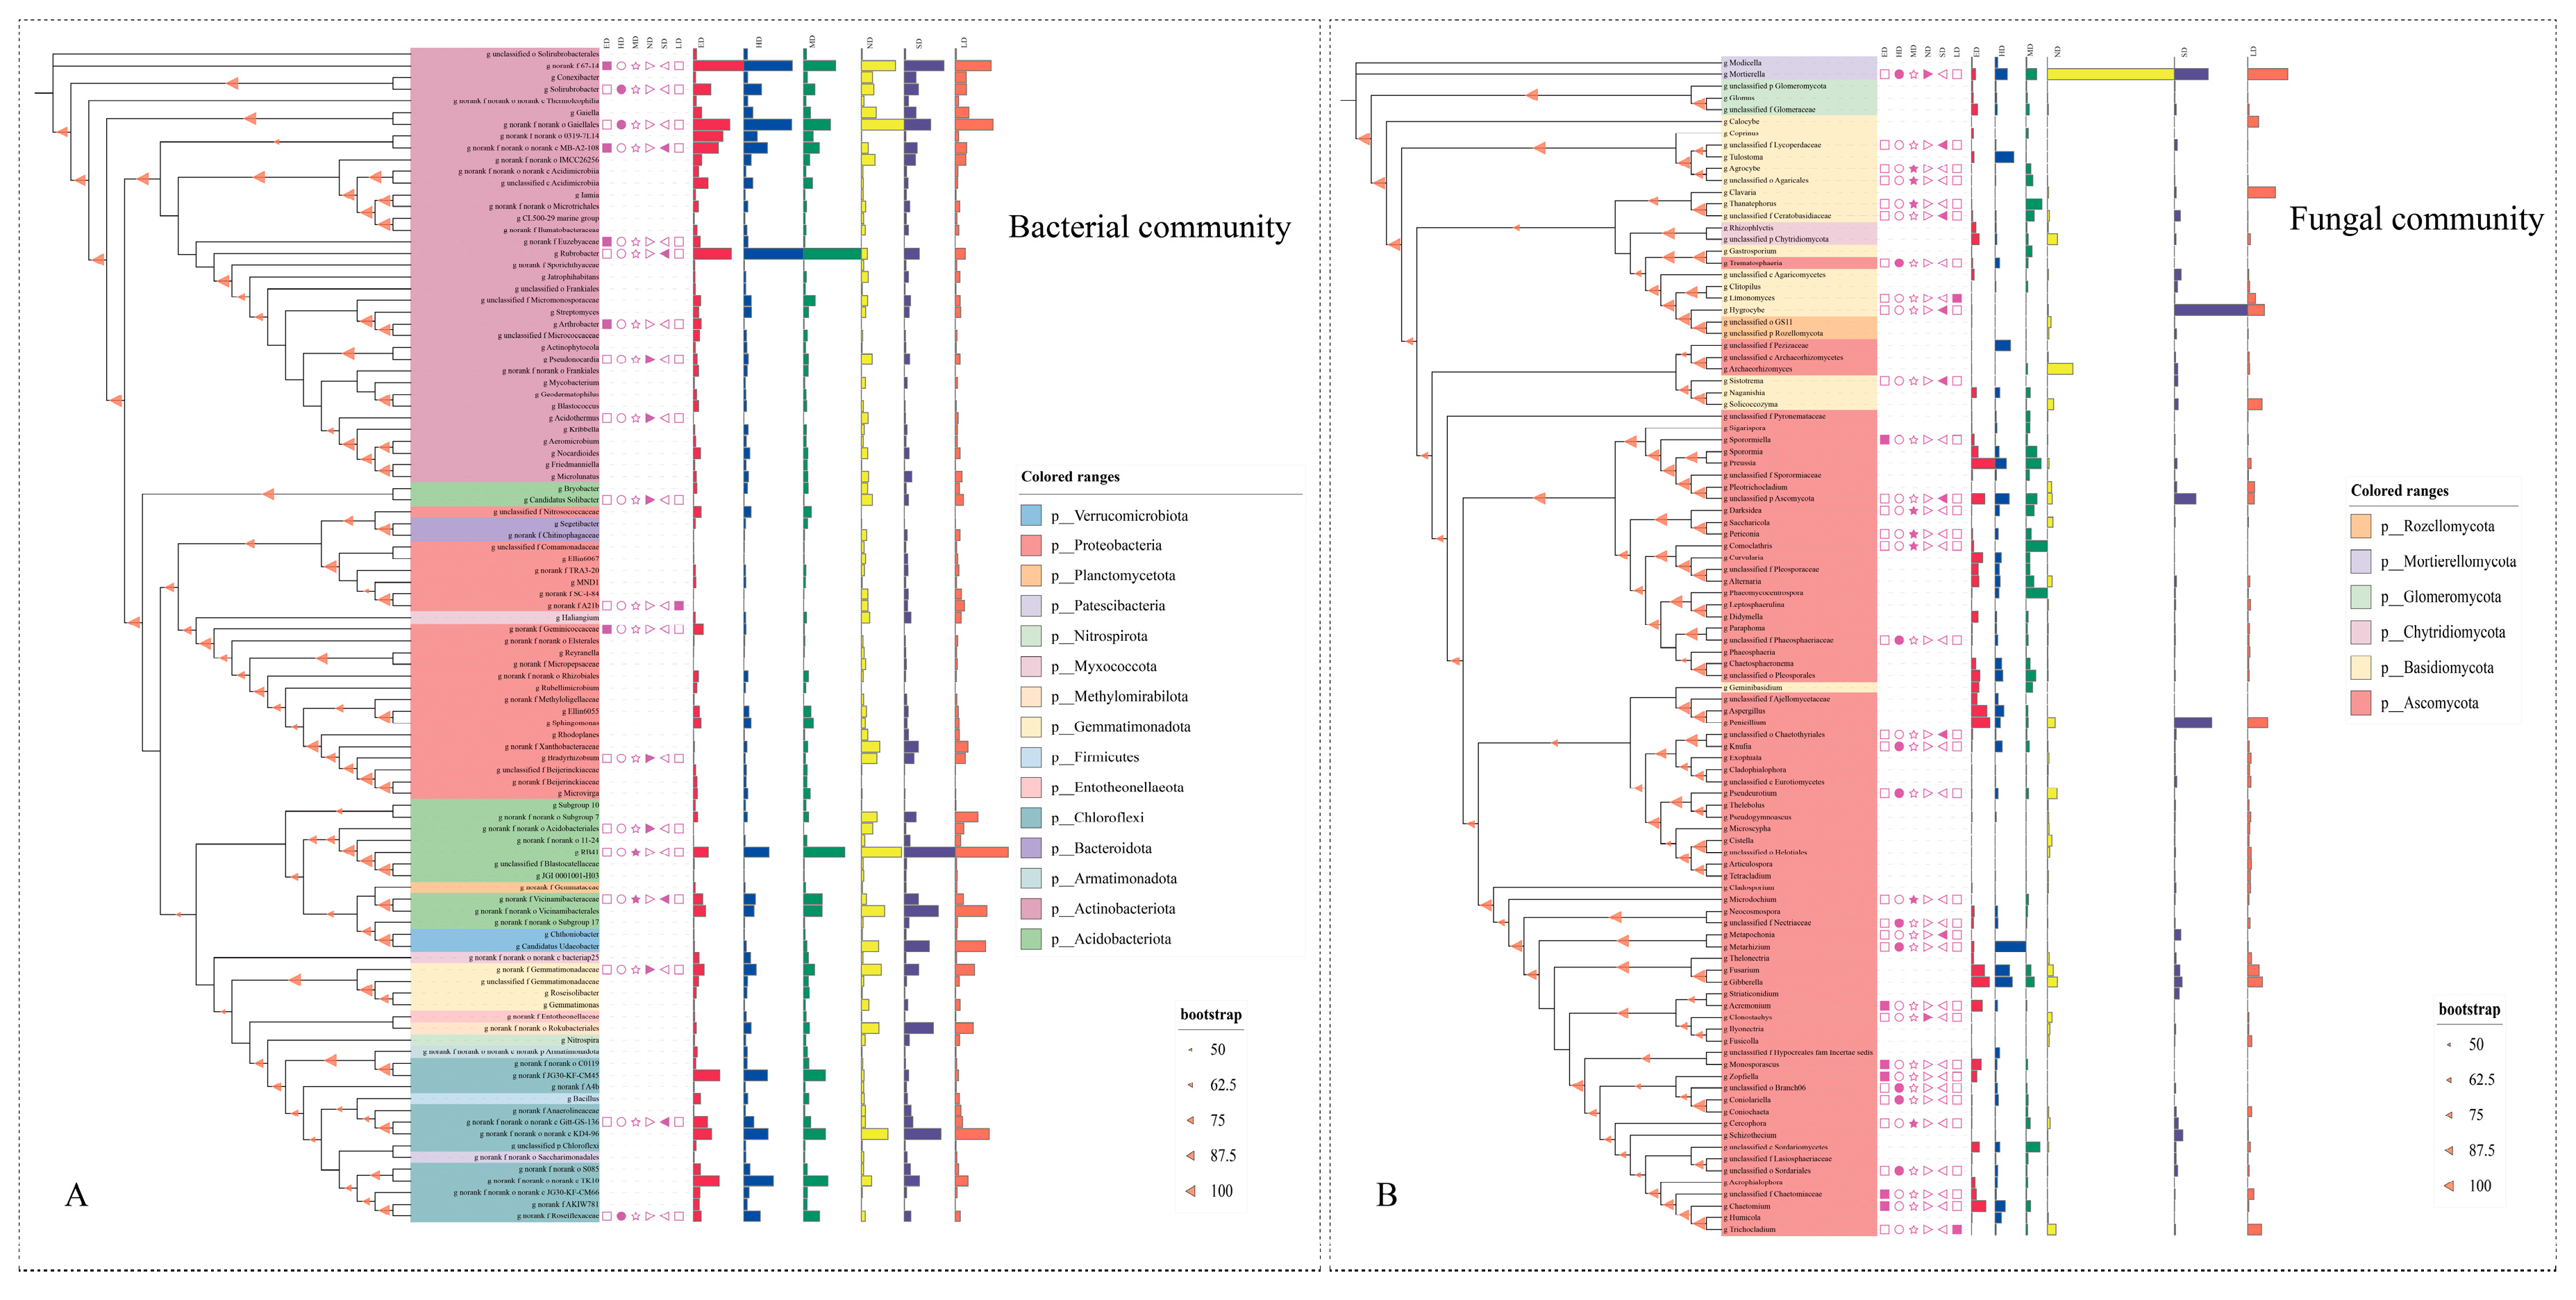
3.3. Phylogenetic Analysis

The phylogenetic trees were constructed for the microbial genera with the top 100 relative abundance (i.e., core microbiota) through the maximum likelihood (ML) method using the IQ-TREE software. The bootstrap values of very few branches of the phylogenetic trees were below 62.5, which indicates that they had high reliability (Figure 4). The core microbiota were classified into 15 bacterial and 6 fungal phyla. Most of the bacterial genera belonged to phyla Actinobacteria (37 genera), Proteobacteria (22 genera), Acidobacteriota (12 genera) and Chloroflexi (12 genera), accounting for 83% of the core microorganisms (Figure 4A). Most of the fungal genera gathered in phyla Ascomycota (73 genera) and Basidiomycota (18 genera); the rest belonged to Chytridiomycota (2 genera), Glomeromycota (3 genera), Mortierellomycota (2 genera) and Rozellomycota (2 genera) (Figure 4B). Furthermore, there were 19 bacterial genera and 34 fungal genera with significant differences in the core microbiota. The four most abundant bacterial genera were g_norank_f_67-14, RB41, g_norank_f_norank_o_Gaiellales and Rubrobacter, which all demonstrated significant differences at different gradients of grassland degradation and comprised ~23.88% of the core bacterial communities, on average. Several core bacteria showed preferences to a specific degraded grassland habitat. The abundances of Rubrobacter, g_unclassified_f_Nitrosococcaceae and g_norank_f_JG30-KF-CM45 in the serious grassland degradation sites (ED, HD and MD) were obviously higher than that in the less grassland degradation sites (SD and LD) and non-degraded grassland. However, Candidatus, g_norank_f_A21b, g_norank_f_norank_o_Acidobacteriales and g_norank_f_Micropepsaceae showed the opposite results (Figure 4A). The four most abundant fungal genera were Mortierella, Hygrocybe, Penicillium and Gibberella, which comprised ~27.28% of the core fungal communities, on average. The first two genera had significant differences at different gradients of grassland degradation, but the latter two did not show significant differences. There were 20 genera did not appear in special habitats, among them the Calocybe was found only in the lightly degraded grasslands, and almost all Agrocybe were enriched in moderately degraded grasslands (Figure 4B).

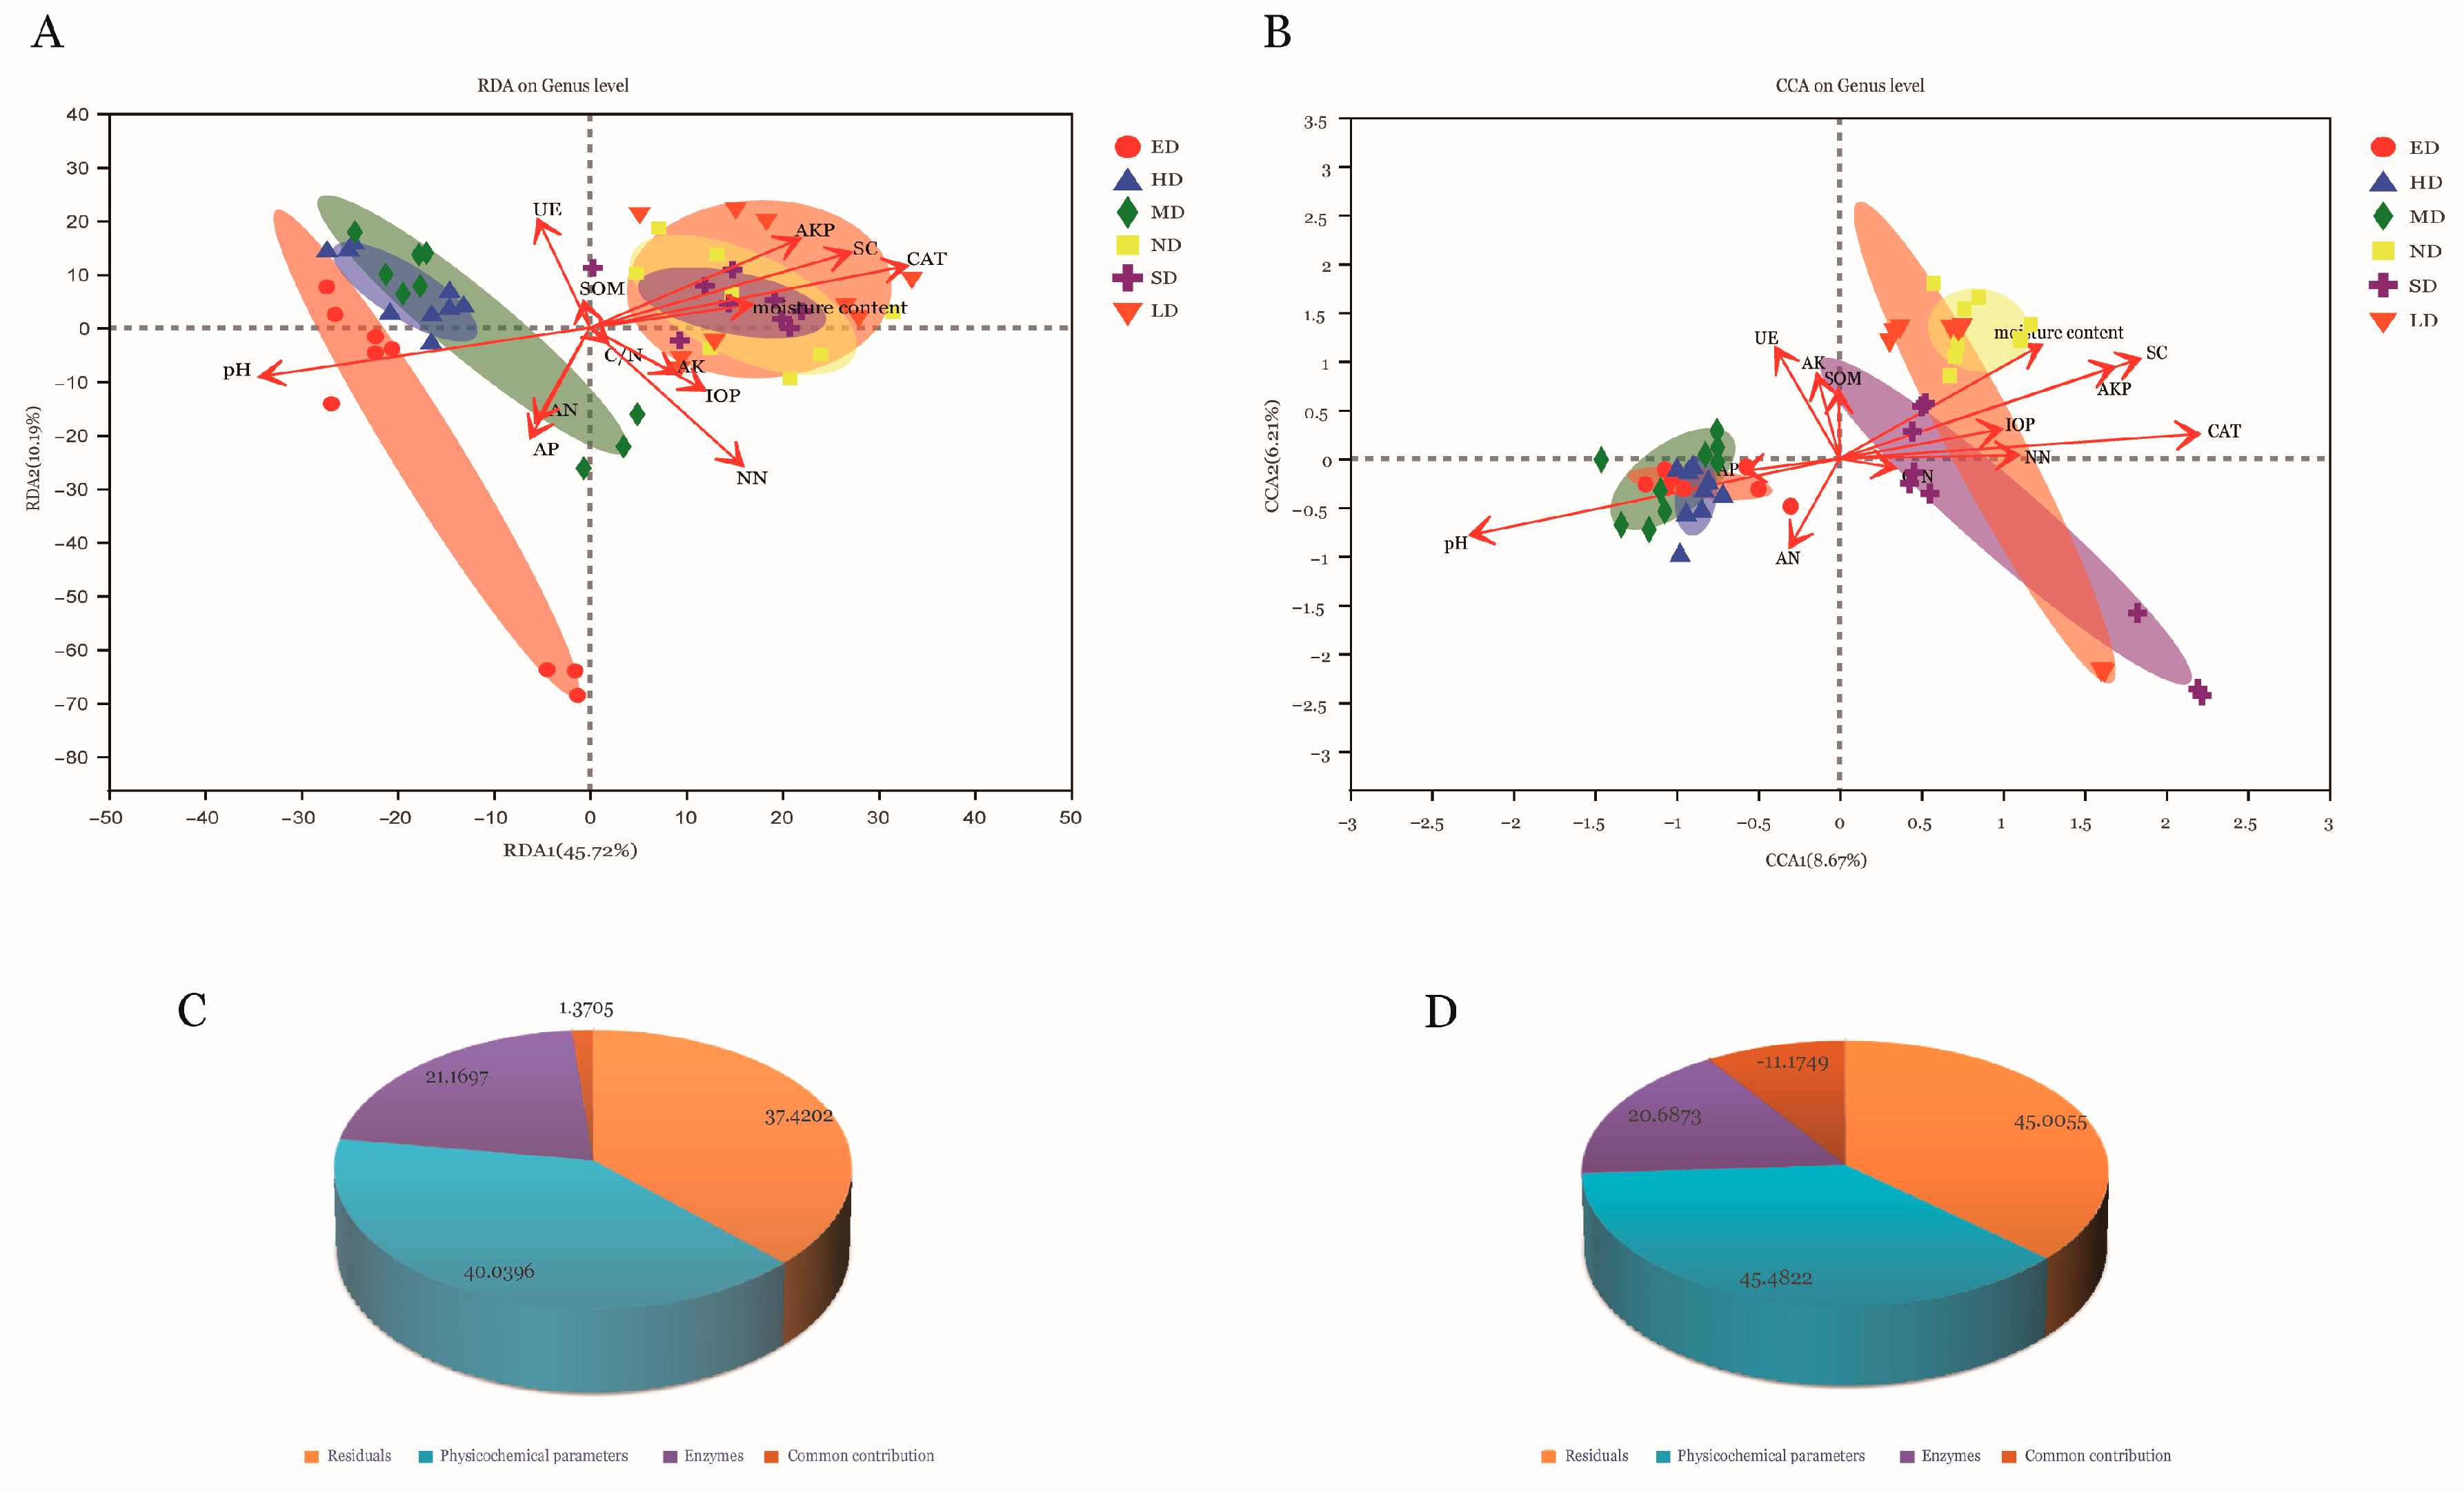
3.4. Relationships between Microbial Community Structures and Environmental Factors

Environmental factors were selected through the variance inflation factor (VIF) analysis, and TN, TC, TH, TS, C/H, TP, OP, ACP and NP were removed from the following analysis with p > 0.05 or VIF > 20. The difference in the soil environmental factors and enzyme activities had a certain effect on the composition of soil microbial communities under different vegetation types in the study area (Figure 5A,B). In the serious grassland degradation sites (ED, HD and MD), soil bacterial and fungal communities were positively correlated with pH at the genus level. Additionally, in the less degraded grassland sites (SD and LD) and non-degraded grassland, soil microbial communities had a positive correlation with moisture content, SC, AKP, CAT, IOP and NN (the latter two indices were limited to the soil fungal community). It is worth noting that in the seriously degraded grasslands, the composition of the soil bacterial community had a clear ecological succession trend correlated with the change in soil pH with the increase in soil degradation gradients.
The Variation Partition Analysis (VPA) was used to quantitatively evaluate the interpretation degree of environmental factors for the microbial community differences. The independent interpretation degree of soil physicochemical parameters for the differences in the soil bacterial communities was 40.04%, and the independent interpretation degree of the soil enzymes was 21.17%, while the common interpretation degree was 1.37%, and the remaining interpretation degree was 37.24% (Figure 5C). Additionally, the independent interpretation degrees of the soil physicochemical parameters and enzymes for the soil fungal communities’ differences were 45.48% and 20.69%, and the remaining interpretation degree was 45.01%. The results confirmed that there were many factors affecting the difference in the soil microbial community, among which soil physicochemical parameters and enzymes were the main indicators.

4. Discussion

4.1. Changes in the Soil Microbial Communities at Different Grassland Degradation Gradients

The soil microbiome has an important impact on the formation and development of soil, material circulation and the decomposition of organic matter, and can regulate plant growth, degrade organic pesticides and industrial wastes and play an important role in aboveground ecosystem and environment. Soil microbial composition and diversity are also affected by many factors, such as aboveground vegetation diversity and soil environmental factors [16,25]. Previous reports have shown distinct responses in the soil bacterial and fungal communities under environmental disturbance and differences in climatic factor [14]. The soil bacteria were the main direct indicators of soil multifunctionality, which had great significance for the protection and restoration of degraded terrestrial ecosystems [26]. However, little research has been carried out on the changes in soil microbial communities between different grassland degradation gradients, especially in Mongolia as a less studied area. From the results of α diversity data, it could be inferred that soil fungi were more closely related to aboveground vegetation than bacteria (Table S2). The α diversity indices of soil fungi in the non-degraded grassland and less grassland degradation sites (SD and LD) were significantly higher than those in the serious grassland degradation sites, but this was not the case for soil bacteria. The reason for this may be that in the early stage of plant organism decomposition, fungi are more active than bacteria and actinomycetes [27]. In addition, some fungi coexist with plants.
In the study of ecosystem, biodiversity and its evolution have always been a hot field and focus of attention. Due to adverse natural factors, such as drought, sandstorms, groundwater resource loss caused by mining and long-term over-grazing, the southern steppes ecological environment deteriorated, with the land exhibiting varying degrees of grassland degradation and being threatened by desertification over many years [28]. The focus of soil microorganisms has also increased significantly, which plays an important role in the global biogeochemical cycle and the evolution of terrestrial ecosystems. Our previous results showed that with the change in vegetation type and coverage, the structure of the microbial community in soil has changed in varying degrees [25]. At different grassland degradation gradients, there was no obvious difference in bacterial abundance at the OTU level, but the proportion of Actinobacteriota which was the dominant phylum, tended to increase with the increase in grassland degradation gradients. However, unlike the results of soil bacteria, the fungal species were rich in non-degraded grassland and less degraded grasslands (SD and LD) compared with the seriously degraded grasslands (ED, HD and MD), which is consistent with vegetation diversity and coverage. The proportion of dominant fungal phylum Ascomycota increased with the increase in grassland degradation gradients, and the reduced part was replaced by Mortierellomycota. The changes in the soil microbial community composition and α diversity also coincide (Figure S2). Previous studies have shown that the relative abundance of Ascomycota was higher in the rhizosphere soils affected by Fusarium wilt, while that of Mortierellomycota was higher in healthy soils [29]. In our study, the proportion of Mortierellomycota in non-degraded native meadow grassland was significantly higher than that in other sample plots, and was the lowest in the extremely degraded grassland soil. It was also observed that the composition of soil fungal communities indirectly affected the aboveground vegetation growth and changed the vegetation diversity and composition by infecting them to cause disease. The aboveground vegetation affects the composition of soil microbial communities; similarly, soil microorganisms also have an important impact on the aboveground vegetation [30].
Furthermore, we analyzed the soil microbial community’s similarity and difference at different grassland degradation gradients through principal coordinate analysis. From moderate to extreme degradation, the community composition of soil bacteria and fungi exhibited an obvious transition trend. However, there was no obvious change trend in native grassland when less degradation occurred (Figure 2). The reason for this may be the fact that the impact of less grassland degradation on aboveground vegetation is mainly reflected in the height, coverage and productivity of vegetation, and the impact on soil microorganisms is not obvious. Another possibility is that the selected study plots of non-degraded grassland and less degraded grasslands (SD and LD) have different geographical locations and different dominant vegetation components, resulting in rich and diverse microbial community compositions in soil and no obvious succession law.

4.2. Comparison of Differences and Phylogenetic Trees of Soil Microorganisms at Different Grassland Degradation Gradients

In this study, we divided results into two grassland degradation gradients according to the geographical distribution, from non-degraded grassland to lightly degraded grassland and from moderately degraded grassland to extremely degraded grassland. The differences in soil microorganisms at different grassland degradation gradients were analyzed using one-way ANOVA and LEfSe. At the genus level, there were highly significant differences in three bacterial genera and significant differences in four bacterial genera and three fungal genera among the sample plots in the study area. In addition, there were 22 bacterial genera and 47 fungal genera that were enriched significantly, which can be used as biomarkers (Figure 3). Previous studies have pointed out that the composition, abundance and diversity of soil microbial communities were highly sensitive to environmental change and perturbations, including temperature [31], soil moisture [32] and land degradation [33]. The rapid response of microbial communities to habitat changes is considered a potential indicator. Soils from the very severe desertification stage featured bacteria related to energy source utilization as potential indicators, including the genera Nitrosomonas, Pirellula, and Methylobacterium [33]. The differences in moisture increased the differences in microbial diversity and dissimilarities in microbial community structures under an ambient temperature in the Tibetan alpine steppe [34]. The precipitation directly modified the microbial community composition, increasing Actinobacteria and other bacterial phyla, while decreasing Alphaproteobacteria, Deltaproteobacteria, Betaproteobacteria and Bacteriodetes in the desert steppe ecosystem in Xisu Banner in Inner Mongolia [35].
Due to the land exhibiting varying degrees of land degradation, microbial taxa that were obviously sensitive to environmental changes at each stage (Figure 3 and Figure S3) were selected to predict soil fertility and ecosystem function during vegetation succession. Soils from seriously degraded grasslands (ED, HD and MD) featured bacteria related to biogeochemical cycling and soil development as potential indicators, including the genera RB41 (Acidobacteriota) and Solirubrobacter (Actinobacteriota) and the families Roseiflexaceae (Chloroflexi) and Vicinamibacteraceae (Acidobacteriota). The genus Bradyrhizobium (Proteobacteria) with the nitrogen fixation and hydrolysis of organic phosphorus function closely related to plant growth as potential bacterial indicator in native meadow grassland and less degraded grasslands (SD and LD). Previous studies have also shown that the most dominant genera shifted from Bacillus to RB41 in different ages of biological soil crusts (BSCs) in the revegetation in the Tengger Desert, northwest China [36]. The diversity of the actinobacterial community in the desert ecosystem was high, in which the dominant generalist genera were Gaiella, Solirubrobacter and Nocardioides; community structures were significantly affected by the environment and vegetation type in soils from arid regions [37]. Researchers [38] also used cultivation and high-throughput sequencing approaches to predict keystone species in BSCs formation microcosm experiments, and found that Acetobacteraceae, Rhodospirillaceae, Roseiflexaceae, Sphingomonadaceae and Caulobacteraceae families were dominant in both BSCs and their subsoils and mainly affected by mean annual precipitation, pH and available nutrients. The Vicinamibacteraceae family assembled in the process of sludge, wastewater treatment [39] and soil heavy metals especially Cd concentration [40], and demonstrated potential involvement in nitrogen and phosphorus removal and iron reduction. The genera Bacillus and Bradyrhizobium promoted the P conversion through microbial immobilization, employed flexible P use strategies and can be strongly activated by their nutrient preferences and environmental conditions in the soils from three steppe types across Inner Mongolia, China [41].
Similarly, the soil fungi can also be used as microbial indicators to reflect soil ecosystem function and degrees of grassland degradation. Our results revealed that the fungal genus Chaetomium (Ascomycota) presented a significant difference from moderate to extreme grassland degradation, and Trichocladium (Ascomycota) showed a significant difference from native meadow grassland to less degradation. The genus Mortierella (Mortierellomycota) showed a decreasing trend along with an increase in grassland degradation degrees in all research areas (Figure 3E,G). In the current study, the relative abundance of Ascomycota was the highest among the representative desert plant rhizosphere soils, and at the genus level, Chaetomium and several other genera constituted the main fungi identified, but their relative abundance varied between the formations [42]. The genus Trichocladium involved in lignocellulose degradation always increased in the soils mixed with fiber, cellulose and sugarcane bagasse [43]. Ascomycotes play an essential ecological role by attacking and digesting resistant plant molecules such as cellulose, lignin, keratin, and collagen. The compounds of carbon, nitrogen, and phosphorus as valuable biological building blocks locked in these plant molecules are, thus, recycled. Some strains of the genus Mortierella belong to the plant growth-promoting fungi found in the bulk soil, rhizosphere, plants tissues and extremely hostile environments, which are responsible for improving access to the bioavailable forms of P and Fe in the soils, as well as the synthesis of phytohormones and 1-aminocyclopropane-1-carboxylate deaminase [44]. In short, these selected genera can be used as potential bacterial and fungal indicators for monitoring and assessing the growth status of aboveground vegetation and varying degrees of land degradation.
In recent years, many studies have focused on the core microbiome to describe the relationship between microbial communities and host plants [25,45], which is important for understanding the stable, consistent components across complex microbial assemblages [46], but the functional contributions of the soil core microbiome in the process of grassland degradation succession have been poorly characterized. In order to comprehend the functions of soil microorganisms at different grassland degradation gradients, we studied the phylogenetic relationship of core microbiota and microbial genera with significant differences (Figure 4). The abundance of soil Rubrobacter was decreased from moderate to extreme degradation, but was obviously higher than the native meadow steppe and less degraded grassland, which are known for their multi-extremophilic growth conditions, such as high radiation-resistance, halotolerance and thermotolerance, or even thermophilic growth conditions. Recent studies have demonstrated that Rubrobacter could accumulate polyhydroxyalkanoates (PHA) since PHA-related genes are widely distributed among them [47]. Our results showed that the fungal genera Mortierella, Hygrocybe, Penicillium and Gibberella were the main core fungal communities in the research areas. The genus Hygrocybe enriched in slightly degraded grassland could be used as an indicator of the beginning of grassland degradation. It is necessary to further study the metabolic function of soil core microorganisms to clarify their ecological role in the restoration and management of grassland degradation.

4.3. Relationships between Soil Microbial Community Structure and Environmental Factors

The above results indicated that the microbiological components had a great deal of variation in the different vegetation types’ soils, which are sensitive to environmental changes in the process of ecosystem succession. Understanding the drivers of microbial community stability is necessary to predict the response to the succession of grassland degradation, such as soil moisture [48], soil pH [49] and aboveground vegetation [50]. In this study, the RDA/CCA results revealed the importance of soil environmental factors in the microbial community structures (Figure 5). The soil bacterial and fungal communities in seriously degraded grasslands (ED, HD and MD) were positively correlated with soil pH, but in the native meadow grassland and less degraded grasslands (SD and LD), the bacterial communities showed positive correlations with soil moisture content, SC, AKP and CAT, and the fungal communities also showed positive correlations with IOP and NN in addition to the above physical and chemical properties. Variance partitioning analysis (VPA) was performed to evaluate the explanatory degree of environmental factor variables in soil bacterial and fungal community differences, and the explanatory degrees used in this paper exceeded 62.6 and 55, respectively (Figure 5).
Previous studies have found that soil pH is a basic indicator that can influence most soil functions [51], and the dominant factor influencing bacterial community structure [52]. The influence of pH is the main driving force in producing trends in the phylogenetic assembly of bacteria, and also influences the relative balance of stochastic and deterministic processes in successional soils [53]. Both at a continental scale and a global scale, bacterial communities were related to ecosystem type and this effect was largely related to soil pH. In this study, the soil bacterial community had a clear ecological succession trend from moderate to extreme degradation. Our results are conceptually consistent with the findings of Maestre [54] on soil microbial diversity; the soil microbial diversity reduced with the increasing of aridity (Table S2). In contrast, the soil pH was the main driving factor. This finding has been further supported by other studies on soil microbial community composition [55], in which the soil bacterial communities in the arid soil were mainly influenced by soil pH. In addition, AP and AN are also affected to various degrees.
Soil moisture is the major factor influencing the microbial community structure and enzyme activities across forest [56] and grassland ecosystems [57], which are consistently highly correlated with the microbial activity and community function. From our above results, it can be inferred that the soil microbial communities were mainly affected by soil pH in the seriously degraded grassland under severe drought stress with low vegetation coverage, and the strategy of microbial utilization of water resources may change from metabolic growth to cell survival, so as to resist the physiological stress caused by drought. However, in native meadow grassland with high vegetation coverage, when the soil moisture condition was stabilized, the microorganisms began to enter the metabolic growth stage [58] affected by many environmental factors including soil moisture content, several kinds of primary enzymatic activity, inorganic phosphorus and nitrate nitrogen, which indirectly maintained the functional stability of the ecosystem.
Soil enzymes refer to the biocatalysts produced by from the activities of plants, animals and microorganisms, which participate in various biochemical processes in soil, such as the decomposition and synthesis of humus; they can be used as essential indices to judge the intensity of soil biochemical processes and evaluate soil fertility [59]. Studies have shown that aboveground vegetation affects soil enzyme activity, which would influence the C and N cycles in soil, and then adjust the microbial community in the soil [60]. The soil bacterial community in the ecology planting of orchards was mainly influenced by catalase and sucrase, which led to the conclusion that soil nutrients and enzyme activities promoted soil bacterial content [61]. Additionally, the soil catalase activity showed a significantly positive correlation with the bacterial gene copy number in different cropping systems [62]. Alkaline phosphatase activity increased indigenous soil Saccharimonadales abundance, thereby changing the bacterial community structure and affecting the soil microbial activity [63]. These results support our findings that in the non-degraded grassland and less degraded grasslands where the function of grassland ecosystem remains relatively natural, the composition of soil microbial communities was mainly affected by soil moisture content and soil enzyme activities.

5. Conclusions

In summary, to the best of the authors’ knowledge, this is the first study to systematically evaluate and compare the soil microorganisms at different gradients of grassland degradation in Central Mongolia. The composition and diversity of soil bacterial and fungal communities at different levels of grassland degradation were significantly different. We studied the phylogenetic relationship of core microbiota and microbial genera with significant differences. Moreover, through the correlation analysis of the microbial community structure and environment factors, we obtained that the soil pH was the critical factor affecting soil microbial communities when grassland degraded seriously, and the soil microbial communities in non-degraded grassland and less degraded grasslands were mainly affected by soil moisture content and soil enzyme activities (sucrase activity, alkaline phosphatase activity and catalase activity). Our results revealed the response of soil microbial communities and their influencing factors in the degradation process of grassland. These findings will contribute to clarifying the ecological functions and roles of core microbial communities in grassland degradation succession, and provide a theoretical basis for the application of soil microorganisms in vegetation restoration, grassland desertification reduction and environmental protection.

Supplementary Materials

The following supporting information can be downloaded at:https://www.mdpi.com/article/10.3390/agriculture12091430/s1, Figure S1: The rarefaction curve analysis of the bacterial (a) and fungal (b) sequences; Figure S2: Soil microbial community barplot analysis and Venn diagrams; Figure S3: Microbial groups with significant differences at different grassland degradation gradients screened by Linear discriminant analysis effect size (LEfSe); Table S1: The coordinates of sampling sites, vegetation types, coverage, dominant species and sampling time; Table S2: Alpha-diversity indices of the soil microbial community in sampling sites.

Author Contributions

L.C.: investigation, data curation, methodology, visualization, Writing-original draft, writing-review, and editing. X.M. and M.T.: investigation. Y.Z.: Formal analysis. H.Q.: Visualization. Y.D. and J.L.: Data curation. Y.B.: funding acquisition, supervision, resourses, writing-review, and editing. All authors have read and agreed to the published version of the manuscript.

Funding

This work was financially supported by the National Natural Science Foundation of China (grant no. 31560055 and 31760005) and Science and Technology Major Project of Inner Mongolia Autonomous Region of China (grant no. zdzx2018065).

Institutional Review Board Statement

Not applicable.

Informed Consent Statement

Not applicable.

Acknowledgments

All authors are grateful to reviewers and the editor for their insightful comments and suggestions on this manuscript. We thank coordination and assistance in sampling of Joint Research Agreement between college of life sciences (mycorrhizal laboratory) of Inner Mongolia University of China and institute of general and experimental biology of Mongolian Academy of Sciences.

Conflicts of Interest

The authors declare no conflict of interest.

References

  1. Tumenjargal, S.; Fassnacht, S.R.; Venable, N.B.H.; Kingston, A.P.; Fernández-Giménez, M.E.; Batbuyan, B.; Laituri, M.J.; Kappas, M.; Adyabadam, G. Variability and change of climate extremes from indigenous herder knowledge and at meteorological stations across central Mongolia. Front. Earth Sci. 2020, 14, 286–297. [Google Scholar] [CrossRef]
  2. Kusakabe, R.; Taniguchi, T.; Goomaral, A.; Undarmaa, J.; Yamanaka, N.; Yamato, M. Arbuscular mycorrhizal fungal communities under gradients of grazing in Mongolian grasslands of different aridity. Mycorrhiza 2018, 28, 621–634. [Google Scholar] [CrossRef] [PubMed]
  3. Jamsranjav, C.; Fernandez-Gimenez, M.; Reid, R.S.; Adya, B. Opportunities to integrate herders’ indicators into formal rangeland monitoring: An example from Mongolia. Ecol. Appl. 2019, 29, e01899. [Google Scholar] [CrossRef] [PubMed]
  4. Su, N.; Jarvie, S.; Yan, Y.; Gong, X.; Li, F.; Han, P.; Zhang, Q. Landscape context determines soil fungal diversity in a fragmented habitat. CATENA 2022, 213, 106163. [Google Scholar] [CrossRef]
  5. Lladó, S.; López-Mondéjar, R.; Baldrian, P. Forest Soil Bacteria: Diversity, Involvement in Ecosystem Processes, and Response to Global Change. Microbiol. Mol. Biol. Rev. 2017, 81, e00063-16. [Google Scholar] [CrossRef]
  6. Mącik, M.; Gryta, A.; Sas-Paszt, L.; Frąc, M. The Status of Soil Microbiome as Affected by the Application of Phosphorus Biofertilizer: Fertilizer Enriched with Beneficial Bacterial Strains. Int. J. Mol. Sci. 2020, 21, 8003. [Google Scholar] [CrossRef] [PubMed]
  7. Jansson, J.K.; Hofmockel, K.S. Soil microbiomes and climate change. Nat. Rev. Microbiol. 2020, 18, 35–46. [Google Scholar] [CrossRef]
  8. Wei, H.; Wang, L.; Hassan, M.; Xie, B. Succession of the functional microbial communities and the metabolic functions in maize straw composting process. Bioresour. Technol. 2018, 256, 333–341. [Google Scholar] [CrossRef]
  9. Cui, Y.; Fang, L.; Guo, X.; Wang, X.; Wang, Y.; Li, P.; Zhang, Y.; Zhang, X. Responses of soil microbial communities to nutrient limitation in the desert-grassland ecological transition zone. Sci. Total Environ. 2018, 642, 45–55. [Google Scholar] [CrossRef]
  10. Metcalf, J.L.; Xu, Z.Z.; Weiss, S.; Lax, S.; Van Treuren, W.; Hyde, E.R.; Song, S.J.; Amir, A.; Larsen, P.; Sangwan, N.; et al. Microbial community assembly and metabolic function during mammalian corpse decomposition. Science 2016, 351, 158–162. [Google Scholar] [CrossRef] [Green Version]
  11. Xue, Y.; Kang, H.; Cui, Y.; Lu, S.; Yang, H.; Zhu, J.; Fu, Z.; Yan, C.; Wang, D. Consistent Plant and Microbe Nutrient Limitation Patterns During Natural Vegetation Restoration. Front. Plant Sci. 2022, 13, 885984. [Google Scholar] [CrossRef]
  12. Cui, H.; Sun, W.; Delgado-Baquerizo, M.; Song, W.; Ma, J.-Y.; Wang, K.; Ling, X. The effects of mowing and multi-level N fertilization on soil bacterial and fungal communities in a semiarid grassland are year-dependent. Soil Biol. Biochem. 2020, 151, 108040. [Google Scholar] [CrossRef]
  13. Chen, L.; Baoyin, T.; Minggagud, H. Effects of mowing regimes on above- and belowground biota in semi-arid grassland of northern China. J. Environ. Manag. 2020, 277, 111441. [Google Scholar] [CrossRef]
  14. Yang, X.; Zhu, K.; Loik, M.E.; Sun, W. Differential responses of soil bacteria and fungi to altered precipitation in a meadow steppe. Geoderma 2020, 384, 114812. [Google Scholar] [CrossRef]
  15. Erlandson, S.; Wei, X.; Savage, J.; Cavender-Bares, J.; Peay, K. Soil abiotic variables are more important than Salicaceae phylogeny or habitat specialization in determining soil microbial community structure. Mol. Ecol. 2018, 27, 2007–2024. [Google Scholar] [CrossRef]
  16. Nan, J.; Chao, L.; Ma, X.; Xu, D.; Mo, L.; Zhang, X.; Zhao, X.; Bao, Y. Microbial diversity in the rhizosphere soils of three Stipa species from the eastern Inner Mongolian grasslands. Glob. Ecol. Conserv. 2020, 22, e00992. [Google Scholar] [CrossRef]
  17. Toju, H.; Peay, K.G.; Yamamichi, M.; Narisawa, K.; Hiruma, K.; Naito, K.; Fukuda, S.; Ushio, M.; Nakaoka, S.; Onoda, Y.; et al. Core microbiomes for sustainable agroecosystems. Nat. Plants 2018, 4, 247–257. [Google Scholar] [CrossRef]
  18. Wan, W.; Tan, J.; Wang, Y.; Qin, Y.; He, H.; Wu, H.; Zuo, W.; He, D. Responses of the rhizosphere bacterial community in acidic crop soil to pH: Changes in diversity, composition, interaction, and function. Sci. Total Environ. 2019, 700, 134418. [Google Scholar] [CrossRef]
  19. Ramírez, P.B.; Fuentes-Alburquenque, S.; Díez, B.; Vargas, I.; Bonilla, C.A. Soil microbial community responses to labile organic carbon fractions in relation to soil type and land use along a climate gradient. Soil Biol. Biochem. 2019, 141, 107692. [Google Scholar] [CrossRef]
  20. Zhao, X.; Huang, J.; Lu, J.; Sun, Y. Study on the influence of soil microbial community on the long-term heavy metal pollution of different land use types and depth layers in mine. Ecotoxicol. Environ. Saf. 2018, 170, 218–226. [Google Scholar] [CrossRef]
  21. Zhou, C.; Heal, K.; Tigabu, M.; Xia, L.; Hu, H.; Yin, D.; Ma, X. Corrigendum to “Biochar addition to forest plantation soil enhances phosphorus availability and soil bacterial community diversity”. For. Ecol. Manag. 2020, 461, 117857. [Google Scholar] [CrossRef]
  22. Zhang, P.; Li, B.; Wu, J.; Hu, S. Invasive plants differentially affect soil biota through litter and rhizosphere pathways: A meta-analysis. Ecol. Lett. 2018, 22, 200–210. [Google Scholar] [CrossRef] [PubMed]
  23. Schloss, P.D.; Westcott, S.L.; Ryabin, T.; Hall, J.R.; Hartmann, M.; Hollister, E.B.; Lesniewski, R.A.; Oakley, B.B.; Parks, D.H.; Robinson, C.J.; et al. Introducing mothur: Open-Source, Platform-Independent, Community-Supported Software for Describing and Comparing Microbial Communities. Appl. Environ. Microbiol. 2009, 75, 7537–7541. [Google Scholar] [CrossRef] [PubMed]
  24. Daniel, P.F. Conservation evaluation and phylogenetic diversity. Biol Conserv. 1992, 61, 1–10. [Google Scholar] [CrossRef]
  25. Chen, J.; Xu, D.; Chao, L.; Liu, H.; Bao, Y. Microbial assemblages associated with the rhizosphere and endosphere of an herbage, Leymus chinensis. Microb. Biotechnol. 2020, 13, 1390–1402. [Google Scholar] [CrossRef]
  26. Liu, Q.; Zhang, Q.; Jarvie, S.; Yan, Y.; Han, P.; Liu, T.; Guo, K.; Ren, L.; Yue, K.; Wu, H.; et al. Ecosystem restoration through aerial seeding: Interacting plant–soil microbiome effects on soil multifunctionality. Land Degrad. Dev. 2021, 32, 5334–5347. [Google Scholar] [CrossRef]
  27. Marano, A.V.; Pires-Zottarelli, C.L.A.; Barrera, M.D.; Steciow, M.M.; Gleason, F.H. Diversity, role in decomposition, and succession of zoosporic fungi and straminipiles on submerged decaying leaves in a woodland stream. Hydrobiologia 2010, 659, 93–109. [Google Scholar] [CrossRef]
  28. Lee, E.-H.; Sohn, B.-J. Recent increasing trend in dust frequency over Mongolia and Inner Mongolia regions and its association with climate and surface condition change. Atmos. Environ. 2011, 45, 4611–4616. [Google Scholar] [CrossRef]
  29. Yuan, J.; Wen, T.; Zhang, H.; Zhao, M.; Penton, C.R.; Thomashow, L.S.; Shen, Q. Predicting disease occurrence with high accuracy based on soil macroecological patterns of Fusarium wilt. ISME J. 2020, 14, 2936–2950. [Google Scholar] [CrossRef]
  30. Wu, S.-H.; Huang, B.-H.; Huang, C.-L.; Li, G.; Liao, P.-C. The Aboveground Vegetation Type and Underground Soil Property Mediate the Divergence of Soil Microbiomes and the Biological Interactions. Microb. Ecol. 2017, 75, 434–446. [Google Scholar] [CrossRef]
  31. Liang, Y.; Jiang, Y.; Wang, F.; Wen, C.; Deng, Y.; Xue, K.; Qin, Y.; Yang, Y.; Wu, L.; Zhou, J.; et al. Long-term soil transplant simulating climate change with latitude significantly alters microbial temporal turnover. ISME J. 2015, 9, 2561–2572. [Google Scholar] [CrossRef]
  32. Chen, Y.; Ma, S.; Jiang, H.; Hu, Y.; Lu, X. Influences of litter diversity and soil moisture on soil microbial communities in decomposing mixed litter of alpine steppe species. Geoderma 2020, 377, 114577. [Google Scholar] [CrossRef]
  33. Fan, M.; Li, J.; Tang, Z.; Shangguan, Z. Soil bacterial community succession during desertification in a desert steppe ecosystem. Land Degrad. Dev. 2020, 31, 1662–1674. [Google Scholar] [CrossRef]
  34. Hu, Y.; Wang, S.; Niu, B.; Chen, Q.; Wang, J.; Zhao, J.; Luo, T.; Zhang, G. Effect of increasing precipitation and warming on microbial community in Tibetan alpine steppe. Environ. Res. 2020, 189, 109917. [Google Scholar] [CrossRef] [PubMed]
  35. Wang, Z.; Na, R.; Koziol, L.; Schellenberg, M.P.; Li, X.; Ta, N.; Jin, K.; Wang, H. Response of bacterial communities and plant-mediated soil processes to nitrogen deposition and precipitation in a desert steppe. Plant Soil 2020, 448, 277–297. [Google Scholar] [CrossRef]
  36. Liu, L.; Liu, Y.; Zhang, P.; Song, G.; Hui, R.; Wang, Z.; Wang, J. Development of bacterial communities in biological soil crusts along a revegetation chronosequence in the Tengger Desert, northwest China. Biogeosciences 2017, 14, 3801–3814. [Google Scholar] [CrossRef]
  37. Zhang, B.; Wu, X.; Tai, X.; Sun, L.; Wu, M.; Zhang, W.; Chen, X.; Zhang, G.; Chen, T.; Liu, G.; et al. Variation in Actinobacterial Community Composition and Potential Function in Different Soil Ecosystems Belonging to the Arid Heihe River Basin of Northwest China. Front. Microbiol. 2019, 10, 2209. [Google Scholar] [CrossRef]
  38. Tang, K.; Yuan, B.; Jia, L.; Pan, X.; Feng, F.; Jin, K. Spatial and temporal distribution of aerobic anoxygenic phototrophic bacteria: Key functional groups in biological soil crusts. Environ. Microbiol. 2021, 23, 3554–3567. [Google Scholar] [CrossRef]
  39. Kristensen, J.M.; Singleton, C.; Clegg, L.-A.; Petriglieri, F.; Nielsen, P.H. High Diversity and Functional Potential of Undescribed “Acidobacteriota” in Danish Wastewater Treatment Plants. Front. Microbiol. 2021, 12, 643950. [Google Scholar] [CrossRef]
  40. Wang, Q.; Chen, Z.; Zhao, J.; Ma, J.; Yu, Q.; Zou, P.; Lin, H.; Ma, J. Fate of heavy metals and bacterial community composition following biogas slurry application in a single rice cropping system. J. Soils Sediments 2022, 22, 968–981. [Google Scholar] [CrossRef]
  41. Zhu, X.; Zhao, X.; Lin, Q.; Li, G. Distribution Characteristics of phoD-Harbouring Bacterial Community Structure and Its Roles in Phosphorus Transformation in Steppe Soils in Northern China. J. Soil Sci. Plant Nutr. 2021, 21, 1531–1541. [Google Scholar] [CrossRef]
  42. Wei, P.; An, S.; Dong, Y.; Sun, Z.; Hou, Y.; Bieerdawulieti, X. Diversity and Community Structure of Soil Fungi in Three Typical Desert Plant Formations in the Junggar Basin, Northwest China. Eurasian Soil Sci. 2021, 54, 1945–1956. [Google Scholar] [CrossRef]
  43. Uke, A.; Nakazono-Nagaoka, E.; Chuah, J.-A.; Zain, N.-A.A.; Amir, H.-G.; Sudesh, K.; Abidin, N.Z.H.A.Z.; Hashim, Z.; Kosugi, A. Effect of decomposing oil palm trunk fibers on plant growth and soil microbial community composition. J. Environ. Manag. 2021, 295, 113050. [Google Scholar] [CrossRef] [PubMed]
  44. Ozimek, E.; Hanaka, A. Mortierella Species as the Plant Growth-Promoting Fungi Present in the Agricultural Soils. Agriculture 2020, 11, 7. [Google Scholar] [CrossRef]
  45. Ainsworth, T.D.; Krause, L.; Bridge, T.; Torda, G.; Raina, J.-B.; Zakrzewski, M.; Gates, R.D.; Padilla-Gamiño, J.L.; Spalding, H.L.; Smith, C.; et al. The coral core microbiome identifies rare bacterial taxa as ubiquitous endosymbionts. ISME J. 2015, 9, 2261–2274. [Google Scholar] [CrossRef] [PubMed]
  46. Shade, A.; Handelsman, J. Beyond the Venn diagram: The hunt for a core microbiome. Environ. Microbiol. 2011, 14, 4–12. [Google Scholar] [CrossRef]
  47. Kouřilová, X.; Schwarzerová, J.; Pernicová, I.; Sedlář, K.; Mrázová, K.; Krzyžánek, V.; Nebesářová, J.; Obruča, S. The First Insight into Polyhydroxyalkanoates Accumulation in Multi-Extremophilic Rubrobacter xylanophilus and Rubrobacter spartanus. Microorganisms 2021, 9, 909. [Google Scholar] [CrossRef]
  48. Cui, Y.; Wang, X.; Zhang, X.; Ju, W.; Duan, C.; Guo, X.; Wang, Y.; Fang, L. Soil moisture mediates microbial carbon and phosphorus metabolism during vegetation succession in a semiarid region. Soil Biol. Biochem. 2020, 147, 107814. [Google Scholar] [CrossRef]
  49. Lopes, L.D.; Hao, J.; Schachtman, D.P. Alkaline soil pH affects bulk soil, rhizosphere and root endosphere microbiomes of plants growing in a Sandhills ecosystem. FEMS Microbiol. Ecol. 2021, 97, fiab028. [Google Scholar] [CrossRef]
  50. Qiang, W.; He, L.; Zhang, Y.; Liu, B.; Liu, Y.; Liu, Q.; Pang, X. Aboveground vegetation and soil physicochemical properties jointly drive the shift of soil microbial community during subalpine secondary succession in southwest China. CATENA 2021, 202, 105251. [Google Scholar] [CrossRef]
  51. He, M.; Xiong, X.; Wang, L.; Hou, D.; Bolan, N.S.; Ok, Y.S.; Rinklebe, J.; Tsang, D.C. A critical review on performance indicators for evaluating soil biota and soil health of biochar-amended soils. J. Hazard. Mater. 2021, 414, 125378. [Google Scholar] [CrossRef]
  52. Xiong, J.; Liu, Y.; Lin, X.; Zhang, H.; Zeng, J.; Hou, J.; Yang, Y.; Yao, T.; Knight, R.; Chu, H. Geographic distance and pH drive bacterial distribution in alkaline lake sediments across Tibetan Plateau. Environ. Microbiol. 2012, 14, 2457–2466. [Google Scholar] [CrossRef]
  53. Tripathi, B.M.; Stegen, J.C.; Kim, M.; Dong, K.; Adams, J.M.; Lee, Y.K. Soil pH mediates the balance between stochastic and deterministic assembly of bacteria. ISME J. 2018, 12, 1072–1083. [Google Scholar] [CrossRef]
  54. Maestre, F.T.; Delgado-Baquerizo, M.; Jeffries, T.C.; Eldridge, D.J.; Ochoa, V.; Gozalo, B.; Quero, J.L.; García-Gómez, M.; Gallardo, A.; Ulrich, W.; et al. Increasing aridity reduces soil microbial diversity and abundance in global drylands. Proc. Natl. Acad. Sci. USA 2015, 112, 15684–15689. [Google Scholar] [CrossRef]
  55. Zhou, Z.; Yu, M.; Ding, G.; Gao, G.; He, Y.; Wang, G. Effects of Hedysarum leguminous plants on soil bacterial communities in the Mu Us Desert, northwest China. Ecol. Evol. 2020, 10, 11423–11439. [Google Scholar] [CrossRef]
  56. Brockett, B.F.; Prescott, C.E.; Grayston, S.J. Soil moisture is the major factor influencing microbial community structure and enzyme activities across seven biogeoclimatic zones in western Canada. Soil Biol. Biochem. 2012, 44, 9–20. [Google Scholar] [CrossRef]
  57. Chen, J.; Shi, W.; Cao, J. Effects of Grazing on Ecosystem CO2 Exchange in a Meadow Grassland on the Tibetan Plateau during the Growing Season. Environ. Manag. 2014, 55, 347–359. [Google Scholar] [CrossRef]
  58. Iovieno, P.; Bã¥Ã¥Th, E. Effect of drying and rewetting on bacterial growth rates in soil. FEMS Microbiol. Ecol. 2008, 65, 400–407. [Google Scholar] [CrossRef]
  59. Wang, T.; Wu, Y.; Li, Z.; Sha, X. Potential impact of active substances in non-thermal discharge plasma process on microbial community structures and enzymatic activities in uncontaminated soil. J. Hazard. Mater. 2020, 393, 122489. [Google Scholar] [CrossRef]
  60. Li, Q.; Zhang, D.; Cheng, H.; Ren, L.; Jin, X.; Fang, W.; Yan, D.; Li, Y.; Wang, Q.; Cao, A. Organic fertilizers activate soil enzyme activities and promote the recovery of soil beneficial microorganisms after dazomet fumigation. J. Environ. Manag. 2022, 309, 114666. [Google Scholar] [CrossRef]
  61. Li, T.F.; Liu, C.Y.; Jin, X.M.; Cao, X.Y.; Lin, Z.Q.; Lu, Q.; Long, M.X.; He, S.B. Effects of different cultivation strategies on soil nutrients and bacterial diversity in kiwifruit orchards. Eur. J. Hortic. Sci. 2022, 87, 1–8. [Google Scholar] [CrossRef]
  62. Yuan, Z.; Liu, H.; Han, J.; Sun, J.; Wu, X.; Yao, J. Monitoring Soil Microbial Activities in Different Cropping Systems Using Combined Methods. Pedosphere 2017, 27, 138–146. [Google Scholar] [CrossRef]
  63. Wang, G.; Jin, Z.; Wang, X.; George, T.S.; Feng, G.; Zhang, L. Simulated root exudates stimulate the abundance of Saccharimonadales to improve the alkaline phosphatase activity in maize rhizosphere. Appl. Soil Ecol. 2021, 170, 104274. [Google Scholar] [CrossRef]
Figure 1. Sampling sites distribution.
Agriculture 12 01430 g001
Figure 2. Principal coordinate analysis (PCoA) of bacterial (A) and fungal (B) communities at the OTU level based on weighted UniFrac distances. The lower right corners show the PCoA secondary grouping of the ND, SD and LD sites.
Agriculture 12 01430 g002
Figure 3. Difference significance test and linear discriminant analysis effect size (LEfSe) of the microbial communities at the genus level. Shown is the analysis of difference significance test of the bacterial (A) and fungal (E) communities between ED, HD and MD sites and that of the bacterial (C) and fungal (G) communities between ND, SD and LD (one-way ANOVA was used to check whether the mean value of samples in each group were the same, and fdr was used as multiple test correction method for p value; * p < 0.05, ** p < 0.01, *** p < 0.001). LEfSe of the bacterial (B) and fungal (F) communities between ED, HD and MD sites and that of the bacterial (D) and fungal (H) communities between ND, SD and LD with an LDA score higher than 3.5 and p values less than 0.05. Cladograms indicate that the phylogenetic distribution of microbial lineages are associated with the vegetation type. Circles represent phylogenetic levels from phylum to genus.
Agriculture 12 01430 g003
Figure 4. Phylogenetic relationships of the bacterial (A) and fungal (B) communities at the genus level (results visualized using iTOL tool). The triangles on the branches represent bootstrap values; the phylogenetic trees are colored according to phyla. The purple solid geometric patterns with different shapes represent the significantly different microbes in the six plots. The length of each bar on the right sides represents the normalized mean relative abundance of a genus.
Agriculture 12 01430 g004
Figure 5. Relationships between microbial communities at the genus level and environmental factors. (A) Redundancy analysis (RDA) of the soil bacterial community; (B) canonical correspondence analysis (CCA) of the soil fungal community; shapes of different colors represented the soil microbial communities under different vegetation types; and the environmental factors were indicated by red arrows. C/N: soil carbon-nitrogen ratio; IOP: inorganic phosphorus; AP: available phosphorus; NN: nitrate nitrogen; AN: ammonium nitrogen; AK: available potassium; SOM: soil organic matter; SC: soil sucrase activity; UE: urease activity; CAT: catalase activity; AKP: alkaline phosphatase activity. C, D: Variance partitioning analysis (VPA) of bacterial (C) and fungal (D) communities explained by soil physicochemical parameters (soil moisture, pH, C/N, IOP, AP, NN, AN, AK and SOM) and soil enzymes (SC, UE, CAT and AKP).
Agriculture 12 01430 g005
Table 1. The soil chemical/physical properties and enzyme activities at different grassland degradation gradients.
Sampling PlotMoisture ContentpHTN (%)TC (%)TH (%)TS (%)C/NC/HTP (μg/g)OP (μg/g)IOP (μg/g)
ND8.622 ± 3.926a5.680 ± 0.256c0.682 ± 0.121a7.209 ± 1.251a0.677 ± 0.080a0.051 ± 0.011a10.583 ± 0.16510.577 ± 0.863a1660.536 ± 123.743a1434.619 ± 43.680a225.917 ± 80.831
SD2.611 ± 1.950b6.360 ± 0.425b0.472 ± 0.036b4.967 ± 0.515b0.567 ± 0.073ab0.037 ± 0.003ab10.510 ± 0.3078.792 ± 0.282ab1029.349 ± 114.512b830.352 ± 136.978b198.997 ± 68.542
LD3.922 ± 2.366ab5.980 ± 0.298bc0.392 ± 0.056b4.303 ± 0.490b0.553 ± 0.028b0.030 ± 0.008bc11.024 ± 0.3267.760 ± 0.578b861.068 ± 244.441b669.989 ± 341.562b191.079 ± 110.578
MD2.100 ± 0.852b7.753 ± 0.118a0.105 ± 0.017c0.904 ± 0.121c0.237 ± 0.033c0.009 ± 0.001d8.618 ± 0.1523.836 ± 0.322c238.449 ± 104.807c174.052 ± 125.931c64.397 ± 25.675
HD2.622 ± 0.264b7.990 ± 0.022a0.106 ± 0.006c1.154 ± 0.301c0.233 ± 0.003c0.011 ± 0.002cd10.849 ± 2.4584.962 ± 1.274c341.048 ± 63.545c239.702 ± 68.063c101.346 ± 29.285
ED2.589 ± 0.594b8.160 ± 0.071a0.094 ± 0.028c1.113 ± 0.397c0.230 ± 0.042c0.016 ± 0.014cd11.597 ± 1.7664.684 ± 1.111c429.370 ± 137.407c212.954 ± 59.998c216.416 ± 84.442
Sampling plotAP (μmoL/g)NN (μg/g)AN (μg/g)AK (μg/g)SOM (%)SC (mg/d/g)UE (μg/d/g)CAT (μmoL/d/g)ACP (μmoL/d/g)NP (μmoL/d/g)AKP (μmol/d/g)
ND2.118 ± 0.9093.785 ± 1.59553.628 ± 22.62075.478 ± 23.4953.344 ± 0.780135.551 ± 16.357a456.620 ± 65.620124.001 ± 3.170a7.050 ± 0.853a6.669 ± 0.210a3.419 ± 0.354ab
SD2.406 ± 1.2813.622 ± 1.10670.126 ± 17.54769.712 ± 13.6143.034 ± 0.518162.207 ± 38.405a489.420 ± 131.136122.412 ± 1.960a5.922 ± 1.137a6.665 ± 0.129a3.787 ± 0.026a
LD1.787 ± 0.6502.606 ± 0.71439.042 ± 2.94883.691 ± 19.2613.584 ± 0.184158.168 ± 67.895a490.732 ± 75.857123.355 ± 3.178a7.604 ± 1.124a6.029 ± 0.227a2.433 ± 0.946bc
MD2.243 ± 0.3780.486 ± 0.51947.492 ± 24.45580.314 ± 40.6313.557 ± 0.52832.286 ± 10.785b495.105 ± 120.924116.635 ± 0.482b3.590 ± 0.627b1.896 ± 0.487b2.043 ± 0.621cd
HD1.798 ± 0.1061.000 ± 0.64161.944 ± 9.42750.926 ± 3.6943.297 ± 0.47528.138 ± 2.816b504.726 ± 37.677116.383 ± 0.277b2.097 ± 0.326bc0.444 ± 0.058c1.867 ± 0.083cd
ED3.286 ± 0.7224.909 ± 3.56180.648 ± 4.00873.192 ± 1.0433.056 ± 0.44125.051 ± 7.731b366.529 ± 77.990115.079 ± 0.538b1.543 ± 0.305c0.658 ± 0.448c1.095 ± 0.197d
The values were presented as mean ± standard error of mean (S.E.M). Different lowercase letters indicate significant differences at different types’ samples (p < 0.05). Abbreviation of sample plots: ND: non-degraded grassland; SD: slightly degraded grassland; LD: lightly degraded grassland; MD: moderately degraded grassland; HD: heavily degraded grassland; ED: extremely degraded grassland. Abbreviation of environmental factor: TN: total nitrogen; TC: total carbon; TH: total hydrogen; TS: total sulfur; C/N: C/N ratio; C/H: C/H ratio; TP: total phosphorus; OP: organic phosphorus; IOP: inorganic phosphorus; AP: available phosphorus; NN: nitrate nitrogen; AN: ammonium nitrogen; AK: available potassium; SOM: soil organic matter; SC: soil sucrase activity; UE: urease activity; CAT: catalase activity; ACP: soil acid phosphatase activity; NP: neutral phosphatase activity; AKP: alkaline phosphatase activity.
Publisher’s Note: MDPI stays neutral with regard to jurisdictional claims in published maps and institutional affiliations.

