Abstract
Selenium (Se) is not only an essential trace element critical for the proper functioning of an organism, but it is also an abiotic stressor that affects an organism’s growth and metabolite profile. In this study, Epichloë sp. from Festuca sinensis was exposed to increasing concentrations of Na2SeO3 (0, 0.1, and 0.2 mmol/L) in a liquid media for eight weeks. The mycelia and fermentation broth of Epichloë sp. were collected from four to eight weeks of cultivation. The mycelial biomass decreased in response to increased Se concentrations, and biomass accumulation peaked at week five. Using gas chromatography-mass spectrometry (GC-MS), approximately 157 and 197 metabolites were determined in the fermentation broth and mycelia, respectively. Diverse changes in extracellular and intracellular metabolites were observed in Epichloë sp. throughout the cultivation period in Se conditions. Some metabolites accumulated in the fermentation broth, while others decreased after different times of Se exposure compared to the control media. However, some metabolites were present at lower concentrations in the mycelia when cultivated with Se. The changes in metabolites under Se conditions were dynamic over the experimental period and were involved in amino acids, carbohydrates, organic acids, fatty acids, and nucleotides. Based on these results, we conclude that selenite concentrations and culture time influence the growth, extracellular and intracellular metabolite profiles of Epichloë sp. from F. sinensis.
1. Introduction
Selenium (Se) is an essential metalloid element that plays a key role in the biosynthesis of important selenoenzymes, such as glutathione peroxidase, deiodinase iodothyronine, and thioredoxin reductase [1]. Though microorganisms can convert inorganic selenium into less toxic and more bio-available organic forms [2,3,4], variations in selenium content and availability cause differences in microbial growth and metabolic processes [5,6,7]. Recent studies have indicated that some fungi present metabolic mechanisms to tolerate Se, including those in lipid and amino acid metabolism [8,9]. For example, Xu et al. [10] reported that 200 mmol/L of Na2SeO4 inhibits endophytic bacterial growth, though the endophyte Herbaspirillum sp. is capable of transforming Se through reduction. Based on metabolic abilities of microbes, the application of microbial agents, including endophytic microbes, may remediate Se-polluted soils.
Microorganisms often encounter fluctuations in substrate form and availability during growth, which affect their metabolism, and subsequently, their physiology. For example, Wang et al. observed dynamic ranges of intracellular and extracellular metabolites from Aspergillus niger in response to high and low glucose concentrations [11]. Additionally, some studies have verified that microbial cells secrete many metabolites into the extracellular medium without intracellular accumulation in response to environmental factors [12,13]. Metabolomic analysis is a commonly used approach in these and similar studies looking into phenotypical responses to environmental changes, as it can provide the most direct and “real-time” picture of cellular responses [14].
Endophytes do not only have to respond to the abiotic environment, but to the biological environment of their host plant. While each relationship is unique, many endophytes can promote plant growth and enhance their host’s resilience to biotic and abiotic stresses, including to excessive Se [10,15]. The endophytic species to grasses, Epichloë, is no different as it also provides protection against stresses [15,16]. To date, several studies have described the Epichloë species based on morphology, physiology, biochemical properties, and phylogenetic analyses [17,18,19,20], as well as host specificity and the species’ ability to confer resistance against stress, which has been related to host adaptability [21].
Festuca sinensis is an important perennial cool-season grass species in cool and semi-arid regions of China. This grass species is frequently infected with an asexual and beneficial Epichloë sp. Which has been shown to enhance host fitness against drought, waterlogging, cold, and pathogens [22,23,24,25,26], as well as producing alkaloids in the host tissues [27,28]. Previous studies on Epichloë sp. from F. sinensis, identified as Epichloë sinensis, have been confined to morphology, physiology, phylogeny, and bioactivity [25,29,30]. Our previous study found that different concentrations of sodium selenite (Na2SeO3) induced changes in the growth and metabolite profile of Epichloë sp. mycelia cultivated on potato dextrose agar [31]. The mechanism of fungal survival under Se conditions may be expressed in several ways, among which may be that of alterations in metabolite secretion.
This current study uses a metabolomics approach to identify the extracellular and intracellular metabolic changes that occurred in Epichloë sinensis when subjected to different Se concentrations for eight weeks. This and other works that seek to illuminate the metabolic mechanisms by which endophytes metabolize Se are critical in understanding the species’ metabolic overflow, mechanisms of Se tolerance, and their relationship to their host plants.
2. Materials and Methods
2.1. Epichloë sinensis Strain
The Epichloë endophytic strain was maintained on Potato Dextrose (PD) Agar media (potato infusion 200 g, dextrose 20 g, agar 20 g, distilled water 1000 mL), and was obtained from Key Laboratory of Medicinal Plant and Animal Resources of the Qinghai-Tibetan Plateau, Qinghai Normal University [25].
2.2. Fungal Cultivation
Three pieces (4 mm in diameter) of mycelial agar plugs were removed from the edge of an Epichloë sinensis colony and placed into 250 mL Erlenmeyer flasks with 100 mL PD broth medium (potato infusion 200 g, dextrose 20 g, distilled water 1000 mL), and were cultivated with continuous shaking (130 r/min) for 15 days at 25 °C. Then, 5 mL of this culture was added to 250 mL culture flasks containing 95 mL fermentation medium (sucrose 30 g, yeast extract 2.5 g, peptone 1 g, distilled water 1000 mL, natural pH), supplemented with a final concentration of 0 (CK), 0.1, or 0.2 mmol/L Na2SeO3. All cultures were incubated at 25 °C, and the cultivation was carried out in triplicates for each time point. After cultivation, the cultures were centrifuged at 4000 r/min for 10 min to obtain the mycelia and fermentation broth. The mycelia were washed twice with deionized water, then immediately quenched in 200 μL pre-chilled methanol (–20 °C) and stored at –80 °C for metabolite determination.
2.3. Metabolite Extraction and Derivatization
To extract metabolites from the fermentation broth, 100 μL was aliquoted into a 1.5 mL tube, and 350 μL of pre-chilled methanol and 10 μL of an internal standard (adonitol, 0.5 mg/mL stock, Sigma-Aldrich, American) were added. Samples were vortexed for 30 s, ultrasonicated for 10 min in an ice bath, and centrifuged at 4 °C for 15 min at 10,000 r/min. Then, 100 μL of the supernatant was transferred into a fresh tube, and 30 μL was taken from each sample and pooled together to create a QC sample. All samples were dried in a vacuum concentrator without heat. The resulting pellet was resuspended in 60 μL of methoxyamine hydrochloride (TCI) (20 mg/mL in pyridine, Adamas) and incubated at 80 °C for 30 min. Afterwards, 80 μL of N,O-bis(trimethylsilyl)trifluoroacetamide (BSTFA, REGIS Technologies), containing 1% trimethylchlorosilane (TMCS, Sigma), was added to the samples and incubated at 70 °C for 1.5 h. Additionally, 5 μL of fatty acid methyl ester (FAMEs, Dr. Ehrenstorfer) (in chloroform) was added to the QC sample as it cooled to room temperature. Fermentation broth metabolites were carried out in triplicates.
For mycelium extraction, 10 mg of lyophilized mycelial material was transferred into a 2 mL tube, and 450 μL of pre-chilled 3:1 (v/v) methanol:chloroform was added and then vortexed for 30 s. The mixture was homogenized with a ball mill for 4 min at 35 Hz, ultrasonicated for 5 min in an ice bath, and then centrifuged at 4 °C for 15 min at 10,000 r/min. The supernatant was carefully transferred into a fresh tube, and 40 μL from each sample was taken and pooled into a QC sample. All samples were dried in a vacuum concentrator without heat. The pellet was resuspended in 30 μL methoxyamine hydrochloride (20 mg/mL in pyridine) and incubated for 30 min at 80 °C. Subsequently, 40 μL of the BSTFA regent (1% TMCS, v/v) was added to the samples, incubated for 1.5 h at 70 °C, and 5 μL FAMEs (in chloroform) was added to the QC sample as it cooled to room temperature. Mycelial metabolites were analyzed in duplicates.
2.4. GC-TOF-MS Analysis
The analysis was performed on an Agilent 7890 gas chromatograph system coupled with a Pegasus HT time-of-flight mass spectrometer and a DB-5MS capillary column coated with 5% diphenyl cross-linked with 95% dimethylpolysiloxane (30 m × 250 μm inner diameter, 0.25 μm film thickness, J&W Scientific, Folsom, CA, USA). A microliter of sample was injected in splitless mode. The initial temperature was kept at 50 °C for 1 min, then raised to 310 °C at a rate of 10 °C/min and maintained at 310 °C for 8 min. Helium was used as the carrier gas at a rate of 1 mL/min. The injection, transfer line, and ion source temperatures were kept at 280 °C, 280 °C, and 250 °C, respectively. Mass spectra collected in the electron impact mode with 70 eV ionization energy were recorded at 12.5 scans/s, with the m/z range of 50 to 500 after a solvent delay of 6.25 min.
2.5. Data Processing and Statistical Analysis
Chroma TOF software (4.3X, LECO) and the LECO-Fiehn Rtx5 database were used for peak extraction, baseline filtering and calibration, peak alignment, deconvolution analysis, peak identification, and integration of the peak area. Identified metabolites were verified with the help of mass spectrum and retention index. In addition, peaks detected in less than half of the quality control (QC) samples, or with >30% comparison of repeatability (RSD) in QC samples, were removed.
Internal standard for each analyzed metabolite were used to estimate relative quantifications. Multivariate analysis (MVA) was performed with the SPSS software, Version 16.0 (SPSS, Inc., Chicago, IL, USA). To assess the degree of metabolite abundance changes, and a heatmap and hierarchical clustering was constructed using Multiple Experiment Viewer (MeV) software, Version 4.9.0. Using the SPSS 16.0 software, data from mycelia or fermentation broth were compared using repeated measurement of one-way analysis of variance (ANOVA) and least significant difference (LSD) at significance levels of p < 0.05 or p < 0.001, respectively.
3. Results
3.1. Effect of Selenite Concentration on the Mycelial Dry Weight of Epichloë sinensis
Table 1 shows the growth profile of Epichloë sinensis in liquid media with and without Se. The growth rate of Epichloë sinensis decreased in the presence of increased Se concentrations. The highest biomass accumulation occurred in week 5 when the Se content in the treated group reached 0.1–0.2 mmol/L, which was 68.21–74.29% lower than that of the control group (CK).

Table 1.
Effects of Na2SeO3 concentrations on mycelial dry weight of Epichloë sinensis in liquid culture.
3.2. Identification of Metabolites and Screening for Differential Metabolites
Extracellular and intracellular metabolites were measured by GC-MS based on mass spectrum and retention index match and the following were identified: components of amino acid metabolism, glycolysis, the citric acid (TCA) cycle, organic acids, fatty acids, sugars, and sugar alcohols were identified. A total of 380 peaks and approximately 157 identified metabolites were detected in the fermentation broth samples (Figure S1, Table S1). A total of 440 peaks and approximately 197 identified metabolites were detected in mycelial samples (Figure S2, Table S2). There was a greater number of metabolites in the mycelia than the fermentation broth, though the two shared 95 metabolites (Figure 1). There were 62 and 102 metabolites unique to the fermentation broth and mycelia of Epichloë sinensis, respectively (Figure 1).
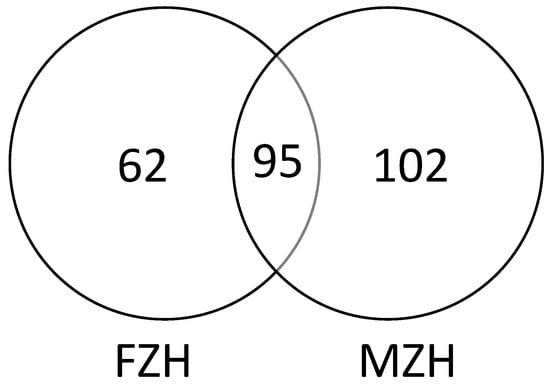
Figure 1.
Venn diagram of metabolites found in the mycelia (MZH) and the fermentation broth (FZH) of Epichloë sinensis when cultivated in liquid culture.
3.3. Principal Component Analysis of Epichloë sinensis
The differences between Se-treated samples from the fermentation broth of Epichloë sinensis at different time points ware assessed using principal component analysis (PCA) (Figure 2). The first principal component produced the greatest contribution (75.79%), and the second principal component accounted for 9.84% of the total. With this method, there was a clear distinction noted between the samples under different cultivation times and Se concentrations.
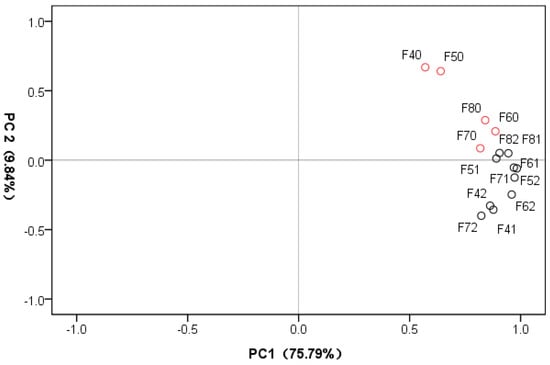
Figure 2.
Principle component analysis (PCA) score plot of first and second PCs from 15 fermentation broth samples. PC1: the first principal component; PC2: the second principal component. Red and black colors represent control and Se-treated samples, respectively.
The processing of the metabolomic data with PCA revealed clustering of mycelial samples according to Se concentration and cultivation time (Figure 3). The first and second principal components accounted for 59.42% and 8.72% of the total sample variance, respectively, indicating an apparent difference between the samples under different cultivation times and Se concentrations.
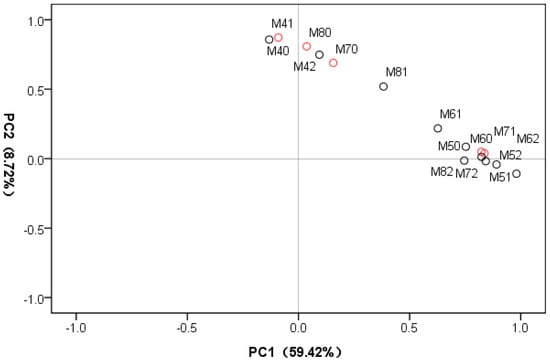
Figure 3.
Principle component analysis (PCA) score plot of first and second PCs from 15 mycelial samples. PC1: the first principal component; PC2: the second principal component. Red and black colors represent control and Se-treated samples, respectively.
3.4. Heatmap and Hierarchical Cluster Analysis of Epichloë sinensis
To identify the different metabolites in the fermentation broth samples in response to Se concentrations, metabolite profiles from 15 Epichloë sinensis samples were assessed by heatmap and hierarchical cluster analysis (Figure 4). According to hierarchical clustering analysis of the 157 identified extracellular metabolites, a clear separation was observed between samples. The 15 fermentation broth samples were grouped into three distinct categories: the first category included two samples (the control samples for 4 and 5 weeks of cultivation), the second category included four samples (the control and 0.2 mmol/L Na2SeO3 treated samples for 7 weeks of cultivation, as well as the Se-treated samples from week 4), and the third category included the remaining nine samples. Additionally, 157 metabolites were divided into two clusters consisting of 74 and 83 compounds.
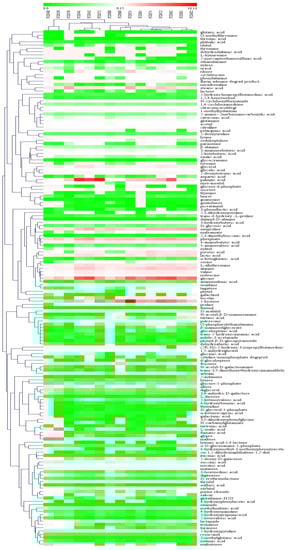
Figure 4.
Heatmap and hierarchical cluster analysis for the 157 metabolites discovered in the fermentation broth of Epichloë sinensis. FZH40, FZH41 and FZH42 represent the treated 4-week fermentation broth samples in the presence of 0, 0.1 or 0.2 mmol/L Na2SeO3, respectively. FZH50, FZH51 and FZH52 represent the treated 5-week fermentation broth samples in the presence of 0, 0.1 or 0.2 mmol/L Na2SeO3, respectively. FZH60, FZH61 and FZH62 represent the treated 6-week fermentation broth samples in the presence of 0, 0.1 or 0.2 mmol/L Na2SeO3, respectively. FZH70, FZH71 and FZH72 represent the treated 7-week fermentation broth samples in the presence of 0, 0.1 or 0.2 mmol/L Na2SeO3, respectively. FZH80, FZH81 and FZH82 represent the treated 8-week fermentation broth samples in the presence of 0, 0.1 or 0.2 mmol/L Na2SeO3, respectively.
A similar pattern was observed with the hierarchical clustering analysis of the 197 identified intracellular metabolites from the mycelia. There was again a clear separation noted between samples. Here, the 15 samples were grouped into two distinct classes: one category consisted of 5 samples (both the control and Se-treated samples for week 4, as well as control samples between weeks 7 and 8), and the other consisted of the remaining 10 samples (both the control and treated samples between weeks 5 and 6, as well as treated samples between weeks 7 and 8) (Figure 5). Likewise, 197 metabolites were divided into two groups, consisting of 60 and 137 compounds.
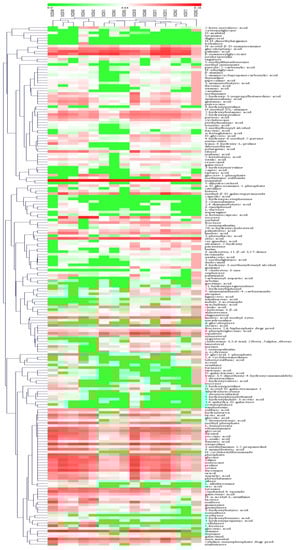
Figure 5.
Heatmap and hierarchical cluster analysis for the 197 metabolites found in the mycelia of Epichloë sinensis. MZH40, MZH41 and MZH42 represent mycelia grown for 4 weeks in the presence of 0, 0.1, or 0.2 mmol/L Na2SeO3, respectively. MZH50, MZH51 and MZH52 represent mycelia grown for 5 weeks in the presence of 0, 0.1, or 0.2 mmol/L Na2SeO3, respectively. MZH60, MZH61 and MZH62 represent mycelia grown for 6 weeks in the presence of 0, 0.1, or 0.2 mmol/L Na2SeO3, respectively. MZH70, MZH71 and MZH72 represent mycelia grown for 7 weeks in the presence of 0, 0.1, or 0.2 mmol/L Na2SeO3, respectively. MZH80, MZH81 and MZH82 represent mycelia grown for 8 weeks in the presence of 0, 0.1, or 0.2 mmol/L Na2SeO3, respectively.
3.5. Changes in the Extracellular and Intracellular Metabolite Profiles of Epichloë sinensis in Response to Selenium Conditions
The changes in identified metabolites of the fermentation broth are presented in Table 2 and Table 3. Among the 157 identified metabolites, 22 metabolites displayed differential accumulation, and 17 metabolites decreased in the 0.1 mmol/L Se group compared to the 0 mmol/L Se group (CK) (0.1 mmol/L vs. CK). Additionally, in the 0.2 mmol/L group, we observed an increase in 29 metabolites and a decrease in 13 metabolites that was not found in the CK. These findings indicated that Na2SeO3 concentrations affected metabolite responses. Parallel to the cultivation period, 67 metabolites (~43%) increased while 70 metabolites (~45%) decreased in the 4th week in both Se-treatment groups when compared to the control group (Se vs. CK). In 5 weeks of cultivation, 87 up-regulated and 58 down-regulated metabolites were detected in Se versus CK. In week 6, there were 64 up-regulated and 38 down-regulated metabolites that were present between all Se treatments and control. There were 77 compounds that were highly accumulated, and 43 compounds were suppressed in Se versus CK during 7 weeks of cultivation. In the 8th and final week of cultivation, there were 76 accumulated and 54 depleted compounds in the Se treatment groups. Here in the fermentation broth, we discovered that the extracellular samples displayed dynamic metabolic responses in terms of cultivation time and degree of Se treatments.
Table 2.
Number of increased or decreased metabolite levels among 157 identified metabolites in the fermentation broth of Epichloë sinensis Se-treated (0.1 and 0.2 mmol/L Na2SeO3) and untreated groups from 4 to 8 weeks of cultivation.
Table 3.
Changes in metabolite profiles in the fermentation broth of Epichloë sinensis between Se and control groups during weeks 4–8.
Changes in metabolites from mycelia of Epichloë sinensis between Se and control groups are shown in Table 4 and Table 5. In 0.1 mmol/L treatment group, there were 3 increased and 35 decreased metabolites compared to the control, but in the 0.2 mmol/L treatment group, there were only 2 increased and 29 decreased metabolites when compared to the control. In 4 weeks of cultivation, there were 43 up-regulated and 83 down-regulated metabolites in the Se groups when compared to the control group. In week 5, there were 21 accumulated and 98 depleted metabolites detected in Se-treated groups but not the control. In the 6th week, there were 22 up-regulated and 90 down-regulated metabolites unique to the Se-treated groups. In 7 weeks of cultivation, there were 24 up-regulated and 109 down-regulated metabolites identified in the Se-treatment groups that were not found in the control. During the last week of cultivation, there were 30 metabolites highly accumulated and 91 depleted metabolites found in the Se groups when compared to the control. The intracellular samples of Epichloë sinensis mycelia demonstrated metabolic complexity regarding cultivation time and varying degrees of Se exposure.
Table 4.
Number of increased or decreased metabolite levels among the 197 identified metabolites in the mycelia of Epichloë sinensis Se-treated (0.1 and 0.2 mmo/L Na2SeO3) and untreated groups from 4 to 8 weeks of cultivation.
Table 5.
Changes in metabolite profiles in the mycelia of Epichloë sinensis between Se and control groups during weeks 4–8.
3.6. Marked Metabolites Changed in Epichloë sinensis Fermentation Broth under Selenium Condition
To identify metabolite features in the fermentation broth that were significantly different between each treatment and the control, one-way ANOVA statistical analysis (p < 0.001) was performed. The heatmap visualized different trends of metabolite changes for each time period when exposed to Se, as well as differences when Epichloë sinensis was exposed to varying Se concentrations (Figure 6 and Figure 7). There were significant metabolite differences in the fermentation broths regarding culture time and Se concentrations. For instance, there were 64, 40, 36, 49 and 30 distinct metabolites identified in the fermentation broths collected from weeks 4, 5, 6, 7, and 8, respectively (Figure 6). The 13 common metabolites among culture times were glycine, ornithine, O-methylthreonine, allose, ribose, tagatose, threitol, pyruvic acid, 2-ketoisovaleric acid, 3-hexenedioic acid, sulfuric acid, succinic acid, and α-ketoglutaric acid.
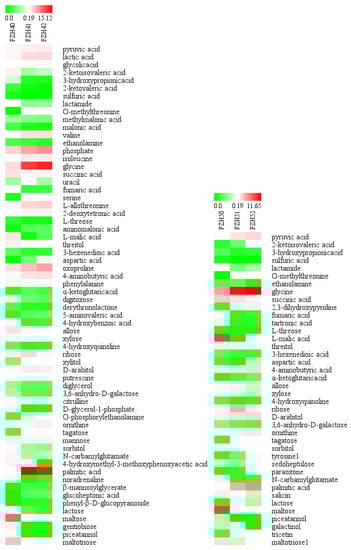
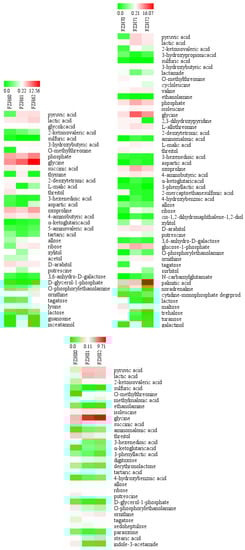
Figure 6.
Heatmap of the abundance of marked metabolites in the fermentation broth of Epichloë sinensis when exposed to Se concentrations at a given time. Red and green blocks indicate higher and lower metabolite levels, respectively (see scale bar). FZH40, FZH41, and FZH42 represent fermentation broth for week 4 in the presence of 0, 0.1, or 0.2 mmol/L Na2SeO3, respectively. FZH50, FZH51, and FZH52 represent fermentation broth for week 5 in the presence of 0, 0.1, or 0.2 mmol/L Na2SeO3, respectively. FZH60, FZH61, and FZH62 represent fermentation broth for week 6 in the presence of 0, 0.1, or 0.2 mmol/L Na2SeO3, respectively. FZH70, FZH71, and FZH72 represent fermentation broth for week 7 in the presence of 0, 0.1, or 0.2 mmol/L Na2SeO3, respectively. FZH80, FZH81, and FZH82 represent fermentation broth for week 8 in the presence of 0, 0.1, or 0.2 mmol/L Na2SeO3, respectively.
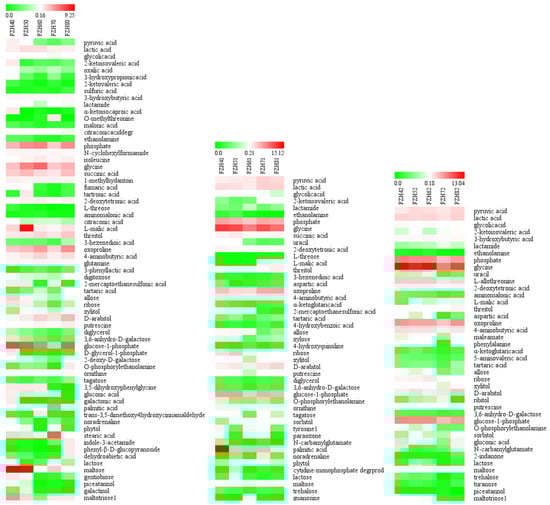
Figure 7.
Heatmap of the abundance of marked metabolites in the fermentation broth of Epichloë sinensis when exposed to 0, 0.1 or 0.2 mmol/L selenium. Red and green blocks indicate higher and lower metabolite levels (see scale bar). FZH40, FZH50, FZH60, FZH70, and FZH80 represent fermentation broth in absence of Se for weeks 4, 5, 6, 7, and 8, respectively. FZH41, FZH51, FZH61, FZH71, and FZH81 represent fermentation broth in the presence of 0.1 mmol/L Se between weeks 4 to 8. FZH42, FZH52, FZH62, FZH72, and FZH82 represent fermentation broth in the presence of 0.2 mmol/L Se during weeks 4 to 8.
At Se concentrations of 0, 0.1, and 0.2 mmol/L, we detected 67, 47 and 39 marked metabolites, respectively, in the fermentation broth using statistical analysis (p < 0.001) during the cultivation period (Figure 7). There were 25 common metabolites among Se concentrations, such as glycine, oxoproline, 4-aminobutyric acid, putrescine, lactamide, ethanolamine, O-phosphorylethanolamine, allose, ribose, D-arabitol, 3,6-anhydro-D-galactose, lactose, maltose, glucose-1-phosphate, threitol, xylitol, pyruvic acid, lactic acid, glycolic acid, 2-ketoisovaleric acid, sulfuric acid, phosphate, 2-deoxytetronic acid, L-malic acid, and tartaric acid.
The addition of 0.1 or 0.2 mmol/L Se in the medium significantly increased some amino acids found in the fermentation broth (p < 0.001). There were elevated levels of alanine and citrulline in week 4; tyrosine in week 5; serine in weeks 4 and 5; oxoproline and phenyalanine in weeks 4, 6, and 7; isoleucine in weeks 4, 7, and 8; aspartic acid in weeks 4 to 7; valine in the weeks 4, 5, 7, and 8; and glycine and ornithine throughout the course of the experiment when compared to the control. In addition to increased levels of amino acids, the concentrations of several amino acids changed with time (Figure 6). There were highly significant (p < 0.001) contributions of culture time detected for glutamine and O-methylthreonine in the control fermentation broth; proline, tyrosine, and serine in the 0.1 mmol/L Se fermentation broth; ornithine, phenylalanine, and isoleucine levels of fermentation broth under control and 0.1 or 0.2 mmol/L Se, and glycine, aspartic acid, oxoproline, 4-aminobutyric acid levels of fermentation broth with all experimental media (0–0.2 mmol/L Se). In regard to the variance observed per time period, the metabolite levels of both Se-treated fermentation broths (0.1 or 0.2 mmol/L) were the highest in the 4th week (Figure 7), though the metabolite levels from the control were the highest in weeks 6 or 8.
During the cultivation period, the fermentation broth of samples exposed to Se (0.1 and 0.2 mmol/L Na2SeO3) had higher overall levels of pyruvic acid, 2-ketoisovaleric acid, and α-ketoglutaric acid of the fermentation broth than the control medium (p < 0.001). The control, however, had higher levels of succinic acid and 3-hexenedioic acid in the fermentation broth than of all the Se-treated samples (p < 0.001). All cultures (0, 0.1, and 0.2 mmol/L Na2SeO3) exhibited significant increases of 2-ketoisovaleric acid and 3-hexenedioic acid after the 8-week cultivation period. Furthermore, the identified compounds and their concentrations were dynamic and varied with time and degree of Se exposure (Figure 7). The control group had the highest levels of pyruvic acid in the 4th week, which lowered after the 5th week, but this trend took longer in the Se-treated fermentation broths. Cultures treated with 0.1 mmol/L Se had pyruvic acid levels peak in the 7th week and tapered off in the 8th week (p < 0.001), and cultures treated with 0.2 mmol/L Se experienced a sharp increase in pyruvic acid only in the last week of cultivation (p < 0.001). A significant increase of succinic acid was observed in the 5th week in media supplemented with 0 and 0.1 mmol/L Se (p < 0.001), and no significant trend was found in cultures treated with 0.2 mmol/L Se. The untreated and 0.1 mmol/L Se samples behaved similarly again with α-ketoglutaric acid levels increasing significantly in the 4th week (p < 0.001) relative to other time points, although fermentation broth supplemented with 0.2 mmol/L Se trailed behind with markedly enhanced α-ketoglutaric acid levels observed in the 5th week (p < 0.001). Lactic acid concentrations were the highest in week 5 for the control, weeks 7 and 8 for the 0.1 mmol/L Se cultures (p < 0.001), and week 7 for the 0.2 mmol/L Se cultures. Glycolic acid concentrations in the control fermentation broth were significantly elevated between the 5th and 6th weeks of cultivation relative to other weeks (p < 0.001). Glycolic acid levels peaked sooner with Se treatment. The highest concentrations were observed in week 4 in 0.1 mmol/L Se cultures (p < 0.001), and weeks 4 and 6 for 0.2 mmol/L Se cultures (p < 0.001). There were significant increases in 2-deoxytetronic acid observed in the 6th and 4th weeks in the control and both Se-treated samples, respectively (p < 0.001). The untreated fermentation broth had significantly higher L-malic acid levels in week 5 relative to other time points (p < 0.001), while the cultures supplemented with 0.1 mmol/L Se had much more L-malic acid later in the cultivation period during weeks 7 and 8 (p < 0.001), and cultures treated with 0.2 mmol/L Se did not peak until the last week of cultivation (p < 0.001). Levels of tartaric acid in the control and 0.2 mmol/L Se-treated fermentation broths were greater in week 8 than at the beginning of the experiment (p < 0.001). The 0.1 mmol/L Se-treated fermentation broth, however, demonstrated a unique trend, where tartaric acid levels reached a minimum in the 6th week (p < 0.001).
Many sugars and sugar alcohols of fermentation broth were significantly different across the time points (p < 0.001). Se-supplemented fermentation broths significantly accumulated tagatose (p < 0.001) in comparison to the control fermentation broth, though they had greatly reduced levels of allose, ribose, and threitol. Fermentation broth for the control and 0.2 mmol/L Se showed higher allose values in the 4th week, but lower levels after the 5th week, and 0.1 mmol/L Se treated cultures had the most allose in week 5 (p < 0.001). Maltose in untreated fermentation broth peaked in 4 and 5 weeks of cultivation, whereas 0.1 mmol/L Se cultures had significantly higher concentrations in the 4th and 7th weeks. In contrast, 0.2 mmol/L Se cultures had significantly less maltose in the 7th week than before treatment or in the 8th week (p < 0.001).
Lactose in the control fermentation broth was significantly higher in week 7 than before treatment and in the final week of cultivation, though lactose in fermentation broths from both Se-treatments were the greatest in week 5 (p < 0.001). The ribose concentrations for the control, 0.1 mmol/L Se, and 0.2 mmol/L Se fermentation broths peaked in the 4th, 5th and 6th weeks, respectively (p < 0.001). The highest xylitol levels were found in the 6th and 8th weeks for the control fermentation broth, and the lowest levels were observed in the 6th and 7th weeks for 0.1 and 0.2 mmol/L Se cultures, respectively. The increase in D-arabitol in all fermentation broths was found to be the highest during the 8th week of cultivation.
3.7. Marked Metabolites Changed in the Mycelia of Epichloë sinensis under Selenium Conditions
As shown in Figure 8 and Figure 9, there were significant differences in metabolites of mycelia throughout the cultivation period and varying Se concentrations. In weeks 4, 5, 6, 7, and 8 there were 17, 27, 16, 41, and 6 distinct metabolites identified, respectively, in mycelia using LSD (p < 0.05). At Se concentrations of 0, 0.1, and 0.2 mmol/L there were 6, 18, and 44 marked metabolites found, respectively, in the mycelia at a significance level of p < 0.05. There were no commonly marked metabolites across the time points (p < 0.05) or the different Se concentrations. Over the time course, Se promoted N-acetyl-β-D-mannosamine and glucoheptonic acid levels, but inhibited 19 metabolites, such as glycolic acid, oxalic acid, 3-hydroxybutyric acid, sulfuric acid, malonic acid, hydroxyurea, dihydroxyacetone, ethanolamine, phosphate, proline, glycine, succinic acid, uracil, 2-deoxytetronic acid, 4-aminobuyric acid, 4-hydroxyphenylethanol, conduritol b epoxide, gentiobiose, and isomaltose.
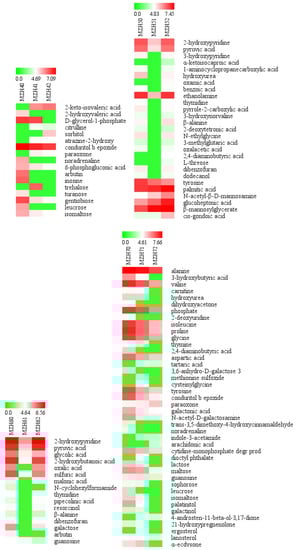
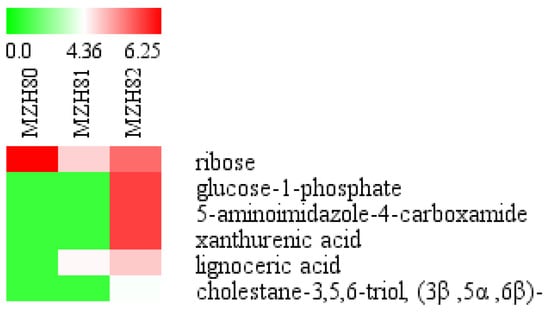
Figure 8.
Heatmap of the abundance of identified metabolites in the mycelia of Epichloë sinensis under selenium concentrations in a given cultivation time. Red and green blocks indicate higher or lower metabolite levels (see scale bar). MZH40, MZH41, and MZH42 represent mycelia grown for 4 weeks in the presence of 0, 0.1, or 0.2 mmol/L Na2SeO3, respectively. MZH50, MZH51, and MZH52 represent mycelia grown for 5 weeks in the presence of 0, 0.1, or 0.2 mmol/L Na2SeO3, respectively. MZH60, MZH61, and MZH62 represent mycelia grown for 6 weeks in the presence of 0, 0.1, or 0.2 mmol/L Na2SeO3, respectively. MZH70, MZH71, and MZH72 represent mycelia grown for 7 weeks in the presence of 0, 0.1, or 0.2 mmol/L Na2SeO3, respectively. MZH80, MZH81, and MZH82 represent mycelia grown for 8 weeks in the presence of 0, 0.1, or 0.2 mmol/L Na2SeO3, respectively.
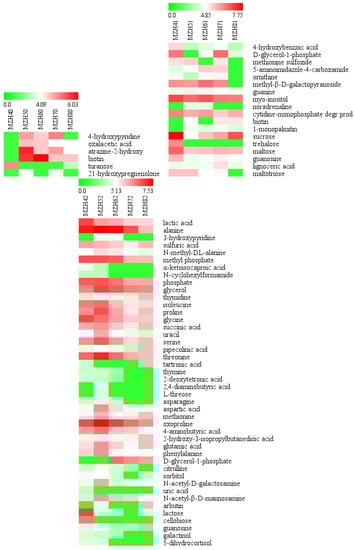
Figure 9.
Heatmap of the abundance of identified metabolites in the mycelia of Epichloë sinensis under each selenium concentration throughout weeks 4 to 8. Red and green blocks indicate higher or lower metabolite levels (see scale bar). MZH40, MZH50, MZH60, MZH70, and MZH80 represent mycelia grown in the absence of Se for 4, 5, 6, 7, and 8 weeks, respectively. MZH41, MZH51, MZH61, MZH71, and MZH81 represent mycelia grown in the presence of 0.1 mmol/L Se during weeks 4 to 8. MZH42, MZH52, MZH62, MZH72, and MZH82 represent mycelia grown in the presence of 0.2 mmol/L Se during weeks 4 to 8.
There were no differences observed in serine, homoserine, methionine, oxoproline, glutamic acid, phenylalanine, ornithine, N-methyl-alanine, and cycloleucine levels when exposed to different Se treatments at a specific time (Figure 8). When Se concentrations were 0.1 and 0.2 mmol/L, there were significant increases in only citrulline in the 4th week, but significant decreases in N-ethylglycine in the 5th week, and in tyrosine in the 5th and 7th weeks. In week 7, the levels of alanine, valine, isoleucine, proline, and asparagine found in the mycelia treated with 0.2 mmol/L Se were significantly lower than those of 0 and 0.1 mmol/L Se. Additionally, glycine, serine, threonine, and carnitine levels for 0.2 mmol/L Se-treated mycelia were lower than those of the control group. Similarly, aspartic acid levels of mycelia treated with 0.1 mmol/L Se were lower than those of the control in week 5. Time also had significant effects on ornithine levels of mycelia treated with 0.1 mmol/L Se (Figure 9), as well as alanine, valine, isoleucine, proline, glycine, serine, threonine, asparagine, aspartic acid, methionine, oxoproline, glutamic acid, phenylalanine, and citrulline levels of mycelia treated with 0.2 mmol/L Se (p < 0.05). It was also noted that these amino acid levels increased in 5 weeks of cultivation, relative to the other time points.
We found that Se concentration was a significant contributor to the changes observed in some organic acids in the mycelia (p < 0.05) (Figure 8). In both Se conditions (0.1 and 0.2 mmol/L), there were increases in 2-ketoisovaleric acid, tartaric acid, and lignoceric acid observed in the 4th, 7th, and 8th weeks, respectively. Levels of benzoic acid, galactonic acid, and 3-hydroxybutyric acid decreased in mycelia treated with 0.1 or 0.2 mmol/L Se after weeks 5 or 7, respectively. The lowest levels of oxalacetic acid were in the control mycelia (p < 0.05) and 1-monopalmitin in the 0.1 mmol/L Se-treated mycelia was observed in the 4th week for their respective groups. Additionally, in this week, lactic acid, tartronic acid, 2-deoxytetronic acid, and α-ketoisocaproic acid levels began to decrease in 0.2 mmol/L Se-treated mycelia and continued to do so until the end of the experiment. Despite the decrease in α-ketoisocaproic acid in 0.2 mmol/L Se samples, its levels were still significantly greater than those of the control or 0.1 mmol/L Se-treated mycelia, as well as cis-gondoic acid, and palmitic acid (p < 0.05) in week 5. This week also saw the lowest levels of arachidonic acid in 0.1 mmol/L Se-treated mycelia than in any other condition. In the 6th week, there were significantly depleted levels of malonic acid and pipecolinic acid in mycelia exposed to 0.1 mmol/L Se (p < 0.05). In the 7th week, 0.2 mmol/L Se treatment induced higher levels of 3-methyglutaric acid, 2-deoxytetronic acid, and oxalacetic acid levels than those of other mycelia (p < 0.05). In this time point, lignoceric acid levels peaked in the 0.1 mmol/L Se-treated mycelia. During the last week, 0.2 mmol/L Se samples showed enhanced levels of xanthurenic acid, but also the lowest levels of succinic acid and pipecolinic acid.
The presence of selenium significantly decreased levels of gentiobiose, leucrose, and turanose during weeks 4 and 5. The concentrations of maltose, isomaltose, lactose, and trehalose for 0.1 mmol/L Se-treated mycelia were equal to, or above, levels found in the control at certain time points, though galactose and ribose were significantly lower in 0.1 mmol/L Se samples than in the control mycelia in the 6th and 8th weeks, respectively. When analyzing the effect of time in intracellular sugars, mycelia treated with 0.1 mmol/L Se had significantly lower sucrose in the 5th week than in other time points, and the lowest concentration of maltotriose at the end of the experiment (p < 0.05), though there was a peak in maltose and trehalose levels in week 4. In addition, the greatest lactose and cellobiose in mycelia were found in week 4 in 0.2 mmol/L Se-treated samples.
Se concentration had significant effects (p < 0.05) on sugar alcohols at specific time points. Sorbitol was the highest in mycelia exposed to 0.2 mmol/L Se in week 4 than in any other condition. Intracellular galactinol and lanosterol levels were lower in 0.2 mmol/L Se-treated mycelia in week 7 than in the 0 and 0.1 mmol/Se samples. Ergosterol concentration of 0.1 mmol/L Se-treated mycelia were significantly higher than in the 7th week in 0 and 0.2 mmol/L Se samples. In addition to Se concentrations, time also had a significant influence on some sugar alcohols (p < 0.05). Mycelia in the presence of 0.2 mmol/L Se had the highest galactinol levels in weeks 4 and 5, but decreased throughout the experiment, and had the lowest levels in 7 and 8 weeks of cultivation. Likewise, sorbitol reached a minimum in week 7, though it increased slightly in week 8 and glycerol content peaked in the 5th and 6th weeks, but levels lowered in the subsequent weeks.
Significant effects of Se treatment were detected for some nucleotide bases and nucleosides for mycelia. While the control mycelia had an increase in inosine in the 4th week (p < 0.05), the Se-treated mycelia saw more dynamic responses throughout the cultivation period. Mycelia treated with 0.1 mmol/L Se had guanine levels increase slightly after the 4th week before falling again after the 6th week, and there was a small decrease in thymidine in week 5. Samples grown with 0.2 mmol/L Se had uracil and thymidine levels peak in week 5, though thymine levels began to decrease in weeks 4 and 5, and there was significantly less thymine in weeks 7 and 8 (p < 0.05), as well as significantly reduced levels of guanosine in week 6. In the cases of both 0.1 and 0.2 mmol/L Se culture medium, increases in guanosine were observed in week 4.
4. Discussion
The present study has shown that the changes in extracellular and intracellular metabolite profiles of Epichloë sinensis at different concentrations of Na2SeO3 during fermentation over eight weeks. Some amino acids, carbohydrates, organic acids, nucleotides, and their metabolites, especially those from the extracellular environment, were significantly changed due to selenite conditions and culture time.
Se is required for some of the normal biochemical processes in the cell, but it is known to be toxic in excess. Additionally, it is known that there are diverse fungal species that exhibit varying levels of Se tolerance [32,33,34]. Consistent with the literature, our data demonstrated that the mycelial dry weight of Epichloë sinensis decreased when exposed to increasing concentrations of Se. However, both the Se-treated and control samples experienced steady decrease in the mycelial biomass after week 5 due to insufficient energy and carbon sources. The lower biomass in Se-exposed samples, than in the control, might have been due to the stress of Se, which would also be consistent with the known toxicity of Se [34].
In the experiments described in this paper, the significant effects of Se concentration were detected in the changes of some amino acid levels of mycelia and fermentation broth of Epichloë sinensis. Some amino acids of mycelia, such as glycine and serine for the biosynthesis of glutathione, were significantly depressed with increase of Se concentration (Figure 8), but these amino acids were found in greater amounts in the fermentation broth (Figure 6), which could be beneficial for detoxification of the harmful metalloid. Concentrations of Se at 60 mg/L reduced the levels of only serine and tyrosine in Cordyceps militaris mycelia cultivated in a liquid medium, but increased other amino acids [5]. A recent study demonstrated that amino acids, such as proline, glutamine, alanine, arginine, and methionine, varied between Candida utilis and Saccharomyces cerevisiae when the culture media was enriched with 20 mg/L Se, when compared to the control [9]. Concentrations of individual amino acids depend on the presence of Se in the culture conditions, further supporting this notion [35]. In addition, our results showed that the intracellular concentrations of alanine, isoleucine, proline, glycine, serine, threonine, asparagine, aspartic acid, oxoproline, methionine, phenylalanine, citrulline, and glutamic acid found in the mycelia treated with 0.2 mmol/L Se varied markedly over time (p < 0.05), with the maximum levels observed in the 5th or the 4th weeks (Figure 9). Many extracellular amino acids showed highly significant dynamic response to low Se conditions as well. It is likely that Se contributes to the reductive environment for the catalytic efficiency of many enzymes, and, therefore, affects the biosynthesis of some amino acids. These findings demonstrate that the shifts in amino acid are affected by many factors, such as Se concentration, substrate, cultivation time, and microorganism species.
In this study, most of the organic acids from the fermentation broth that changed were dramatically decreased with the increase of Se concentration, with only a few exceptions. Pyruvic acid is a crucial intermediate metabolite of the central carbon metabolism that determines the carbon fluxes to the tricarboxylic acid (TCA) cycle. In this study, the extracellular content of pyruvic acid in Se conditions was highly significant and higher than the control media (p < 0.001). Increased pyruvic acid could be attributed to the TCA cycle. Then, an increase in α-ketoglutaric acid might influence further transformations forming ornithine, and ultimately, reducing succinic acid. However, these organic acids of TCA in mycelia showed no significant change between Se-treated samples. Undissociated organic acids are membrane permeable and can be secreted by fungi [11], which, in turn, would favor the maintenance of the intracellular pH environment. Levels of succinic acid in the control and Se-treated fermentation broths, and 0.2 mmol/L Se-treated mycelia, were at a maximum in the 5th week. Likewise, Yang et al. [36] reported similar dynamic changes in succinic acid and other TCA organic acids from the culture broth of Aspergillus saccharolyticus when cultivated under different pH conditions.
The profile of fatty acids is correlated with the duration of the cultivation period and selenium concentration [6]. C. utilis, without Se exposure, accumulated more oleic acid (C18:1), stearic acid (C18:0), palmitoleic acid (C16:1), and myristic acid (C14:0) than cultures treated with Se culture. However, Se supplementation promoted the abundances of oleic acid, palmitoleic acid, and myristic acid in S. cerevisiae [9]. Similarly, the addition of Se to the culture medium caused an increase in the C-18 fatty acid contents of S. cerevisiae [6]. Guan et al. [33] have found 90 μg/mL Se raised the concentration of arachidonic acid (C20:4) in Diasporangium jonesianum but reduced the levels of myristic acid, hexadecenoic acids (C16:1), and octadecenoic (C18:1), and slightly changed the level of other fatty acids when compared to the control group. Our data suggests that selenium at 0.1 and 0.2 mmol/L significantly increased lignoceric acid (24:0) of mycelia during the last week of an 8-week cultivation period. Additionally, Se at 0.2 mmol/L significantly increased palmitic acid (C16:0) in week 5 and arachidonic acid in week 7. During the fermentation process, few long chain fatty acids were detected in the fermentation broth, implying that long chain fatty acids mainly maintain cell membranes. There were no significant differences observed in the changes for linoleic acid (C18:2), oleic acid, stearic acid, and palmitoleic acid in Epichloë mycelia regardless of Se treatment and culture time, which might have been due to this species’ variance affecting the fluctuation of fatty acids.
Some carbohydrates are involved in maintaining the structural integrity of cells in the case of several adverse environmental conditions. Compared with the control, the carbohydrates from the mycelia are more significant in Penicillium expansum when cultivating with 20 mg/L Se [37]. The addition of 0.1 mmol/L Na2SeO3 decreases the trehalose content of S. cerevisiae [38]. In this respect, we observed that Se significantly decreased intracellular levels of gentiobiose, leucrose, and turanose in the 4th and 5th weeks. The dose of 0.1 mmol/L Se significantly increased trehalose levels in the 4th week of cultivation, but decreased galactose and ribose of mycelia in 6 and 8 weeks of cultivation, respectively. Moreover, Se highly and significantly promoted extracellular tagatose and ribose levels. Se might be playing a major role in the cell’s sugar uptake and transport. Lactobacillus reuteri CRL1101 can modulate proteins and enzymes involved in sugar synthesis or degradation to adapt to Se conditions [39]. However, different species have evolved their metabolome for specific metabolites. Trichoderma harzianum, Aureobasidium pullulans, Mortierella humilis, and Phoma glomerata treated with 1 mmol/L Na2SeO3 had distinct exopolysaccharide levels [33].
As previous studies have noted, most fungi produce sugars and sugar alcohols to facilitate tolerance to environmental stress conditions [40,41]. In the case of the fermentations described in the present study, a dose of 0.2 mmol/L Se significantly increased intracellular sorbitol in the 4th week, but decreased galactinol and lanosterol levels of mycelia in week 7 when compared to the control samples. Sorbitol can act as an alternative energy source and can protect cells against oxidative damage by scavenging free reactive oxygen radicals [42]. Perhaps this is why sorbitol was highly accumulated in the intracellular environment of Streptococcus thermophilus when in stationary phase [43]. More interestingly, some studies have shown that lanosterol, found as endophytic fungal secondary metabolites, have good medicinal potential to treat cataract diseases [44,45]. In addition, our results showed that Se significantly decreased threitol levels in the fermentation broth. In this study, dynamics of the significant changes in glycerol of mycelia under 0.2 mmol/L Se conditions over the cultivation period peaked in week 5. However, Ianutsevich et al. [46] concluded that Rhizomucor miehei increased levels of arabitol and glycerol when under osmotic stress, and no significant changes in glycerol between 3 h and 6 h were found. This might have been due to time variance affecting the mycelia metabolic capacity. Ergosterol, a vitamin D precursor, plays the pivotal role in membrane fluidity. The addition of Se to Pleurotus ostreatus and Ganoderma lucidum growth media resulted in lower levels of ergosterol in fruiting bodies when compared to the control group [47]. In this respect, ergosterol levels found in the mycelia with the addition of 0.1 mmol/L Se were significantly higher than those of other mycelia in the 7th week. Hence, it can be concluded that Se affected membrane fluidity and the stabilization of its structure.
Most purines and pyrimidines in the cell take part in the biosynthesis of genetic information carriers (DNA and RNA) or energy suppliers (ATP and GTP) [48]. In the present study, some intermediates of purine and pyrimidine metabolism of 0.1 or 0.2 mmol/L Se-treated mycelia, including thymine, inosine, 2-dioxyuridine, and guanosine, were down-regulated at certain times. There was also a greater thymidine amount detected in 0.1 mmol/L Se-exposed mycelia in 5 and 6 weeks of cultivation. The contents of adenosine in C. militaris were promoted with increase in Se concentrations [5]. Results from a study presented by Hu et al. [49] confirmed that high adenosine content was detected in C. militaris by Se, which regulated purine and pyrimidine metabolism. The results suggest that Se influences DNA and RNA synthesis throughout the entire growing period, thus interfering with mycelial metabolites. Overall, the marked metabolites of Epichloë species were affected by Se, and they were involved in the metabolic pathways, such as glycolysis, TCA cycle, amino acid, purine and pyrimidine metabolism.
5. Conclusions
In this study, we determined the dynamic intra and extracellular metabolic responses of Epichloë sinensis when exposed to varying concentrations of Se over an 8-week period (p < 0.05, p < 0.001). There were considerably fewer extracellular metabolites than what was found in the case of intracellular metabolites. Redox balance appears to drive the active secretion of some intracellular metabolites, which might have contributed to this finding. Additionally, we observed that the intracellular metabolites in the mycelia of Epichloë sinensis varied greatly when exposed to higher concentrations of Se, but the opposite was seen with extracellular metabolites, which were significantly dynamic in the absence of Se. Moreover, the results presented in this study not only deepen our knowledge of extracellular and intracellular metabolic responses of Epichloë sinensis throughout its growth, but also contribute to better understanding of the relationship between Epichloë sinensis and its host plant, F. sinensis. Further studies regarding metabolite variations, in addition to analysis of gene expression, selenium metabolites and related enzyme activities, are necessary to describe the detailed mechanism of selenium tolerance.
Supplementary Materials
The following supporting information can be downloaded at: https://www.mdpi.com/article/10.3390/agriculture12091423/s1, Figure S1: Total ion chromatogram of fermentation broth of Epichloë sinensis; Figure S2: Total ion chromatogram of mycelia of Epichloë sinensis; Table S1: List of the 157 metabolites from fermentation broth; Table S2: List of the 197 metabolites from mycelia.
Author Contributions
Conceptualization, L.Z. and H.X.; methodology, F.Q.; software, Q.L.; validation, X.M. and J.J.; formal analysis, L.Z.; data curation, X.M.; writing—original draft preparation, L.Z. and H.X.; writing—review and editing. All authors have read and agreed to the published version of the manuscript.
Funding
This research was funded by the National Natural Science Foundation of China (grant numbers 31760697) and the Science and Technology Program of Qinghai Province (grant numbers 2022-ZJ-740).
Institutional Review Board Statement
Not applicable.
Informed Consent Statement
Not applicable.
Data Availability Statement
The data presented in this study are available within the article.
Acknowledgments
We would like to thank Shanghai Biotree Biotech Co., Ltd. for the technical support of metabolome analysis.
Conflicts of Interest
The authors declare no conflict of interest.
References
- Kieliszek, M.; Błażejak, S. Current knowledge on the importance of selenium in food for living organisms: A review. Molecules 2016, 21, 609. [Google Scholar] [CrossRef] [PubMed]
- Tie, M.; Li, B.R.; Sun, T.B.; Guan, W.; Liang, Y.Q.; Li, H.W. HPLC-ICP-MS speciation of selenium in Se-cultivated Flammulina velutipes. Arab. J. Chem. 2017, 13, 416–422. [Google Scholar] [CrossRef]
- Zhao, L.; Zhao, G.H.; Zhao, Z.D.; Chen, P.; Tong, J.Y.; Hu, X.S. Selenium distribution in a Se-enriched mushroom species of the genus Ganoderma. J. Agric. Food Chem. 2004, 52, 3954–3959. [Google Scholar] [CrossRef] [PubMed]
- Kieliszek, M.; Błażejak, S.; Gientka, I.; Bzducha-Wróbel, A. Accumulation and metabolism of selenium by yeast cells. Appl. Microbiol. Biotechnol. 2015, 99, 5373–5382. [Google Scholar] [CrossRef]
- Dong, J.Z.; Lei, C.; Ai, X.R.; Wang, Y. Selenium enrichment on Cordyceps militaris link and analysis on its main active components. Appl. Biocham. Biotechnol. 2012, 166, 1215–1224. [Google Scholar] [CrossRef] [PubMed]
- Čertík, M.; Breierová, E.; Oláhová, M.; Šajbidor, J.; Márová, I. Effect of selenium on lipid alternations in pigment-forming yeasts. Food Sci. Biotechnol. 2013, 22, 45–51. [Google Scholar] [CrossRef]
- Kieliszek, M.; Błażejak, S.; Bzducha-Wróbel, A.; Kot, A.M. Effect of selenium on growth and antioxidative system of yeast cells. Mol. Biol. Rep. 2019, 46, 1797–1808. [Google Scholar] [CrossRef] [PubMed]
- Kieliszek, M.; Dourou, M. Effect of selenium on the growth and lipid accumulation of Yarrowia lipolytica yeast. Biol. Trace Elem. Res. 2021, 199, 1611–1622. [Google Scholar] [CrossRef]
- Kieliszek, M.; Błażejak, S.; Bzducha-Wróbel, A.; Kot, A.M. Effect of selenium on lipid and amino acid metabolism in yeast cells. Biol. Trace Elem. Res. 2019, 187, 316–327. [Google Scholar] [CrossRef]
- Xu, X.; Cheng, W.; Liu, X.; You, H.; Wu, G.T.; Ding, K.M.; Tu, X.L.; Yang, L.F.; Wang, Y.P.; Li, Y.D.; et al. Selenate reduction and selenium enrichment of tea by the endophytic Herbaspirillum sp. strain WT00C. Curr. Microbiol. 2020, 77, 588–601. [Google Scholar] [CrossRef] [Green Version]
- Wang, S.; Liu, P.; Shu, W.; Li, C.; Li, H.; Liu, S.S.; Xia, J.Y.; Noorman, H. Dynamic response of Aspergillus niger to single pulses of glucose with high and low concentrations. Bioresour. Bioprocess. 2019, 6, 16. [Google Scholar] [CrossRef]
- Han, T.L.; Tumanov, S.; Cannon, R.D.; Villas-Boas, S.G. Metabolic response of Candida albicans to phenylethyl alcohol under hyphae-inducing conditions. PLoS ONE 2013, 88, e71364. [Google Scholar] [CrossRef] [PubMed]
- Granucci, N.; Pinu, F.R.; Han, T.L.; Villas-Boas, S.G. Can we predict the intracellular metabolic state of a cell based in extracellular metabolite data? Mol. BioSyst. 2015, 11, 3297–3304. [Google Scholar] [CrossRef]
- Pinu, F.R.; Granucci, N.; Daniell, J.; Han, T.L.; Carneiro, S.; Rocha, I.; Nielsen, J.; Villas-Boas, S.G. Metabolite secretion in microorganisms: The theory of metabolic overflow put to the test. Metabolomics 2018, 14, 43. [Google Scholar] [CrossRef] [PubMed]
- Johnson, L.J.; de Bonth, A.C.M.; Briggs, L.R.; Caradus, J.R.; Finch, S.C.; Fleetwood, D.J.; Fletcher, L.R.; Hume, D.E.; Johnson, R.D.; Popay, A.J.; et al. The exploitation of epichloae endophytes for agricultural benefit. Fungal Divers. 2013, 60, 171–188. [Google Scholar] [CrossRef]
- Lindblom, S.D.; Wangeline, A.L.; Valdez Barillas, J.R.; Devibiss, B.; Fakra, S.C.; Pilon-Smits, E.A.H. Fungal endophyte Alternaria tenuissima can affect growth and selenium accumulation in its hyperaccumulator host Astragalus bisulcatus. Front. Plant Sci. 2018, 9, 1213. [Google Scholar] [CrossRef]
- Li, C.J.; Nan, Z.B.; Li, F. Biological and physiological characteristics of Neotyphodium gansuense symbiotic with Achnatherum inebrians. Microbiol. Res. 2008, 163, 431–440. [Google Scholar] [CrossRef]
- Leuchtmann, A.; Bacon, C.W.; Schardl, C.L.; White, J.F.; Tadych, M. Nomenclatural realignment of Neotyphodium species with genus Epichloë. Mycologia 2014, 106, 202–215. [Google Scholar] [CrossRef]
- Chen, L.; Li, X.Z.; Li, C.J.; Swoboda, G.A.; Young, C.A.; Sugawara, K.; Leuchtmann, A.; Schardl, C.L. Two distinct Epichloë species symbiotic with Achnatherum inebrians, drunken horse grass. Mycologia 2015, 107, 863–873. [Google Scholar] [CrossRef]
- Yi, M.; Hendricks, W.Q.; Kaste, J.; Charlton, N.D.; Nagabhyru, P.; Panaccione, D.G.; Young, C.A. Molecular identification and characterization of endophytes from uncultivated barley. Mycologia 2018, 110, 453–472. [Google Scholar] [CrossRef]
- Wei, M.Y.; Yin, L.J.; Jia, T.; Zhu, M.J.; Ren, A.Z.; Gao, Y.B. Responses of three endophyte fungi species isolated from natural grass to abiotic stresses. Bot. Res. 2012, 1, 1–7, (In Chinese, with English Abstract). [Google Scholar]
- Peng, Q.Q.; Li, C.J.; Song, M.L.; Nan, Z.B. Effects of seed hydropriming on growth of Festuca sinensis infected with Neotyphodium endophyte. Fungal Ecol. 2013, 6, 83–91. [Google Scholar] [CrossRef]
- Wang, J.J.; Zhou, Y.P.; Lin, W.H.; Li, M.M.; Wang, M.N.; Wang, Z.G.; Kuang, Y.; Tian, P. Effect of an Epichloë endophyte on adaptability to water stress in Festuca sinensis. Fungal Ecol. 2017, 30, 39–47. [Google Scholar] [CrossRef]
- Zhou, L.Y.; Li, C.J.; Zhang, X.X.; Johnson, R.; Bao, G.S.; Yao, X.; Chai, Q. Effects of cold shocked Epichloë infected Festuca sinensis on ergot alkaloid accumulation. Fungal Ecol. 2015, 14, 99–104. [Google Scholar] [CrossRef]
- Zhou, L.Y.; Zhang, X.X.; Li, C.J.; Christensen, M.J.; Nan, Z.B. Antifungal activity and phytochemical investigation of the asexual endophyte of Epichloë sp. from Festuca sinensis. Sci. China Life Sci. 2015, 8, 821–826. [Google Scholar] [CrossRef]
- Zhou, L.Y.; Li, C.J.; White, J.F.; Johnson, R.D. Synergism between calcium nitrate applications and fungal endophytes to increase sugar concentration in Festuca sinensis under cold stress. Peer J. 2021, 9, e10568. [Google Scholar] [CrossRef]
- Tian, P.; Kuang, Y.; Lin, W.H.; Wang, J.J.; Nan, Z.B. Shoot morphology and alkaloid content of Epichloë endophyte-Festuca sinensis associations. Crop Pasture Sci. 2018, 69, 430–438. [Google Scholar]
- Lin, W.H.; Kuang, Y.; Wang, J.J.; Duan, D.D.; Xu, W.B.; Tian, P.; Nzabanita, C.; Wang, M.N.; Li, M.M.; Ma, B.H. Effects of seasonal variation on the alkaloids of different ecotypes of Epichloë endophyte–Festuca sinensis associations. Front. Microbiol. 2019, 10, 1695. [Google Scholar] [CrossRef] [PubMed]
- Jin, W.J.; Li, C.J.; Nan, Z.B. Biological and physiological characteristics of Neotyphodium endophyte symbiotic with Festuca sinensis. Mycosystema 2009, 28, 363–369, (In Chinese, with English Abstract). [Google Scholar]
- Tian, P.; Xu, W.B.; Li, C.J.; Song, H.; Wang, M.N.; Schardl, C.L.; Nan, Z.B. Phylogenetic relationship and taxonomy of a hybrid Epichloë species symbiotic with Festuca sinensis. Mycol. Prog. 2020, 19, 1069–1081. [Google Scholar] [CrossRef]
- Zhou, L.Y.; Jiao, L.; Ju, J.S.; Ma, X.L. Effect of sodium selenite on the metabolite profile of Epichloë sp. mycelia from Festuca sinensis in solid culture. Biol. Trace Elem. Res. 2022, 1–15. [Google Scholar] [CrossRef] [PubMed]
- Guan, X.Y.; Dai, C.C.; Xu, Y.F. Enhancement of polyunsaturated fatty acid production by selenium treatment in polyunsaturated fatty acid-producing fungus. J. Am. Oil Cham. Soc. 2010, 87, 1309–1317. [Google Scholar] [CrossRef]
- Liang, X.J.; Marie-Jeanne Perez, M.A.; Nwoko, K.C.; Egbers, P.; Feldmann, J.; Csetenyi, L.; Gadd, G.M. Fungal formation of selenium and tellurium nanoparticles. Appl. Microbiol. Biot. 2019, 103, 7241–7259. [Google Scholar] [CrossRef] [PubMed] [Green Version]
- Rehan, M.; Alsohim, A.S.; El-Fadly, G.; Tisa, L.S. Detoxification and reduction of selenite to elemental red selenium by Frankia. Antonie Leeuwenhoek 2018, 112, 127–139. [Google Scholar] [CrossRef]
- Suhajda, A.; Hegóczki, J.; Janzsó, B.; Pais, I.; Vereczkey, G. Preparation of selenium yeasts I. Preparation of selenium-enriched Saccharomyces cerevisiae. J. Trace Elem. Med. Biol. 2000, 14, 43–47. [Google Scholar] [CrossRef]
- Yang, L.; Lübeck, M.; Ahring, B.K.; Lübeck, P.S. Enhanced succinic acid production in Aspergillus saccharolyticus by heterologous expression of fumarate reductase from Trypanosoma brucei. Appl. Microbiol. Biotechnol. 2016, 100, 1799–1809. [Google Scholar] [CrossRef]
- Wu, Z.L.; Yin, X.B.; Lin, Z.Q.; Bañuelos, G.S.; Yuan, L.X.; Liu, Y.; Li, M. Inhibitory effect of selenium against Penicillium expansum and its possible mechanisms of action. Curr. Microbiol. 2014, 69, 192–201. [Google Scholar] [CrossRef]
- Sharma, S.C.; Anand, M.S. Role of selenium supplementation and heat stress on trehalose and glutathione content in Saccharomyces cerevisia. Appl. Biocham. Biotechnol. 2006, 133, 1–7. [Google Scholar] [CrossRef]
- Gómez-Gómez, B.; Pérez-Corona, T.; Mozzi, F.; Pescuma, M.; Madrid, Y. Silac-based quantitative proteomic analysis of Lactobacillus reuteri CRL 1101 response to the presence of selenite and selenium nanoparticles. J. Proteomics 2019, 195, 53–65. [Google Scholar] [CrossRef]
- Ramirez, M.L.; Chulze, S.N.; Magan, N. Impact of osmotic and matric water stress on germination, growth, mycelial water potentials and endogenous accumulation of sugars and sugar alcohols by Fusarium graminearum. Mycologia 2004, 96, 470–478. [Google Scholar] [CrossRef]
- Neschi, A.; Etcheverry, M.; Magan, N. Osmotic and matric potential effects on growth and sugar alcohol and solute accumulation in Aspergillus section Flavi strains from Argentina. J. Appl. Microbiol. 2004, 96, 965–972. [Google Scholar] [CrossRef] [PubMed]
- Santivarangkna, C.; Kulozik, U.; Foerst, P. Effect of carbohydrates on the survival of Lactobacillus helveticus during vacuum drying. Lett. Appl. Microbiol. 2006, 42, 271–276. [Google Scholar] [CrossRef]
- Qiao, Y.L.; Liu, G.F.; Lv, X.P.; Fan, X.J.; Zhang, Y.J.; Meng, L.; Ai, M.Z.; Feng, Z. Metabolic pathway profiling in intracellular and extracellular environments of Streptococcus thermophilus during pH-controlled batch fermentations. Front. Microbiol. 2020, 10, 3144. [Google Scholar] [CrossRef] [PubMed]
- Zhao, L.; Chen, X.J.; Zhu, J.; Xi, Y.B.; Yang, X.; Hu, L.D.; Ouyang, H.; Patel, S.H.; Jin, X.; Lin, D.N.; et al. Lanosterol reverses protein aggregation in cataracts. Nature 2015, 523, 607–611. [Google Scholar] [CrossRef] [PubMed]
- Song, R.J.; Wang, J.L.; Sun, L.; Zhang, Y.J.; Ren, Z.H.; Zhao, B.Y.; Lu, H. The study of metabolites from fermentation culture of Alternaria oxytropis. BMC Microbiol. 2019, 19, 35. [Google Scholar] [CrossRef]
- Ianutsevich, E.A.; Danilova, O.A.; Kurilov, D.V.; Zavarzin, I.V.; Tereshina, V.M. Osmolytes and membrane lipids in adaptive response of thermophilic fungus Rhizomucor miehei to cold, osmotic and oxidative shocks. Extremophiles 2020, 24, 391–401. [Google Scholar] [CrossRef]
- Siwulski, M.; Budzyńska, S.; Rzymski, P.; Gąsecka, M.; Niedzielski, P.; Kalač, P.; Mleczek, M. The effects of germanium and selenium on growth, metalloid accumulation and ergosterol content in mushrooms: Experimental study in Pleurotus ostreatus and Ganoderma lucidum. Eur. Food Res. Tech. 2019, 245, 1799–1810. [Google Scholar] [CrossRef]
- Castellanos, M.; Wilson, D.B.; Shuler, M.L. A modular minimal cell model: Purine and pyrimidine transport and metabolism. Proc. Natl. Acad. Sci. USA 2004, 101, 6681–6686. [Google Scholar] [CrossRef]
- Hu, T.; Liang, Y.; Zhao, G.S.; Wu, W.L.; Li, H.F.; Guo, Y.B. Selenium biofortification and antioxidant activity in Cordyceps militaris supplied with aelenate, aelenite, or aelenomethionine. Biol. Trace Elem. Res. 2019, 187, 553–561. [Google Scholar] [CrossRef]
Publisher’s Note: MDPI stays neutral with regard to jurisdictional claims in published maps and institutional affiliations. |
© 2022 by the authors. Licensee MDPI, Basel, Switzerland. This article is an open access article distributed under the terms and conditions of the Creative Commons Attribution (CC BY) license (https://creativecommons.org/licenses/by/4.0/).