Article

Motor Torque Distribution Strategy for Different Tillage Modes of Agricultural Electric Tractors

Key Laboratory of Modern Agricultural Equipment and Technology of Ministry of Education, Jiangsu University, Zhengjiang 212013, China
*
Author to whom correspondence should be addressed.
Agriculture 2022, 12(9), 1373; https://doi.org/10.3390/agriculture12091373
Submission received: 25 July 2022 / Revised: 21 August 2022 / Accepted: 28 August 2022 / Published: 2 September 2022
(This article belongs to the Section Agricultural Technology)

Abstract

:
Aiming at the existing single-motor agricultural tractors, which often have a mismatch between power and working conditions and a poor operation effect under different tillage modes, this paper designs a torque allocation strategy for agricultural electric tractors under different tillage modes. Firstly, the torque is divided into basic and compensating, and a calculation model is established. Then, the Particle Swarm Optimization algorithm is used to find the optimal demand torque position, and fuzzy control rules allocate the motor torque in combination with the battery SOC. Finally, the strategy’s effectiveness in different tillage modes is verified by MATLAB/Simulink simulation and bench test. The test results show that the strategy can distribute the motor torque stably according to the load torque change and pedal opening under three PTO transitions and the plowing and rotary tillage modes. The main and speed control motors respond in about 3 s with good real-time performance. The drive wheel torque can reach 1600 N·m during plowing and rotating operation. The PTO torque can reach 60 N·m during the rotating process. The maximum torque of the output shaft can reach 150 N·m with good plowing performance. During all operations, the SOC of the battery shows a steady linear decrease, and the battery discharge has stability.

1. Introduction

China’s total mechanization rate of grain crop cultivation and harvesting has exceeded 70% [1]. Whole mechanization has become an essential guarantee of abundant grain production and harvest in China. Traditional agricultural tractors consume a large number of fossil fuels when working, which aggravates the greenhouse gas emissions and environmental degradation. The electric-driven agricultural tractors have become the typical representatives of green and intelligent [2]. In addition, the selection of battery and motor is crucial for electric tractors. Zhao et al. designed a drive control system based on the MTPA control strategy [3]. Amin et al. introduced a tractor hybrid power system, consisting of a photovoltaic system and a battery pack, to extend the operating range and reduce fuel consumption [4].
A single motor drives most pure electric tractors, but when working under complex operating conditions, a larger power is required and a dual-motor-driven electric tractor comes into existence. Wang et al. proposed a design method for a reconfigurable measurement and control system. In the hybrid mode, the battery voltage and SOC increased gradually with time, indicating that the series hybrid system was operating correctly [5]. The dual motor is at low load conditions under low load conditions and has low efficiency, which can cause energy wastage. Therefore, Chen et al. performed parameter matching and optimization [6]. Xie Bin et al. proposed a two-motor coupled drive system [7]. Wen Changkai et al. proposed an innovative design and verification method for a dual-motor power-coupled drive system, with a 12.19% increase in drive efficiency [8]. Li et al. proposed a dual-input coupled powertrain system with a significant increase in overall efficiency [9]. Liu et al. proposed a two-way coupling scheme for electric tractors, with fast response and smooth power transfer [10].
In April 2022, spring plowing entered the peak season. The market feedback of agricultural tractors showed many problems, such as poor operation effect in different tillage modes and a mismatch between power and working conditions. These problems are mainly due to the unreasonable torque distribution of motors in different tillage modes. The torque distribution strategy directly affects the power and operation performance of the agricultural dual-motor tractor. Therefore, the torque distribution strategy’s innovative design and system validation are crucial. Kim et al. developed a model for predicting the shaft torque of tractors during tillage operations [11,12,13]. Yin et al. proposed a new torque distribution control for four-wheel independent drive vehicles [14]. Mao et al. proposed a brushless DC motor, based on a sliding mode variable structure, to provide a reference for the development of domestic controllers [15]. Zhang et al. proposed a drive system with average torque [16]. Xu et al. proposed a fuzzy-logic-based torque distribution strategy with a 16.5% reduction in the maximum slip rate of the front wheel [17]. Wu et al. built a proportional load reduction limitation model, and the torque variation tended to moderate during the operation [18]. Wu et al. developed a torque management model (TMM) to avoid overload operation [19]. James et al. designed a tractor pickup torque and data acquisition system with torque values varying from 3 to 23 N·m [20].
In tractor outdoor test verification, there is a long test cycle. The experimental environment is complex and variable, with fault analysis, troubleshooting, and other shortcomings [21]. Therefore, with the help of a drum test bench to test the electric tractor, the drum test bench in the vehicle’s state cannot be disassembled for the vehicle performance indicators test. Daniele et al. designed a bench test of sensors for online monitoring of lubricant and hydraulic oil characteristics [22]. Karpat et al. designed and developed a tractor clutch, using a combination of field and bench tests to revise the tractor clutch development and verification process [23]. Huang designed a two-wheel drive system for an electric agricultural tractor with a switched reluctance motor, using a photoelectric sensor to detect the motor position and motor phase current [24]. Tao et al. provided a reference for developing indoor tractor bench testing technology in China by exploring the indoor bench testing of tractors [25].
Therefore, this paper solves the problems of poor operation effect and insufficient power during tractor transit, rotary tillage, and plowing operation, by designing the torque distribution strategies for different tillage modes of agricultural electric tractors. The main tasks to achieve this goal can be expressed as follows: (1) to establish the whole machine model of the agricultural electric tractor, refine the torque required during the operation of the agricultural tractor, and establish the model of torque calculation and torque distribution; and (2) to combine Simulink simulation, bench test, drum test bench, etc., to build a complete performance test system for the torque distribution of the agricultural electric tractor and perform torque distribution in different tillage modes.

2. Materials and Methods

2.1. Modeling of Electric Tractor Drive
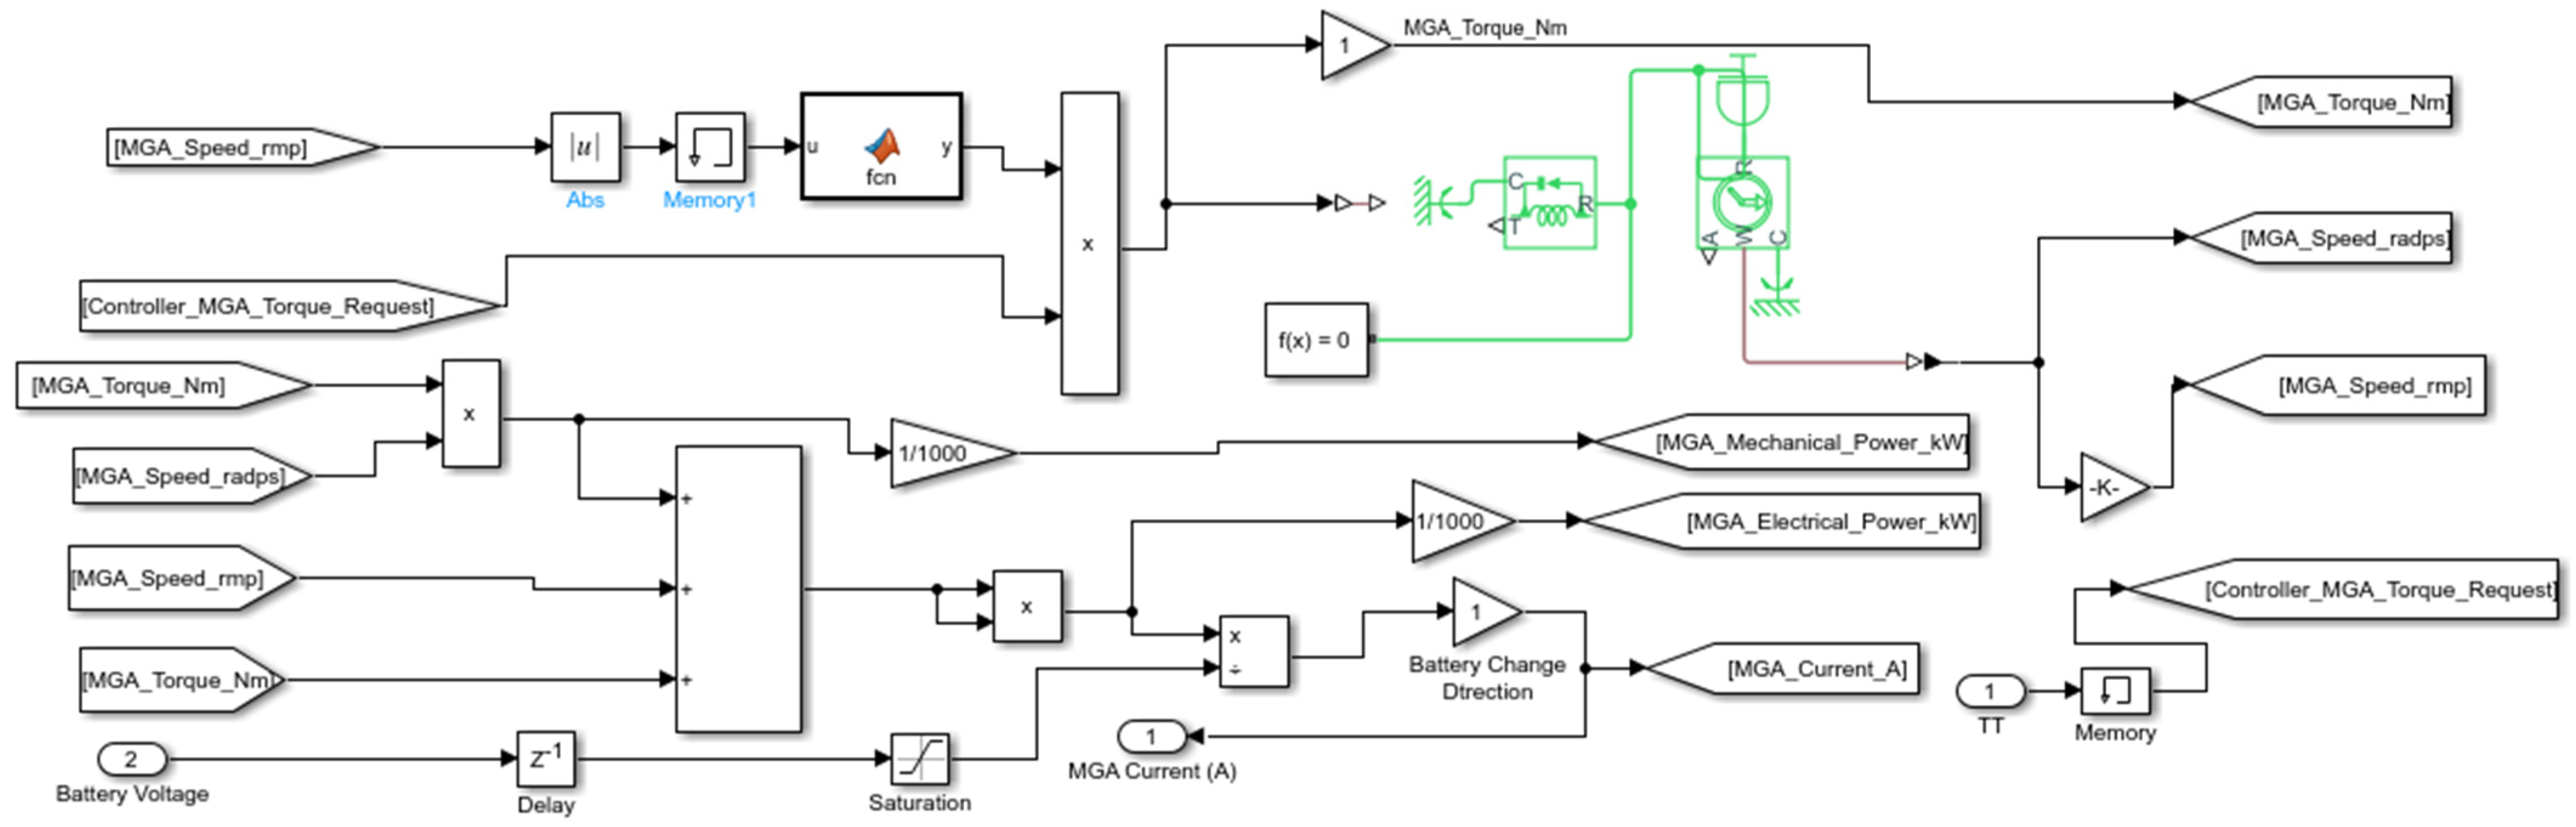
2.1.1. Motor Model

The main motors used in drive systems are DC motors, asynchronous motors, and permanent magnet brushless motors. The permanent magnet brushless electric motor has the advantages of high power density, high efficiency, ease to control, small heat production, and easy cooling. Therefore, this strategy selects a permanent magnet synchronous motor as the motor of an electric tractor.
Based on the coordinate transformation theory, Ohm’s law, etc., the terminal voltage equation of the stator winding can be obtained as
u d = R i d + d ψ d d t ω ψ q
u q = R i q + d ψ q d t ω ψ d
where ud and uq are the stator direct and alternating axis voltage (V), respectively. R is the stator winding resistance (Ω). id and iq are the stator direct and alternating axis current (A), respectively. ψd and ψq are the direct and alternating axis full magnetic chai (Wb), respectively. ω is the rotor electric angular velocity (rad/s).
The equation of the magnetic chain is
ψ d = L d i d + ψ f
ψ q = L q i q
where ψf is the magnetic chain generated by the fundamental magnetic field of the permanent magnet (Wb); Ld and Lq are the stator direct and alternating magnetic circuit lengths, respectively.
The electromagnetic torque equation is given by
T e = 3 2 P ψ f i q + L d L q i d i q
where Te is the electromagnetic torque (N·m), and p is the number of pole logs.
The mechanical equation of motion is
T L = T e J d ω m d t
where TL is the load torque (N·m), J is the rotor rotational inertia (kg·m3), and wm is the rotor mechanical angular velocity (rad/s).
Based on Equations (1)–(6), the MATLAB/Simulink simulation model of the motor is shown in Figure 1.

2.1.2. Battery Selection

SOC is defined as the fraction of the capacity stored in the battery cell. The cell capacity is a function of the cell current and is determined by a constant current discharge or charge test. The expression is as follows:
SOC t = Q t Q 0 , d Q t d t = i t
The unit then is the battery’s remaining capacity in A-h, which can be expressed as Q(t); Q0 is the total battery capacity, and i(t) is the end current. Another representation of the state of charge is the depth of charge (DOD), with the following expression.
D O D = 1 SOC
According to the Rint equivalent circuit, it can be seen that it is the internal resistance and the open circuit voltage that is related to the terminal voltage, the expressions of which are as follows:
U b = E SOC R i SOC i
According to the above equation, the battery simulation model built in Simulink is shown in Figure 2.

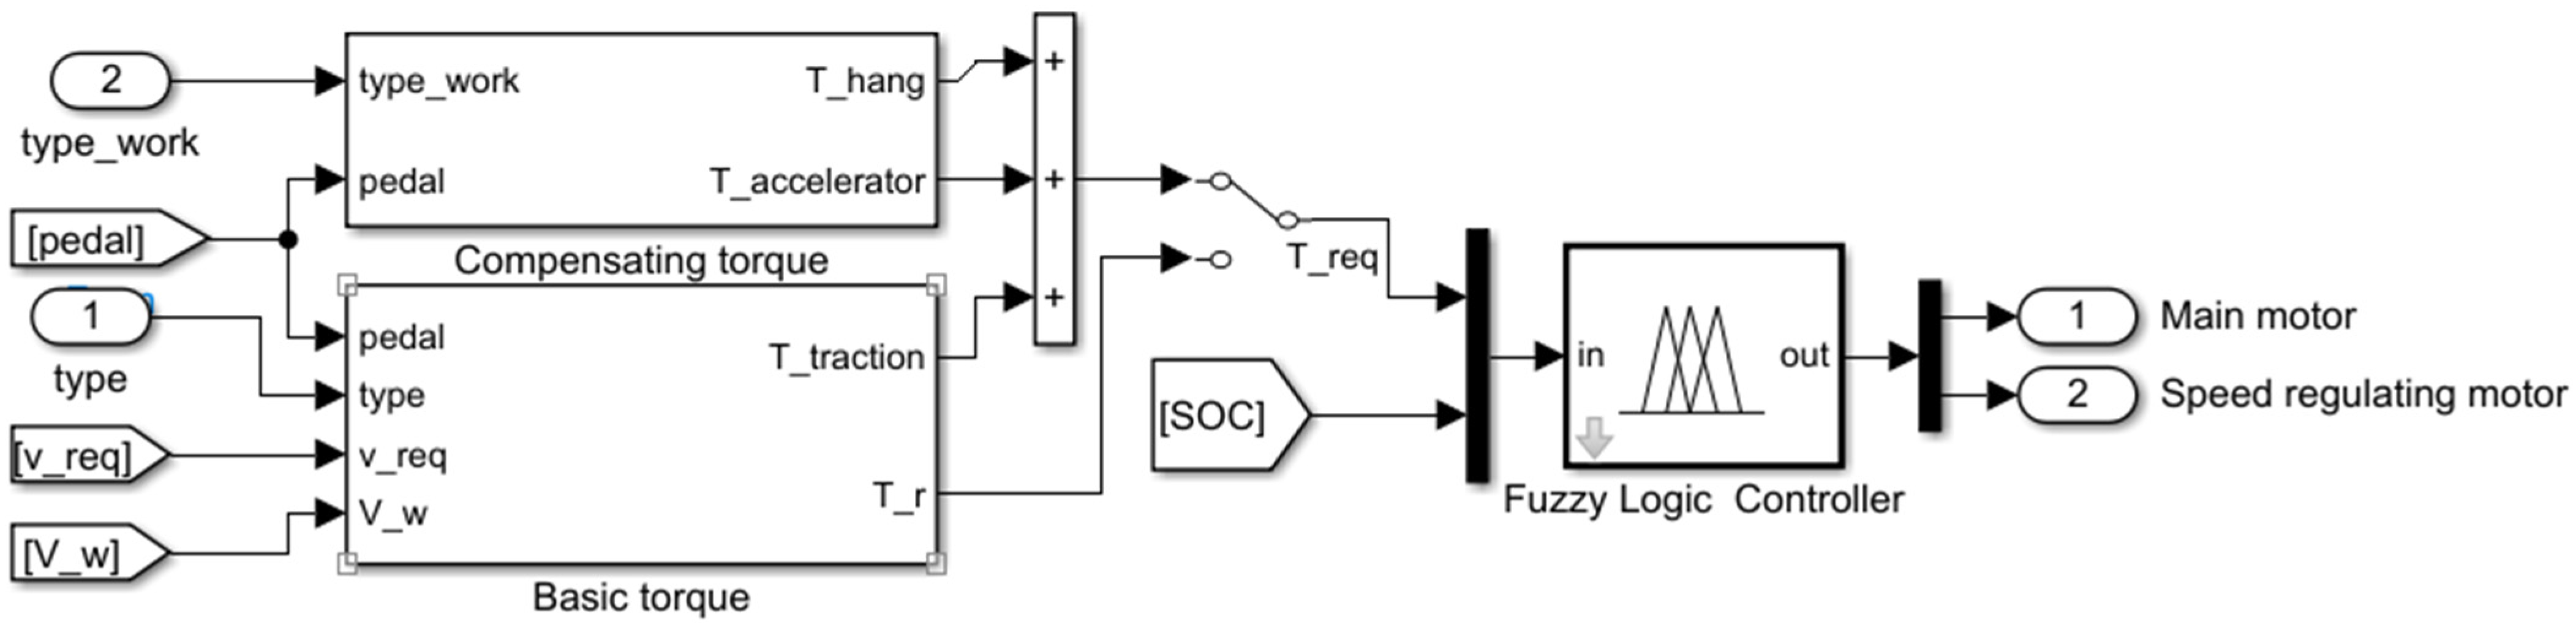
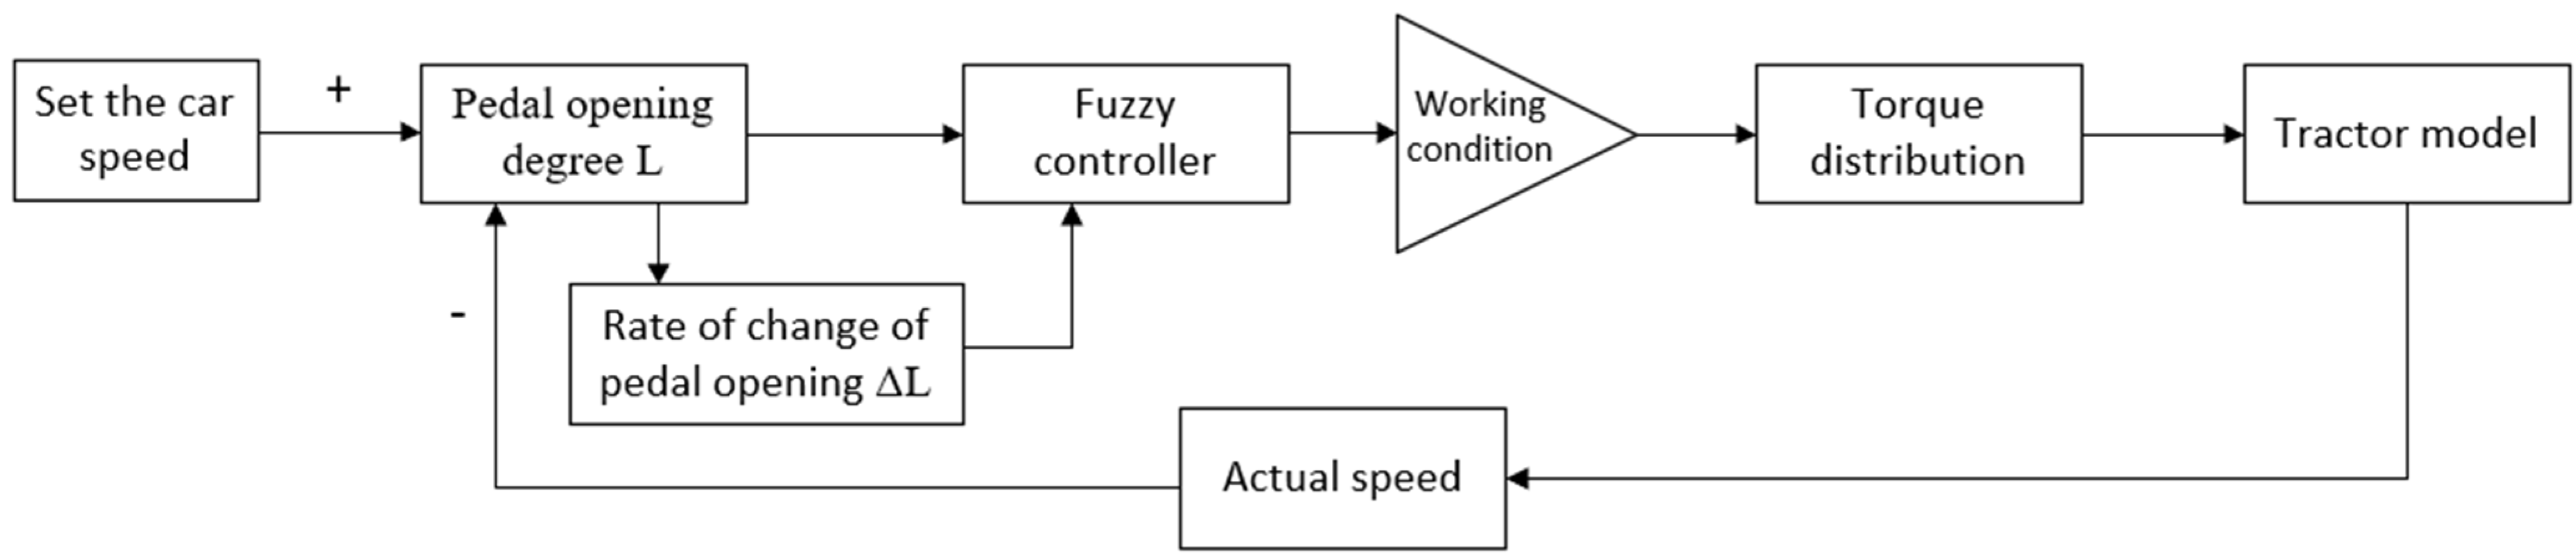
2.2. Torque Calculation Strategy

When the torque calculation strategy is developed, the torque value is calculated considering the vehicle state of the agricultural tractor, accelerator pedal opening, vehicle travel speed, etc. The torque compensation is made according to the type of tractor farm equipment. The depth of plowing operation is demanded in different plowing modes to ensure the power required in the plowing process as much as possible to meet the driving safety and plowing effect. The Simulink computational strategy model is shown in Figure 3 and Figure 4, based on the above process combined with Figure 5, Figure 6, Figure 7 and Figure 8.
The torque calculation strategy is divided into basic torque and compensation torque, as detailed in the following equation.
T r e q = T b + T a = ( T r + T t r a ) + T h a n g + T a c c
In the above equation, Treq is the total demand torque. Tb is the base torque required. Ta is the compensating torque. Tr is the speed demand torque. Ttra is the traction demand torque. Thang is the suspension compensation torque. Tacc is the acceleration compensation torque.

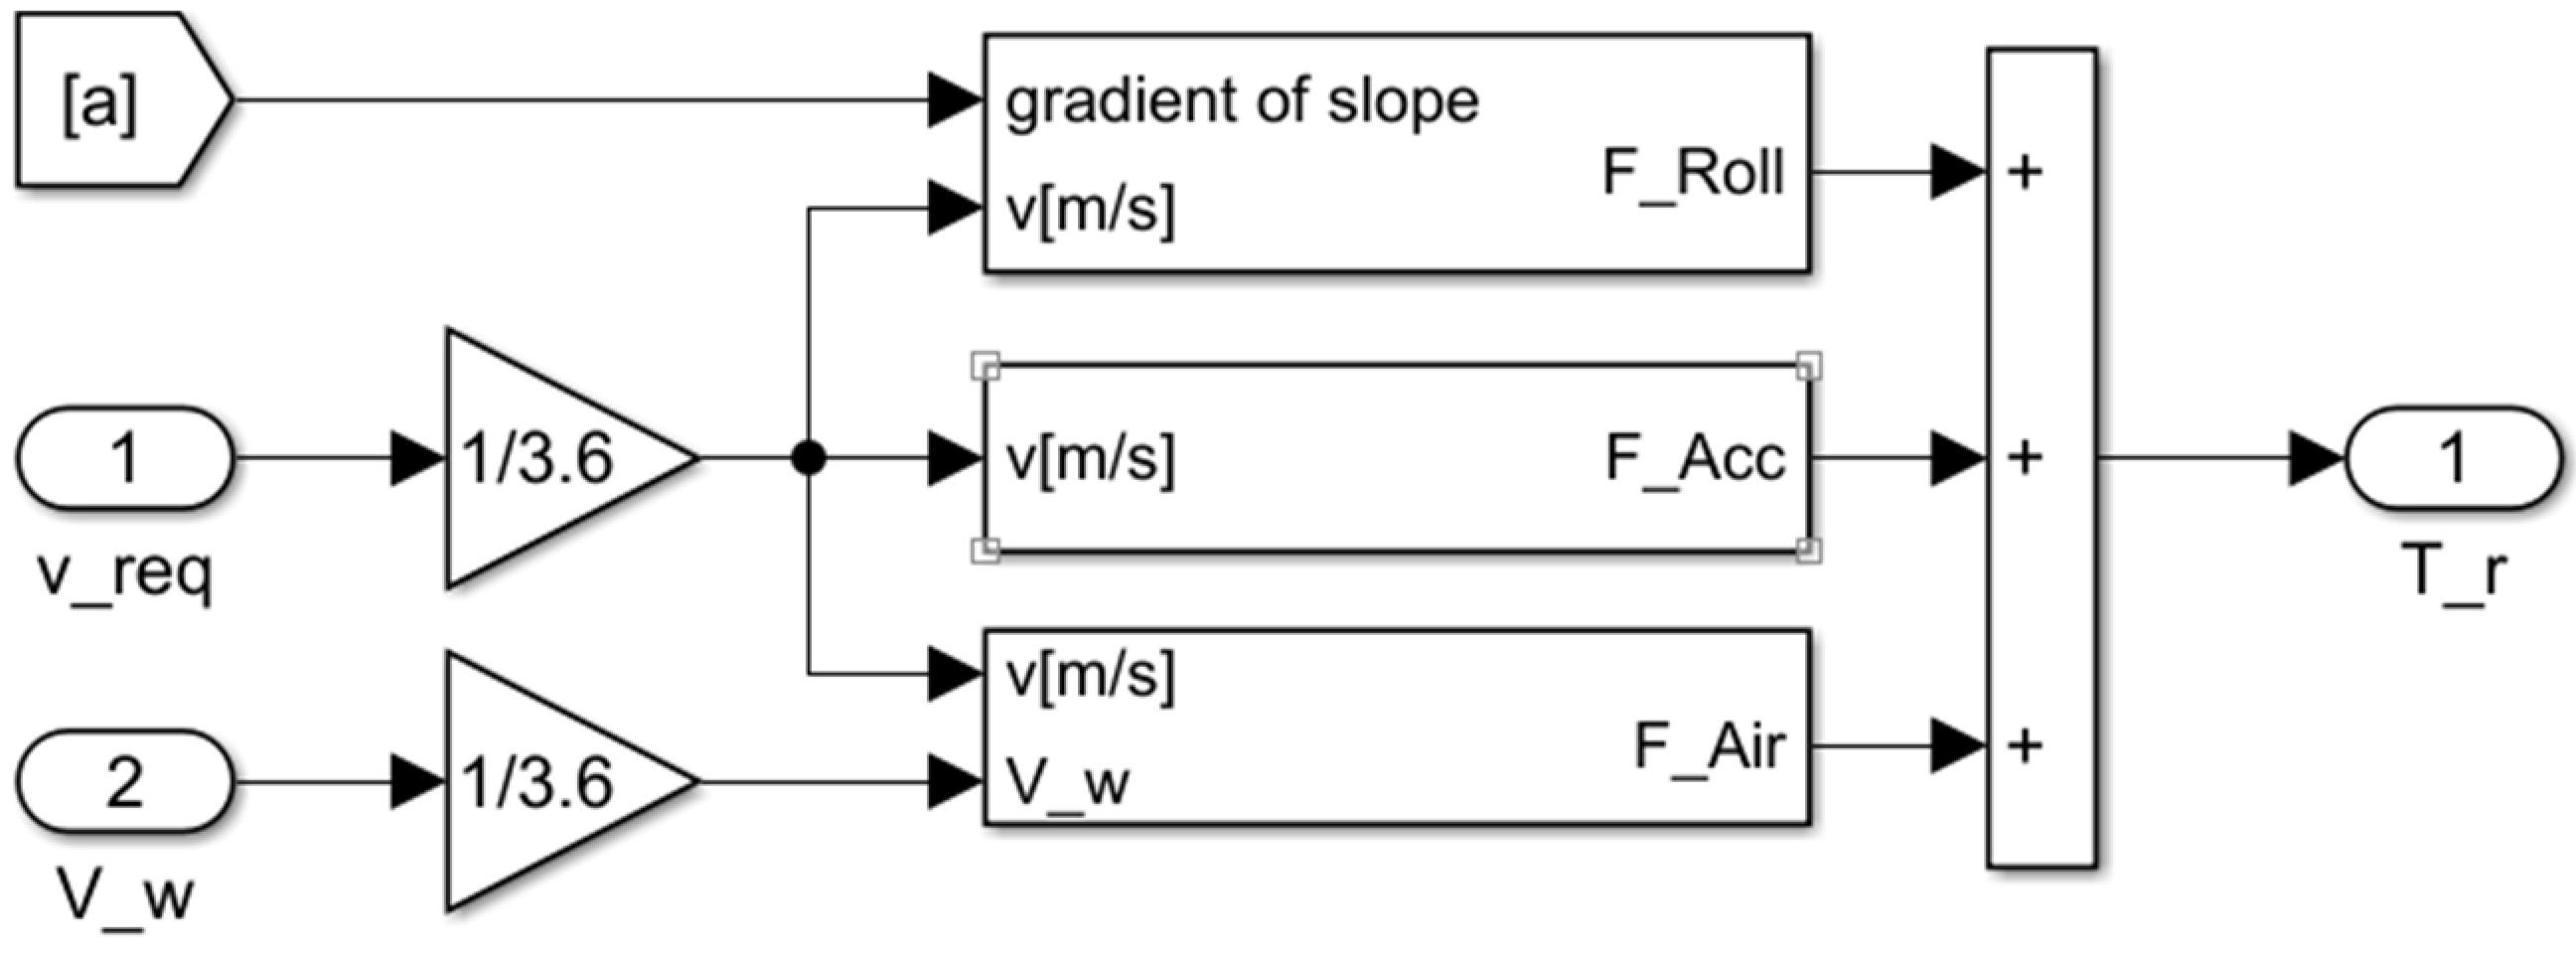
2.2.1. Basic Torque Calculation Module

(1)
Speed demand torque
For the tractor, its speed demand torque needs to maintain a close relationship with the pedal opening to achieve real-time control of the electric tractor. The expression is as follows.
T r = T m a x × L
where Tr is the tractor speed demand torque. Tmax is the maximum torque provided at the current motor speed. L is the torque load factor (taking the value range 0–1) calculated from the accelerator pedal opening.
L characterizes the torque load factor, and α characterizes the pedal opening, while the following functional relationship is maintained between the two. Since most agricultural tractor operations are under low-speed and high-torque conditions, the “up-convex” type is used to meet the power demand.
L = f ( α )
In the vehicle-driving equation, driving resistance is mainly composed of rolling resistance, acceleration resistance, air resistance, etc., as shown in Figure 4; the speed resistance can be expressed as:
F v = F f + F j + F w
where Ff is the rolling resistance, and Fj is the acceleration resistance. Fw is the air resistance.
The plow tractor operation is generally low-speed large torque while subject to air resistance, so this paper uses rolling resistance, acceleration resistance, and air resistance.
F f = m g f cos α + m g sin α
F j = δ m d v d t
F w = C D A P ( V + V w ) 2 21.15
where f is the rolling resistance coefficient, δ is the rotating mass conversion factor, CD is the air resistance coefficient, AP is the windward area, V is the travel speed, and Vw is the wind speed.
The kinetic equation of the tractor in motion knows that the driving force is
F v = m g f cos α + m g sin α + δ m d v d t + C D A P ( V + V w ) 2 21.15 = T r 1 + k i 0 η m η m t R w
In the above equation, Tr is the final output torque of the tractor. i0 is the total transmission ratio. η m is the motor efficiency. η t is the efficiency of the transmission system. Rw is the wheel radius.
The speed-demanding torque when the tractor is moving is
T r = ( m g f cos α + m g sin α + δ m d v d t + C D A P ( V + V w ) 2 21.15 ) R w 1 + k i 0 η m η m t
Combined with Equations (14)–(16), Simulink’s calculation strategy for the speed demand torque was established, as shown in Figure 5.
(2)
Traction demand torque
Due to the special nature of the tractor working environment, the tractor traction torque not only is influenced by the farm equipment but also is related to soil characteristics and slip rate. This paper uses the fuzzy control method to design tractor traction torque strategy by the fuzzy controller and gain selection switch. The core of fuzzy control is to build a fuzzy rule base based on expert experience.
The flow block diagram of the fuzzy controller, as shown in Figure 6, can be seen from the diagram: input the accelerator pedal opening L and its rate of change ΔL in the fuzzy controller, which is the output traction torque coefficient ΔTt.
The conversion equations for proportional, differential, and integral coefficients in the controller are
K p = K p , m a x K p , m i n K p + K p , m i n
K d = K d , m a x K d , m i n K d + K d , m i n
K i = K p 2 / α K d
The above equation, K p K d K i is the proportional, differential, and integral coefficients of the fuzzy controller, respectively. K p K d α is the coefficient of the output between [0,1].
Build the traction demand torque calculation strategy in Simulink, as shown in Figure 7.

2.2.2. Compensation Torque Calculation Strategy

(1)
Acceleration compensation torque
Based on the data obtained from the agricultural electric tractor’s driving and operating in different tillage modes as input. The 5-layer adaptive fuzzy neural network system is used to complete the recognition of the acceleration pedal opening and its change rate and the output of the acceleration compensation torque [26].
For Layer 1, which belongs to the function generation layer, the input–output relationship function is
O K 1 1 = A k i x k   k = 1 , 2 , , M ; N = 1 , 2 , , M
where xk is the input corresponding to the kth node, O K 1 1 is the affiliation degree corresponding to the input x k , A k i is the fuzzy linguistic set, and A k i x k is the parameterized affiliation function.
Layer 2, the fuzzy rule inference layer, is as follows.
O i q 2 = k = 1 2 O k i 1 = k = 1 2 A k i x k   i q = 1 , 2 , , M ; q = 1 , 2 , , M
Layer 3, the fuzzification layer, is as follows.
O i q 3 = O i q 2 ¯ = O i q 2 / ( q = 1 , i q = 1 q = M , i q = M O q 2 )
Layer 4, the deblurring layer, is detailed in the following equation.
O i q 4 = O i q 3 f i q = O i q 3 p i q x k + q i q
where p i q and q i q is the adjustable parameter, which is also the conclusion parameter.
Layer 5, the output layer, usually obtains the algebraic sum of each input signal with the help of operations and uses this value as the output.
O 5 = I = 1 , Q = 1 i = M , q = M O i q 4
Acceleration compensation torque is used to meet the torque requirements of agricultural tractors, when accelerating in different tillage modes of driving, which is generally compensated for by the acceleration pedal opening and rate of change with the following expressions.
T = Δ T α , d α d t
(2)
Suspension compensation torque
Tractors working in the field can utilize various pieces of farm equipment to complete the corresponding work. This paper selects six operating conditions: single plowshare plowing set, double plowshare plowing set, disc plow set, rototiller set, rototiller and stubble removal set, and harrowing set. It is assumed that the soil characteristics are consistent, the slip rate is constant, the land is flat, and the required torque for suspension is only related to the suspension depth.
In the suspension compensation torque strategy, the required torque is first obtained by multiplying the depth of suspension demand by the corresponding coefficient and then selecting the suspension compensation torque under the corresponding working mode, according to the judgment of working conditions to complete the calculation of suspension torque. The suspension compensation torque calculation strategy is built in Simulink, as shown in Figure 8.

2.3. Torque Distribution Strategy

2.3.1. Torque Distribution Algorithm (PSO) Design

This paper uses the Particle Swarm Optimization algorithm to analyze the established motor torque allocation algorithm for different plowing modes of agricultural electric tractors [27]. During the driving operation of the agricultural tractor, according to the motor-output shaft ratio, the required torque of the motor is inferred by relying on the vehicle’s speed, searching for the output efficiency of the motor in the current mode, and calculating the size of the fitness function. The torque corresponding to the minimum value of the fitness function is the optimal demand torque after completing the number of iterations set in the previous stage.
(1)
Iterative formula
The Particle Swarm Optimization algorithm initializes random particles’ velocity and position. The particles adjust their position and velocity for the next iteration by formulas (28) and (29), change their search ability by inertia weights, and update the individual extremes and globally optimal solutions for the next iteration’s simultaneously completed iteration. The iterative formula is as follows.
V i k + 1 = ω V i k + C 1 r a n d 1 P b e s t i X i k + C 2 r a n d 2 G b e s t i X i k
X i k + 1 = X i k + V i k + 1
where V i k + 1 is the particle i the velocity at the first k + 1 velocity of the particle at the second iteration. X i k + 1 is the particle i the k + 1 position at the first iteration. G b e s t i is the global optimum. P b e s t i is the individual extremum. C 1 and C 2 are individual learning coefficients and social learning coefficients. r a n d 1 and r a n d 2 a random function between (0,1), which increases the randomness of search results. ω is the inertia weight, and its size can change the global and local search ability.
(2)
Objective function
The fitness value obtained from the objective function is the criterion for judging the goodness of the Particle Swarm Optimization algorithm. The fitness value will change with the number of iterations, so the corresponding fitness function value needs to be calculated according to the current speed and position of the particles [28]. The fitness function of the agricultural tractor is
f = i m Z C T 1 η 1 + Z s T 2 η 2
where i m is the main motor reduction ratio. ZC is the number of planetary wheel teeth. Z s is the number of teeth of the sun wheel. T 1 is the main motor torque, and T 2 is the speed-controlled motor torque.

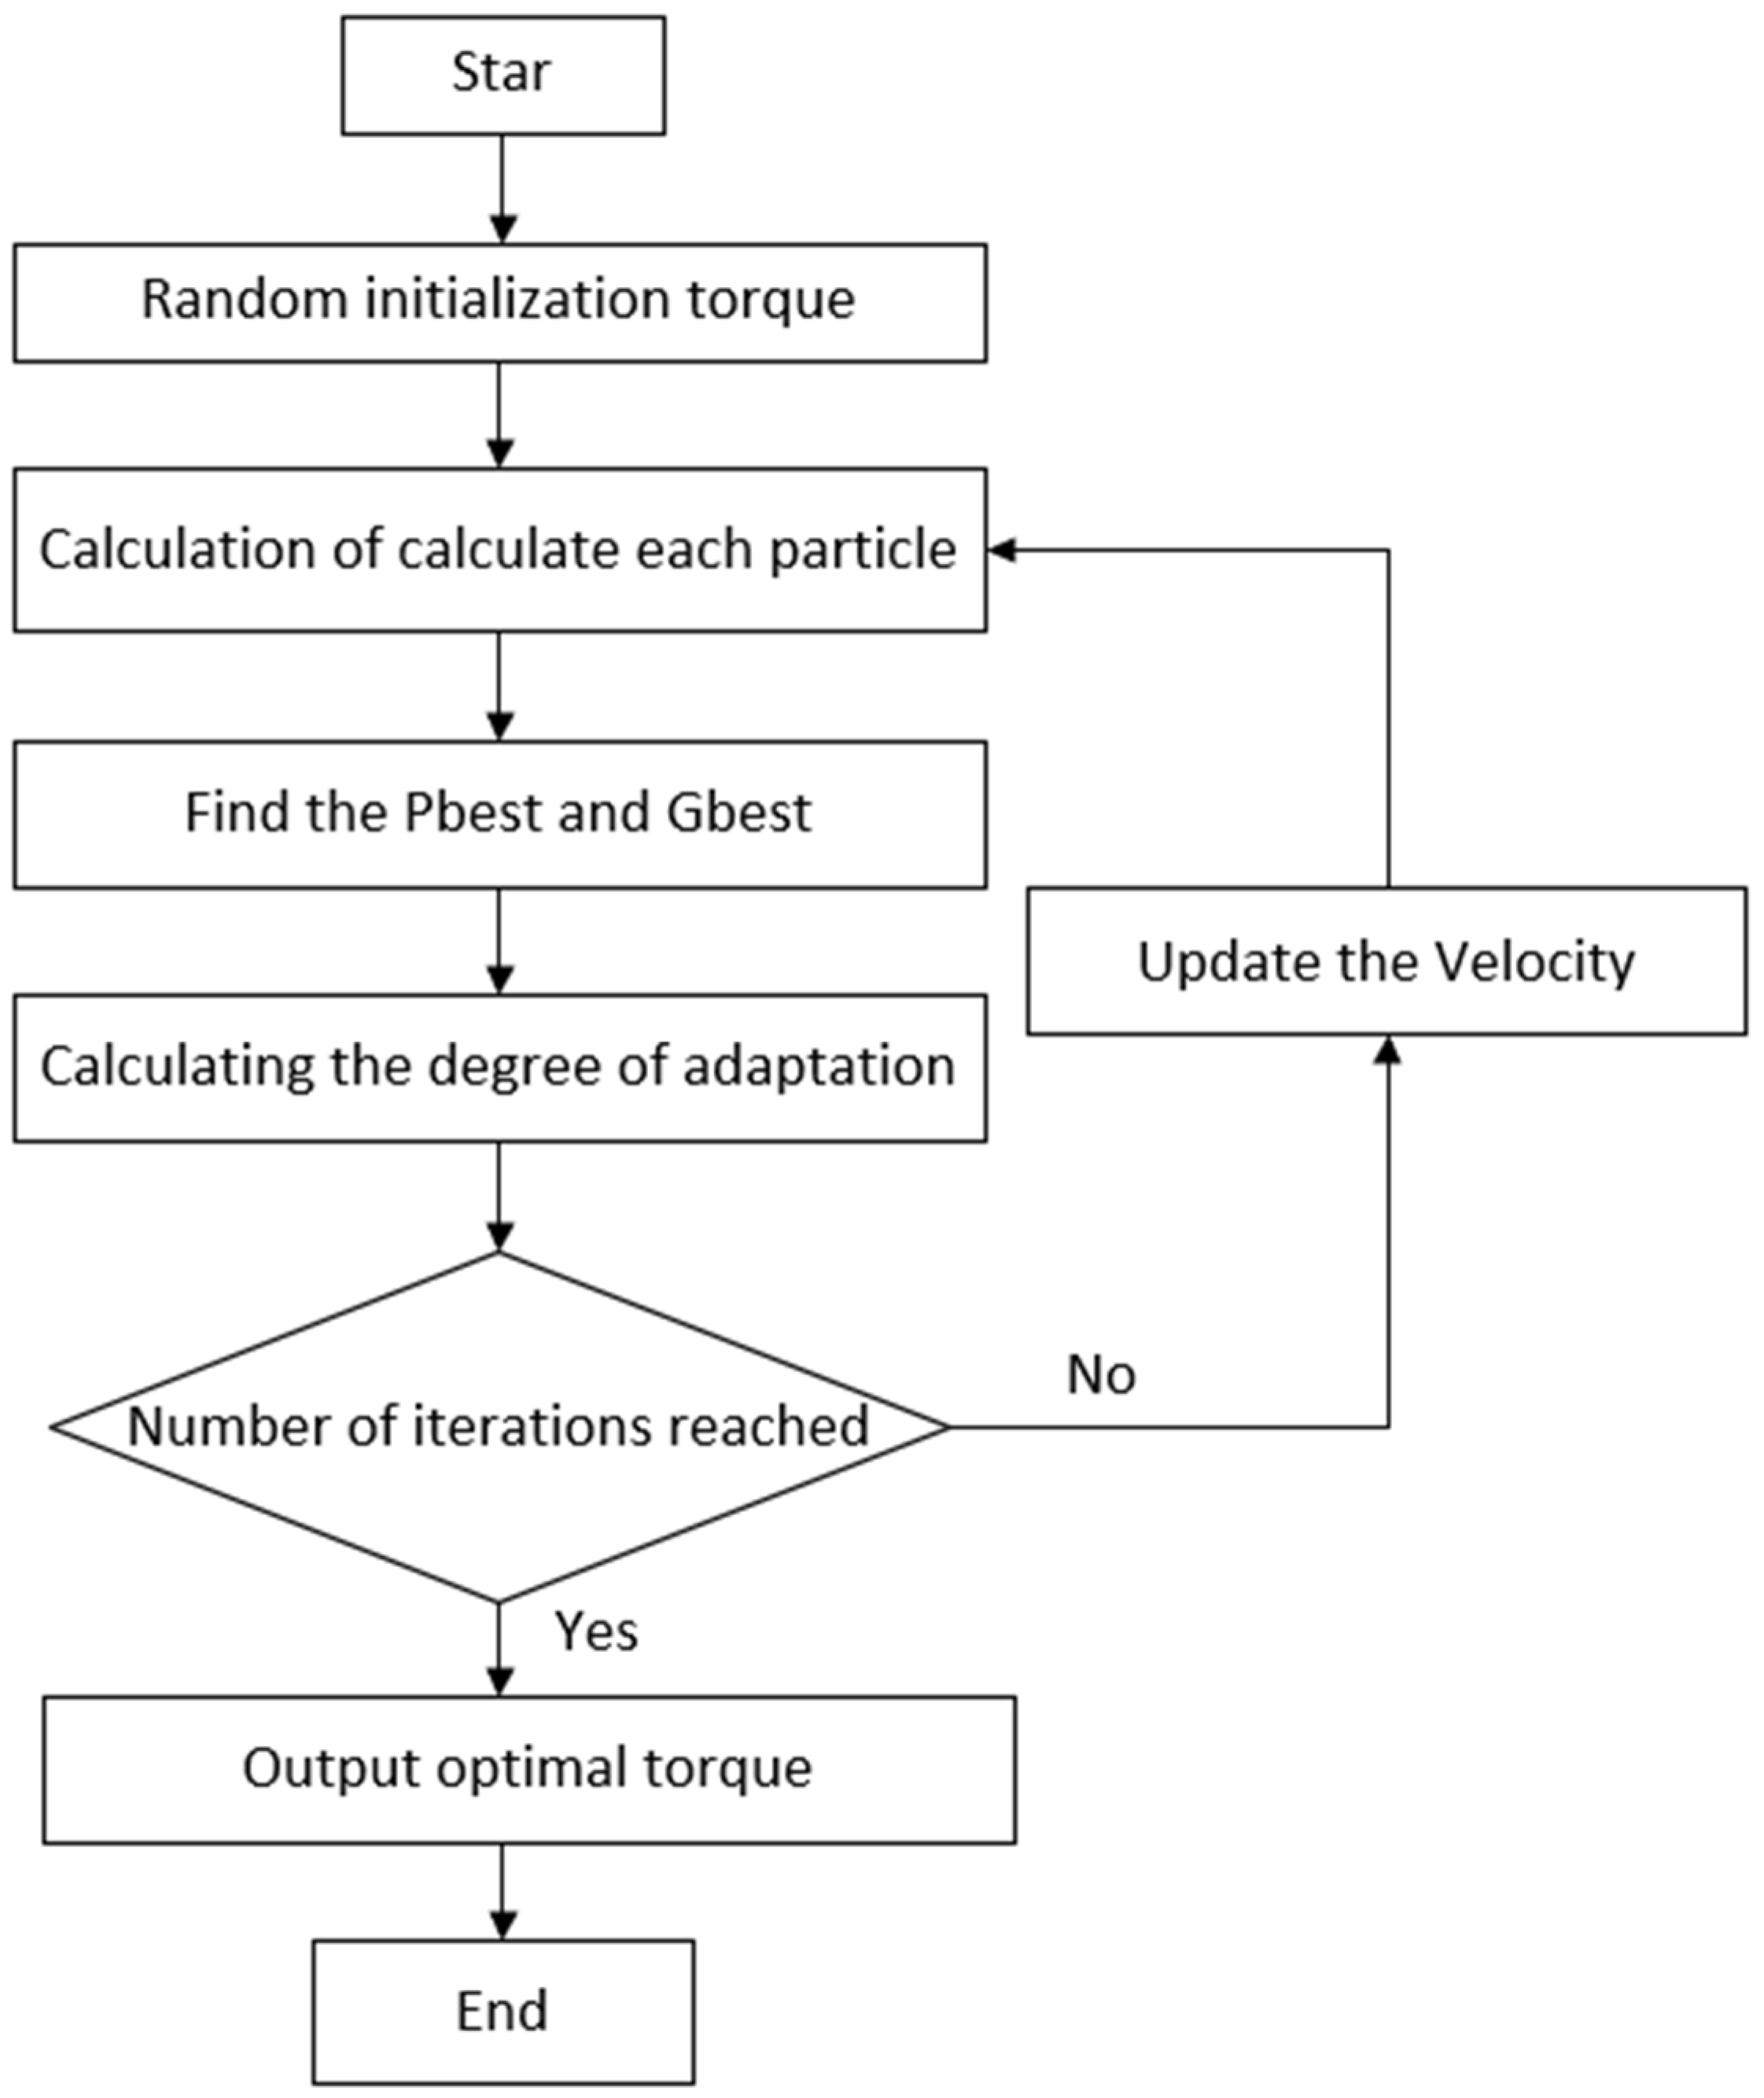
2.3.2. Torque Distribution Algorithm (PSO) Implementation

(1)
Star: The parameter settings are performed, as shown in Table 1 [29]. The number of particles set by the algorithm is determined according to the response time of the operating process. The algorithm has two search parameters—main motor torque and speed control motor torque, from which the particle dimension is determined. The learning factor is generally chosen as the default value of 2. The inertia weight and the number of iterations are determined according to the algorithm’s convergence Figure 9.
(2)
Calculate each particle: According to the objective function, calculate each particle i by the fitness function value.
(3)
(3) Find the P b e s t : Compare the current particle i with the best fitness function value of individual history, and if the current particle has a larger fitness function value, then update Pbest.
(4)
Find the G b e s t : Compare the current particle i with the global best fitness function value, and if the value of the fitness function of the current particle is greater, then update G b e s t .
(5)
Update the Velocity: Update the velocity and position of each particle, according to the iterative formula.
(6)
Output optimal torque: After reaching the maximum number of iterations, the optimal torque and the fitness function value are output.

2.3.3. Torque Distribution Fuzzy Controller

Power transmission relies on planetary gear meshing in a two-motor drive system, and the two motor torques are not directly related. When the Treq calculation is completed, the torque of the two motors can be found according to the following formula.
T 2 = T r e q λ
T 1 = T r e q k i m 1 λ
where im is the main motor reduction ratio, and λ is the motor torque distribution system. T 1 is the main motor torque, T 2 is the speed-controlled motor torque, and the number of k is the transmission ratio of the planetary gear.
After the above output of the total optimal demand torque, the motor torque is then redistributed in combination with the battery SOC, according to the principle of highest energy utilization. This process is achieved using a fuzzy controller. The two inputs to the fuzzy controller are the optimal demand torque of the agricultural tractor and the SOC of the battery, and the output is the motor torque distribution coefficient λ. The parameters are shown in Table 2 below.

2.4. MATLAB/Simulink Torque Distribution Simulation Experiment

According to the operation of the agricultural plowing tractor, the driving speed V = 6 km/h is used to represent the tractor plowing mode speed, and the driving speed V = 20 km/h is used to represent the speed of the tractor transit mode. Simulations are carried out at different torques to analyze the calculation effect of the algorithm.

2.5. Performance Test of Motor Torque Distribution

To verify the strategy’s effectiveness, the electric tractor was tested with the help of a bench test [30] and a drum test stand [31]. Refer to and build a drum test stand to test the performance indicators of the vehicle without dismantling the small [32].
The electric tractor test bench components are connected as follows: the main motor and speed control motor are connected to the coupling box through a mechanical connection. The power controller sends the motor information to the main motor driver and the speed control motor driver to drive the main motor and the speed control motor, respectively. The drive wheel magnetic powder brake is connected to the rear axle. The PTO magnetic powder brake is connected to the PTO shaft of the gearbox. The main motor speed and torque sensor are mounted on the main motor output shaft. The PTO speed and torque sensor are mounted on the PTO output shaft of the gearbox.
The electric tractor is tested in three different tillage modes, rotary, plowing, and rotational tillage, through the drum test bench, as shown in Figure 10.

3. Results and Discussion

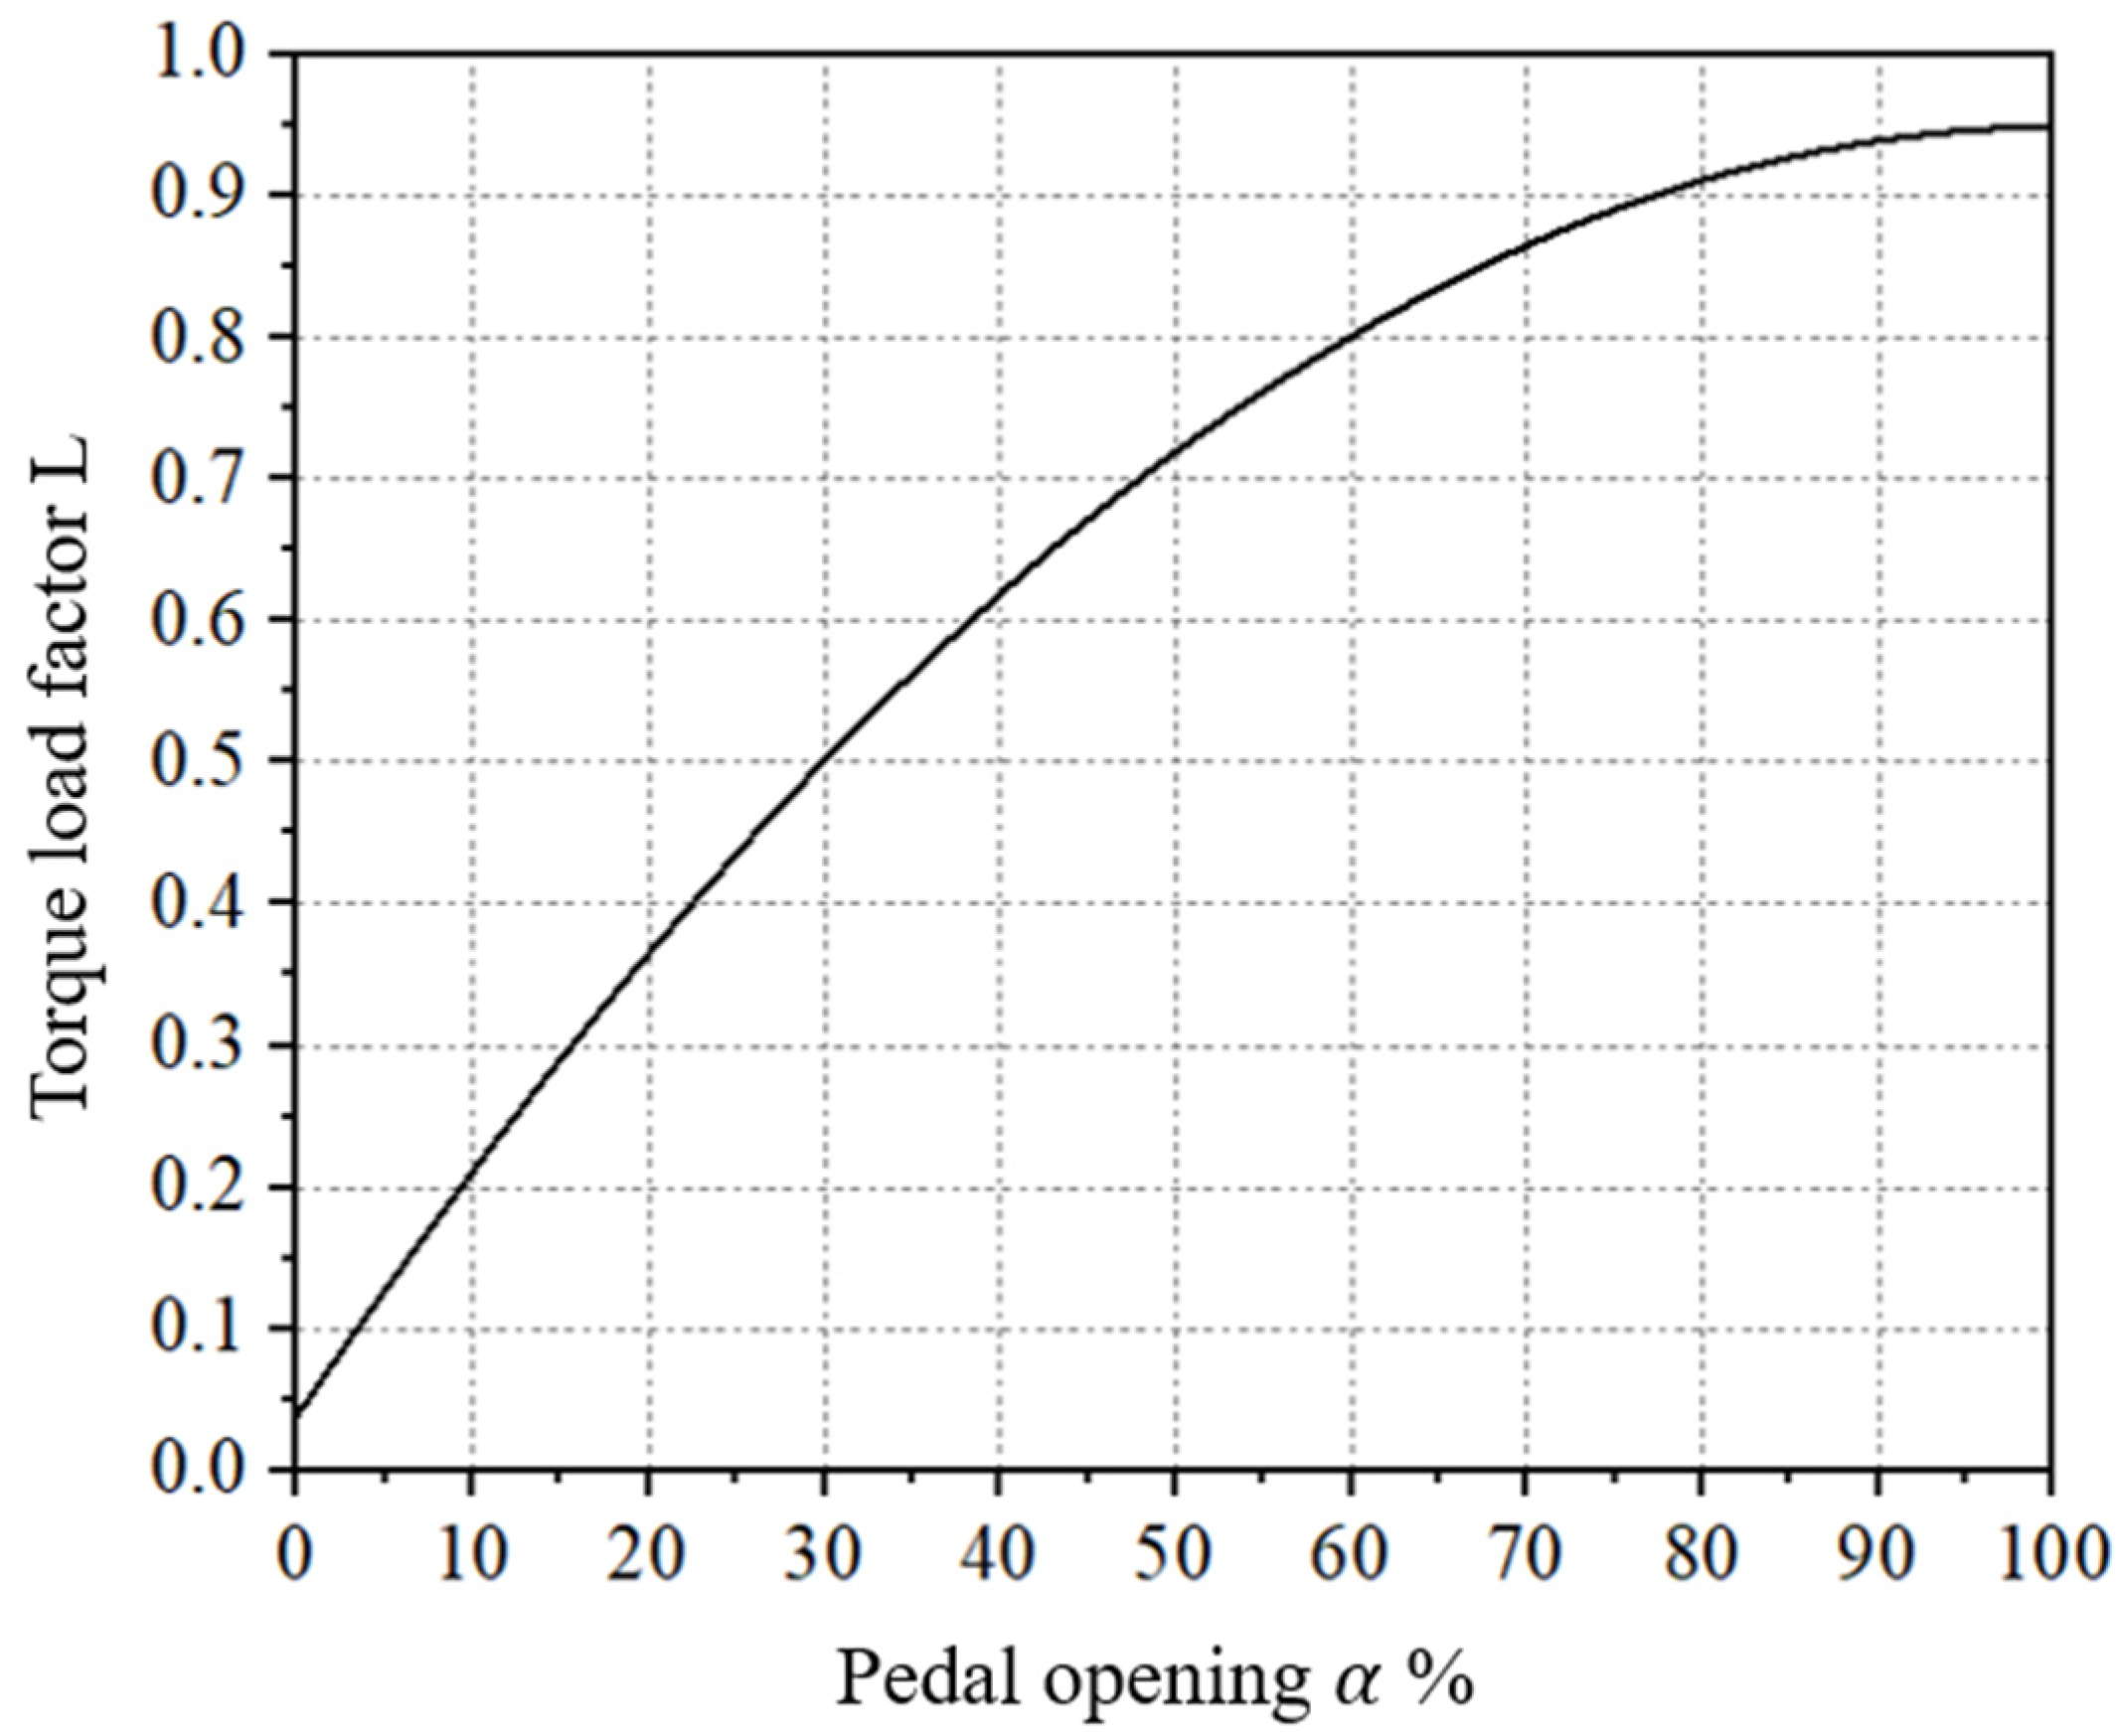
3.1. Torque Calculation Strategy

(1)
Torque load factor of speed demand torque
According to Equations (8)–(12), the torque required by the farm tractor when driving under different slope sizes is calculated. With the help of the equivalent external characteristic curve of the two-motor coupled drive system, the torque load coefficient L number is obtained arithmetically. Based on the results of the calculations, the correlation between the torque load factor L and the pedal opening α was fitted, and the complicated relationship is shown in Figure 11 below.
(2)
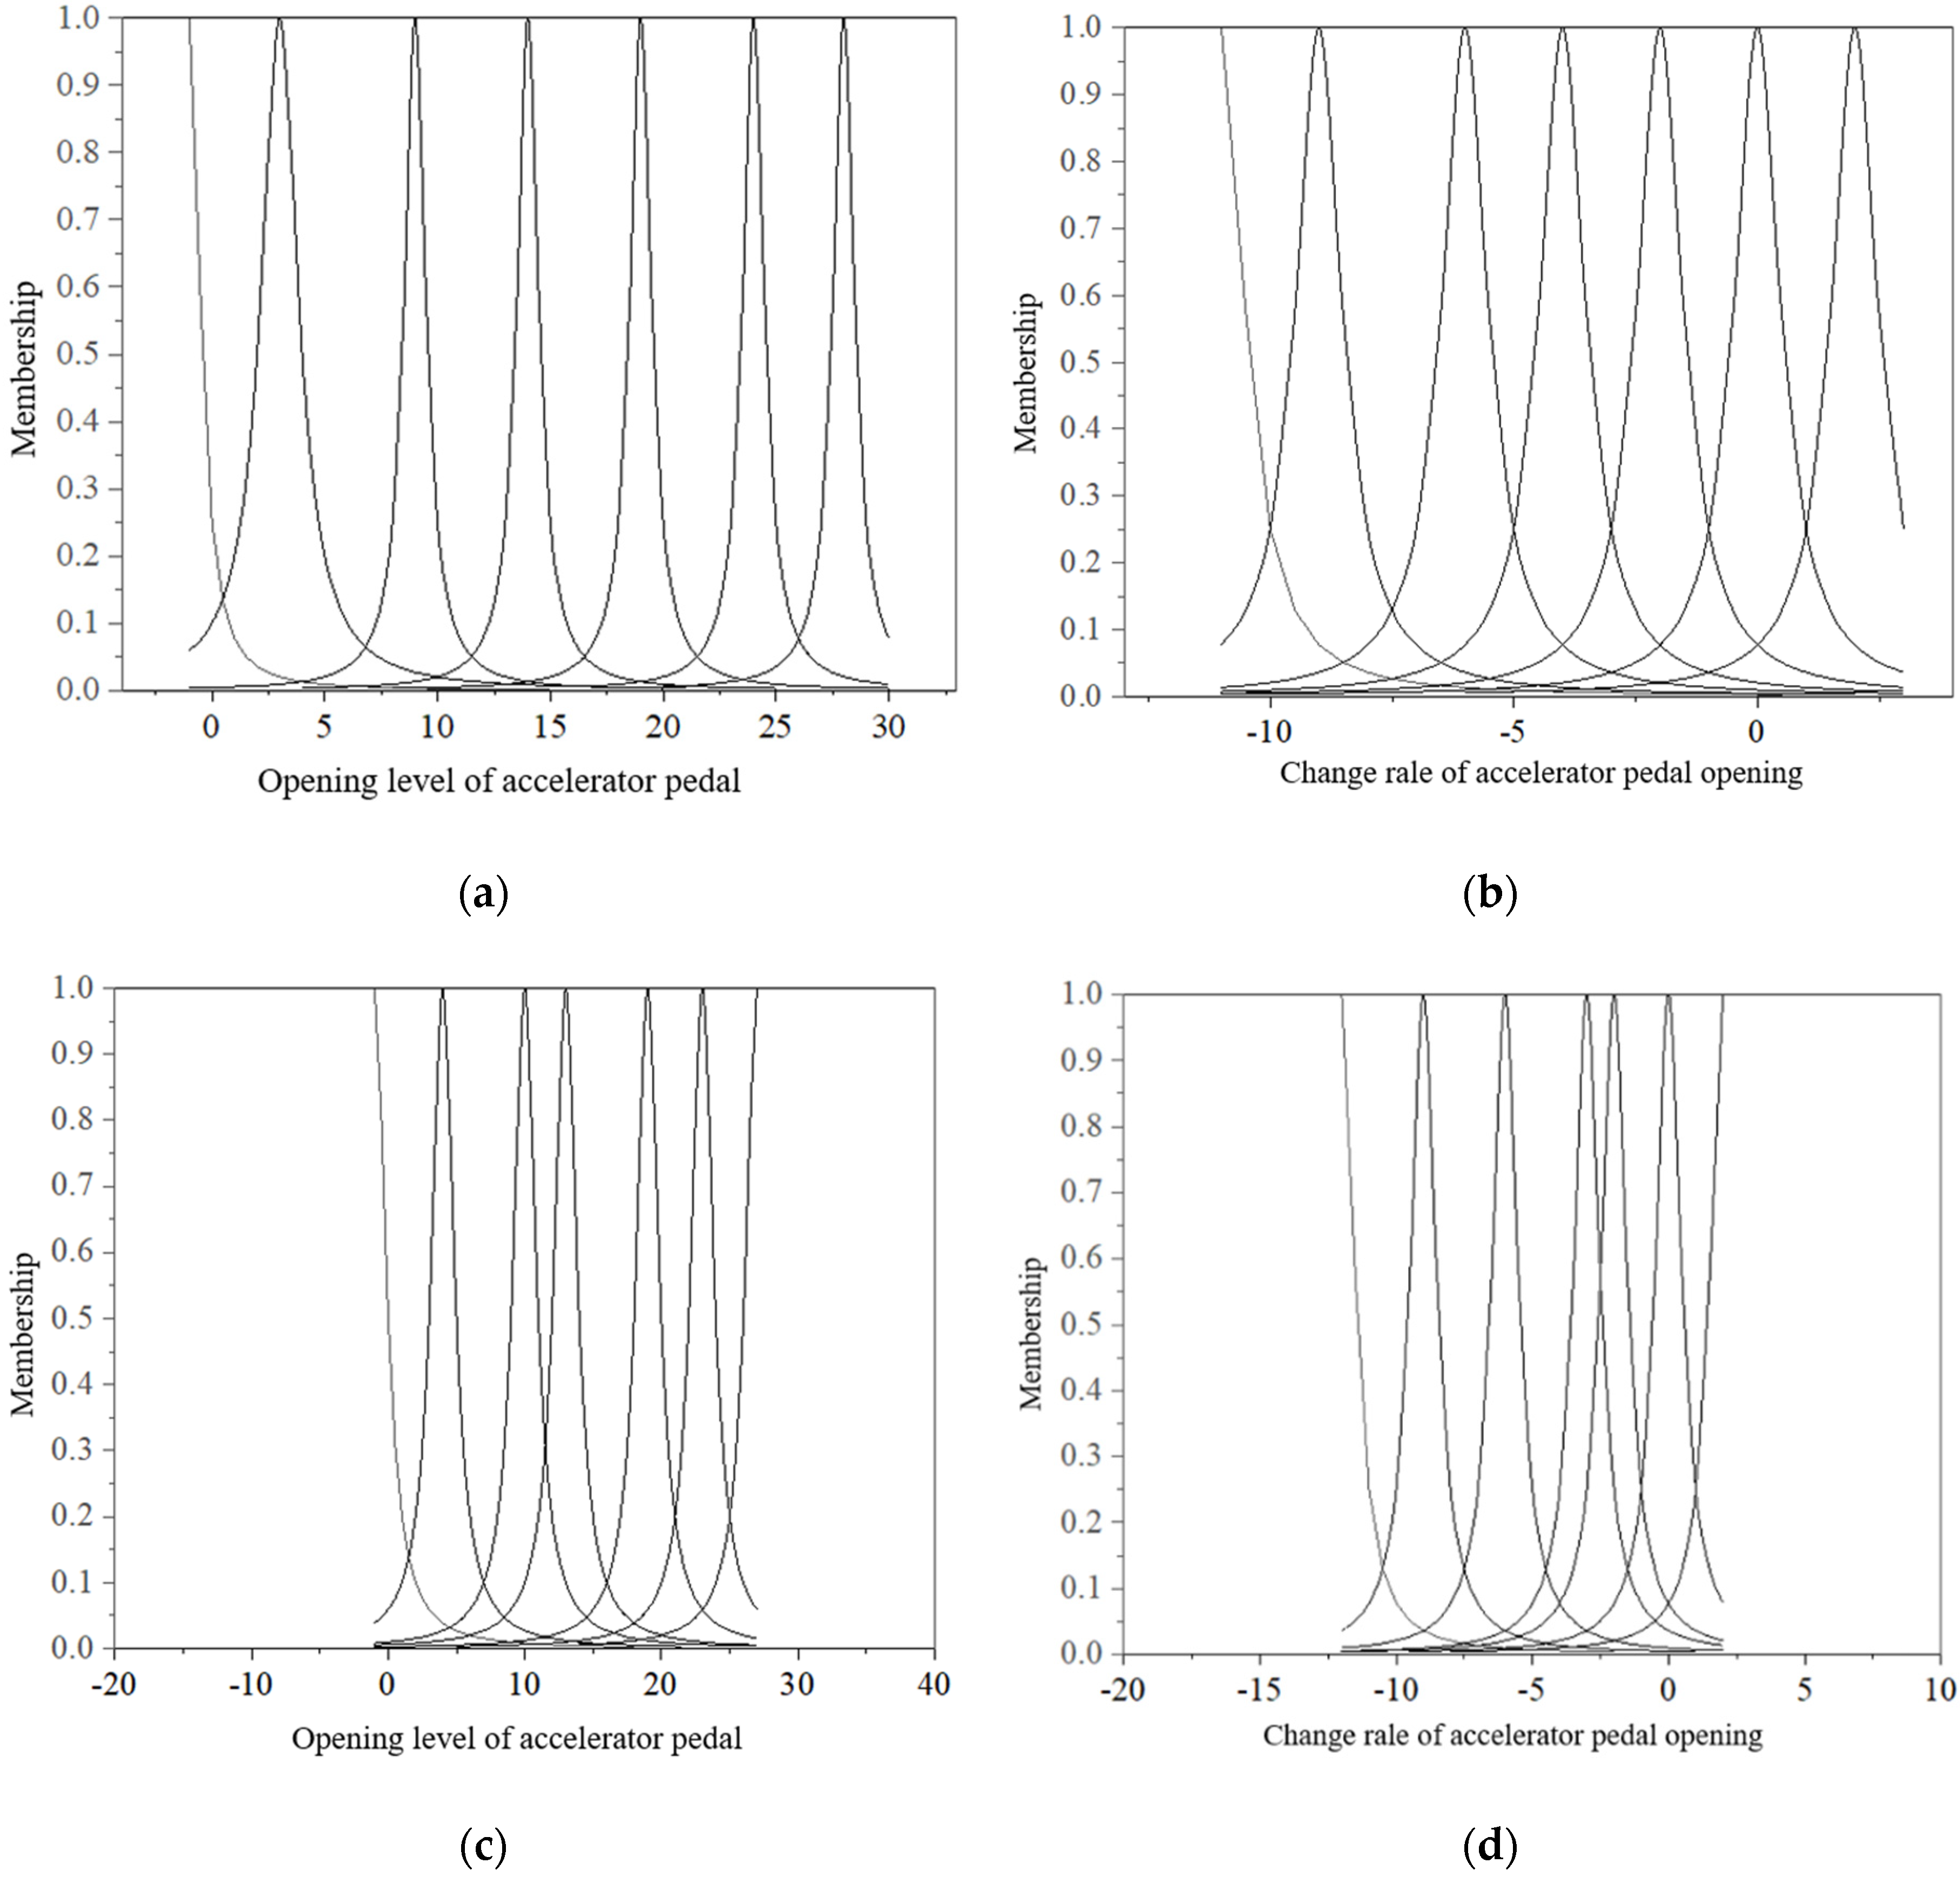
Traction demand torque fuzzy controller
The settings of the fuzzy controller for the traction demand torque are shown in Table 3.
The fuzzy control rules shown in Table 4 were developed by collecting the acceleration pedal opening and change rate of the tractor in different tillage modes (walking, plowing, rotating, and harrowing) and establishing the interrelationship between pedal change and tractor torque by combining the operational experience of the farm mechanics.
(3)
Accelerated compensation strategy affiliation function
The actual accelerator pedal opening and its rate of change of the agricultural tractor were trained under different tillage methods. A comparison of the results before and after training is shown in Figure 12.
(4)
Torque distribution fuzzy controller
For agricultural plowing tractors, the mode of operation is mostly traction farm equipment, to complete the plowing. The design principle is to meet the current plowing mode plowing depth of the premise to provide the agricultural tractor driving the required power, so that the battery SOC stably declines. According to the demand torque and battery SOC, 25 control rules for torque distribution are established, as shown in Table 5.

3.2. Torque Distribution Algorithm Simulation

(1)
PSO algorithm merit verification
The simulation of the torque distribution algorithm is shown in Figure 13 and Table 6. As can be seen from the graphs, the algorithm can find and output the optimal torque under different torques with fewer iterations, faster convergence speed, higher computational efficiency, and better global search capability in the transit transport mode and plowing operation mode.
(2)
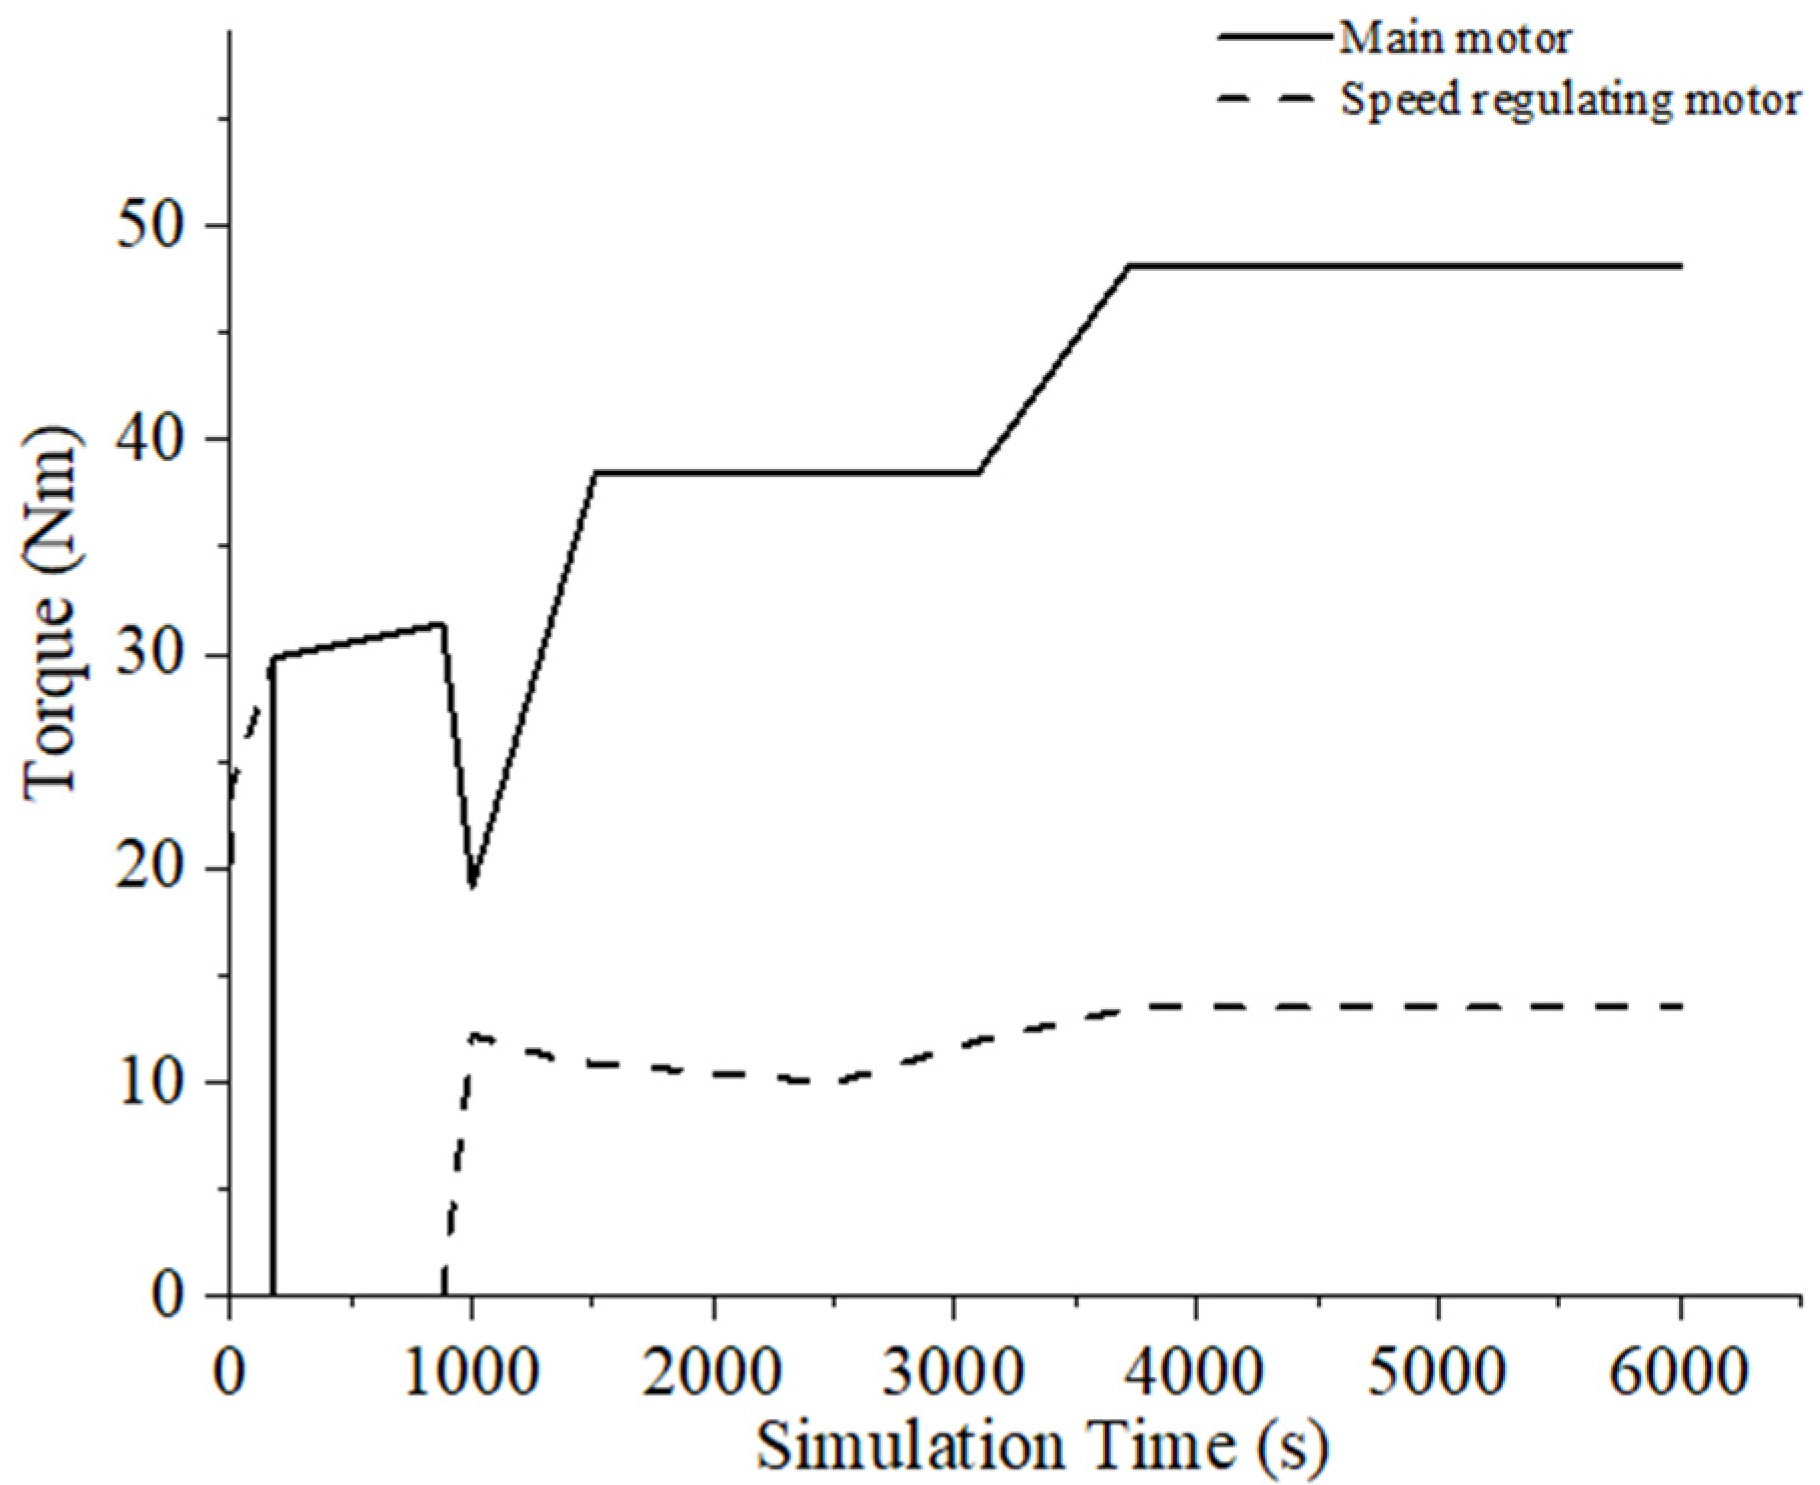
Torque distribution simulation
The torque distribution algorithm program was imported based on the torque distribution simulation model built in MATLAB/Simulink above (Figure 3). The total torque of the twin motors obtained, by collecting the drive torque generated during plowing of the agricultural tractor and back-propagating it in combination with the gearbox ratio, is used as input.
Figure 14 shows the simulation results of the torque distribution algorithm. As can be seen from the figure, from 0 to 260 s, the total torque is less than 22.6 N·m and is in the speed-control-motor drive alone mode. From 260 to 1000 s, the total torque gradually increases to 31.4 N·m and is in the main-motor drive alone mode. After 1000 s, the total torque is greater than 31.4 N·m, and the main motor and the speed control motor are in common drive mode when the torque distribution of the motor starts. The torque distribution algorithm has the lowest fitness function value, and both motors’ efficiency is the highest at this time.

3.3. Performance Test of Motor Torque Distribution

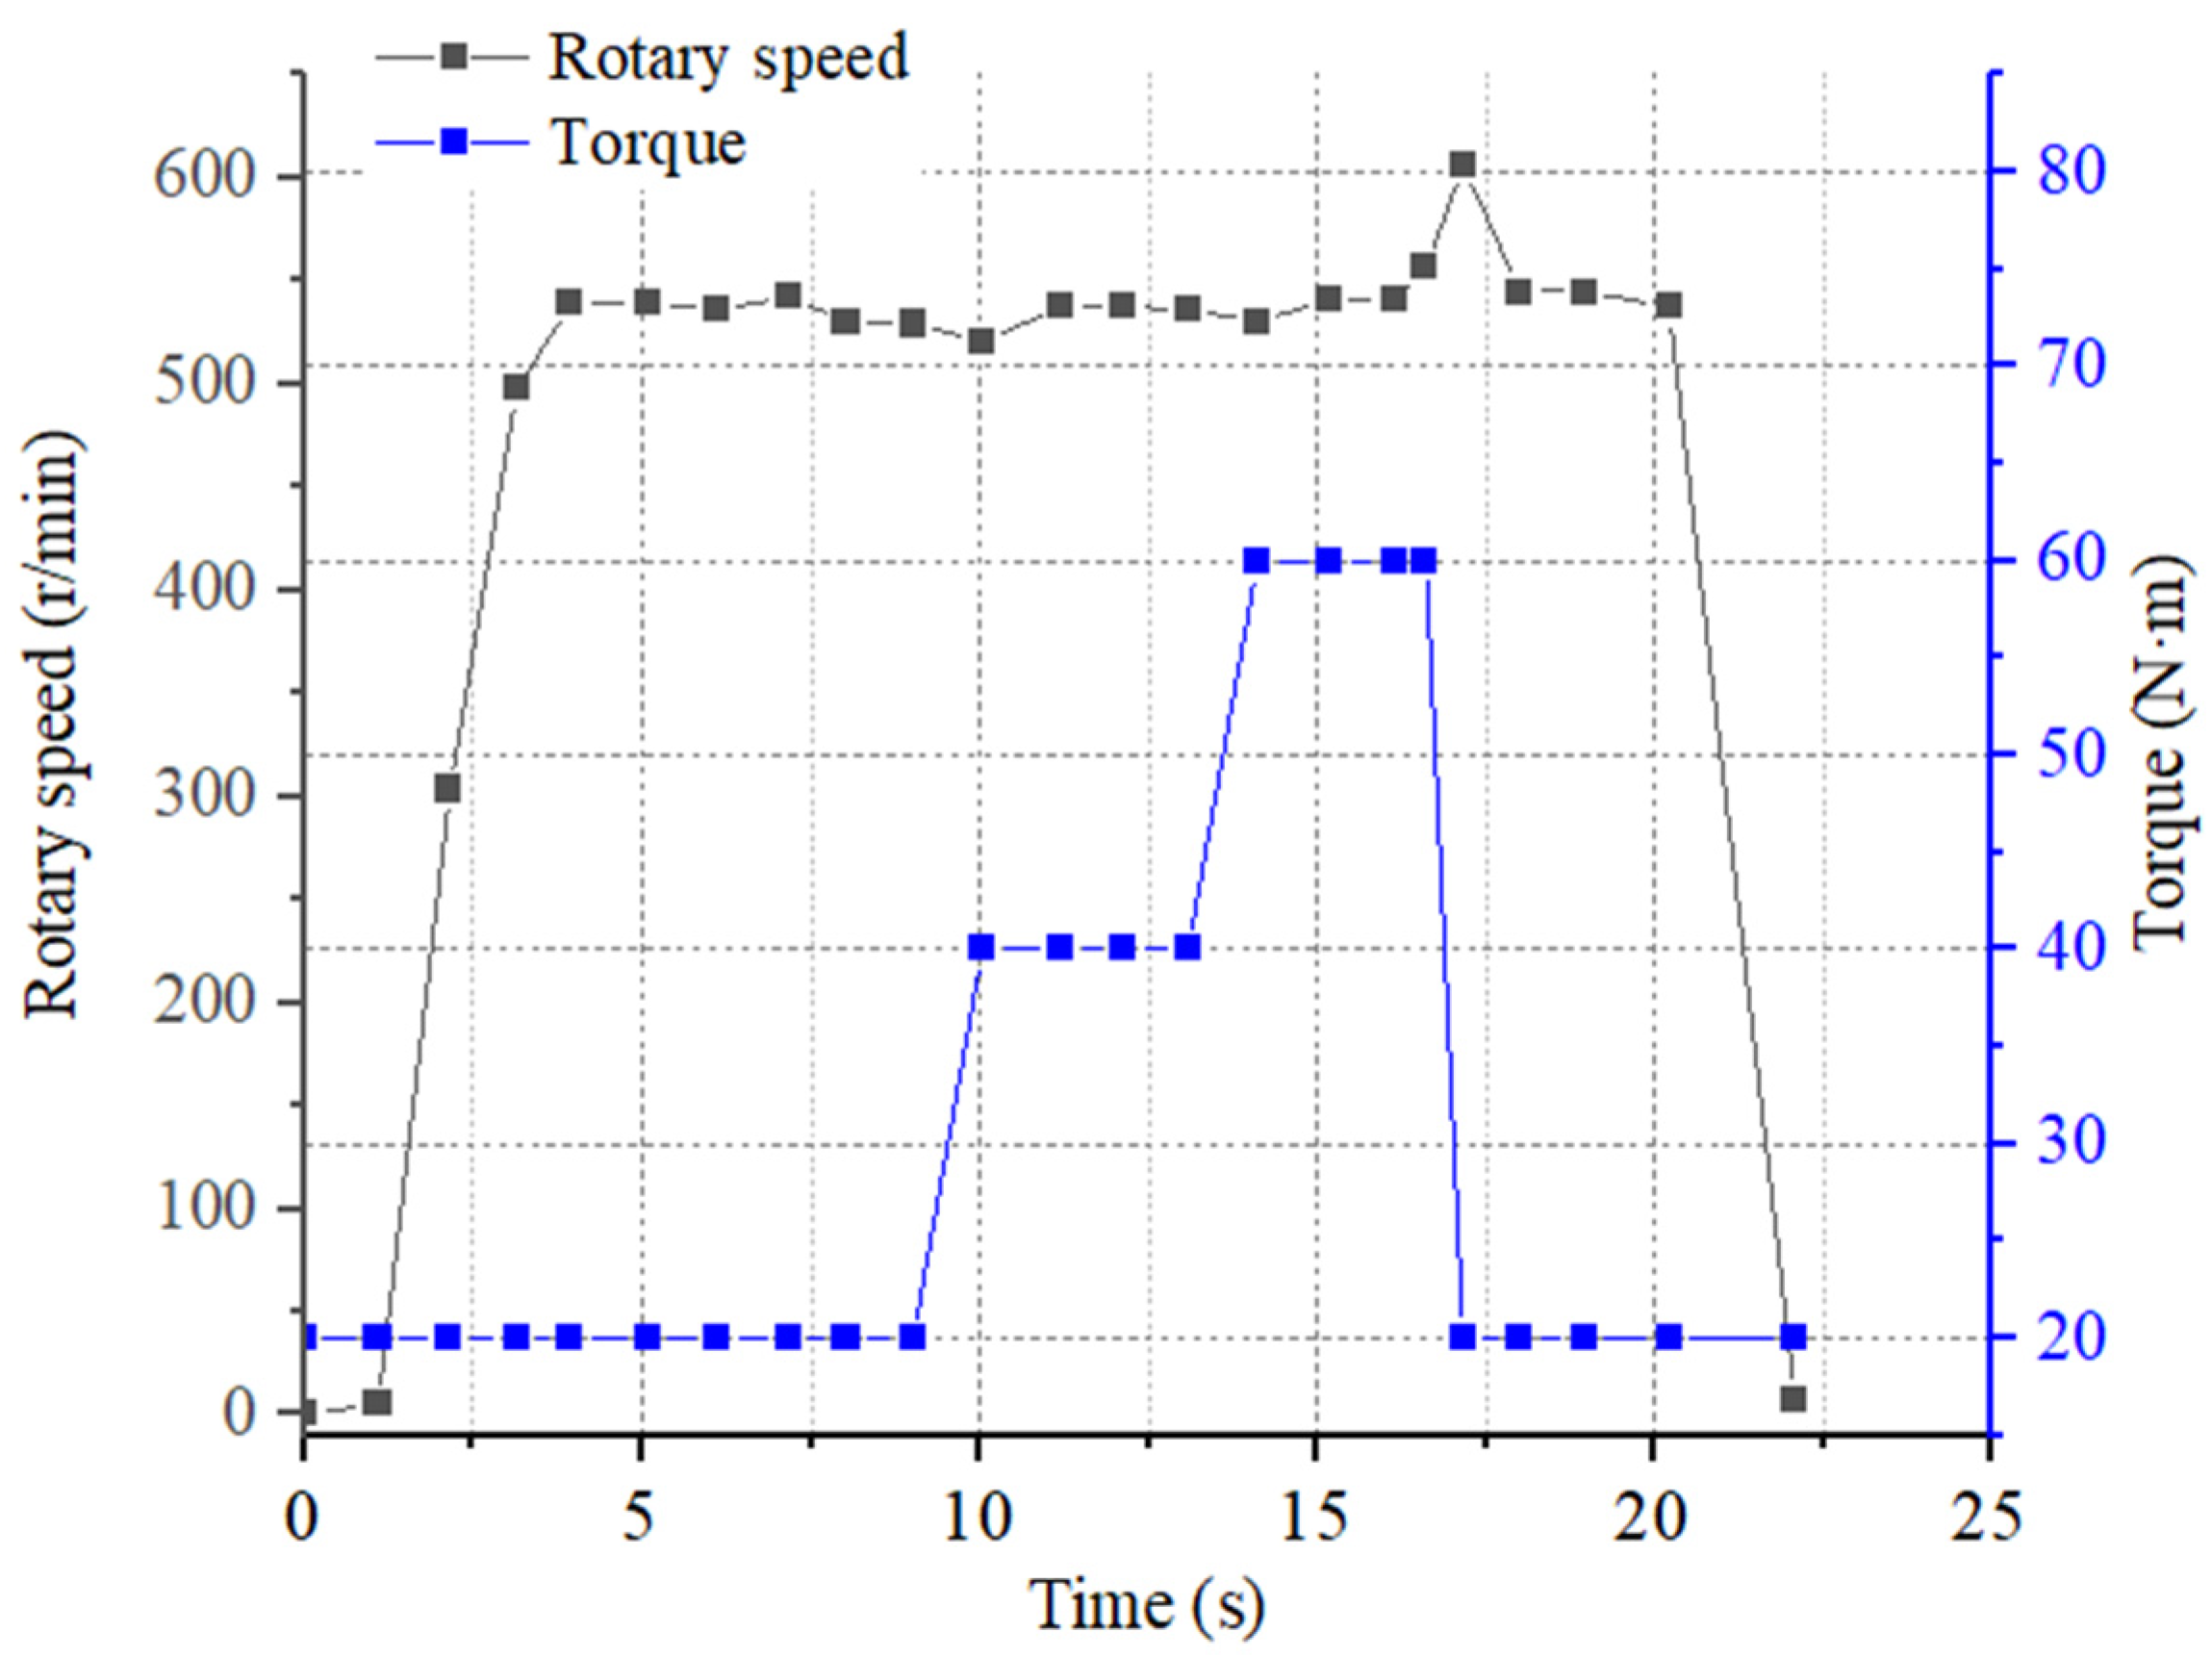
3.3.1. In Situ PTO Operation

In situ power take off (PTO) operation simulates the tractor in situ, without moving only the power output shaft drive supporting agricultural equipment operation [33]. The values of each parameter are measured at equal time intervals and the trend of change is plotted [34]. The PTO load module sets the resistance from 20-40-60-20 N change to complete the loading and unloading. The speed control motor does not work, and the main motor drive alone does not work. The results obtained from the simulation are shown in Figure 15 and Figure 16.
From Figure 15, the load torque is 20 N·m from 0 to 9 s, rising to 40 N·m at a uniform rate from 9 to 13 s, gradually increasing to 60 N·m from 13 to 17 s, and falling to 20 N·m at a constant rate from 17 to 23 s. During this process, the PTO speed is stable at 540 r/min.
As can be seen from Figure 16, for PTO operation, the main motor and speed control motor torque does not change much; the main motor torque is between 0–3 N·m, and the speed control motor torque is between 0–0.05 N·m. The main motor speed rises to 1500 r/min in about 5 s, and the speed control motor speed rises and falls in steps with the change of load torque in 11–17 s, which means that the main motor and speed control motor can both respond to the change of PTO load quickly.

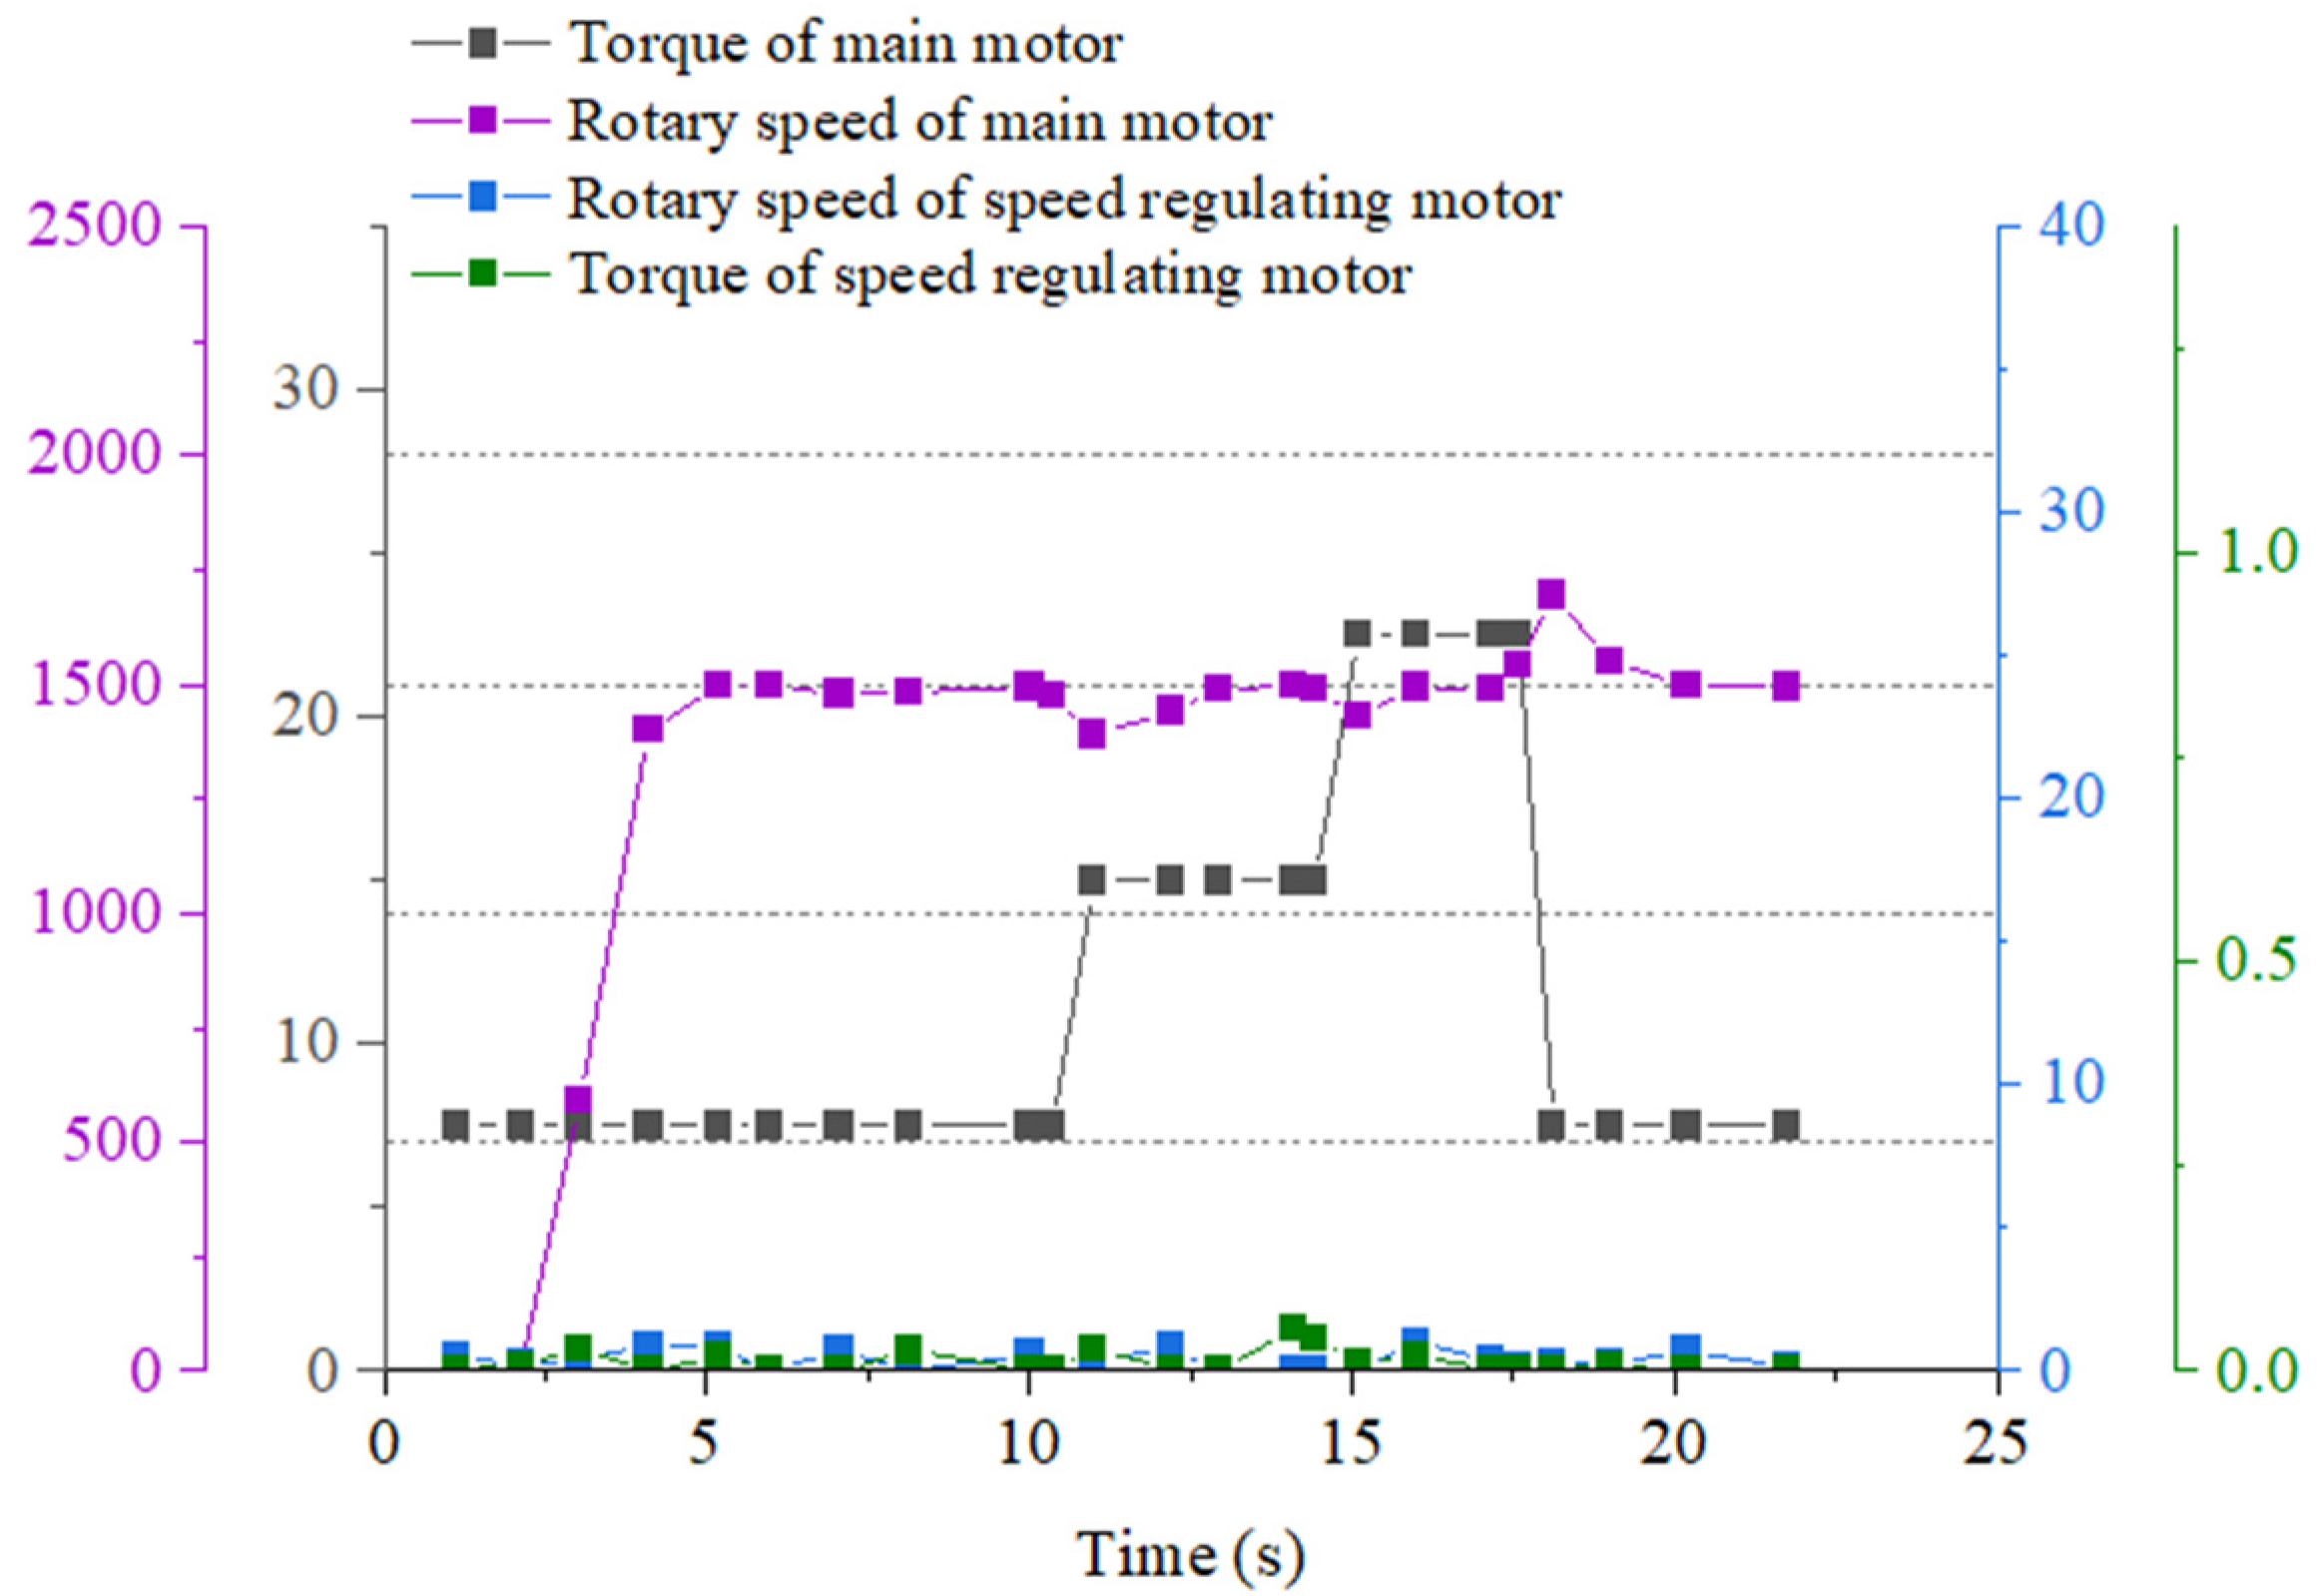
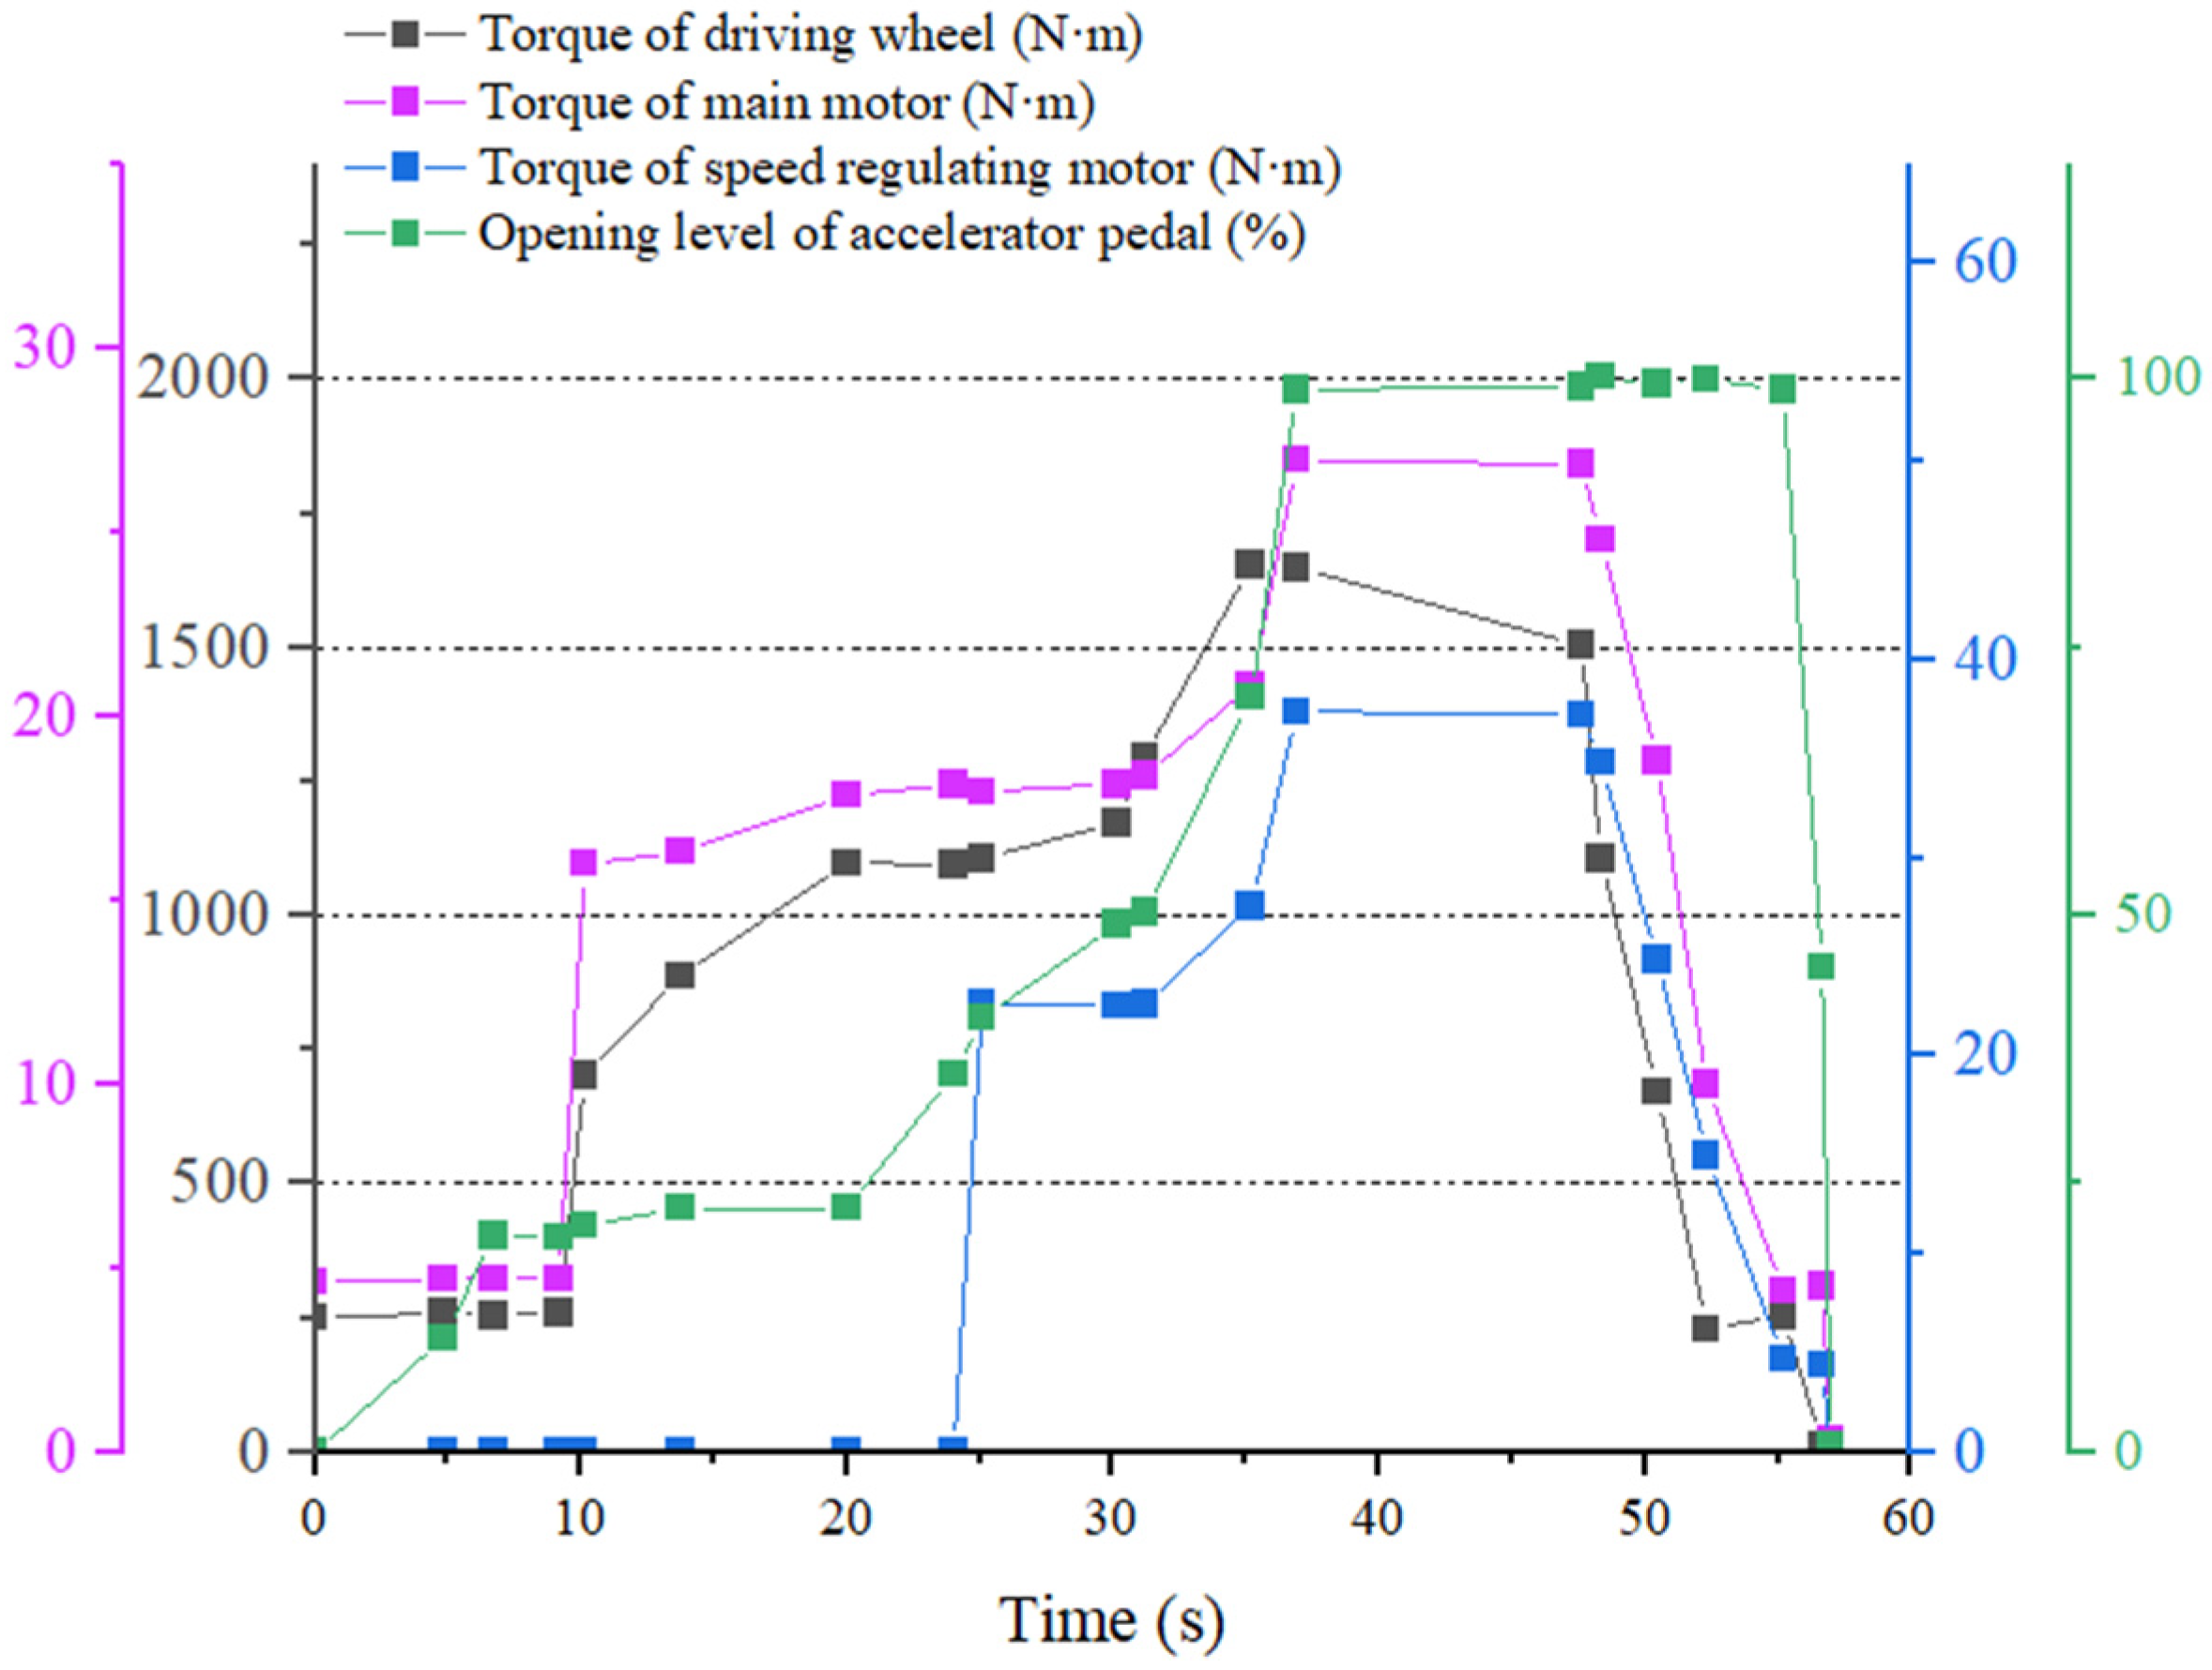
3.3.2. Plowing Operations

The plowing operation is a simulation of the main motor, the speed control motor pulling the plow, the walking operation of other farm equipment, and the PTO without load. It is a single plow body continuously plowing a depth from 0 cm to 20 cm. Rotary resistance is set to zero, and the simulation results are shown in Figure 17, Figure 18 and Figure 19.
As can be seen in Figure 17 and Figure 18, 0–25 s is the low tractor speed (v < 4 km/h), with the pedal open degree rises, the main motor speed and torque gradually rise, and the tractor speed slowly increases. At 25 s, the pedal open degree continues to increase, and the drive speed control motor works. At 30 s or so, the speed control motor torque and accelerating pedal into year-on-year changes. At 35–50 s, the main motor speed stability is 1700 r. At 35–50 s, the main motor speed stabilizes at 1700 r/min, and the speed control motor speed stabilizes at 3000 r/min. Currently, the accelerator pedal is open to 100%, and the tractor is in a stable operation. After completing the plowing operation, the pedal opening, main motor speed, and control motor speed will gradually reach zero.
As can be seen from Figure 19, during the plowing operation, the tractor battery SOC keeps decreasing, and ∆SOC = 0.18, which shows a linear and stable decrease.

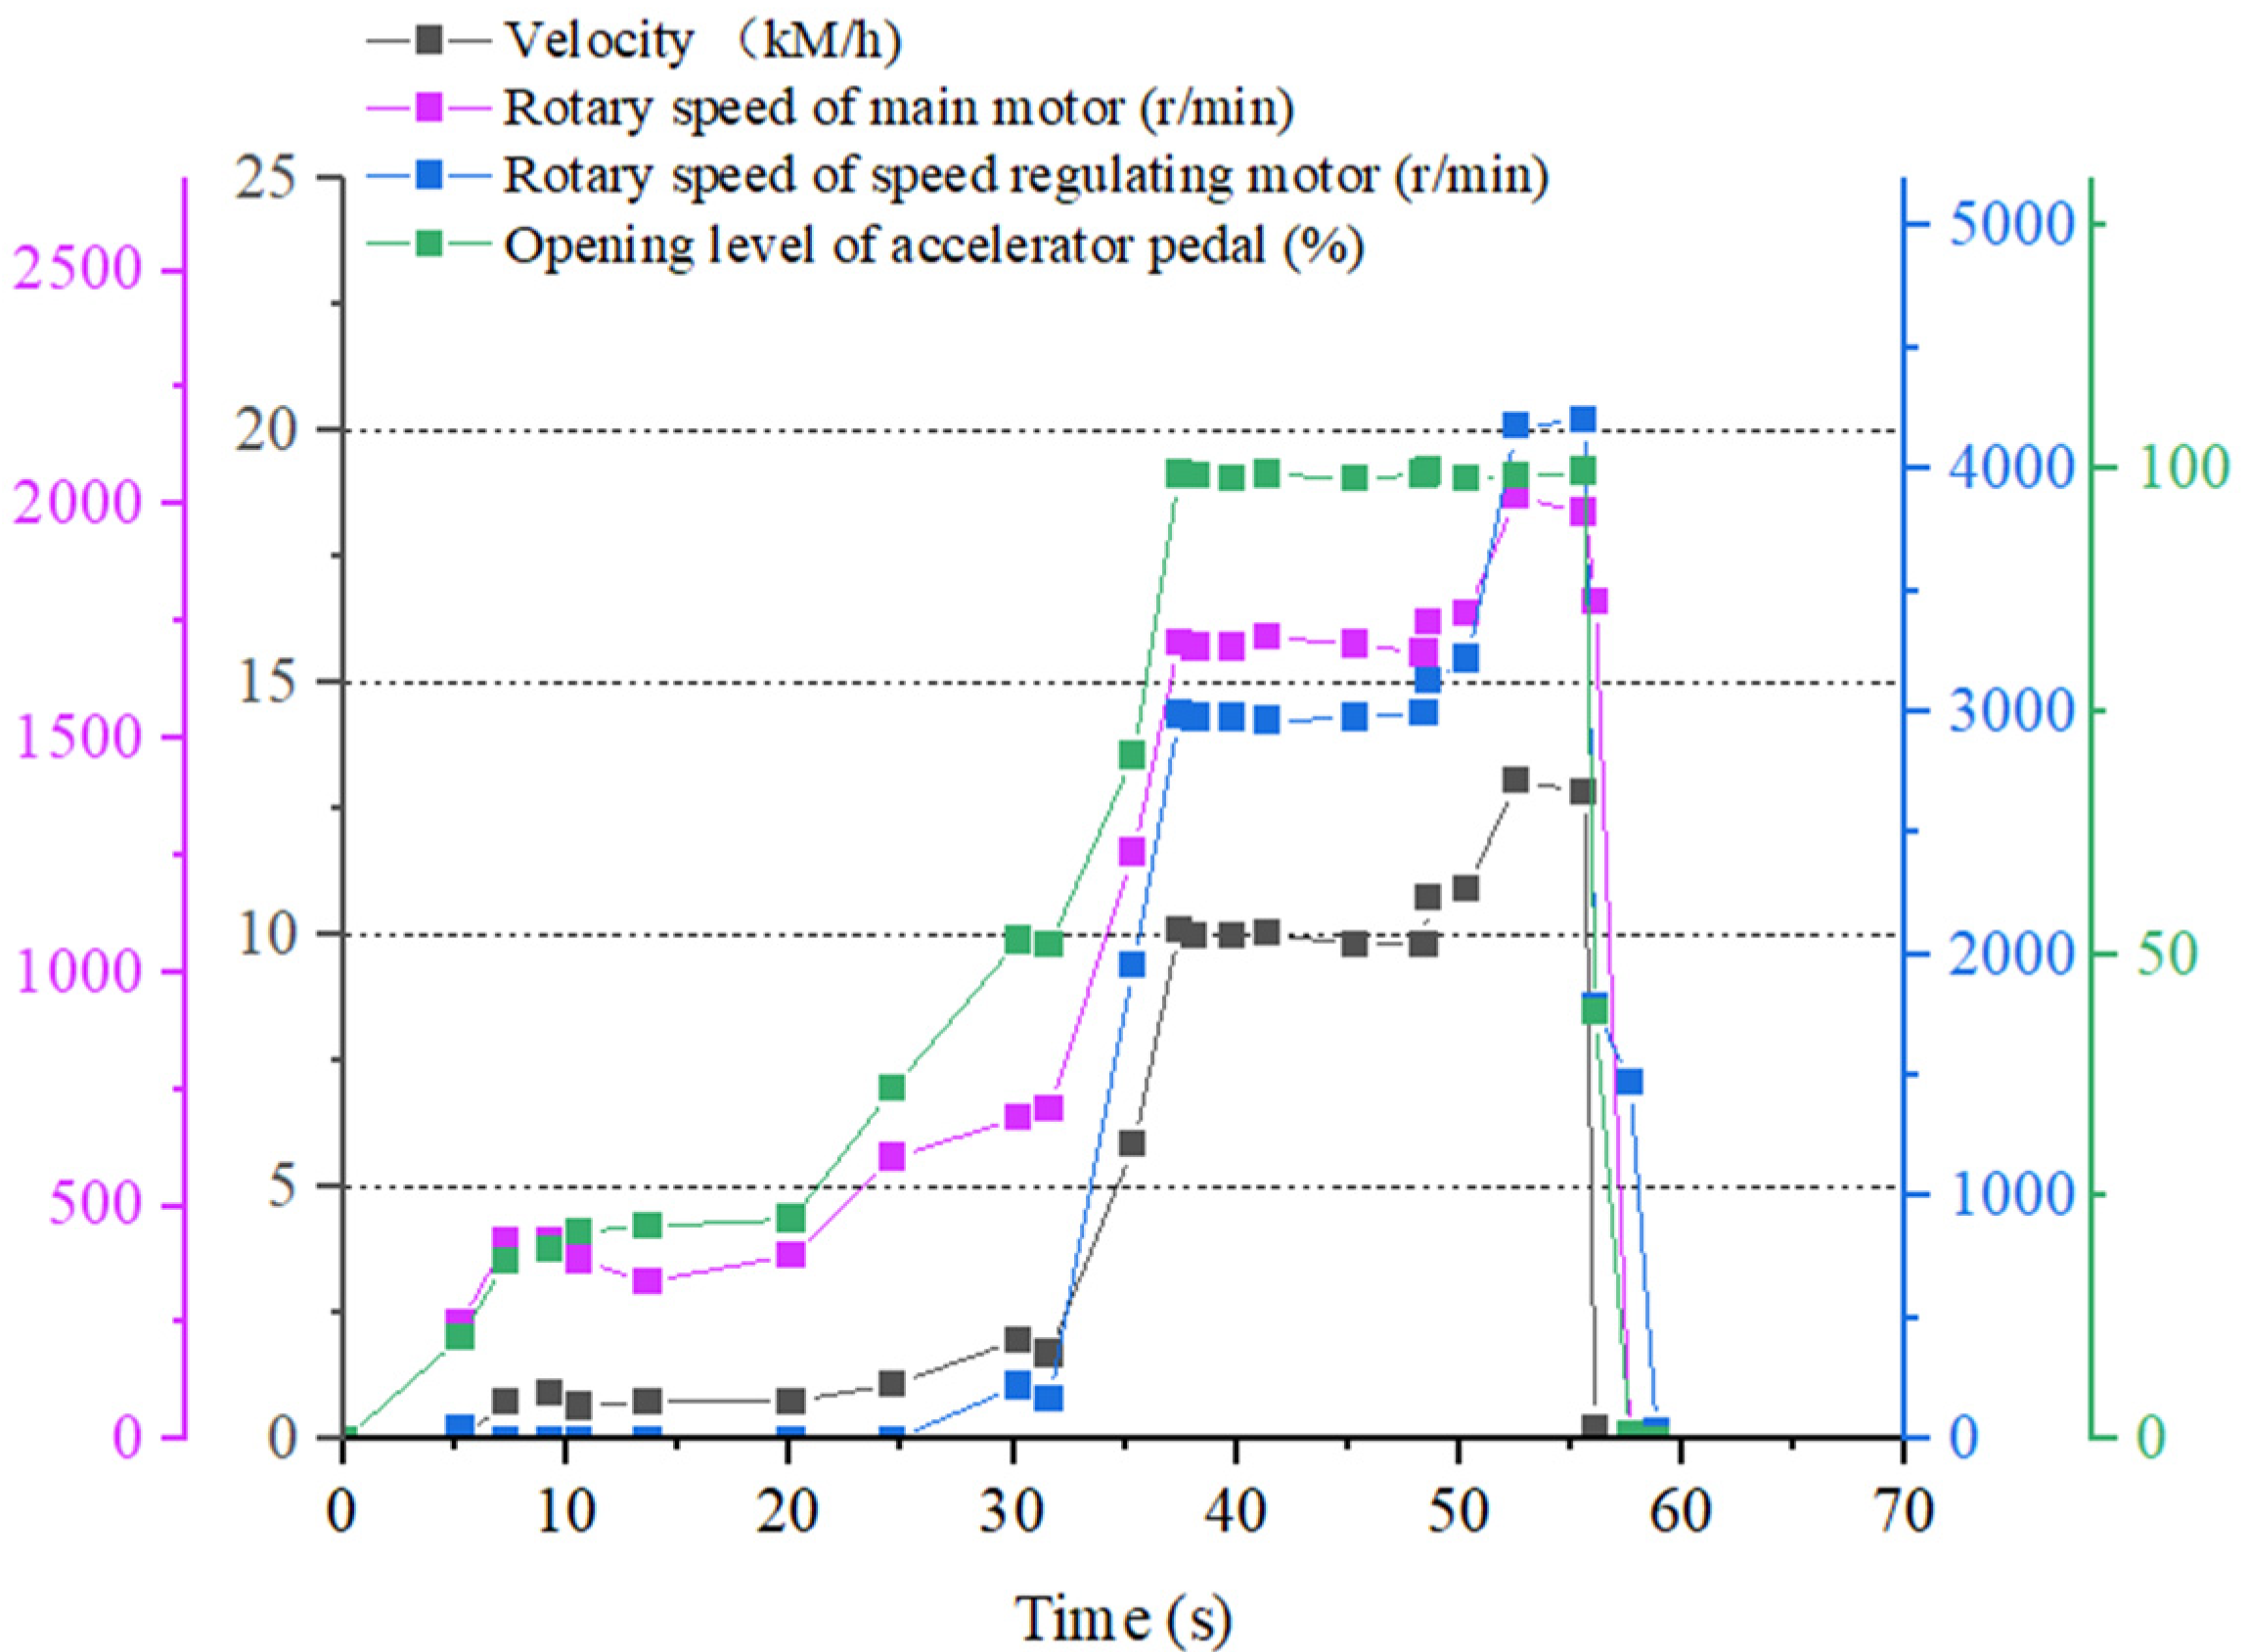
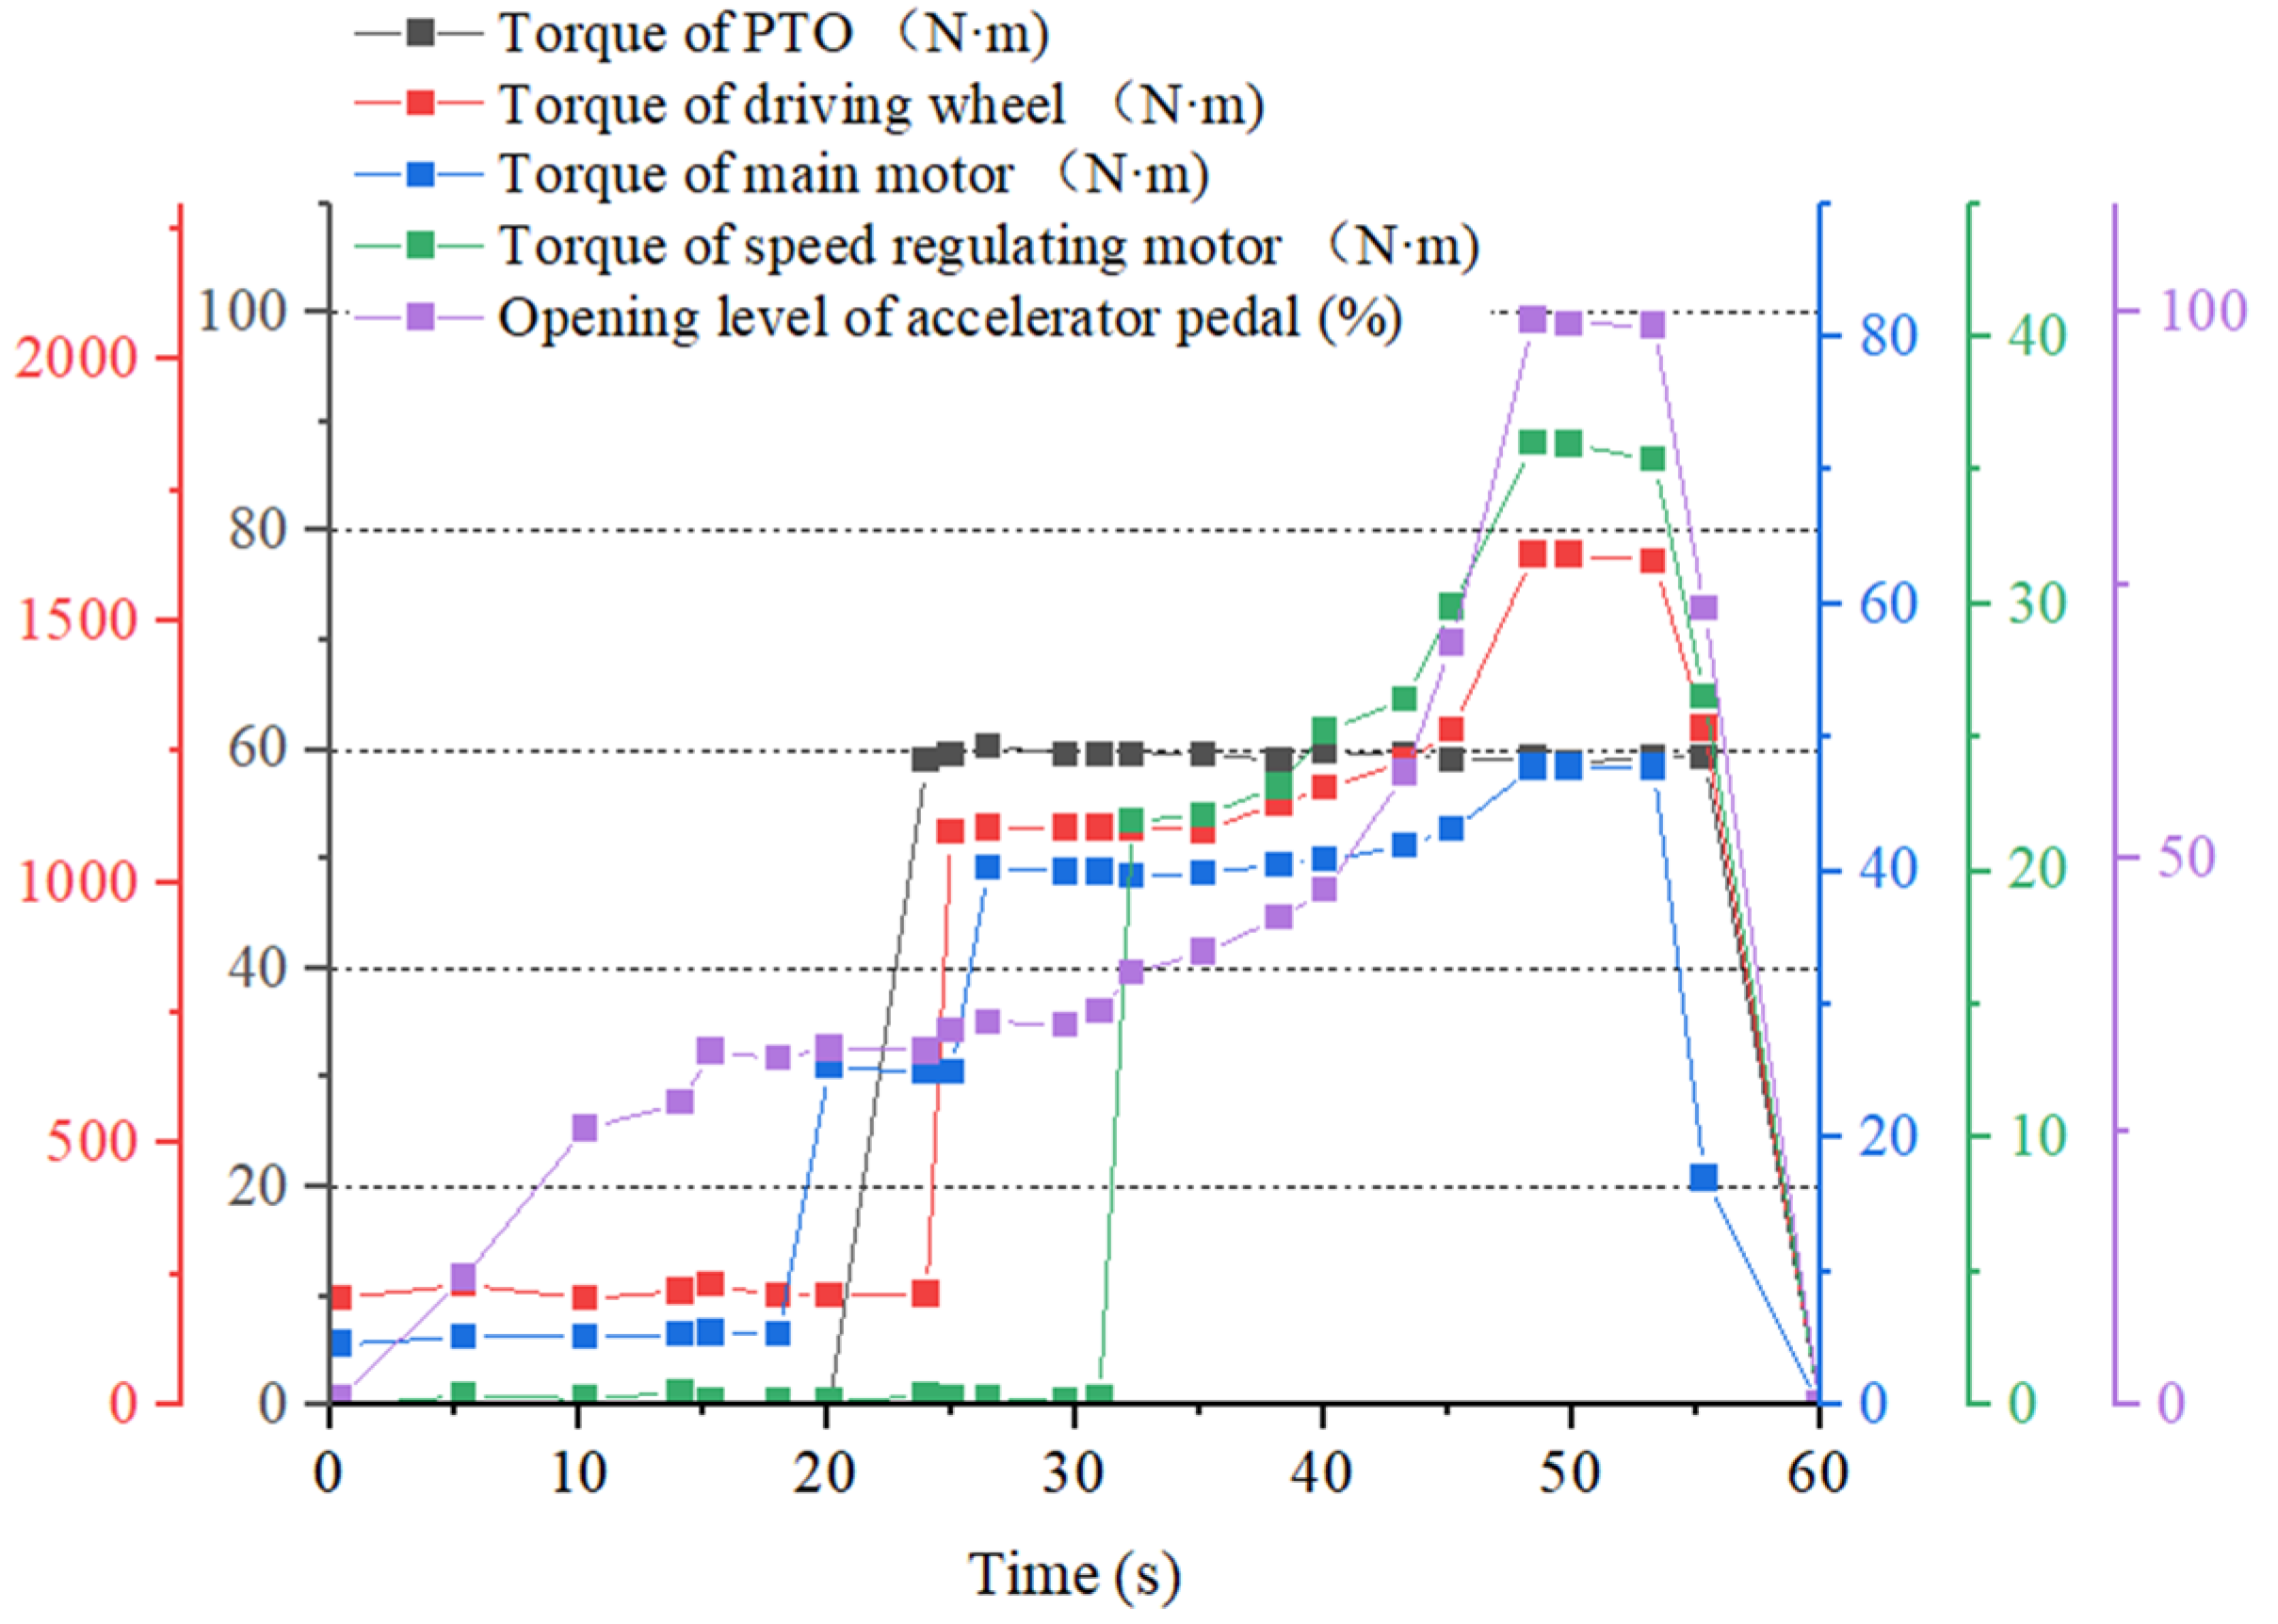
3.3.3. Rototilling Operation

The rototilling action simulates the main motor driving the PTO operation while driving the wheels. The simulation results for the rototilling action are shown in Figure 20, Figure 21 and Figure 22.
It can be seen from Figure 20 and Figure 21 that from 0–38 s is the low tractor speed (v < 4 km/h), as at this time the main motor drives alone; from 20 s, the depth of rotation is gradually adjusted from 0 cm to 20 cm, the PTO load torque increases from 0 to 60 N·m, and the drive wheel torque gradually increases to 1200 N·m; during this, the main motor speed and the speed with the increase in the accelerator pedal also continue to rise. At 48 s, when the accelerator pedal opens to 100%, the speed of the main motor remains at 1500 r/min, the speed of the governor motor is about 3000 r/min, and the speed of the car reaches about 10 km/h. The main and speed control motors can respond according to the load change, in time to complete the tractor rotating operation. The vehicle speed and pedal signal match well. The vehicle speed rises when the pedal is pressed and falls when the pedal is released, so the model built has good real-time performance.
As can be seen in Figure 22, the cell SOC keeps decreasing under the rotational operation condition, and ∆SOC = 0.08, which shows a linear and stable decrease.
The experimental results of the PTO motor power in the rotary tillage model are shown in Table 7, which shows that: in the rotary tillage mode, the tractor tillage power can reach 15.71 kW, the maximum torque of the output shaft can reach 150 N·m, the output shaft and motor speed are more stable, and the strategy shown in this paper has a better effect.

4. Conclusions

In this paper, we propose a motor torque distribution strategy for agricultural electric tractors in different tillage modes, which can solve the problem of the insufficient power of agricultural electric tractors in rotary tillage and plowing operations. The application range of agricultural electric tractors is expanded to ensure the operation effect of electric tillage tractors. The main results can be summarized as follows.
(1)
The demand torque during the operation of the tractor is divided into two parts, basic and compensating, and a simulation model for the calculation of torque is established separately.
(2)
The optimized demand torque combined with the battery SOC is assigned to both motors using fuzzy rules. The total torque is less than 22.6 N·m, and the speed-controlled motor is driven alone. The total torque increases to 31.4 N·m, and the main motor is driven separately. The total torque is greater than 31.4 N·m, and the two motors are driven together. The simulation results show that the PSO algorithm converges quickly, the adaptation value can be stabilized in about 20 iterations, and the main and the speed control motor can respond quickly and accurately according to the assigned torque, within 1 s.
(3)
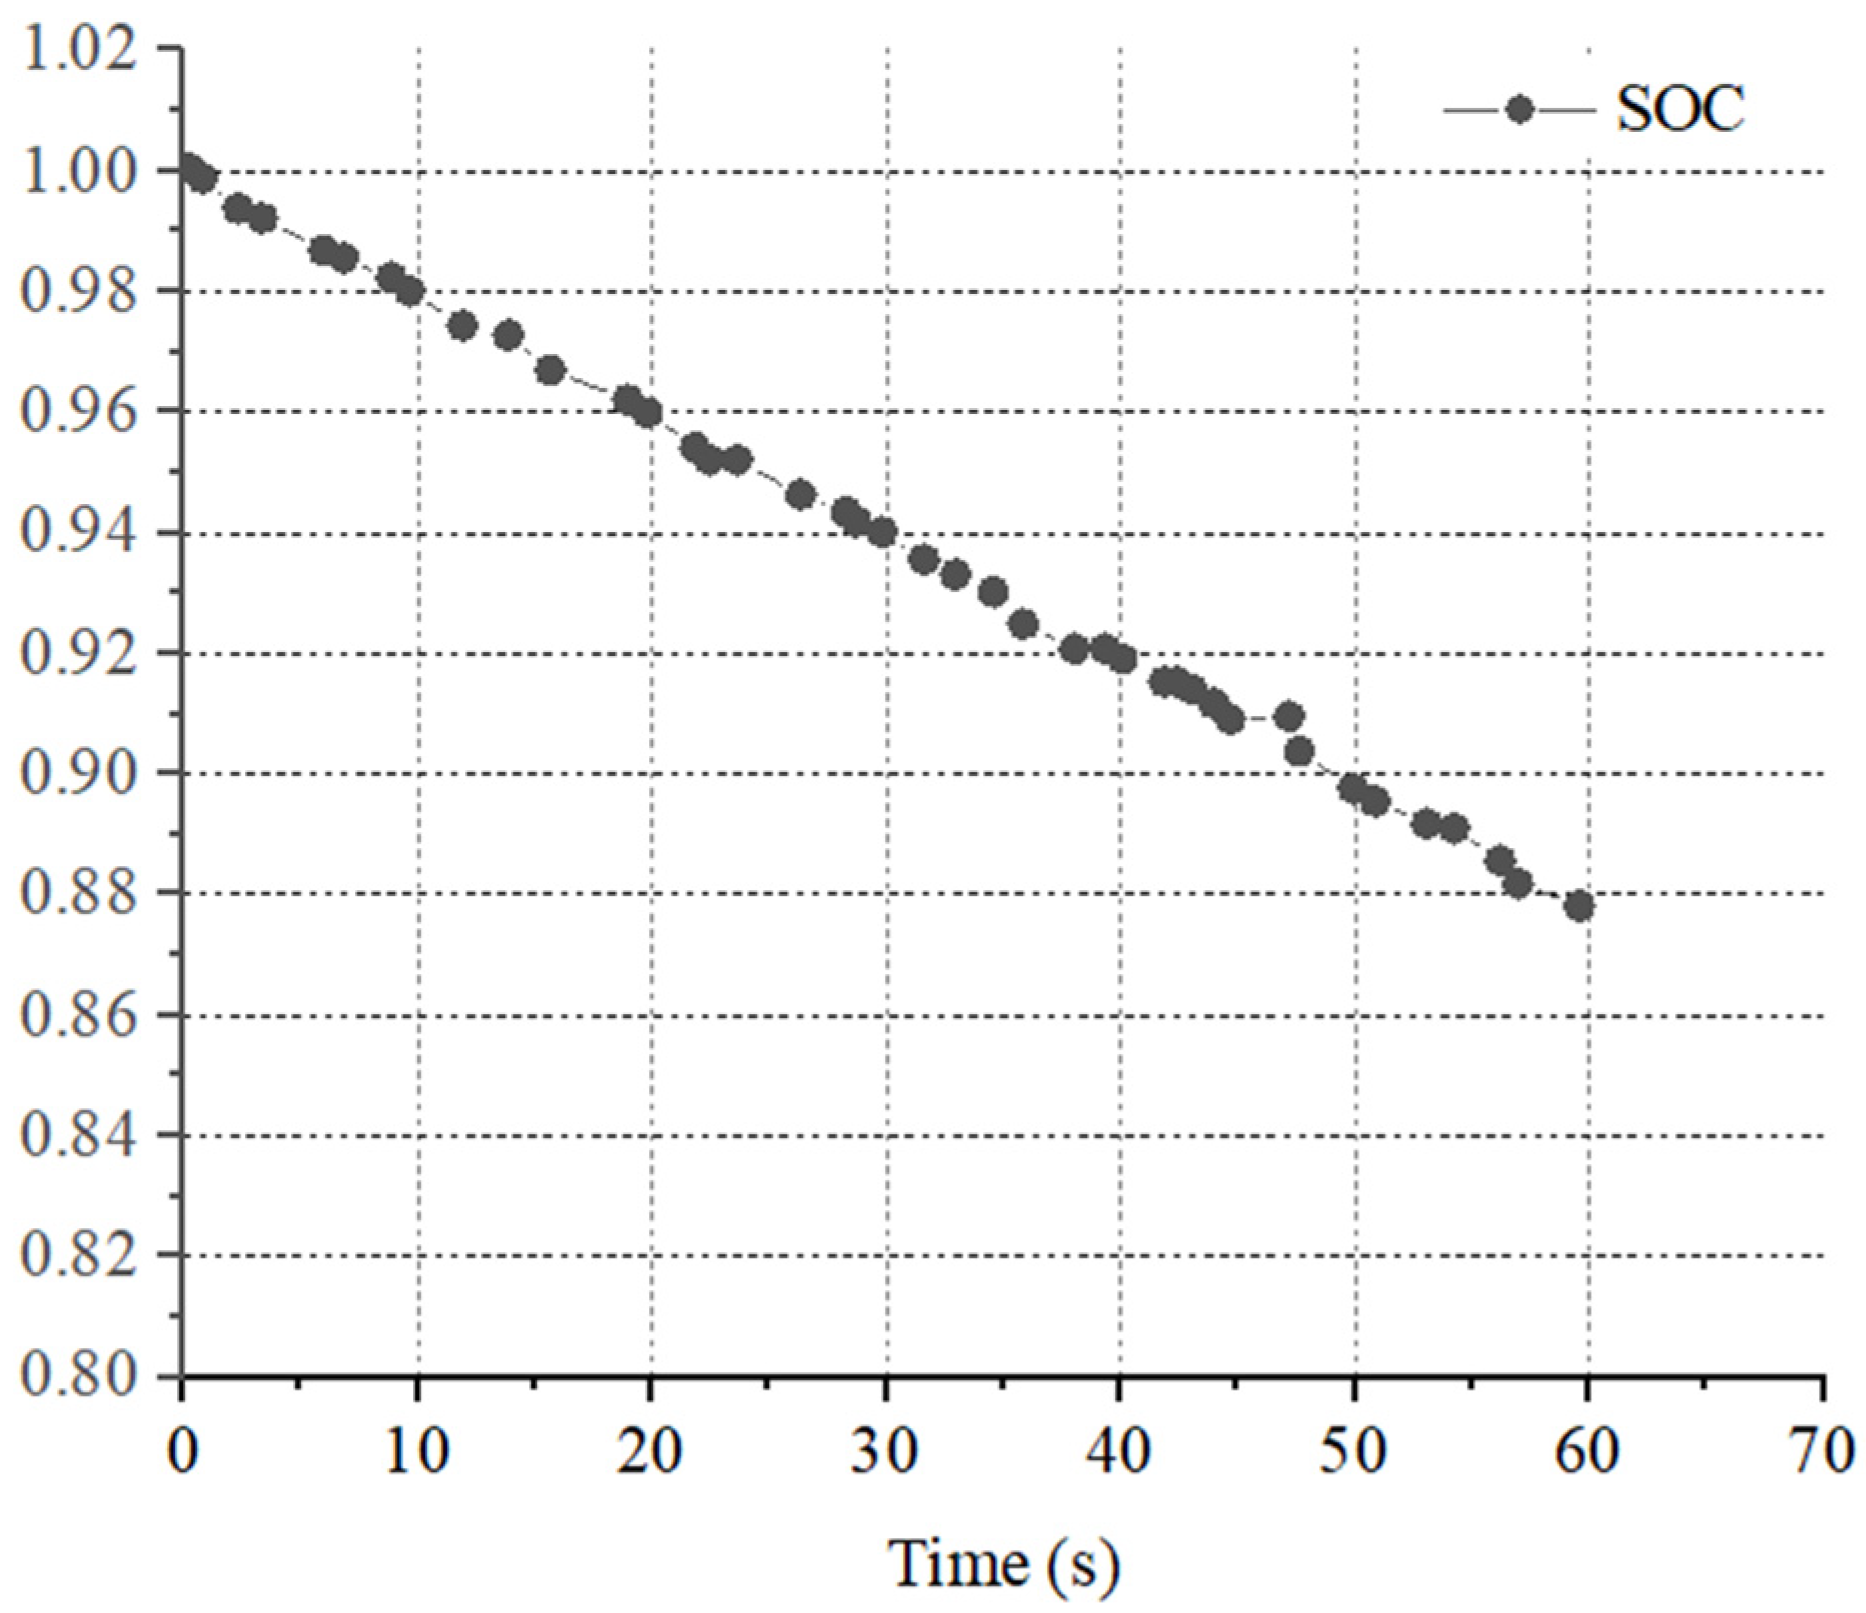
The bench test results show that the main and speed control motor respond within 3 s of receiving the pedal signal, with good real-time performance. The drive wheel torque of plowing and rotating operation can reach 1600 N·m. The PTO torque of rotating operation can reach 60 N·m. The maximum torque of the output shaft can reach 150 N·m during rotating tillage, with good tillage performance. The battery SOC shows a stable linear decrease during all tillage processes, and the battery’s working state has stability.

Author Contributions

Conceptualization, Z.T.; methodology, Y.Y. and Z.T.; validation, S.H. and S.G.; formal Analysis, Y.Y. and S.G.; data Curation, Y.Y. and S.H.; investigation, S.H. and S.G.; writing—original draft preparation, Y.Y. and S.H.; writing—review and editing, Z.T.; supervision, S.C. All authors have read and agreed to the published version of the manuscript.

Funding

This research work was supported by the Jiangsu Province University Students Practical Innovation Training Program Project (202210299211Y), the Jiangsu University Industrial Center Student Innovation and Practice Fund Project (ZXJG2021074), the Jiangsu Province University Students Practical Innovation Training Program Project (202210299058Z), and the Jiangsu University Student Research Project (21A230).

Data Availability Statement

The data used to support the findings of this study are available from the corresponding author upon request.

Conflicts of Interest

The authors declare no conflict of interest.

References

  1. Luo, X.W.; Liao, J.; Hu, L.; Zang, Y.; Zhou, Z.Y. Improving agricultural mechanization for sustainable agricultural development. Trans. Chin. Soc. Agric. Eng. 2016, 32, 1–11. [Google Scholar]
  2. Moreda, G.P.; Munoz-García, M.A.; Barreiro, P. High voltage electric~fiction of tractor and agricultural machinery A review. Energy Convers Manag. 2016, 115, 117–131. [Google Scholar] [CrossRef]
  3. Zhao, C.F.; Si, J.D.; Gong, L.J. Modeling and simulation analysis of electric tractor drive control system. Xinjiang Agric. Mech. 2022, 1, 15–17+37. [Google Scholar]
  4. Ghobadpour, A.; Mousazadeh, H.; Kelouwani, S.; Zioui, N.; Kandidayeni, M.; Boulon, L. An intelligent energy management strategy for an off-road plug-in hybrid electric tractor based on farm operation recognition. IET Electr. Syst. Transp. 2021, 11, 333–347. [Google Scholar] [CrossRef]
  5. Wang, Z.Z.; Zhou, J.; Yang, H.X.; Wang, X. Design and testing of a rapid prototyping platform measurement and control system for electric tractors. Trans. Chin. Soc. Agric. Mach. 2022, 2, 412–420. [Google Scholar]
  6. Chen, Y.N.; Xie, B.; Du, Y.F.; Mao, E.R. Powertrain parameter matching and optimal design of dual-motor driven electric tractor. Int. J. Agric. Biol. Eng. 2019, 12, 33–41. [Google Scholar] [CrossRef]
  7. Xie, B.; Wang, S.; Wu, X.H.; Wen, C.K.; Zhang, S.L.; Zhao, X.Y. Design and hardware-in-the-loop test of a coupled drive system for an electric tractor. Biosyst. Eng. 2022, 216, 165–185. [Google Scholar] [CrossRef]
  8. Wen, C.K.; Zhang, S.L.; Xie, B.; Song, Z.H.; Li, T.H.; Jia, F.; Han, J.G. Design and verification of innovative approach of dual-motor power coupling drive systems for electric tractors. Energy 2022, 247, 123538. [Google Scholar] [CrossRef]
  9. Li, T.H.; Xie, B.; Li, Z.; Li, J.K. Design and Optimization of a Dual-Input Coupling Powertrain System: A Case Study for Electric Tractors. Appl. Sci. 2020, 10, 1608. [Google Scholar] [CrossRef]
  10. Liu, M.N.; Li, S.Y.; Xu, L.Y.; Zhao, Y.R. Design and performance analysis of bi-directional coupled electric drive system for tractors. Trans. Chin. Soc. Agric. Mach. 2022, 53, 423–431 + 449. [Google Scholar]
  11. Kim, W.; Lee, D.H.; Kim, Y.J.; Kim, Y.S.; Park, S.U. Estimation of Axle Torque for an Agricultural Tractor Using an Artificial Neural Network. Sensors 2021, 21, 1989. [Google Scholar] [CrossRef]
  12. Wan-Soo, K.; Yong-Joo, K.; Seung-Yun, B.; Seung-Min, B.; Yeon-Soo, K.; Seong-Un, P. Development of a Prediction Model for Tractor Axle Torque during Tillage Operation. Appl. Sci. 2020, 10, 4195. [Google Scholar]
  13. Kim, W.S.; Kim, Y.S.; Kim, Y.J. Development of prediction model for axle torque od agriculture tractors. Trans. Asabe 2020, 63, 1773–1786. [Google Scholar] [CrossRef]
  14. Yin, D.J.; Wang, J.J.; Du, J.J.; Chen, G.; Hu, J.S. A New Torque Distribution Control for Four-Wheel Independent-Drive Electric Vehicles. Actuators 2021, 10, 122. [Google Scholar] [CrossRef]
  15. Mao, P.J.; Yin, S.S.; Min, J.J.; Zhang, Y.L.; Zhang, J.R.; Jiang, K. Research progress of electric tractor controller. Agric. Eng. 2017, 1, 11–14. [Google Scholar]
  16. Zhang, Y.F.; Lu, M.; Xie, Q. Economic-based drive design of greenhouse electric tractor. Xinjiang Agric. Mech. 2017, 5, 21–23 + 37. [Google Scholar]
  17. Xu, L.-Y.; Zhang, J.-J.; Liu, M.-N. Torque distribution strategy of incremental four-wheel drive electric tractor. J. Henan Univ. Sci. Technol. (Nat. Sci.) 2017, 38, 80–85. [Google Scholar]
  18. Wu, Z.B.; Xie, B.; Chi, R.J.; Ren, Z.Y.; Du, Y.F.; Li, Z. Drive torque management model for electric tractor field cruising operation. Trans. Chin. Soc. Agric. Eng. 2019, 4, 88–98. [Google Scholar]
  19. Wu, Z.B.; Xie, B.; Li, Z.; Chi, R.J.; Ren, Z.Y.; Du, Y.F.; Eiji, I.; Muneshi, M.; Takashi, O.; Yasumaru, H. Modeling and verification of driving torque management for electric tractor: Dual-mode driving intention interpretation with torque demand restriction. Biosyst. Eng. 2019, 182, 65–83. [Google Scholar] [CrossRef]
  20. Roeber, J.B.W.; Pitla, S.K.; Hoy, R.M.; Luck, J.D.; Kocher, M.F. Tractor Power Take-Off Torque Measurement and Data Acquisition System. Appl. Eng. Agric. 2017, 33, 679–686. [Google Scholar] [CrossRef]
  21. Wang, S.Y.; Hu, Z.C.; Chen, C.; Gao, X.M.; Gu, F.W.; Wu, H.C. Design and bench test automatic row alignment system of traction type sugar beet combine harvester. Trans. Chin. Soc. Agric. Mach. 2020, 4, 103–112 + 163. [Google Scholar]
  22. Pochi, D.; Grilli, R.; Fornaciari, L.; Betto, M.; Benigni, S.; Fanigliulo, R. Bench Testing of Sensors Utilized for In-Line Monitoring of Lubricants and Hydraulic Fluids Properties. Sensors 2021, 21, 8201. [Google Scholar] [CrossRef] [PubMed]
  23. Fatih, K.; Celalettin, Y.; Oguz, D.; Mehmet, O.G.; Necmettin, K. Design and development of tractor clutch using combined field and bench tests. Trans. Can. Soc. Mech. Eng. 2018, 42, 136–146. [Google Scholar]
  24. Huang, Z.J. DSP-based two-wheel drive system with switched reluctance motor for electric tractor. J. Agric. Mech. Res. 2022, 2, 241–245. [Google Scholar]
  25. Tao, Q.W.; Yan, X.H.; Tong, Y.J.; Yan, Y.X.; Xu, L.Y. Tractor indoor bench test technology status and outlook. Chin. J. Agric. Chem. 2021, 12, 121–128. [Google Scholar]
  26. Jin, A.J.; Shao, F.X.; Yan, Z.G. Adaptive fuzzy neural network-based vector control of induction motor. Electron. Sci. Technol. 2011. [Google Scholar] [CrossRef]
  27. Wu, Z.B.; Liu, Y.; Zhang, J.; Zhou, F.-T.; He, J.-Q.; Xie, B. Ballast configuration design and parameter optimization of electric tractor power battery. J. Agric. Mach. 2021, 10, 425–433. [Google Scholar]
  28. Tang, J.; Zheng, S.H.Q.; Wang, Z.C.; Hong, J.H.; Zhang, Y.B. A Particle Swarm Optimization with improved learning and compression factor. Yunnan Hydropower 2022, 6, 77–79. [Google Scholar]
  29. Qu, L.; Yang, Z.; Yang, N.; Xing, Y. Optimization of milling parameters using improved particle swarm algorithm. Mach. Des. Manuf. 2022, 7, 187–191. [Google Scholar]
  30. Wang, L.; Zong, J.; Wang, Y.; Fu, L.; Mao, X.; Wang, S. Compilation and bench test of tractor three-point suspension traction load spectrum based on optimal distribution fitting. J. Agric. Eng. 2022, 2, 41–49. [Google Scholar]
  31. Chen, A.Y.; Chen, S.R.; Shi, A.P.; Xu, L.Y.; Zhang, H.Z. Design of torque distribution strategy for electric tractor with dual motor coupling drive. Agric. Mech. Res. 2021, 11, 1–6. [Google Scholar]
  32. Chen, A.Y. Central Controller Strategy and Software Design for Electric Tractor with Dual Motor Coupling Drive. Master’s Thesis, Jiangsu University, Zhenjiang, China, 2020. [Google Scholar]
  33. Wang, Y.; Wang, L.; Zong, J.; Lv, D.; Wang, S. Research on Loading Method of Tractor PTO Based on Dynamic Load Spectrum. Agriculture 2021, 11, 982. [Google Scholar] [CrossRef]
  34. Huang, T.L.; Chen, S.R.; Shi, A.P.; Li, F.Q.; Pan, C.F. Energy management strategy for dual-motor power divider pure electric tractors. J. Agric. Mech. Res. 2020, 6, 246–250. [Google Scholar]
Figure 1. Motor MATLAB/Simulink model.
Agriculture 12 01373 g001
Figure 2. Battery Simulink model.
Agriculture 12 01373 g002
Figure 3. Demand torque calculation strategy model.
Agriculture 12 01373 g003
Figure 4. Tractor driving force analysis.
Agriculture 12 01373 g004
Figure 5. Speed demand torque model.
Agriculture 12 01373 g005
Figure 6. Control model flow chart.
Agriculture 12 01373 g006
Figure 7. Traction demand torque model.
Agriculture 12 01373 g007
Figure 8. Suspension compensation torque model.
Agriculture 12 01373 g008
Figure 9. Algorithm flow chart.
Agriculture 12 01373 g009
Figure 10. Performance test of motor torque distribution.
Agriculture 12 01373 g010
Figure 11. Pedal opening vs. torque load factor curve.
Agriculture 12 01373 g011
Figure 12. Electric tractor pedal opening and pedal opening change rate affiliation function graph. (a) Plot of pedal opening affiliation function before training; (b) plot of the affiliation function of the pedal rate of change before training; (c) plot of pedal opening affiliation function after training; (d) plot of the affiliation function of the pedal rate of change after training.
Agriculture 12 01373 g012
Figure 13. Simulink simulation of the algorithm.
Agriculture 12 01373 g013
Figure 14. Simulation results of torque distribution algorithm.
Agriculture 12 01373 g014
Figure 15. PTO speed and load torque curves.
Agriculture 12 01373 g015
Figure 16. Speed and torque curves of main motor and speed control motor.
Agriculture 12 01373 g016
Figure 17. Curves of speed, main motor speed, governor motor speed, and accelerator pedal opening.
Agriculture 12 01373 g017
Figure 18. Curves of drive wheel equivalent torque, PTO load torque, main motor torque, speed control motor torque, and accelerator pedal opening.
Agriculture 12 01373 g018
Figure 19. Battery SOC.
Agriculture 12 01373 g019
Figure 20. Curves of speed, PTO speed, main motor speed, speed control motor speed, and accelerator pedal opening.
Agriculture 12 01373 g020
Figure 21. Curves of dynamic wheel equivalent torque, PTO load torque, main motor torque, speed control motor torque, and accelerator pedal opening.
Agriculture 12 01373 g021
Figure 22. Battery SOC.
Agriculture 12 01373 g022
Table 1. PSO algorithm parameters.
Number   of   Particles   N Particle   Dimension   d Learning   Factor   C 1 C 2 Inertia   Weights   ω Number   of   Iterations   M
50220.5100
Table 2. Parameters of the fuzzy controller.
ParametersOn DomainFuzzy Subsets
T r e q [0, 1]{very small (TS), small (S), medium (M), large (B), large (TB)}
SOC [0, 1]{very low (TL), low (L), medium (M), high (H), very high (TH)}
λ [0, 1]{very small (TS), small (S), medium (M), large (B), large (TB)}
Table 3. Fuzzy controller parameter settings.
Serial NumberParametersOn Domain Taking
1Accelerator pedal change amount L[0, 1]
2Accelerator pedal rate of change ΔL[0, 1]
3Traction torque coefficient ΔTt[−1, 1]
4Input parameters{0, 0.25, 0.5, 0.75, 1}
5Output parameters{−1, −0.5, 0, 0.5, 1}
\Fuzzy subset of each variable{TS, S, M, B, TB}
Table 4. Fuzzy control rules.
Δ T t L
TSSMBTB
Δ L TSTSTSTSTSTS
SSTSTSTSTS
MBMSSTS
BTBTBMMS
TBTBBMSTS
Table 5. Fuzzy rule table.
λ SOC
TLLMHTH
T r e q TSTSTSBTBTB
STSTSMTBB
MTSTSSMM
BTSTSTSMS
TBTSTSTSSS
Table 6. PSO algorithm convergence speed statistics.
Serial Number Velocity   V   ( k m / h ) Torque   T   ( N · m ) Number of Convergence IterationsAdequate Function Value
a630020–3079.0
b6900<20176.0
c18500<20242.82
d1860030–4048.4
Table 7. Experimental results of PTO motor power in rotary tillage mode.
Serial NumberPower/kWOutput Shaft Torque/N·mRotational Speed/r·min−1Battery Carrying Voltage/VCurrent/AMotor Case Temperature/°C
Output ShaftElectric Motors
12.092010003612394.06.535.4
24.18409983605394.112.838.6
36.286010003612394.319.141.2
48.388010003612394.226.043.5
510.4710010003612394.132.245.2
612.5712010003612394.238.047.6
714.6614010003612394.046.150.2
815.7115010003612394.248.649.8
Publisher’s Note: MDPI stays neutral with regard to jurisdictional claims in published maps and institutional affiliations.

