Article

Potato Visual Navigation Line Detection Based on Deep Learning and Feature Midpoint Adaptation

1
College of Mechanical and Electrical Engineering, Qingdao Agricultural University, Qingdao 266109, China
2
College of Mechanical and Electrical Engineering, Hainan University, Haikou 570228, China
3
College of Automation, Zhongkai University of Agriculture and Engineering, Guangzhou 510225, China
*
Author to whom correspondence should be addressed.
Agriculture 2022, 12(9), 1363; https://doi.org/10.3390/agriculture12091363
Submission received: 28 June 2022 / Revised: 30 August 2022 / Accepted: 31 August 2022 / Published: 1 September 2022

Abstract

:
Potato machinery has become more intelligent thanks to advancements in autonomous navigation technology. The effect of crop row segmentation directly affects the subsequent extraction work, which is an important part of navigation line detection. However, the shape differences of crops in different growth periods often lead to poor image segmentation. In addition, noise such as field weeds and light also affect it, and these problems are difficult to address using traditional threshold segmentation methods. To this end, this paper proposes an end-to-end potato crop row detection method. The first step is to replace the original U-Net’s backbone feature extraction structure with VGG16 to segment the potato crop rows. Secondly, a fitting method of feature midpoint adaptation is proposed, which can realize the adaptive adjustment of the vision navigation line position according to the growth shape of a potato. The results show that the method used in this paper has strong robustness and can accurately detect navigation lines in different potato growth periods. Furthermore, compared with the original U-Net model, the crop row segmentation accuracy is improved by 3%, and the average deviation of the fitted navigation lines is 2.16°, which is superior to the traditional visual guidance method.

1. Introduction

As the world’s population continues to grow, so does the demand for agricultural products. According to the United Nations World Population Prospects, the global population will reach 9.6 billion in 2050 [1]. As the fourth major food crop in the world, potato is produced in large quantities, but its yield per unit area is low. Among them, the low level of intelligence of agricultural machinery is an important factor limiting the increase in its yield per unit area. As a result, in the event of limited resources such as land, the key focus for current agricultural academics is to investigate how to apply new technology to increase grain production per unit area [2] to fulfill the growing demand of the population. Automatic guidance technologies are not only a means to reduce the waste of labor resources [3], they are also a means to improve the level of intelligence of agricultural machinery, which in turn helps to boost food harvests. At present, most potato machinery with intelligent control technology relies on GPS or inertial navigation for operation. However, the cost of satellite navigation is high, and global path planning of the operating area is required before each use. In contrast, visual navigation stands out among other navigation methods because of its low cost and high flexibility [4].
Many experts have performed a great deal of research on this visual navigation technology [5,6,7]. The most important issue of visual navigation is to extract navigation information from the acquired images. According to conventional methods, navigation information extraction is generally divided into image segmentation, feature extraction, clustering, and navigation line fitting. Image segmentation is the primary work of navigation line extraction, and its segmentation effect determines the accuracy of navigation line extraction. Moreover, the segmentation effect is often different due to different objects. In the field of agriculture, researchers often use crops as segmentation objects for image preprocessing. However, the appearance differences exhibited by crops in different growth periods often have an impact on the segmentation effect. Potatoes, in particular, have obvious differences in crop appearance in different periods. In addition, illumination and the presence of weeds in the field also affect the segmentation effect of the image. Therefore, finding a method for extracting potato visual navigation lines which can adapt to multiple growth periods and is not disturbed by noise, such as illumination and weeds, to meet the navigation requirements of potato machinery in different periods is an important focus of study for researchers.
Image-based guidance technology is mainly divided into two categories: traditional image processing and image processing based on deep learning [8]. In the traditional processing method, many researchers have devoted themselves to improving the classical green feature algorithm and Otsu algorithm to provide better cropping and background segmentation effects [9,10,11] before using cropping features to extract navigation lines. This approach has obtained decent results in field crop environment segmentation [12]. To efficiently identify corn seedlings and weeds in the field, Montalvo et al. [13] used the double-threshold segmentation approach, followed by another threshold segmentation after utilizing the Otsu threshold method, which significantly reduced the influence of field weeds on crop row segmentation. In this manner, they realized the identification and detection of straight and curved crop rows. Yue Yu et al. [12] used a triple classification method to segment rice seedlings, and then used a two-dimensional adaptive clustering method to eliminate misleading crop feature points. The experimental results show that this method can achieve better navigation line extraction results in weeds, duckweed, and eutrophic complex paddy field environments. In addition, there are various experts dedicated to the study of stereo vision [14,15,16]. To meet the precise navigation operation of a cotton harvester, Fue et al. [17] proposed a cotton crop row detection method based on stereo vision, which provided an effective solution for the crop row detection of canopy crops and is expected to assist RTK-GNSS navigation in harvesting cotton bolls. However, the accuracy and real-time performance of stereo vision matching are problems that remain to be solved. Although the above traditional image processing methods are effective in specific situations, they are easily affected by noise, such as light and weeds, and have poor anti-interference ability. Moreover, potatoes vary in appearance in different growth periods, and there are different requirements for the setting of a segmentation threshold.
In recent years, Artificial intelligence [18] and deep learning have made significant progress in the fields of autonomous driving [19], medical image processing [20,21], and speech recognition [22]. Especially with the application of transfer learning [23], it solves the important problem of the lack of relevant datasets in the agricultural field. It is most commonly used in crop identification [24,25], weed identification [26,27], plant pest detection [28,29,30], water quality monitoring [31], and agricultural robot navigation in the field of agricultural engineering. To reduce the complexity of traditional image segmentation, many researchers utilize object detection and semantic segmentation techniques to locate crop rows [32,33]. Based on the ES-Net network model, Adhikari SP et al. [34] performed segmentation training on the rice line dataset [35], and the sliding window algorithm was used to cluster and fit the crop lines within the ROI. Finally, the geometric midline formed by two crop rows was used as the navigation line. The results show that the error was approximately 5-pixel values. To adapt to the different row spacing of strawberries, Ponnambalam et al. [36] used SegNet [37] to identify and segment strawberry crop rows. The semantic information was divided into three categories: strawberry row, non-crop row, and background. In the end, the adaptive ROI algorithm was used to achieve the autonomous navigation of strawberries with various line spacings. Bah et al. proposed a CRowNet model [38] consisting of SegNet and CNN-based Hough transform for UAV crop row detection. The performance of this method was quantitatively compared with traditional methods, and a good crop row detection rate of 93.58% was obtained. In addition, the object detection algorithm was also applied to crop row recognition. Jiahui Wang [39] used the YOLO V3 object detection algorithm to identify paddy field seedlings under various working conditions. In this paper, segmentalized labeling and the prediction box were used to locate paddy rice seedlings, providing a new method for crop row detection. To make the navigation line detection effect suitable for different growth periods of kiwifruit trees, Zongbin Gao [40] identified the kiwifruit trunks based on the Yolo v3 Tiny-3p model and fitted the navigation lines through the midpoints of the trunks on both sides of the road. The results show that the extracted guidelines can be applied to different kiwifruit growing environments. The above research shows that the crop row detection method based on deep learning is widely used, and it is more and more favored by researchers because of its strong learning ability and robustness. However, due to the lack of data samples, such methods only have strong applicability to specific learned objects. For the detection of potato crop rows and their different periods, in particular, no research exists at present.
The objective of this study was to utilize deep learning-based methods to reduce the impact of illumination, weeds, and other noise on crop row segmentation and to achieve accurate segmentation of potato crop rows in different growth periods, something that has not been fully addressed in the literature. In addition, a feature midpoint adaptive navigation line extraction method is proposed, which can realize the adaptive adjustment of the vision navigation line position according to the growth shape of the potato to ensure that the potato machine always maintains the center position of the row during operation. The main contributions are as follows:
  • A potato crop row dataset was established under various growth periods and lighting conditions.
  • Based on improved U-Net, a segmentation and recognition model of potato crop rows was constructed.
  • A complete detection scheme for the potato visual navigation line suitable for multiple growth periods was proposed.
The remainder of this paper is divided as follows: Section 2 contains the details of potato visual navigation line detection. Section 3 details the model segmentation and vision navigation fitting results and provides the discussion. Finally, Section 4 provides this study’s conclusions.

2. Materials and Methods

As shown in Figure 1, the potato visual navigation line detection system proposed in this paper is mainly composed of two parts: semantic segmentation and feature midpoint adaptive fitting. First, semantic segmentation is performed on the RGB images captured by the camera. Secondly, the feature midpoint adaptive algorithm is used to locate the crop row and detect the navigation line. The details are as follows:
  • Potato crop row segmentation and prediction: First, the dataset is established for the potato crop rows under various working conditions, and then the dataset is trained using the improved U-Net semantic segmentation model to obtain the training weights, in which data augmentation is used to prevent overfitting during training. The newly acquired images are then segmented using the training weights to obtain segmentation masks for the potato crop row and background.
  • Feature midpoint adaptation fitting: First, the ROI is set on the segmented binary image mask. Secondly, the edge information of the potato crop row within the ROI is extracted, and the center position of the crop row is located using the extracted boundary points. Since the segmentation effect may occasionally be unsatisfactory, resulting in the center of the crop row being incorrectly positioned, a simple k-means algorithm is introduced to correct it, but this situation is extremely rare. Then, the crop row center position is used to locate the lane center position, and finally, the least squares method is used to fit the navigation line to the lane center point.

2.1. Data Collection and Annotation

The 3WP-700PG unmanned sprayer (Qingdao, China, Wuniu Intelligent Technology Co., Ltd., Qingdao, China) image acquisition platform is shown in Figure 2a. The platform is an electric-driven spraying robot equipped with inertial navigation, which has two working modes: manual remote control and automatic driving. RS232 communicates data between a top-level navigation decision system and a low-level execution system. The image acquisition equipment comprises a ZED camera from Stereolabs, which has a 4 M pixel sensor with 2 um pixels and can operate in challenging environments. As an image acquisition device, the ZED binocular camera is mounted at the front of the high-ground-clearance sprayer, at a height of 200 cm from the ground and a horizontal angle of 70° with the ground. The monocular size of the collected images is 1280 × 720 pixels. The sprayer’s lever arm is opened during collection, and the high-ground-clearance sprayer is controlled by remote control to simulate spraying.
Data were collected using two different methods: a mobile phone camera and a camera mounted on a moving vehicle. Uncertainty in an artificial shooting angle can help avoid overfitting and improve the model segmentation’s robustness by increasing the diversity of the sample dataset. To cover all periods of potato growth, a variety of image datasets were created. The image collection site was the National Key Project Demonstration Base of Potato Intelligent Production Equipment in Jiaolai Town in Jiaozhou City, Shandong Province. The collection took place from March to June 2021. Images were taken under different illumination conditions during the three periods of potato growth, i.e., the seedling, tillering, and tuber setting periods. Table 1 shows the total number of images gathered.
The potato crop row dataset was created by selecting 1200 images from the collected data. For the segmentation dataset and the original image information to be consistent, these images were manually annotated with the LabelMe software(LabelMe ==3.16.7, CSAIL, MIT, Massachusetts, America). The potato crop row outlines were retained during labeling. Because only the effect of the potato crop rows was considered in this paper, all other information in the image was considered background. The rows of potatoes in Figure 3 were annotated using the LabelMe software. These were then converted to label files containing only the semantic information of the crop line that was gathered during the annotation process.

2.2. Semantic Segmentation

The U-Net semantic segmentation model was used to perform the crop row segmentation task. The U-Net semantic segmentation network is the earliest semantic segmentation model for biomedical cells and was proposed by Olaf Ronneberger et al., 2015 [41]. The model is divided into two parts: encoding and decoding, i.e., the backbone feature extraction network and the enhanced feature extraction network. The backbone feature extraction network is the coding part of this network and is responsible for feature extraction. The enhanced feature extraction network on the right is the decoding part, which is responsible for feature restoration. The training data input to the model is comprised of patches, so there is no requirement for the sample size of the dataset. However, since the model needs to be trained for each patch, overlapping patches waste resources, and the training time increases.
To reduce the training time and speed up the convergence of the model, in this paper, the VGG16 model was used as the backbone feature extraction network of the U-Net network. The structure of the VGG16 model is shown in Figure 4. When used, the max-pooling layer and the subsequent fully connected layer in the fifth convolution, plus the max-pooling structure of the VGG16 model, are deleted. This part consists of 13 convolutional layers with kernel size 3 × 3, stride 1 and padding pixel 1, and four max-pooling layers with size 2 × 2, stride 2 and padding pixel 1, and the ReLU activation function. As compared with the original U-Net model, three layers of convolution depth are added so that the model can better extract the feature information of potato crop rows. After the encoding part is completed, five preliminary valid feature layers are obtained.
The enhanced feature extraction network comprises four upsampling modules with a stride of 2 and a convolution kernel size of 3 × 3; eight convolutional layers with a size of 3 × 3, a stride of 1, and pixel padding of 0; and four skip connection layers. The last convolutional layer of the backbone feature extraction network carries out directly doubled upsampling. The height and width of the feature map are doubled during the upsampling process to facilitate the construction of the model and make it universal. The effective feature layer obtained from the backbone feature extraction network is then fused with the final output image height and width using skip connections, resulting in the final output image height and width being equal to the input image height and width. Figure 5 depicts the U-Net (also known as VU-Net) model structure used in this paper.

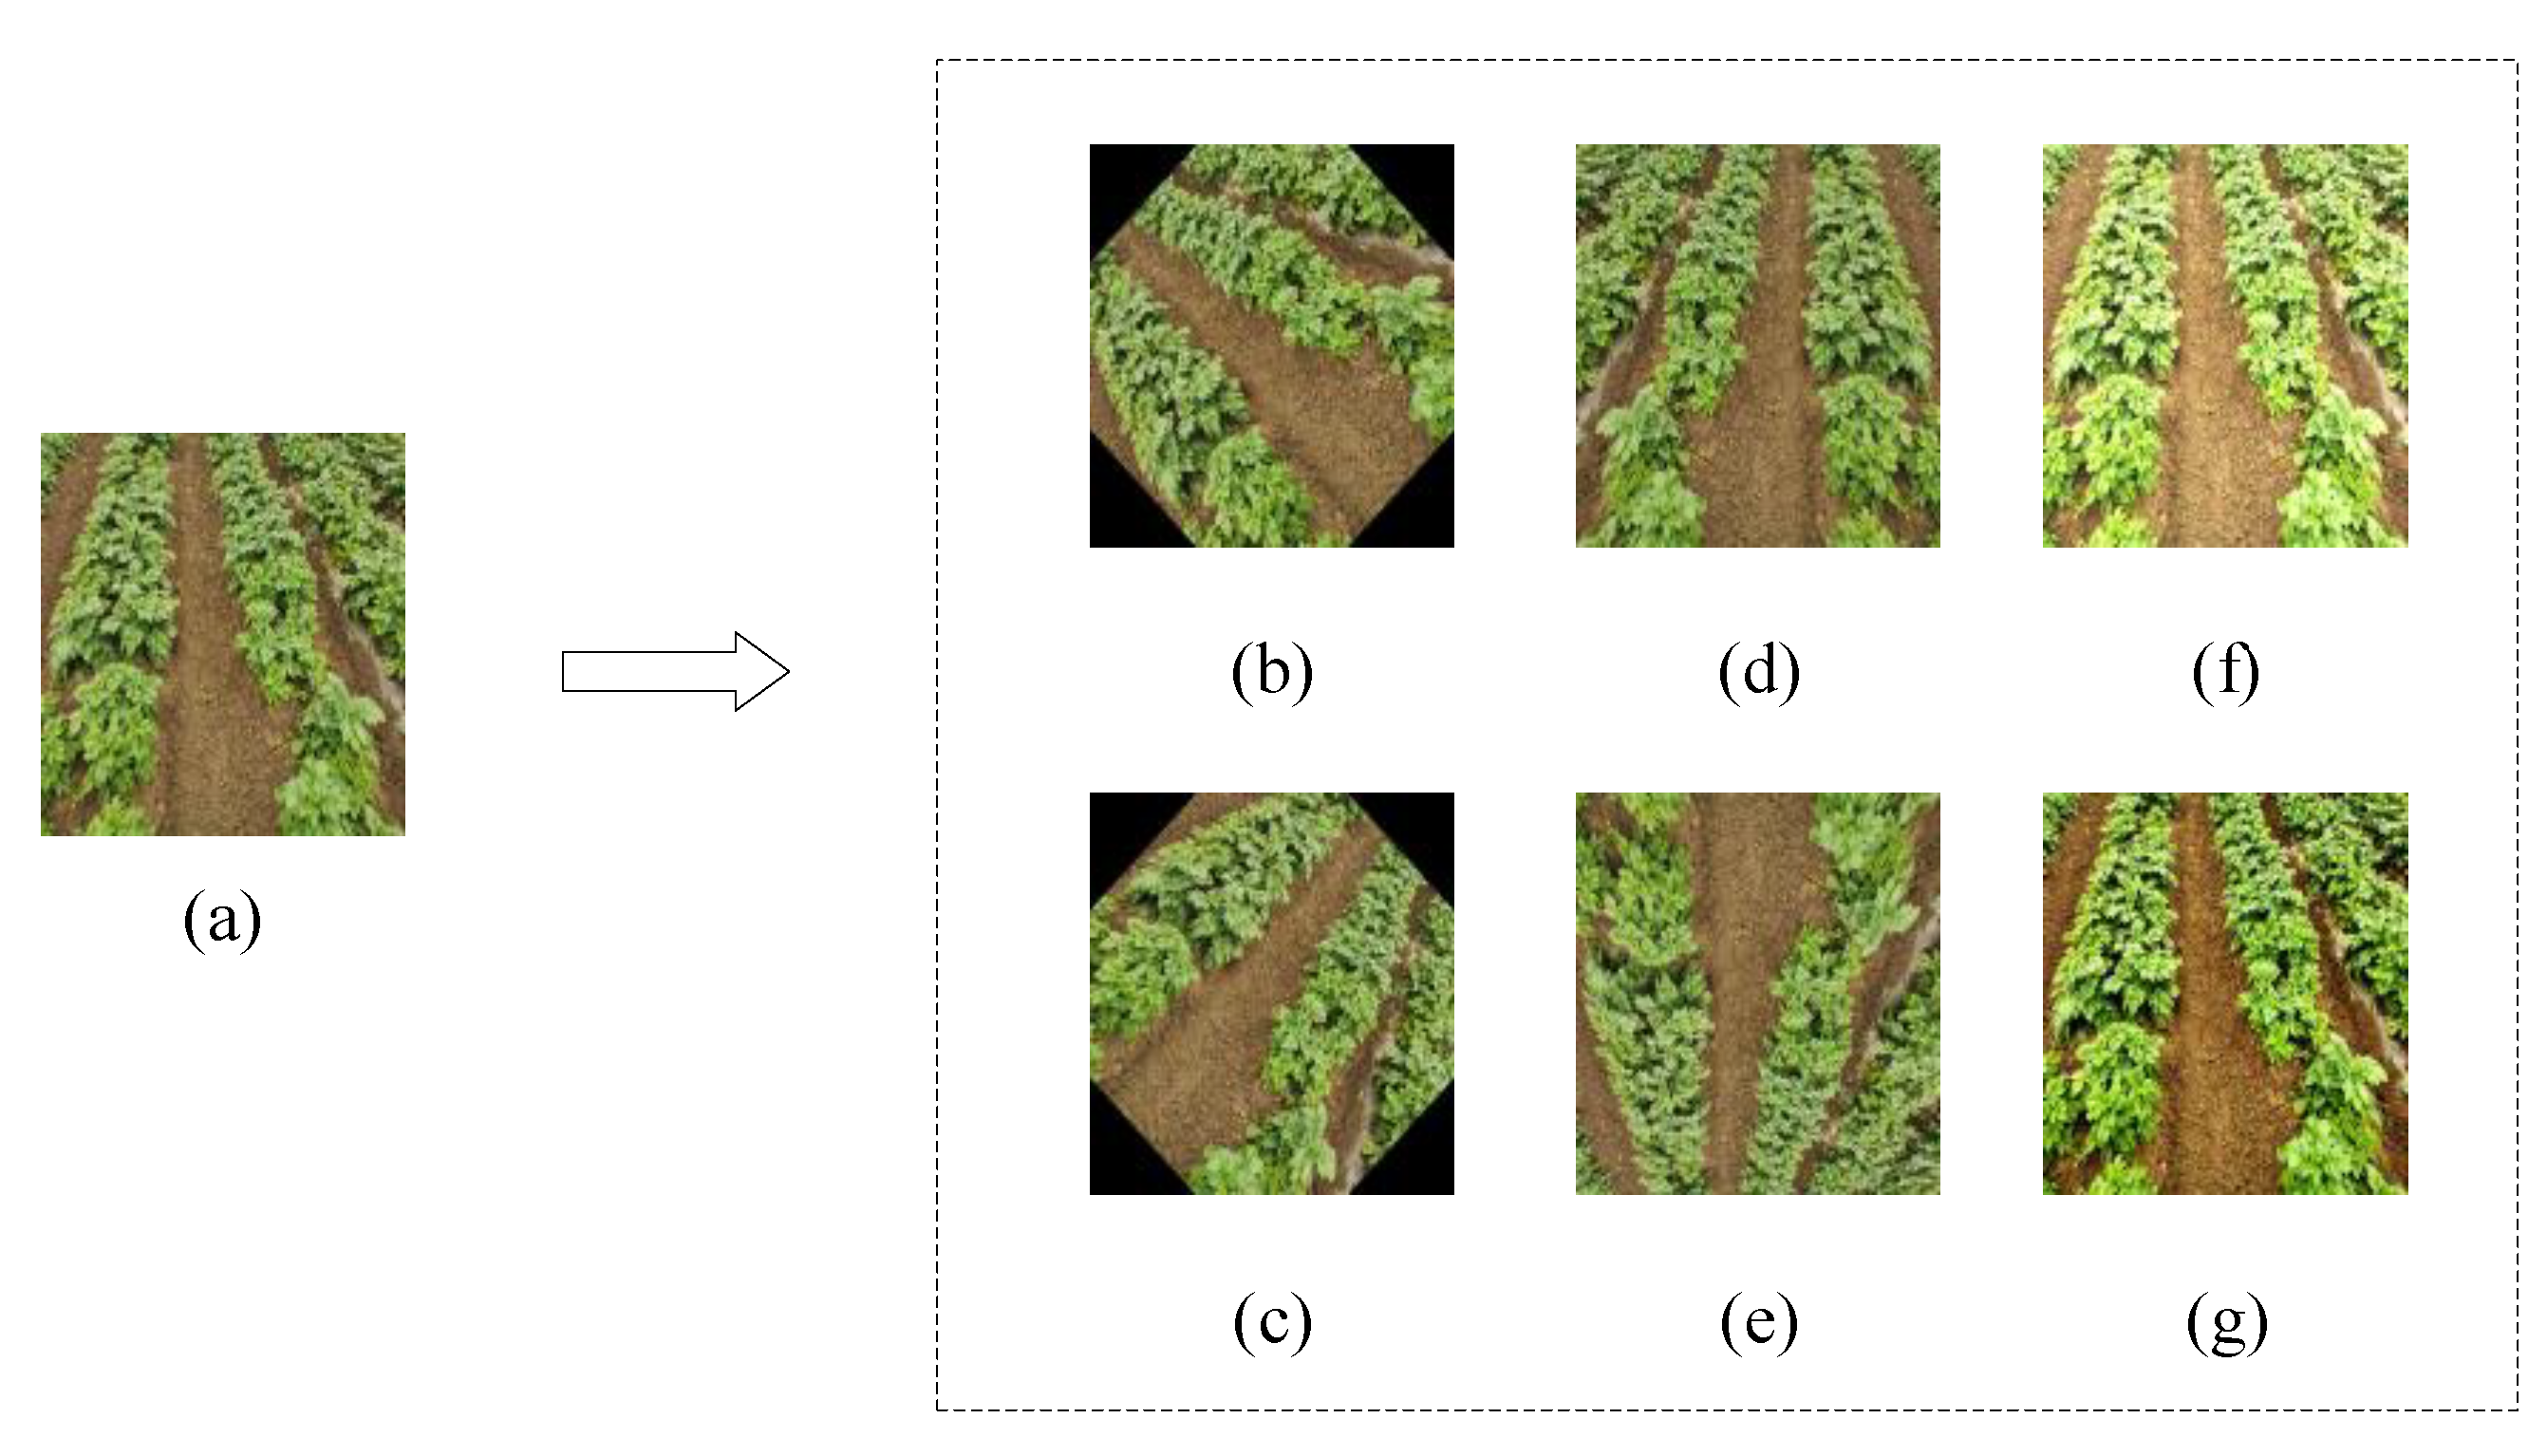
2.3. Model Training and Data Augmentation

The purpose of model training was to enable the U-Net semantic segmentation model to learn certain information about potato crop rows in a large sample dataset. The quality of its training results directly determines the effect of crop row segmentation. The model training platform was built using the Pytorch framework in the Anaconda environment of the Windows10 operating system, and the programming software was Visual Studio Code. For training, AMD Ryzen 7 4800H with Radeon Graphics 2.90 GHz, Nvidia Geforce RTX2060 GPU, and 6 GB RAM were used. During training, the training set and the validation set were divided into an 8:2 ratio. Before the image was input into the network, the image resolution was uniformly converted to 512 × 512 pixels to reduce memory usage during the training process.
When the neural network was trained, we used a method known as fine-tuning for training to take full advantage of the network’s generalization capacity. To ensure that the weights in the network model were not too random during the feature extraction process, the weights obtained by VGG16 from the ImageNet dataset were used to load the network model. Fractionalized and thawed versions of the backbone feature extraction network were both covered in the training. The Adam adaptive optimizer was used to train the models. Initially, the learning rate was set to 1 × 10⁻⁴, and the batch size was set to 4, but the learning rate was then reduced to 1 × 10⁻⁵ to ensure the model’s continuity after thawing. All the other parameters were left unchanged, and the iteration process was repeated 50 times.
Data augmentation was used to increase the dataset’s robustness and reduce overfitting because not all working conditions and time periods were included in the image acquisition, as shown in Figure 6. Rotating the images 45 degrees clockwise and counterclockwise, mirroring the images, and changing the brightness and contrast of the images were used during the model training process to promote flexibility, which is required when dealing with a wide range of lighting conditions.

2.4. Crop Row Detection Based on Feature Midpoint Adaptation

2.4.1. ROI Determination

After the image has been semantically segmented, two semantic data types are obtained: background and crop rows. The obtained field of view was wider due to the camera’s high installation position, and the number of crop rows increased, but only two rows possessed the navigation value in actual operation. As a result, their ROI had to be set to minimize the interference of irrelevant rows. Crop rows parallel to each other form a convergence phenomenon in the image, similar to an isosceles trapezoid, due to the effect of perspective projection. As a result, as shown in Figure 7, a trapezoidal ROI is created. Because the datasets in this paper were not all captured by onboard cameras, certain images had to have their ROI set based on experience and requirements.

2.4.2. Crop Row Feature Point Extraction

After semantic segmentation and ROI setting, a binary map mask with only two lines in the field of view is obtained. Crop row feature point extraction is needed to determine the crop row’s position by identifying the white connected domain as a set of feature points with precise coordinates. In this paper, a scanning method was used to determine the location of white-connected regions. The more times you scan, the more reference points you collect, and the more precise your navigation line fitting is. The computational load will be increased if there are too many reference points. As a result, in this study, we employed the interlaced scanning method to extract edge feature points.
The scanning interval k must be determined first, and horizontal scanning processing must then be performed to traverse the pixel values of all coordinate points in each horizontal line. This means that when the pixel point changes from black to white (background to potato crop row), the coordinate value ln (x1n, y1n) in the current pixel coordinate system is output as the left border of the crop row; when it changes from white to a sudden change in color, it is output as the right border of the crop row. When the potato crop row is black, the current pixel coordinate system’s coordinate value is also displayed as the right boundary rn (xrn, yrn) of the crop row. To improve the detection accuracy of edge feature points, continuous α variables are defined to traverse the pixel points of the determined row if and only if the continuous α/2 pixel values are the same and the (α + 2)/2th pixel value is abrupt and continuous. If the α/2 pixel values are the same, it is determined that the edge of the potato crop row is detected, and the pixel coordinates of the current mutation point are output.
After obtaining the crop row’s edge coordinates, the crop’s morphological center coordinates are calculated to obtain the center coordinates bn (xbn, ybn). Finally, using the morphological center coordinates of the two crop rows, the coordinate cm (xcm, ycm) of the lane with the guiding function’s center point is calculated, where m = n/2. The following are the specific calculation formulae:
b n ( x n , y n ) = [ ( x l n , y l n ) + ( x r n , y r n ) ] 2
x n = ( x l n + x r n ) 2
y n = ( y l n + y r n ) 2
c n = ( b n + b n + 1 ) 2

2.4.3. K-Means Clustering

The segmentation effect is sometimes visible in the connected area of the white crop row, where a small black, connected area has been segmented into the background. The navigation line’s fitting effect is affected by the presence of this area insofar as it increases the number of detected left and right edge points. Therefore, unnecessary features must be eliminated.
In this paper, we assume that there is only one feature midpoint in each crop row, which means that only two green feature midpoints can be obtained in each horizontal scan when the green feature midpoint is greater than 2. The K-means clustering process is applied to the feature midpoints obtained from the horizontal row. When clustering, the number of centroids is set to 2 as needed, then the Euclidean distance from the midpoint of each green feature to the cluster center is calculated, and the “cluster center” is updated according to the newly divided cluster until the “cluster center” no longer moves.
d ( x , y ) = i = 1 n ( x i y i ) 2
where d (x, y) is the Euclidean distance, and xi, yi are the horizontal and vertical coordinates of the pixel. The obtained centroid coordinates are put back into the original green feature midpoint set, and finally, the removed morphological center coordinates are obtained. Figure 8 shows the clustering process.

2.4.4. Least Squares Fitting

Hough transform and least squares methods are two of the most commonly used methods for fitting navigation lines. The Hough transform algorithm has excellent precision, and it is also capable of detecting crop rows in weedy fields, but the algorithm is complicated, and the amount of computation is massive.
In this study, the least squares method was preferred to fit the navigation line. Generally, the straight line model of the least squares method is in the form of y = kx + b; however, since the generated set of coordinate points approximately exists near a vertical straight line, the slope of the straight line may not exist; thus, in this paper, the straight line model is set in the x = by + a form. According to its definition:
E = i = 1 n [ x i f ( y i ) ] 2
where E represents the sum of the squares of the difference between the actual value of all coordinate points and the estimated value of the fitted line, and the function f(y) that minimizes the value of the objective function is the equation function of the regression line. It can be seen from the above formula that the function E is a function of a and b and has a second-order continuous partial derivative. According to the existence theorem of extreme value, the function has a minimum value, and the partial derivatives of b and a are calculated respectively and set equal to zero to obtain:
{ i = 1 n ( x i b y i a ) = 0 i = 1 n y i ( x i b y i a ) = 0
which, when solved, gives
{ b ^ = i = 1 n x i y i n x ¯ y ¯ i = 1 n y i 2 n y ¯ 2 a ^ = x ¯ b ^ y ¯
The specific algorithm in this paper is as described in Algorithm 1:
Algorithm 1. Adaptive Midpoint Fitting Algorithm
(1) Define ln, rn, bn, cn/2 as four sets to store the left and right borders of the crop row, the center point of the crop row, and the coordinates of the navigation reference point, respectively.
(2) Input the image after semantic segmentation; set interlacing interval k and threshold α.
(3) Convert the image to a single-channel binary image and set the ROI.
(4) Interlaced traversal scan.
(5) Scan all pixel coordinates of one row.
(6) If α/2 consecutive pixels have a value of 255, the remaining α/2 consecutive pixels have a value of 0.
(7) Output the α/2th pixel coordinate and store it in ln.
(8) If α/2 consecutive pixels have a value of 0, the remaining α/2 consecutive pixels have a value of 255.
(9) Output the α/2th pixel coordinate and store it in rn.
(10) Traverse ln, rn, and calculate the midpoint coordinates of the green feature of the crop and store it in bn.
(11) When the number of green feature points in a horizontal row is greater than 2, perform k-means clustering to obtain the centroid coordinates.
(12) Remove the original feature points from the set, and put the obtained centroid coordinates into the original feature point set.
(13) Calculate the center position of two adjacent coordinate points in bn and store it in cn/2.
(14) Use least squares fitting to obtain the navigation line.

3. Results and Discussion

3.1. Semantic Segmentation Experiment

Based on the potato crop row dataset established in this paper, we trained the VU-Net model for 100 iterations and compared the segmentation results of the original U-Net, SegNet, PSPNet, and Deeplab V3 models. To calculate the predicted crop row and the actual crop, the coincidence degree of the rows was evaluated using the pixel average accuracy (MPA) and the average intersection and union ratio (MIOU). The calculation formulae are shown in formulae (9) and (10).
M P A = 1 k + 1 i = 0 k p i i i = 0 k p i j
M I O U = 1 k + 1 i = 0 k p i i j = 0 k p i j + j = 0 k p j i p i i
where pii is the number of correctly predicted pixels; pij is the number of pixels that belong to class i but are predicted to be class j; pji is the number of pixels that belong to class j but are predicted to be class I; k is the number of categories.
Table 2 displays the MPA, MIOU, and loading speed of each model for various neural network models. The accuracy of VU-Net improved by three percentage points over the original U-Net model, but the number of frames processed per second decreased by approximately six frames as a result of the deeper network layers; However, it was still superior to SegNet and Deeplab V3.
Figure 9 depicts the training process’s loss function and accuracy curve. The loss function of the training set continued to decrease as the number of iterations increased, as shown in Figure 9a. The loss function of the reduced learning rate continued to decline when the number of iterations reached 50, as shown by the loss function curve of the model using the validation set. The loss function remained essentially unchanged when the number of iterations reached approximately 80. The validation set and the training set accuracy rose steadily before settling.
To test the effect of the training model on the segmentation of potato rows in different growth periods and light intensities, we conducted segmentation experiments under various growth periods and in various light intensities. For each period of growth, the images were divided into three sets, with each set containing a total of 100 images, 50 of which were high-light intensity photos and 50 of which were weak light-intensity photos. Figure 10 shows the segmentation results for potatoes at various periods of growth and in different lighting conditions. The segmentation accuracy results are shown in Table 3 under various conditions. As shown in Table 3, the accuracy rate and MIOU value decreased by 1–2 percentage points under the same growth period conditions when the light intensity was increased. These results in Figure 10c,g show that, under strong light conditions, tree shadows near the road occluded the crop rows in the distance, resulting in incorrect identification of the distant crop rows, which reduced the segmentation accuracy and MIOU value. In the workplace, the distant crop rows are considered non-ROI areas, which have little impact on visual navigation. As a result, the segmentation results are within the allowable range of errors and meet the operational requirements of visual navigation. Segmentation results show that crops in the tillering period fall somewhere between the seedling and tuber periods. Figure 10e shows rows with small holes in them due to plant spacing errors or missed seeding. This type of cavitation is clearly visible during the tillering period of the potato, but not during the seedling or tuber periods. Since the existence of small holes affects the extraction of navigation lines, in the actual labeling, the holes with too small an area in the row are not processed. Therefore, a segmentation error occurs, but this does not much influence the overall crop row segmentation effect.
A comparative experiment was conducted to test the weed processing abilities of the method in this paper and the traditional image processing method. Figure 11b,e show that, even though the traditional image processing method can separate the potato plants from the background, there are still parts of the weeds in the lane that are not filtered out. In addition, the presence of other green crops in the area influences the segmentation results. Second, the green crop rows have numerous black areas of varying sizes due to illumination and mutual occlusion between potato plants. The crop rows have some noise if these black areas are processed traditionally. If morphological processing methods such as dilation and erosion are used in the later stages, finding the convolution kernel size suitable for all growth periods and the number of iterations will become a new problem to consider.
To prevent errors in the experimental results caused by the small dataset in this study, we compared our method with orchard road segmentation in the literature [42]. In ref. [42] the authors use the U-Net model to segment orchard roads. The specific comparison is shown in Table 4. We can see that under the same number of datasets, the U-Net network achieves better results for both potato crop rows and orchard roads. The segmentation effect, using VGG16 as the backbone feature extraction network, increases the segmentation accuracy by several percentage points. From the above results, we can see that, even if the dataset is not very large, it can still achieve satisfactory results. This coincides with the view that U-Net was originally proposed for use on smaller medical datasets [41].

3.2. Feature Midpoint Adaptation Fitting

To accurately classify the potato crop row and the background, semantic segmentation was used to remove distracting elements in the driveway, such as weeds. After obtaining a binary image mask, the crop row’s morphological center point was extracted, and the crop row’s lane center line was obtained by fitting.
The test sets of the above three different periods were chosen for fitting accuracy testing to evaluate the applicability of this method in different potato growth periods and under different illuminations. To verify the algorithm, we used the angle between the manually calibrated center line and the fitted line proposed in [43] as the evaluation standard to judge the accuracy of the fitted line. The fitting effect was considered poor when the angle’s root mean square error (RMSE) was greater than 5°. Figure 12 depicts the navigation line fitting effect (a–f) of the method in this paper under various working conditions and the navigation line effect (g–i) of the method using the traditional image processing method proposed by Otsu [44]. The traditional image processing method was affected by the illumination, as shown in (g–i), resulting in a large number of segmentation holes in the crop row, and the extracted feature points were incorrectly segmented as the background. The navigation line’s fitting accuracy is reduced if it is too random. The method used in this paper, on the other hand, better represented potato crop row connectivity, resulting in morphological midpoints extracted from features that were closer to the crop morphological midpoints in the real world. The accuracy of the navigation lines also improved.
Table 5 shows the average root mean square error and the time required for fitting using the Hough transform and the least squares methods. It can be seen from Table 4 that the Hough transform and the least squares method produced good results in the three growth stages of potatoes, especially in the growing stage, exhibiting a higher fitting accuracy and shorter execution time. Tins were due to the growth of potatoes in the growing period being relatively regular and the inter-row lanes being more obvious. The extracted navigation reference points met the ideal conditions, and the intermediate clustering and other processes were reduced. However, when the potatoes were in the tuber stage, the fitting effect was lower. This was due to the growth of the crop, causing the leaves to gather and block the driveway. In terms of fitting time, the Hough transform method took relatively long. In contrast, the least squares method was more suitable for agricultural machinery navigation operations.

4. Conclusions

Image-based guidance methods to control the navigation operation of agricultural machinery can be used to greatly improve the automation level of agricultural robots. Moreover, they can operate stably in areas without satellite signals. There are two main methods for image-based guidance: (1) methods based on traditional image processing; (2) methods based on CNN offline training. In practical applications, although the guidance method based on traditional threshold segmentation has obvious advantages in terms of time, it is not particularly applicable in different growth periods. In this paper, a method for the segmentation of potato crop rows based on semantic segmentation is proposed. By creating data labeling files under actual working conditions in navigation operations, the sample data are learned to achieve pixel-level segmentation of potato crop rows and backgrounds under different working conditions. In addition, the feature midpoint adaptive algorithm proposed in this paper was used to extract the navigation reference point. Finally, the navigation line was fitted by the least square method. The experimental results show that the method proposed in this paper has strong robustness and can better adapt to the field operation environment, which contains many non-structural factors. This, therefore, provided a reference for the self-adaptive adjustment of agricultural machinery in the field. Furthermore, using VGG16 as the feature extractor of the U-Net network not only improved the model’s convergence speed but also reduced the training time. Our method outperforms the original U-Net, SegNet, PSPNet, and Deeplab V3 methods in terms of segmentation. The proposed method can meet the actual operational requirements of agricultural machinery because the average running speed of agricultural machinery is 1.5 km/h.
However, the size of the dataset collected in this study and the working conditions were limited; thus, they could not completely represent each potato growth period. Therefore, increasing the dataset size should be considered in future research to improve the applicability of the model. Moreover, this paper only segmented the potato crop rows and did not consider the influence of other factors, such as obstacles. In the future, a variety of sensors should be integrated to improve the intelligent mechanical perception and decision-making capabilities of machinery. In addition, although this paper has achieved ideal results in detecting potato navigation lines, the method used is relatively primitive. In future work, it is necessary to study and improve upon our methods by exploring new semantic segmentation models and SVM to overall improve the innovation of the system.

Author Contributions

Conceptualization, Y.Z. and J.Z. (Jian Zhang, [email protected]); methodology, Y.Z.; software, Y.Z.; validation, Y.Z., J.Z. (Jian Zhang, [email protected]) and H.Z.; formal analysis, Y.Z.; investigation, G.T. and J.Z. (Jian Zhang, [email protected]); resources, R.Y.; data curation, Y.Z.; writing—original draft preparation, Y.Z.; writing—review and editing, Y.Z., J.Z. (Jian Zhang, [email protected]), P.H., and L.L.; visualization, Y.Z.; supervision, R.Y.; project administration, R.Y.; funding acquisition, R.Y. and P.H. All authors have read and agreed to the published version of the manuscript.

Funding

This research was funded by Research and application of key technologies of intelligent harvesting equipment, China, Grant No. LJNY 201804, the Special Project for the Construction of Modern Agricultural Industry Technology System (CARS-09-P32) Shandong Province Agricultural Major Application Technology Innovation Project (research and development of key technologies and equipment for mechanized production of sweet potato and carrot, SD2019NJ009) and Basic and Applied Basic Research Project of Guangzhou Basic Research Program in 2022 (Project No.: 202201011691).

Institutional Review Board Statement

Not applicable.

Informed Consent Statement

Not applicable.

Data Availability Statement

All data are presented in this article in the form of figures and tables.

Conflicts of Interest

The authors declare no conflict of interest.

References

  1. Department of Economic and Social Affairs of the United Nations. World Population Prospects: The 2012 Revision; Population Division of the Department of Economic and Social Affairs of the United Nations Secretariat: New York, NY, USA, 2013; p. 18. [Google Scholar]
  2. Lu, J. The Mechanism and Parameter Optimization of the Key Device of Pneumatic Precision Seeding of Potatoes. Ph.D. Thesis, Heilongjiang Bayi Agricultural Reclamation University, Daqing, China, 2020. [Google Scholar]
  3. Zhai, Z.; Zhu, Z.; Du, Y.; Song, Z.; Mao, E. Multi-crop-row detection algorithm based on binocular vision. Biosyst. Eng. 2016, 150, 89–103. [Google Scholar] [CrossRef]
  4. Chen, W. Research on Stubble Avoidance Technology of No-Till Planter Based on Machine Vision. Ph.D. Thesis, China Agricultural University, Beijing, China, 2018. [Google Scholar]
  5. Josiah, R.; Julie, C.; Duke, M. Machine vision for orchard navigation. Comput. Ind. 2018, 98, 165–171. [Google Scholar] [CrossRef]
  6. Ruotsalainen, L.; Morrison, A.; Mäkelä, M.; Rantanen, J.; Sokolova, N. Improving Computer Vision-Based Perception for Collaborative Indoor Navigation. IEEE Sens. J. 2022, 22, 4816–4826. [Google Scholar] [CrossRef]
  7. Adamkiewicz, M.; Chen, T.; Caccavale, A.; Gardner, R.; Culbertson, P.; Bohg, J.; Schwager, M. Vision-Only Robot Navigation in a Neural Radiance World. IEEE Robot. Autom. Lett. 2022, 7, 4606–4613. [Google Scholar] [CrossRef]
  8. Huang, P.; Zheng, Q.; Liang, C. Overview of Image Segmentation Methods. J. Wuhan Univ. (Sci. Ed.) 2020, 66, 519–531. [Google Scholar]
  9. Zhou, Y.; Yang, Y.; Zhang, B.L.; Wen, X.; Yue, X.; Chen, L. Autonomous detection of crop rows based on adaptive multi-ROI in maize fields. Int. J. Agric. Biol. Eng. 2021, 14, 1934–6344. [Google Scholar] [CrossRef]
  10. Søgaard, H.T.; Olsen, H.J. Determination of crop rows by image analysis without segmentation. Comput. Electron. Agric. 2003, 38, 141–158. [Google Scholar] [CrossRef]
  11. Li, M.; Zhang, M.; Meng, Q. Rapid detection method of agricultural machinery visual navigation baseline based on scanning filtering. Trans. Chin. Soc. Agric. Eng. 2013, 29, 41–47. [Google Scholar] [CrossRef]
  12. Yu, Y.; Bao, Y.; Wang, J.; Chu, H.; Zhao, N.; He, Y.; Liu, Y. Crop Row Segmentation and Detection in Paddy Fields Based on Treble-Classification Otsu and Double-Dimensional Clustering Method. Remote Sens. 2021, 13, 901. [Google Scholar] [CrossRef]
  13. Montalvo, M.; Pajares, G.; Guerrero, J.M.; Romeo, J.; Guijarro, M.; Ribeiro, A.; Ruz, J.J.; Cruz, J.M. Automatic detection of crop rows in maize fields with high weeds pressure. Expert Syst. Appl. 2012, 39, 11889–11897. [Google Scholar] [CrossRef]
  14. Gai, J.; Xiang, L.; Tang, L. Using a depth camera for crop row detection and mapping for under-canopy navigation of agricultural robotic vehicle. Comput. Electron. Agric. 2021, 188, 106301. [Google Scholar] [CrossRef]
  15. Konstantinos, C.; Ioannis, K.; Antonios, G. Thorough robot navigation based on SVM local planning. Robot. Auton. Syst. 2015, 70, 166–180. [Google Scholar] [CrossRef]
  16. Ulrich, B.; Marian, H.; Erik, M. An Autonomous Forklift with 3D Time-of-Flight Camera-Based Localization and Navigation. In Proceedings of the 2018 15th International Conference on Control, Automation, Robotics and Vision (ICARCV), Singapore, 18–21 November 2018; pp. 1739–1746. [Google Scholar] [CrossRef]
  17. Fue, K.; Porter, W.; Barnes, E.; Li, C.; Rains, G. Evaluation of a Stereo Vision System for Cotton Row Detection and Boll Location Estimation in Direct Sunlight. Agronomy 2020, 10, 1137. [Google Scholar] [CrossRef]
  18. Wang, J.; Liu, Y.; Niu, S.; Song, H. Bio-inspired routing for heterogeneous Unmanned Aircraft Systems (UAS) swarm networking. Comput. Electr. Eng. 2021, 95, 107401. [Google Scholar] [CrossRef]
  19. Yang, X.; Li, X. Research on Autonomous Driving Technology Based on Deep Reinforcement Learning. Netw. Secur. Technol. Appl. 2021, 1, 136–138. [Google Scholar]
  20. Yang, Y.; Mei, G. Pneumonia Recognition by Deep Learning: A Comparative Investigation. Appl. Sci. 2022, 12, 4334. [Google Scholar] [CrossRef]
  21. Hwang, J.H.; Seo, J.W.; Kim, J.H.; Park, S.; Kim, Y.J.; Kim, K.G. Comparison between Deep Learning and Conventional Machine Learning in Classifying Iliofemoral Deep Venous Thrombosis upon CT Venography. Diagnostics 2022, 12, 274. [Google Scholar] [CrossRef]
  22. Kastrati, Z.; Dalipi, F.; Imran, A.S.; Pireva Nuci, K.; Wani, M.A. Sentiment Analysis of Students’ Feedback with NLP and Deep Learning: A Systematic Mapping Study. Appl. Sci. 2021, 11, 3986. [Google Scholar] [CrossRef]
  23. Niu, S.; Liu, Y.; Wang, J.; Song, H. A Decade Survey of Transfer Learning (2010–2020). Trans. Artif. Intell. 2020, 1, 151–166. [Google Scholar] [CrossRef]
  24. Zhao, C.; Wen, C.; Lin, S.; Guo, W.; Long, J. A method for identifying and detecting tomato flowering period based on cascaded convolutional neural network. Trans. Chin. Soc. Agric. Eng. 2020, 36, 143–152. [Google Scholar]
  25. Xiang, R.; Zhang, M.; Zhang, J. Recognition for Stems of Tomato Plants at Night Based on a Hybrid Joint Neural Network. Agriculture 2022, 12, 743. [Google Scholar] [CrossRef]
  26. Jiang, H.; Zhang, C.; Zhang, Z.; Mao, W.; Wang, D.; Wang, D.-W. Maize field weed detection method based on Mask R-CNN. Trans. Chin. Soc. Agric. Mach. 2020, 6, 220–228,247. [Google Scholar]
  27. Fan, X.; Zhou, J.; Xu, Y.; Li, K.; Wen, D. Identification and location of weeds in cotton seedling based on optimized Faster R-CNN. Trans. Chin. Soc. Agric. Mach. 2021, 5, 26–34. [Google Scholar]
  28. Yang, S.; Feng, Q.; Zhang, J.; Sun, W.; Wang, G. Potato disease recognition method based on deep learning and compound dictionary. Trans. Chin. Soc. Agric. Mach. 2020, 7, 22–29. [Google Scholar]
  29. Xi, R.; Jiang, K.; Zhang, W.; Lu, Z.; Hou, J. Potato sprout eye recognition method based on improved Faster R-CNN. Trans. Chin. Soc. Agric. Mach. 2020, 51, 216–223. [Google Scholar]
  30. Bansal, P.; Kumar, R.; Kumar, S. Disease Detection in Apple Leaves Using Deep Convolutional Neural Network. Agriculture 2021, 11, 617. [Google Scholar] [CrossRef]
  31. Wang, L.; Yue, X.; Wang, H.; Ling, K.; Liu, Y.; Wang, J.; Hong, J.; Pen, W.; Song, H. Dynamic Inversion of Inland Aquaculture Water Quality Based on UAVs-WSN Spectral Analysis. Remote Sens. 2020, 12, 402. [Google Scholar] [CrossRef]
  32. Lin, Y.; Chen, S. Development of Navigation System for Tea Field Machine Using Semantic Segmentation. IFAC Pap. 2019, 52, 108–113. [Google Scholar] [CrossRef]
  33. Li, J.; Yin, J.; Deng, L. A robot vision navigation method using deep learning in edge computing environment. EURASIP J. Adv. Signal Processing 2021, 2021, 22. [Google Scholar] [CrossRef]
  34. Adhikari, S.P.; Kim, G.; Kim, H. Deep Neural Network-based System for Autonomous Navigation in Paddy Field. IEEE Access 2020, 8, 71272–71278. [Google Scholar] [CrossRef]
  35. Adhikari, S.; Yang, H.; Kim, H. Learning Semantic Graphics Using Convolutional Encoder–Decoder Network for Autonomous Weeding in Paddy. Front. Plant Sci. 2019, 10, 1404. [Google Scholar] [CrossRef] [PubMed]
  36. Ponnambalam, V.R.; Bakken, M.; Moore, R.J.D.; Glenn Omholt Gjevestad, J.; Johan From, P. Autonomous Crop Row Guidance Using Adaptive Multi-ROI in Strawberry Fields. Sensors 2020, 20, 5249. [Google Scholar] [CrossRef] [PubMed]
  37. Badrinarayanan, V.; Kendall, A.; Cipolla, R. SegNet: A Deep Convolutional Encoder-Decoder Architecture for Image Segmentation. IEEE Trans. Pattern Anal. Mach. Intell. 2017, 39, 2481–2495. [Google Scholar] [CrossRef] [PubMed]
  38. Bah, M.; Hafiane, A.; Canals, R. CRowNet: Deep Network for Crop Row Detection in UAV Images. IEEE Access 2020, 8, 5189–5200. [Google Scholar] [CrossRef]
  39. Zhang, Q.; Wang, J.; Li, B. Extraction method for centerlines of rice seedings based on YOLOv3 target detection. Trans. Chin. Soc. Agric. Mach. 2020, 51, 34–43. [Google Scholar]
  40. Gao, Z. Method for Kiwi Trunk Detection and Navigation Line Fitting Based on Deep Learning. Master’s Thesis, Northwest A & F University, Xianyang, China, 2020. [Google Scholar]
  41. Ronneberger, O.; Fischer, P.; Brox, T. U-Net: Convolutional Networks for Biomedical Image Segmentation. In International Conference on Medical Image Computing and Computer-Assisted Intervention, Proceedings of the 18th International Conference, Munich, Germany, 5–9 October 2015; Springer: Cham, Switzerland, 2015. [Google Scholar]
  42. Han, Z.; Li, J.; Yuan, Y. Path Recognition of Orchard Visual Navigation Based on U Net. Trans. Chin. Soc. Agric. Mach. 2021, 52, 30–39. [Google Scholar]
  43. Yang, Y.; Zhang, B.; Zha, J.; Wen, X.; Chen, L.; Zhang, T.; Dong, X.; Yang, X. Real-time extraction of navigation line between corn row. Trans. Chin. Soc. Agric. Eng. 2020, 36, 162–171. [Google Scholar]
  44. Otsu, N. A Threshold Selection Method from Gray-Level Histograms. IEEE Trans. Syst. Man Cybern. 1979, 9, 62–66. [Google Scholar] [CrossRef] [Green Version]
Figure 1. The flow of the visual navigation line detection method.
Agriculture 12 01363 g001
Figure 2. Data Collection: (a) acquisition platform; (b) simulated operation of remote-control sprayer; (c) acquired images.
Agriculture 12 01363 g002
Figure 3. LabelMe labeled potato crop rows.
Agriculture 12 01363 g003
Figure 4. VGG16 net model structure.
Agriculture 12 01363 g004
Figure 5. VU-Net structure model.
Agriculture 12 01363 g005
Figure 6. Data augmentation: (a) original image; (b) counterclockwise rotation 45°; (c) clockwise rotation 45°; (d) horizontal mirror; (e) vertical mirror; (f) brightness adjustment; (g) contrast adjustment.
Agriculture 12 01363 g006
Figure 7. ROI settings: (a) original image; (b) ROI; (c) binary image mask.
Agriculture 12 01363 g007
Figure 8. k-means clustering process; (a) before clustering; (b) after clustering.
Agriculture 12 01363 g008
Figure 9. Loss function curve of each model: (a) training loss function curve; (b) validation loss function curve; (c) training accuracy; (d) validation accuracy.
Agriculture 12 01363 g009
Figure 10. Potato segmentation results in different growth periods: (ad) are the RGB images (eh) are the corresponding segmentation results. The green anchor box is the part of the distant shadow interference that is not correctly segmented.
Agriculture 12 01363 g010
Figure 11. Comparison of traditional image processing and our method under weed interference (a,d) RGB images; (b,e) traditional methods; (c,f) our method.
Agriculture 12 01363 g011
Figure 12. Comparison of segmentation effects under different working conditions: (af) the methods described in this paper; (gi) the traditional methods.
Agriculture 12 01363 g012
Table 1. Number of images collected under different working conditions.
Working ConditionsNumber of Acquired Images
Seedling period8:00–9:00167
10:30–11:00156
17:00–18:30178
Tillering period8:30–9:30210
14:00–15:00292
Tuber period7:30–8:30158
16:00–17:00175
Table 2. Comparison of the prediction results of different models.
ModelMPA/%MIOU/%FPS f/s
VU-Net97.2993.9412.62
U-Net94.3590.0618.30
SegNet90.5286.5411.15
PSPNet92.3787.4515.59
Deeplab V393.7190.9410.79
Table 3. Comparison of segmentation accuracy under different working conditions.
Growth PeriodsLighting ConditionsMPA/%MIOU/%FPS f/s
Seedling periodweak light intensity97.7290.3612.78
strong light intensity96.4489.6312.77
Tillering periodweak light intensity95.4686.6412.83
strong light intensity93.2584.5612.83
Tuber periodweak light intensity97.3593.2112.52
strong light intensity95.2786.1212.50
Table 4. Performance of U-Net on different segmented objects.
IndexThis PaperLiterature [37]
Segment ObjectsPotato crop row with backgroundOrchard road and background
ModelU-NetU-Net
BackboneVGG16Unused
Dataset size12001200
Accuracy/%97.7294.51
Table 5. Navigation line fitting accuracy test in different growth periods.
Season of GrowthHough TransformLeast Squares
Average Angular DeviationExecution TimeAverage Angular DeviationExecution Time
Seedling period2.350.712 ± 0.052.030.625 ± 0.03
Tillering period1.870.701 ± 0.051.320.532 ± 0.03
Tuber period3.560.776 ± 0.053.130.654 ± 0.03
Publisher’s Note: MDPI stays neutral with regard to jurisdictional claims in published maps and institutional affiliations.

