Article

Prediction Model for Tea Polyphenol Content with Deep Features Extracted Using 1D and 2D Convolutional Neural Network

1
School of Information and Computer, Anhui Agricultural University, Hefei 230036, China
2
State Key Laboratory of Tea Plant Biology and Utilization, Anhui Agricultural University, Hefei 230036, China
*
Authors to whom correspondence should be addressed.
Agriculture 2022, 12(9), 1299; https://doi.org/10.3390/agriculture12091299
Submission received: 2 August 2022 / Revised: 22 August 2022 / Accepted: 22 August 2022 / Published: 25 August 2022

Abstract

:
The content of tea polyphenols (TP) is one of the important indicators for judging the quality of tea. Accurate and non-destructive estimation technology for tea polyphenol content has attracted more and more attention, which has become a key technology for tea production, quality identification, grading and so on. Hyperspectral imaging technology is a fusion of spectral analysis and image processing technology, which has been proven to be an efficient technology for predicting tea polyphenol content. To make full use of spectral and spatial features, a prediction model of tea polyphenols based on spectral-spatial deep features extracted using convolutional neural network (CNN) was proposed, which not only broke the limitations of traditional shallow features, but also innovated the technical path of integrated deep learning in non-destructive detection for tea. Firstly, one-dimensional convolutional neural network (1D-CNN) and two-dimensional convolutional neural network (2D-CNN) models were constructed to extract the spectral deep features and spatial deep features of tea hyperspectral images, respectively. Secondly, spectral deep features, spatial deep features, and spectral-spatial deep features are used as input variables of machine learning models, including Partial Least Squares Regression (PLSR), Support Vector Regression (SVR) and Random Forest (RF). Finally, the training, testing and evaluation were realized using the self-built hyperspectral dataset of green tea from different grades and different manufacturers. The results showed that the model based on spectral-spatial deep features had the best prediction performance among the three machine learning models (R2 = 0.949, MAE = 0.533 for training sets, R2 = 0.938, MAE = 0.799 for test sets). Moreover, the visualization of estimation results of tea polyphenol content further demonstrated that the model proposed in this study had strong estimation ability. Therefore, the deep features extracted using CNN can provide new ideas for estimation of the main components of tea, which will provide technical support for the estimation tea quality estimation.

1. Introduction

Green tea has functions such as promoting body fluids, quenching thirst, and providing health care. Tea polyphenols, including flavanols, ketones, phenolic acids, as a class of polyhydroxy compounds, are the main quality components in green tea [1]. The content of tea polyphenols in the dry matter of green tea accounts for about 18–36% [2], which not only affects the color, aroma and taste of green tea, but also affects its application in the medical field, food production field and chemical field [3]. In particular, tea polyphenols have been shown to have certain qualities of antioxidant capacity, antitumor activity, prevention of cardiovascular disease and enhancement of immunity [4]. High-quality green tea is not only a beverage product pursued by consumers, but also in the direction of the healthy development of tea. Therefore, it is of great significance to explore the method of green tea quality component detection for the tea production process, quality control and development and application expansion.
The traditional methods for obtaining the content of tea polyphenols, the common methods are based on chemical methods, such as high-performance liquid chromatography [5], capillary electrophoresis [6], which are not only time-consuming and labor-intensive sample preparation processes, including sample drying and grinding, etc., but are also affected by the proficiency of the operator in chemical analysis. In recent years, near-infrared spectroscopy has the advantages of macroscopic, fast, non-destructive, etc., which has not only been widely used in the detection of tea biochemical substances, including caffeine [7], catechins [8], moisture content [9], fat-soluble pigments [10], but has also been used to successfully differentiate origin, species and grade for green tea [11]. In particular, previous studies have shown that near-infrared spectroscopy has good potential for estimating the polyphenol content of green tea. For example, Hazarika et al. developed a near-infrared system to predict the total polyphenol content of fresh tea leaves [12]. Chen et al. used near-infrared (NIR) spectroscopy to accurately estimate the total polyphenol content in green tea [13]. Bian et al. successfully predicted the content of TP using reflectance spectral data at different scales, including tea powder, leaves and canopy [14].
Although the methods mentioned above improve the performance of estimation models, the application of spectral bands is still a hot issue. On the one hand, the band information obtained by different feature variable selection algorithms can reflect the absorption characteristics of the spectral reflectance of tea polyphenol content, such as competitive adaptive reweighted sampling (CARS), successive projections algorithm (SPA) and RF, and can also improve the estimation accuracy of the model [15]. However, other useful information for spectral detection may be lost. On the other hand, due to the high correlation between the bands, the use of full-band spectral data for estimation can easily lead to data redundancy, which not only increases the running time of the computer, but also has certain negative impact on predictive ability of the model. Therefore, it is difficult to accurately estimate the TP of green tea only relying on spectral information.
Actually, the three-dimensional data block of hyperspectral imaging (HIS) can well reflect the biochemical properties of the main components of tea [16]. Studies have shown that hyperspectral imaging technology has successfully detected the components of tea, such as catechin concentrations [17] free amino acids [18], thearubigin, catechin, caffeine, and soluble sugar [19]. These achievements are attributed to the rich spatial features of hyperspectral images, such as texture features, spatial correlation features, and morphological features. However, the low spatial resolution of hyperspectral images has higher requirements for the extraction capability based on spatial features, which has become a bottleneck that severely limits prediction based on spatial features [20].
To this end, numerous studies on feature extraction of hyperspectral images have been carried out. In particular, with the rapid development of deep learning technology in the past decade, in view of the advantages in feature extraction and nonlinear expression capabilities, deep learning models with perceptual network structures can automatically learn and extract deep features from images [21]. Shibi et al. used deep belief network (DBN) to extract spatial deep features of hyperspectral images [22]. Venugopal used DeepLab to extract multi-scale spatial deep features of hyperspectral images [23]. Liu et al. extracted spatial deep features of hyperspectral images at different scales [24]. In fact, deep neural networks are widely used to extract spatial deep features due to the excellent performance of CNN in feature transformation and parameter sharing [25]. In addition, some studies have attempted to use convolutional neural networks to obtain deep features of spectral information. Yu et al. constructed 1D-CNN to extract multiple deep features from the Vis/NIR spectrum of cantaloupe and successfully detected pesticide residues in cantaloupe [26]. Xu et al. applied stacked autoencoder (SAE) to extract deep spectral features to predict grape firmness and pH [27]. In conclusion, spectral deep features and spatial deep features extracted based on deep neural networks have gained more attention, which not only solves the bottleneck problem of spectral feature extraction, but also provides new ideas for tea polyphenol estimation.
In fact, it is easy to ignore the integrity of hyperspectral data by considering only one of these features, regardless of the spatial dimension feature or the spectral dimension feature. Although in 2005, Benediktsson et al. considered the superiority of spectral-spatial features over single feature [28]. At present, few studies involve the spectral-spatial deep features extracted using CNN. According to literature, the spectral-spatial deep features extracted based on 1D-CNN and 2D-CNN models has been shown to achieve good results in the detection of marine oil spills [29]. However, it is still unclear whether the estimation accuracy of TP can be improved based on spectral-spatial deep feature.
Therefore, this study focused on the feasibility of spectral-spatial deep features from hyperspectral images to estimate the polyphenol content of tea. The purpose of this study is to (1) construct 1D-CNN and 2D-CNN to extract the spectral deep features and spatial deep features of tea from hyperspectral images, (2) propose a model based on spectral-spatial deep features to improve tea polyphenols content estimation accuracy, and (3) compare, evaluate and visualize polyphenol content estimation results for different grades of green tea.

2. Materials and Methods

2.1. Data Collection

2.1.1. Sample Collection

The tea samples were green tea purchased from the local market, and the variety was Huangshan Maofeng, including two grades, namely, first grade 1 (L1) and premium grade (L2). The collected tea samples were kept in airtight jars and kept in a refrigerator at about 4 °C. Although the samples used in this study are Huangshan Maofeng, we still collect green tea from different producers in Huangshan, China. Among them, the teas of Level 1 include Guangming Tea (GM), Zixia Tea (ZX), Zhang Yiyuan Tea (ZYY), Huishang Tea (HS), Ziwei Tea (ZW), Fusong Tea (FS), Yahetang Tea (YHT). The tea of Level 2 includes Ziwei Tea (ZW), Guangming Tea (GM), Yahetang Tea (YHT), Zhang Yiyuan Tea (ZYY), Yijiangyuan Tea (YJY), Wuxishan Tea (WXS), Fusong Tea (FS), as shown in Table 1.

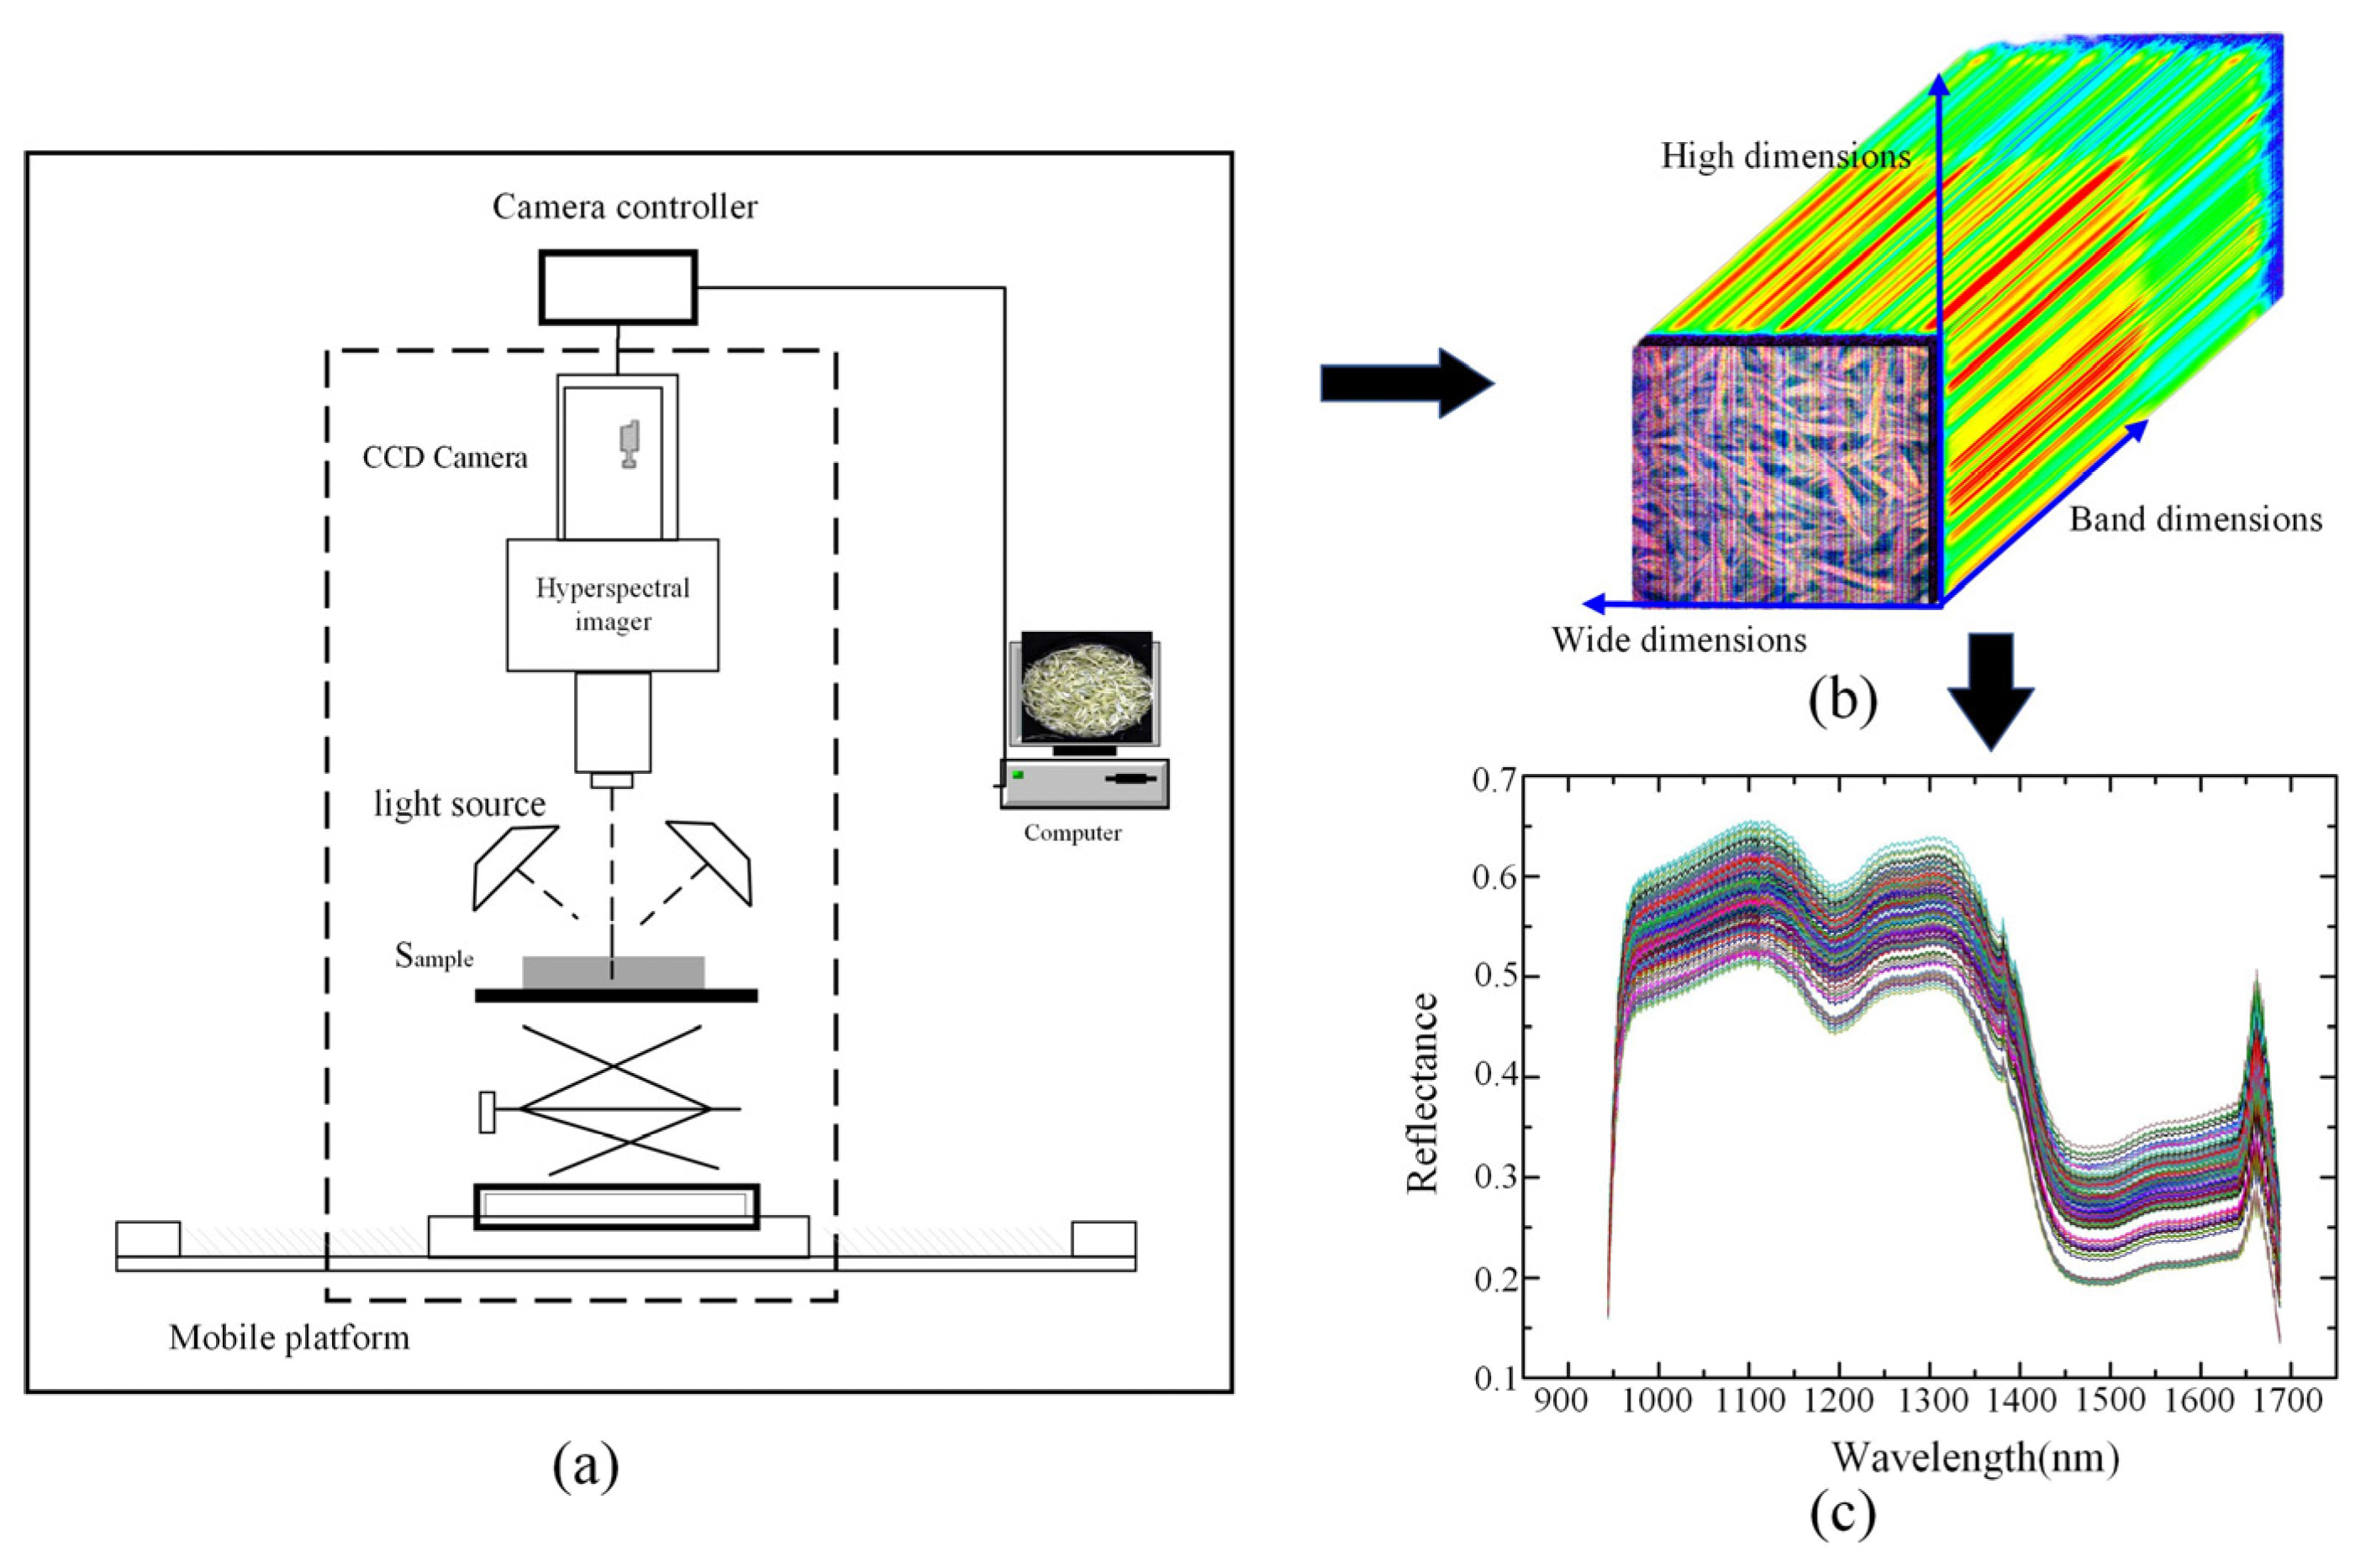
2.1.2. Hyperspectral Images Collection

The near-infrared hyperspectral imaging (NIR-HSI) system was used to acquire hyperspectral images of 140 green tea samples. The NIR-HSI system included an imaging spectrometer (Imspector V17E, Spectral Imaging Ltd., Oulu, Finland), which was used to acquire hyperspectral images, two 150W fiber optic halogen lamps (Model 3900, Illumination Technologies Inc., New York, NY, USA), aimed to provide light sources, as well as obscura and mobile platform.
140 samples of Huangshan Maofeng tea were selected, and (20 ± 0.5) g of tea samples were weighed and spread evenly in a black Petri dish with a size of 9 cm × 1 cm, and the samples were collected by a hyperspectral instrument. A total of 140 sets of hyperspectral images with a size of 636 × 814 × 508 were obtained. The 399 × 399 pixel was extracted as the region of interest (ROI), and the average spectral value of each band of the ROI was extracted.

2.1.3. Tea Polyphenol Content Collection

The content of tea polyphenols was obtained in accordance with the national standard method in China “Testing methods for the content of tea polyphenols and catechins in tea” (GB/T 8313-2018).

2.2. Method

2.2.1. Convolutional Neural Network

A convolutional neural network is a multi-layer nonlinear feedforward neural network, which was originally used for feature recognition and extraction of complex images, aiming to solve the problem that traditional image recognition technology can only extract shallow features of images [21]. CNN autonomously learns and extracts local and global features of data through multi-layer convolution and pooling operations [22]. According to the convolution kernel structure of CNN, it can be divided into one-dimensional CNN (1D-CNN), two-dimensional CNN (2D-CNN) and three-dimensional CNN (3D-CNN). 1D-CNN only performs convolution in the spectral dimension and outputs a one-dimensional vector, which has few network parameters and low computational complexity. Each 2D convolution kernel of 2D-CNN treats multiple bands of hyperspectral images as multiple channels, and performs convolution in two dimensions: spatial height and spatial width. 3D-CNN can extract deep spectral-spatial joint features end-to-end, while the 3D-CNN network has a large amount of parameters and high computational complexity [23,24].

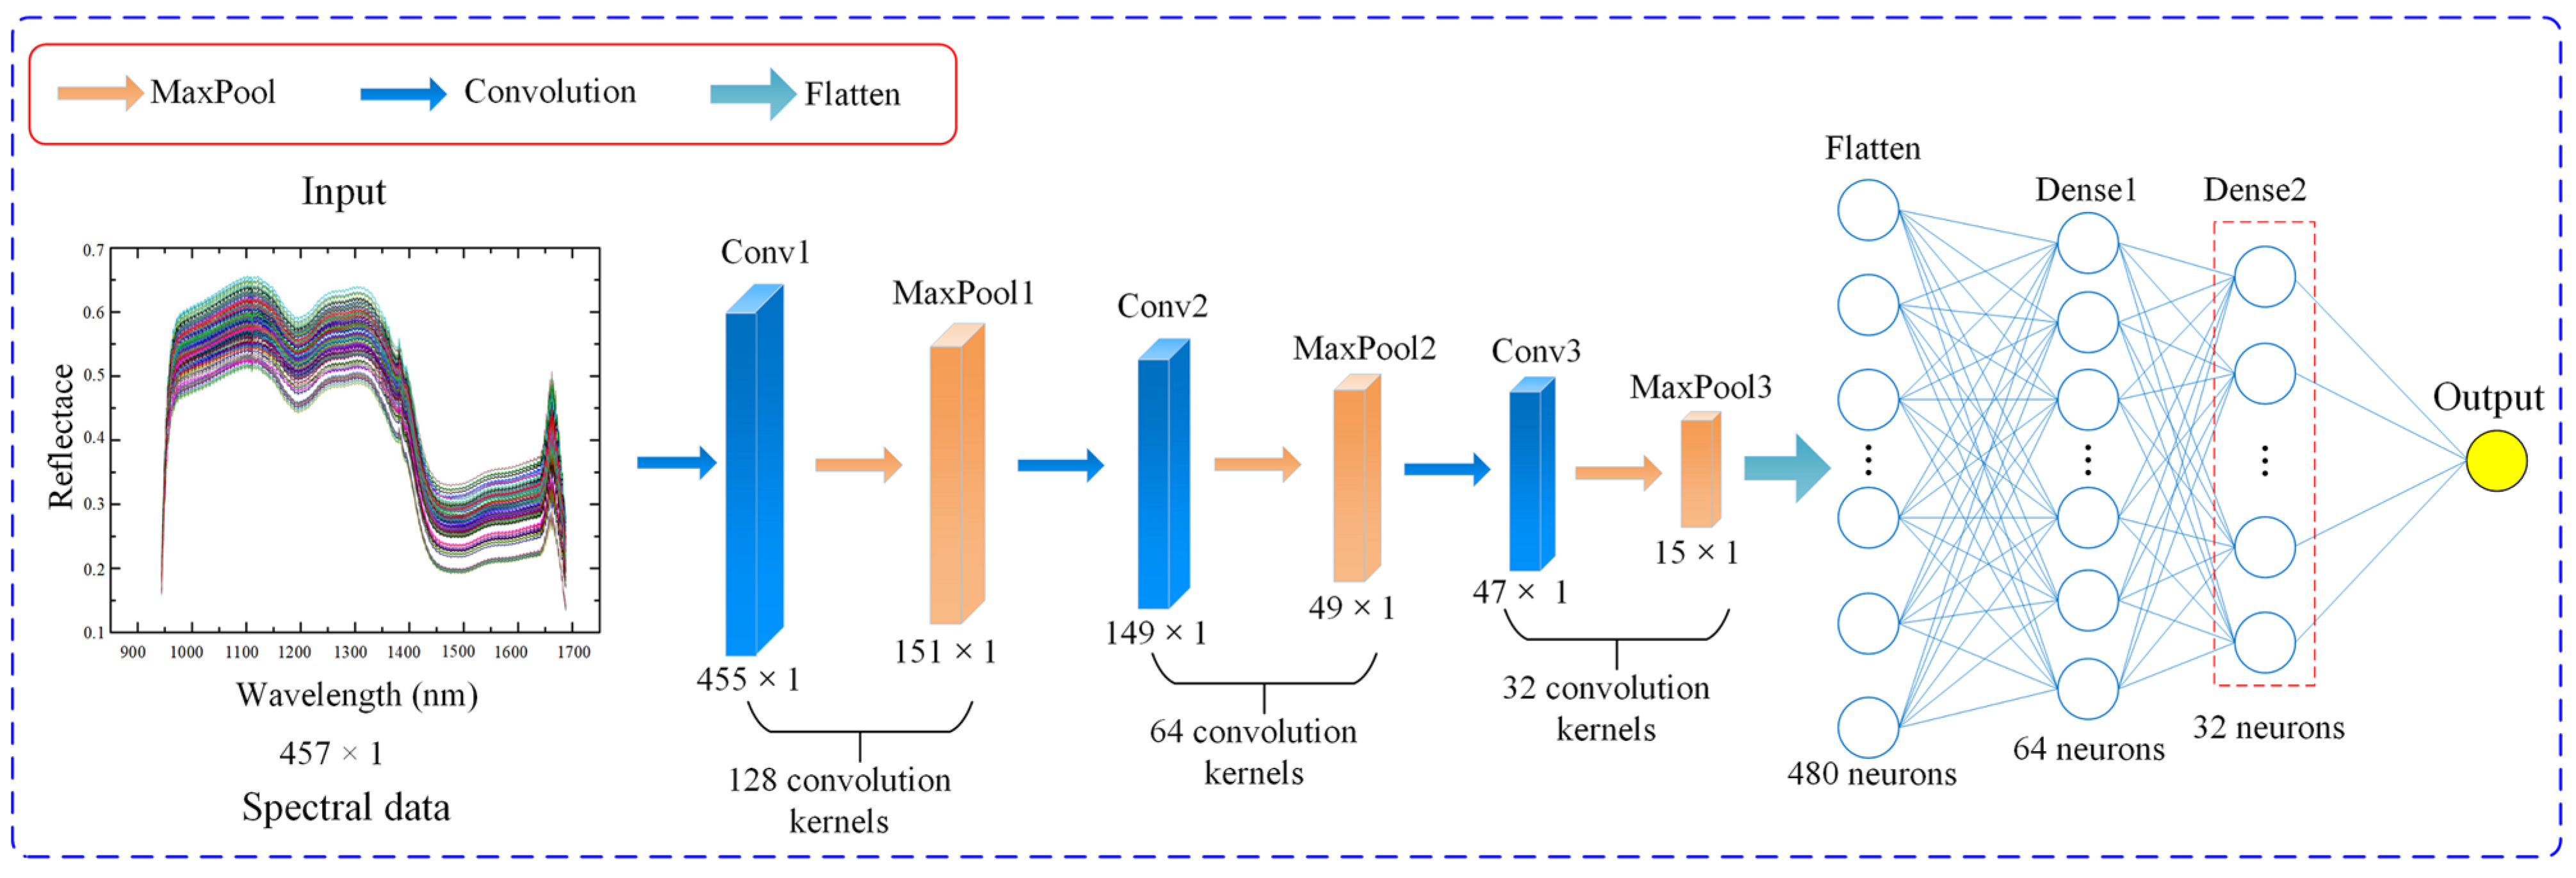
2.2.2. Spectral Deep Feature Extraction Using 1D-CNN

A CNN model usually consists of an input layer, several convolutional layers, pooling layers, fully connected layers and output layers. The convolutional layer is mainly used to extract local features in the input object, the pooling layer is used to greatly reduce the parameter magnitude (dimension reduction), and the fully connected layer is used to output the desired result. In addition, the fully connected layer can also be regarded as a one-dimensional vector, and the calculation is simple, so a fully connected layer is added before the output layer of the backbone network as an important structure for extracting convolution deep features.
1D-CNN uses a one-dimensional convolution kernel window sliding method to extract local spectral features for the input spectrum, and maps them to the features of the next layer through the activation function. The value z of the feature at coordinate d of the j -th feature of the i -th layer can be expressed as:
v i j z = δ ( k = 1 m , r = 0 R i 1 ω i j k r v ( i 1 ) k z + r + b i j )
In the formula, R i is the size of the one-dimensional convolution kernel of the i -th layer, v ( i 1 ) k z + r is the eigenvalue of the k -th feature of the i 1 -th layer at the z + r , ω i j k r is the convolution kernel that performs the convolution operation on the k -th feature of layer i 1 , m is the number of features of layer i 1 , b i j is the bias, δ is the activation function.
To extract the spectral deep features of tea, the 1D-CNN was designed, each convolutional layer used the ReLU activation function, the optimizer used was Adam, as shown in Figure 1.
As can be seen from Figure 1, 1D-CNN consists of three convolutional layers (Conv1, Conv2, Conv3), three pooling layers (MaxPool1, MaxPool2, MaxPool3), one flatten layer, two fully connected layers (Dense1, Dense2) and an output layer. One-dimensional spectral data (457 × 1) is input to 1D-CNN, and deep features are obtained through convolutional layers, pooling layers and fully connected layers. Among them, the convolution kernel size of the convolution layer and the pooling layer is 3 × 1. The core operation of the fully connected layer is the matrix-vector product, which is equivalent to a linear transformation of one feature space to another feature space, and maps the feature map produced by the convolutional layer to a fixed-length feature vector. Therefore, the output of the second fully-connected layer (Dense2) serves as the spectral deep feature. The parameters of 1D-CNN are shown in Table 2.

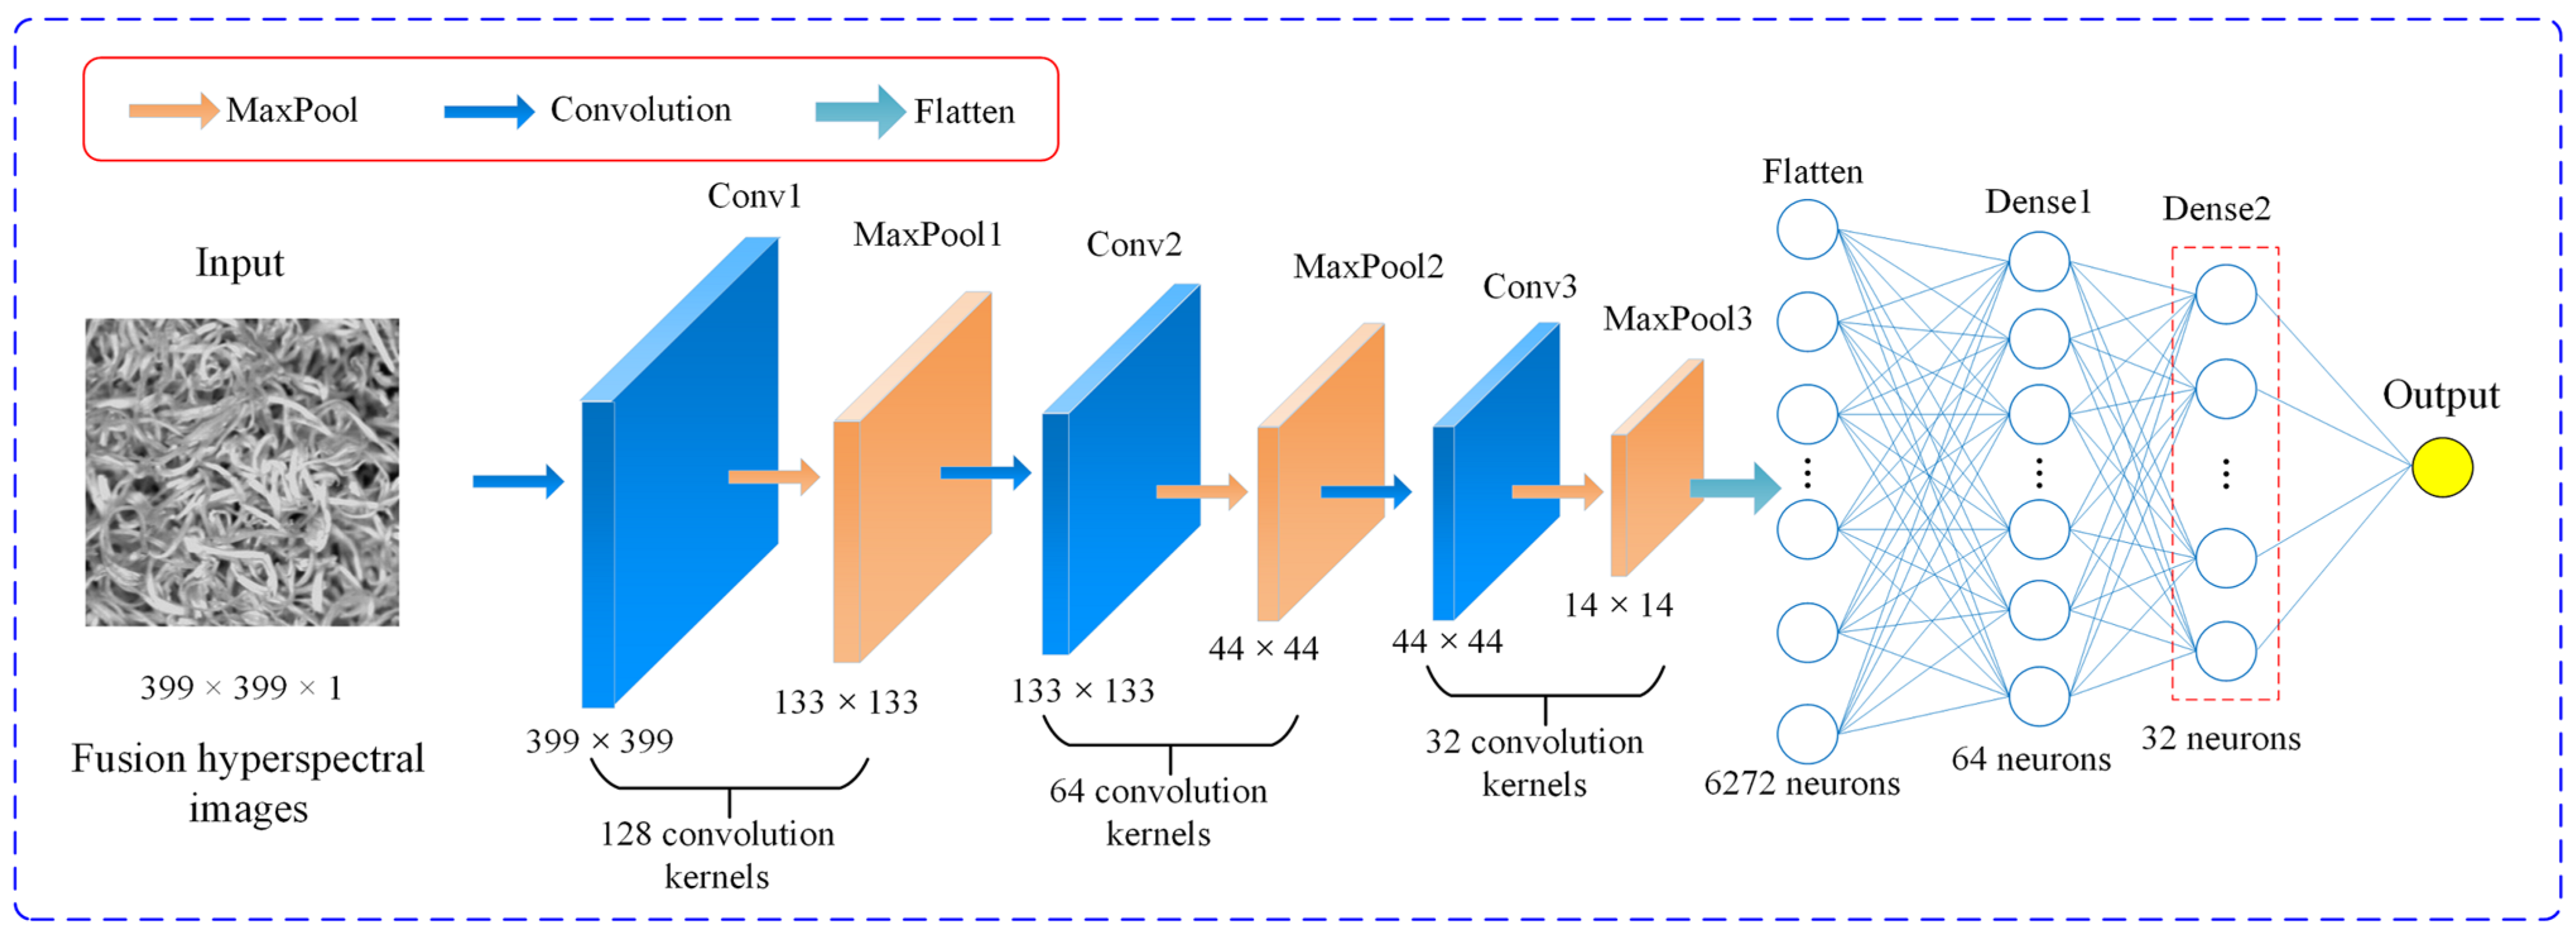
2.2.3. Spatial Deep Feature Extraction Based on 2D-CNN

The convolution kernels of the pooling layer and the convolutional layer in 2D-CNN are in matrix form, and the output of each layer is also a matrix. To extract the spatial deep features of tea, the 2D-CNN is designed in this study, and the structure is shown in Figure 2.
2D-CNN uses two-dimensional convolution to extract local spatial features from the original or reduced dimensionality hyperspectral images. The value v i j x y of the feature at the ( x , y ) coordinate of the j -th feature of the i -th layer can be expressed as:
v i j x y = δ ( k = 1 m , p = 0 P i 1 q = 0 Q i 1 ω i j k p q v ( i 1 ) k ( x + p ) ( y + q ) + b i j )
In the formula: P i and Q i are the size of the two-dimensional convolution kernel of the i -th layer.
The fully connected layer can be regarded as a one-dimensional vector, so the fully connected layer is added before the output layer of the backbone network as the deep feature of the image. As can be seen from Figure 2, 2D-CNN consists of three convolutional layers (Conv1, Conv2, Conv3), three pooling layers (MaxPool1, MaxPool2, MaxPool3), one flat layer, two fully connected layers (Dense1, Dense2) and an output layer. Among them, the convolution kernel size of the convolution layer and the pooling layer is 3 × 3. The hyperspectral images (399 × 399) are input to 2D-CNN, the output of the Dense2 serves as the spatial deep feature. The specific parameters are shown in Table 3.

2.2.4. Estimation of Tea Polyphenol Content Based on Deep Features

To build a tea polyphenol prediction model, the technical route of this study was shown in Figure 3.
Firstly, the ROI region was selected from the hyperspectral image of tea samples with ENVI software, and the spectral reflectance, characteristic wavelength fusion image and pixel point spectral data were extracted from the samples in the ROI region. Secondly, the one-dimensional spectral reflectance (457 × 1) was input into 1D-CNN to extract 32-dimensional spectral deep features. The hyperspectral images corresponding to the characteristic wavelengths selected by SPA were fused to obtain the fused image, which was input into 2D-CNN to extract 32-dimensional spatial deep features. Furthermore, the above obtained features were fused to obtain 64-dimensional spectral-spatial deep features to construct an estimation model of tea polyphenol content. Finally, the test set was used for model evaluation and parameter optimization, aiming to construct the optimal prediction model. In addition, the pixel point spectral data was input into the optimal prediction model to visualize the content of tea polyphenols. To better verify the applicability of different characteristics and different models, the coefficient of determination (R2), root mean square error (RMSE), and mean absolute error (MAE) were used as indicators to evaluate the prediction of tea polyphenol content [21].
Among them, the spectral-spatial deep features were obtained through the extracted spectral deep features and spatial deep features. Firstly, the z-score was used to normalize the deep features, and then weighted fusion was performed. Assuming that S 1 is the spectral deep feature extracted by 1D-CNN, S 2 is the spatial deep feature extracted by 2D-CNN, normalized row by row using the z-score function, the expression is:
f ( x i j ) = x i j μ i σ i , j = 1 , 2 , n ,
Here, x i j is an element value in row i ; μ i and σ i are the mean and standard deviation of row i , respectively.
The weighted fusion feature S can be expressed as
S = [ f ( S 1 ) ; f ( S 2 ) ]
In the formula: f ( S 1 ) is the normalized spectral feature; f ( S 2 ) is the normalized spatial feature.

3. Results

3.1. Spectral Data and Spatial Deep Features Acquisition

To effectively extract the deep features of the spectrum and avoid under-fitting of the model due to too little data, the reflectivity of all spectral wavelengths after preprocessing is used as the input of 1D-CNN. Figure 4 shows the process of hyperspectral image and spectrum acquisition of tea samples.
Figure 4a shows the hyperspectral imager used in this study, and the specific parameters are shown in the literature [21]. Figure 4b represents the hyperspectral image of tea samples. The Environment for Visualizing Images s (ENVI 5.1, ITT visual information solutions, Boulder, CO, USA) software was used to select 10 regions of interest (ROI) with the size of 30 × 30 pixel, the average spectral reflectance value of the 9000 pixels was calculated as a spectral record, a total of 140 spectral records. Figure 4c shows the hyperspectral reflectance of tea samples of different grades and manufacturers. It can be seen from Figure 4c that the spectral curves of all green tea samples showed similar trends. However, there are still some differences in spectral reflectance between 950 and 1650 nm, which may be caused by the difference in chemical composition of tea leaves in different production areas. In particular, there are distinct characteristic peaks at 948–970 nm, 1088–1105 nm, 1182–1212 nm, 1251–1351 nm, 1443–1481 nm and 1651–1662 nm. Previous studies have shown that these characteristic peaks reflect different chemical components of tea samples, including polyphenols, free amino acids, and functional groups of proteins, such as CH, CH2, CH3, C=O, and OH. As shown in Figure 4, the absorption peaks around 948–970 nm and 1182–1212 nm correspond to the second overtone of the C–H stretching of the CH2 and CH3 functional groups in tea polyphenols.
In addition, hyperspectral images of green tea samples including 508 bands (908–1735 nm) were obtained. The spectral information of 908–943 nm and 1689–1735 nm has obvious noise. The possible reason is that the instrument response, scattered light, stray light, sample unevenness and other factors unrelated to the properties of the sample to be tested will interfere with the near-infrared spectrum, resulting in baseline shifts appearing in the near-infrared spectroscopy. Therefore, after removing a total of 51 bands in the front and rear of the spectral curve, the remaining 457 bands (944–1688 nm) are used as the processed spectral data, as shown in Figure 4c.

3.2. Hyperspectral Images and Spatial Deep Features Acquisition

To improve the model detection accuracy, three different schemes are designed to select the characteristic wavelength, and the number of bands is set to 0–10, 10–20, and 20–30, respectively. Therefore, 8, 10, and 22 characteristic wavelengths were obtained by SPA. The combination of reflectance corresponding to the above preferred wavelengths was used as the random forest (RF) model to predict the content of tea polyphenols, the results are shown in Figure 5. It can be seen from the Figure 5 that that the prediction effect of the model built with 10 wavelengths is preferably better than that of 8 wavelengths and 12 wavelengths, either for the training set or the test set.
In fact, there is a lot of redundant information in hyperspectral data, which may reduce the accuracy of the model. Therefore, the preferred characteristic wavelengths are often used to improve the predictive power of the model. However, the selection of the number of bands is too small to reflect all the spectral information generated by the measured components, resulting in underfitting of the model. On the contrary, choosing too many bands will lead to overfitting. Therefore, the 457 bands of 140 tea samples were selected by SPA to select characteristic wavelength hyperspectral images for pixel-level fusion, and the obtained fusion images were used to obtain spatial deep features, that is, the hyperspectral images corresponding to 10 characteristic wavelengths are used for fusion, and the results are shown in the Figure 6.
The pixel-level image fusion is used to keep as much fine information of the original characteristic wavelength image as possible. The specific step is to directly fuse hyperspectral images corresponding to multiple characteristic wavelengths. Among them, there are extremely high requirements for the registration accuracy. Therefore, in order to ensure the consistency of the original data, the 399 × 399 pixel region of interest in the hyperspectral image is selected, and which is the same region of interest as the extracted spectral data. A total of 10 characteristic wavelengths are extracted, including 944 nm, 951 nm, 1067 nm, 1104 nm, 1376 nm, 1425 nm, 1582 nm, 1655 nm, 1685 nm, 1688 nm, and the corresponding hyperspectral images (grayscale images) are fused to retain more useful information. Moreover, these bands have also been reported to be associated with components such as phenols [14].

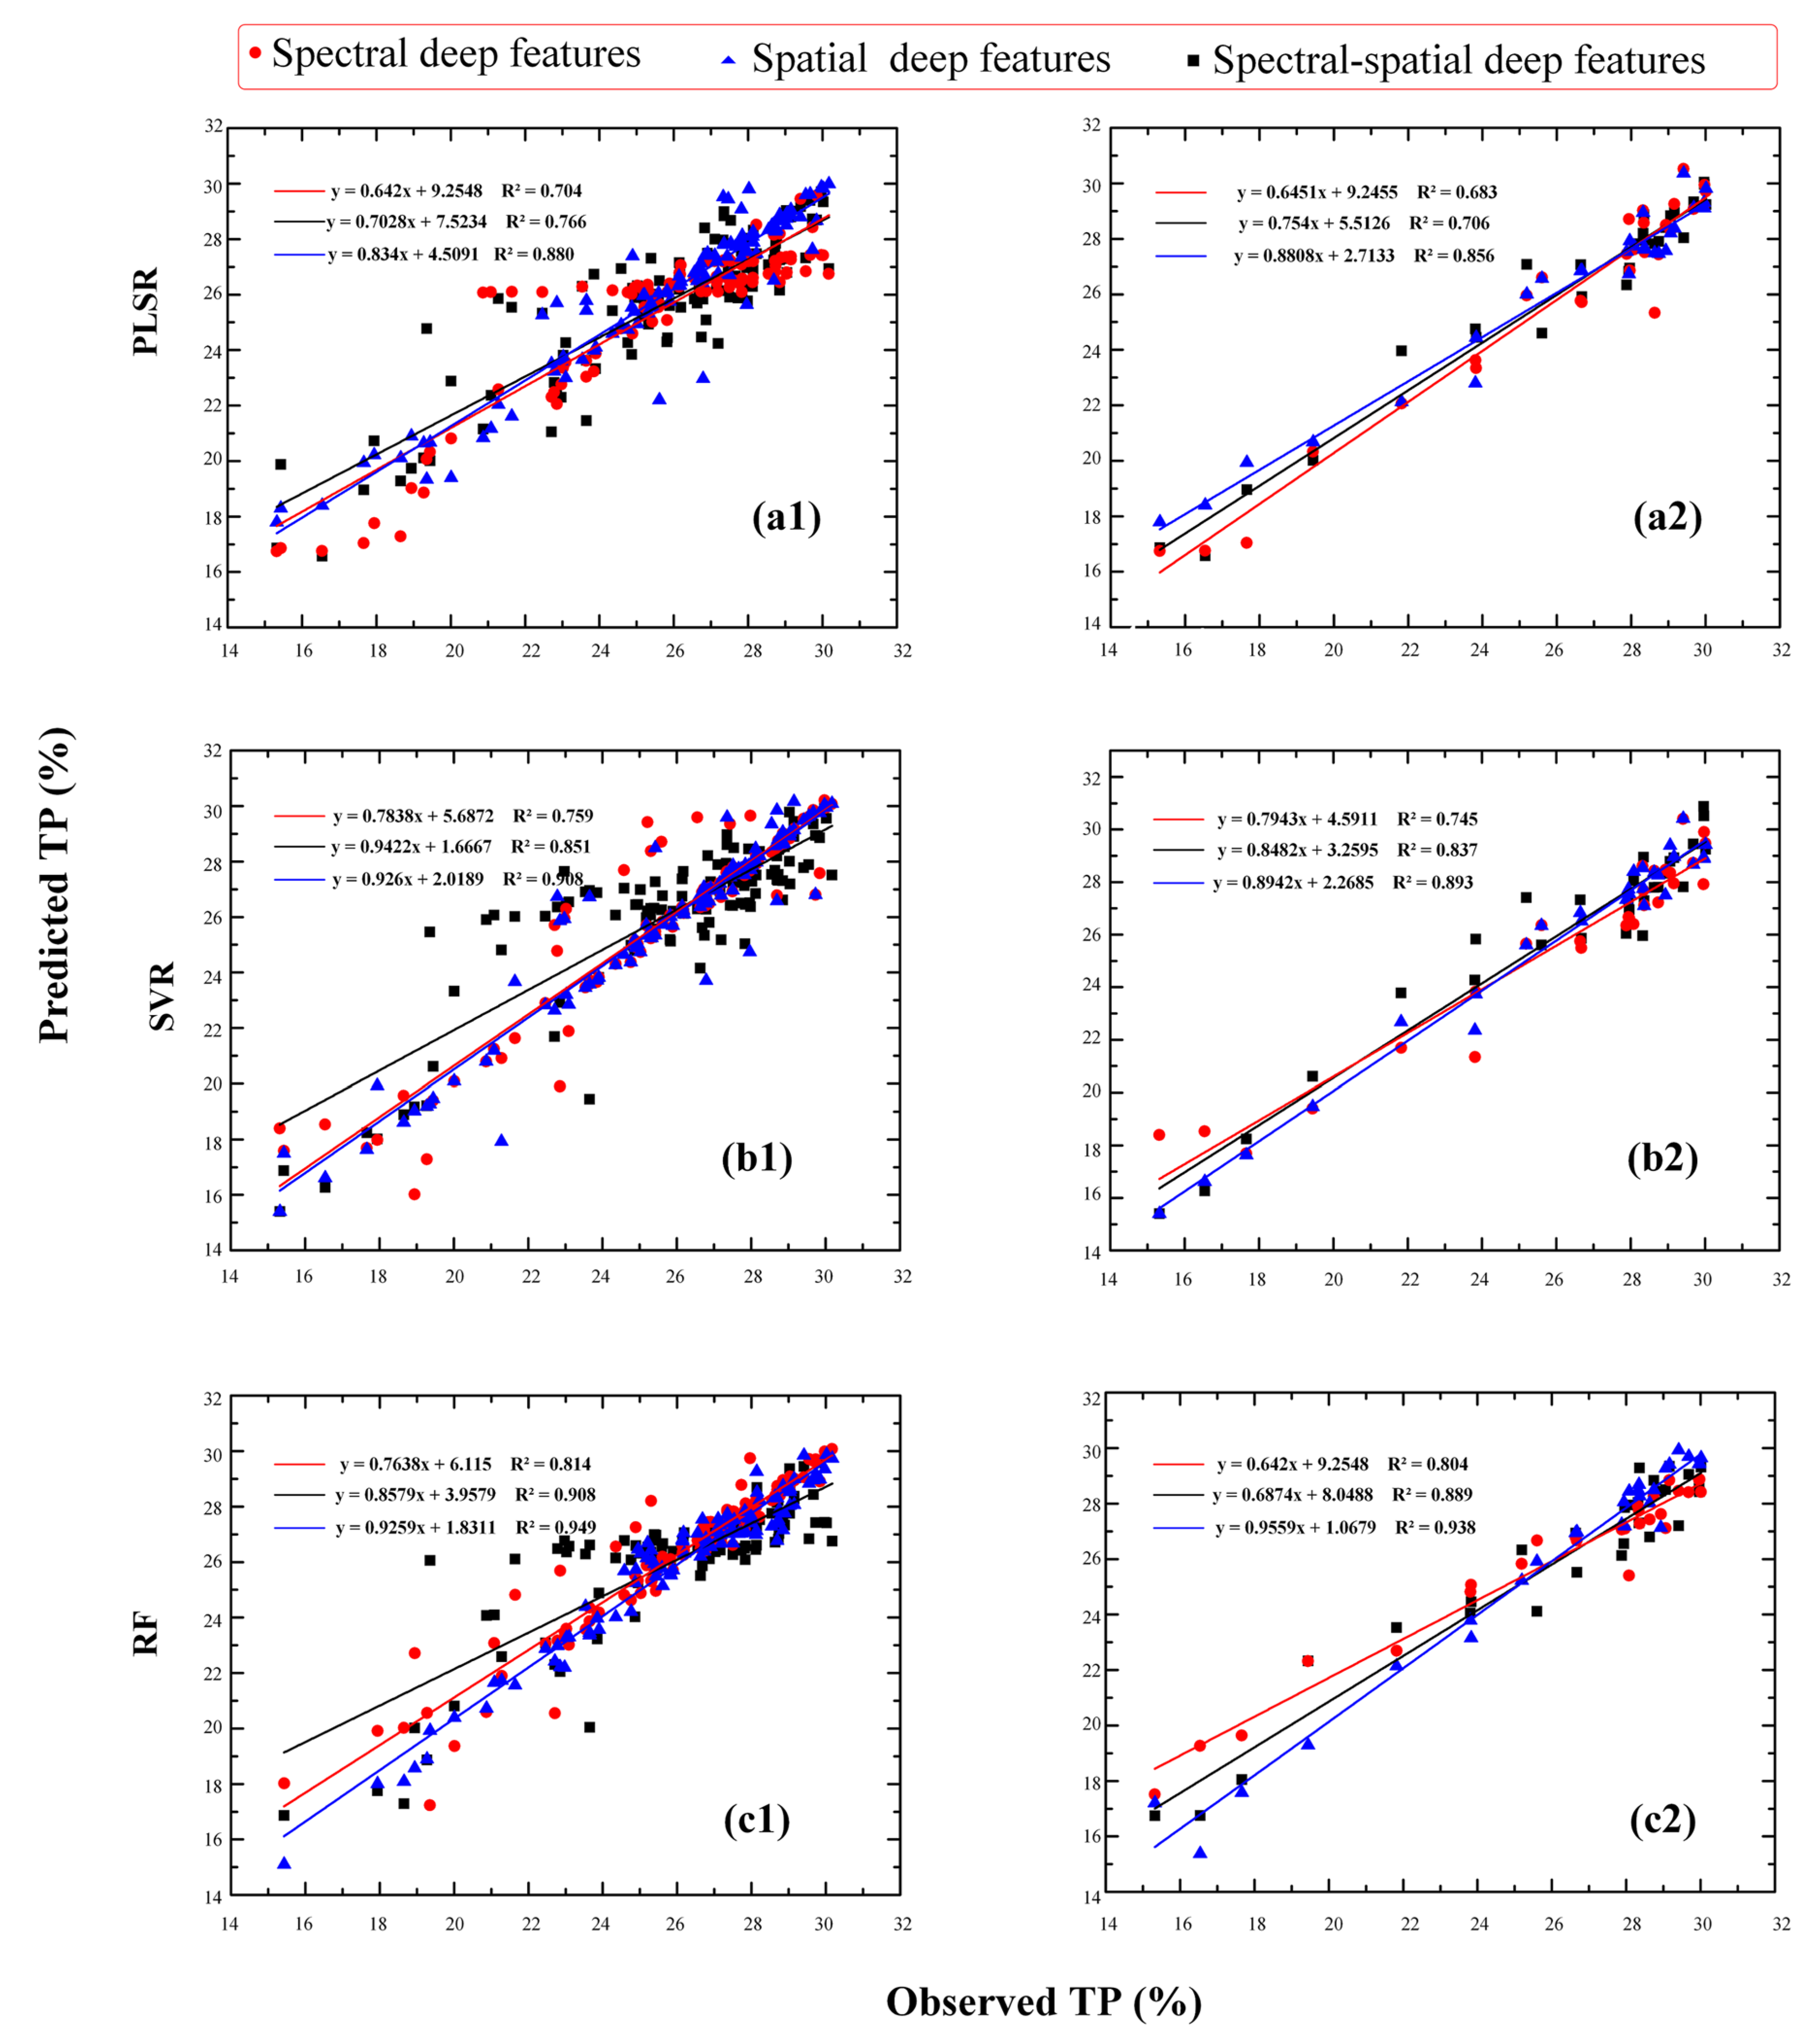
3.3. Prediction Model of Tea Polyphenols Content with Spectral-Spatial Deep Features

Due to the difference in the tea from the source manufacturer, the collected tea samples are not completely consistent. Therefore, the tea samples from different manufacturers were divided into training sets and test sets according to 4:1. The training set was used to construct the tea polyphenol prediction model, and the test set was used to verify the validity of the model. Therefore, the extracted spectral deep features (32 dimensions), spatial deep features (32 dimensions), and the spectral-spatial deep features (64 dimensions) were used as the input of the PLSR, SVR and RF models [16,18], respectively, to construct a tea polyphenol content prediction model, which are trained and tested; the results are shown in Table 4. Among them, the parameters of the model were optimized through multiple adjustments and experiments. The number of principal components of the PLSR model is 4, the kernel function of the SVR model is RBF, and the subtree of RF is 3000.
Table 4 showed the results of the tea polyphenol content model predicted with different features, for the spectral deep features, the R2 is 0.704–0.814, the MAE is 1.048–1.24 of the training set, the R2 is 0.683–0.804, MAE is 1.762–2.021 of the test set. For the spatial deep features, the R2 is 0.766–0.908 and the MAE is 0.552–1.031 of the training set, the R2 is 0.706–0.890 and the MAE is 1.514–1.957 of the test set. For spectral-spatial deep features, the R2 is 0.880–0.949 and the MAE is 0.427–0.626 of the training set, the R2 is 0.856–0.938 and the MAE is 0.799–1.279 of the test set. Overall, the coefficient of determination of the prediction set based on the spectral-spatial deep features is greater than 0.85, which further verifies that the model has good prediction ability. The prediction results based on spectral-spatial deep features are better than that of spectral deep features and spatial deep features.

4. Discussion

4.1. Comparison Results of Prediction Model for Tea Polyphenols

Figure 7 showed the results predicted using different models. Regarding the training set, for the PLSR model, compared with the spectral deep feature, the R2 of the model based on the spectral-spatial deep features was improved by 25%, and the RMSE and MAE were reduced by 35.4% and 49.5%, respectively; compared with the spatial deep feature, the R2 was improved by 14.9%, and the RMSE and MAE were decreased by 28.4% and 39.3% respectively. For the SVR model, compared with spectral deep feature and spatial deep feature, the R2 of the model based on spectral-spatial deep features was improved by 19.5% and 0.6%, and the RMSE and MAE were decreased by 37.9% and 59.2%, 24.1% and 30.3%. For the RF model, compared with spectral deep feature and spatial deep feature, the R2 of the model based on spectral-spatial deep features was improved by 16.5% and 4.4%, and the RMSE and MAE were decreased by 47.2% and 47.6, 27.9% and 3.4%.
Regarding the test set, compared with spectral deep feature and spatial deep feature, the R2 of the model based on the spectral-spatial deep features was improved by 25.4% and 21.2% for PLSR, 19.9% and 6.6% for SVR, 16.7% and 5.5% for RF. It could be clearly seen that the spectral-spatial deep features contained more comprehensive and rich feature information, thereby improving the prediction ability of tea polyphenol content. In addition, the prediction model based on random forest had the best effect in estimating the content of tea polyphenols among the three machine learning models.
At present, most methods of fusion of spatial features and spectral features are mainly the concatenation and addition of two shallow features, which can also achieve satisfactory results. However, it is easy to ignore the correlation between the two features. Especially for hyperspectral images, there is a certain correlation between the spatial information and spectral information of hyperspectral images [30]. If the spatial shallow features and spectral shallow features are added together, it will not only cause information redundancy, but it also also loses the exchange of information between the spatial spectral features. Therefore, the spatial deep features and spectral deep features extracted by the CNN not only retain the key information, but also reduce redundant information [31].

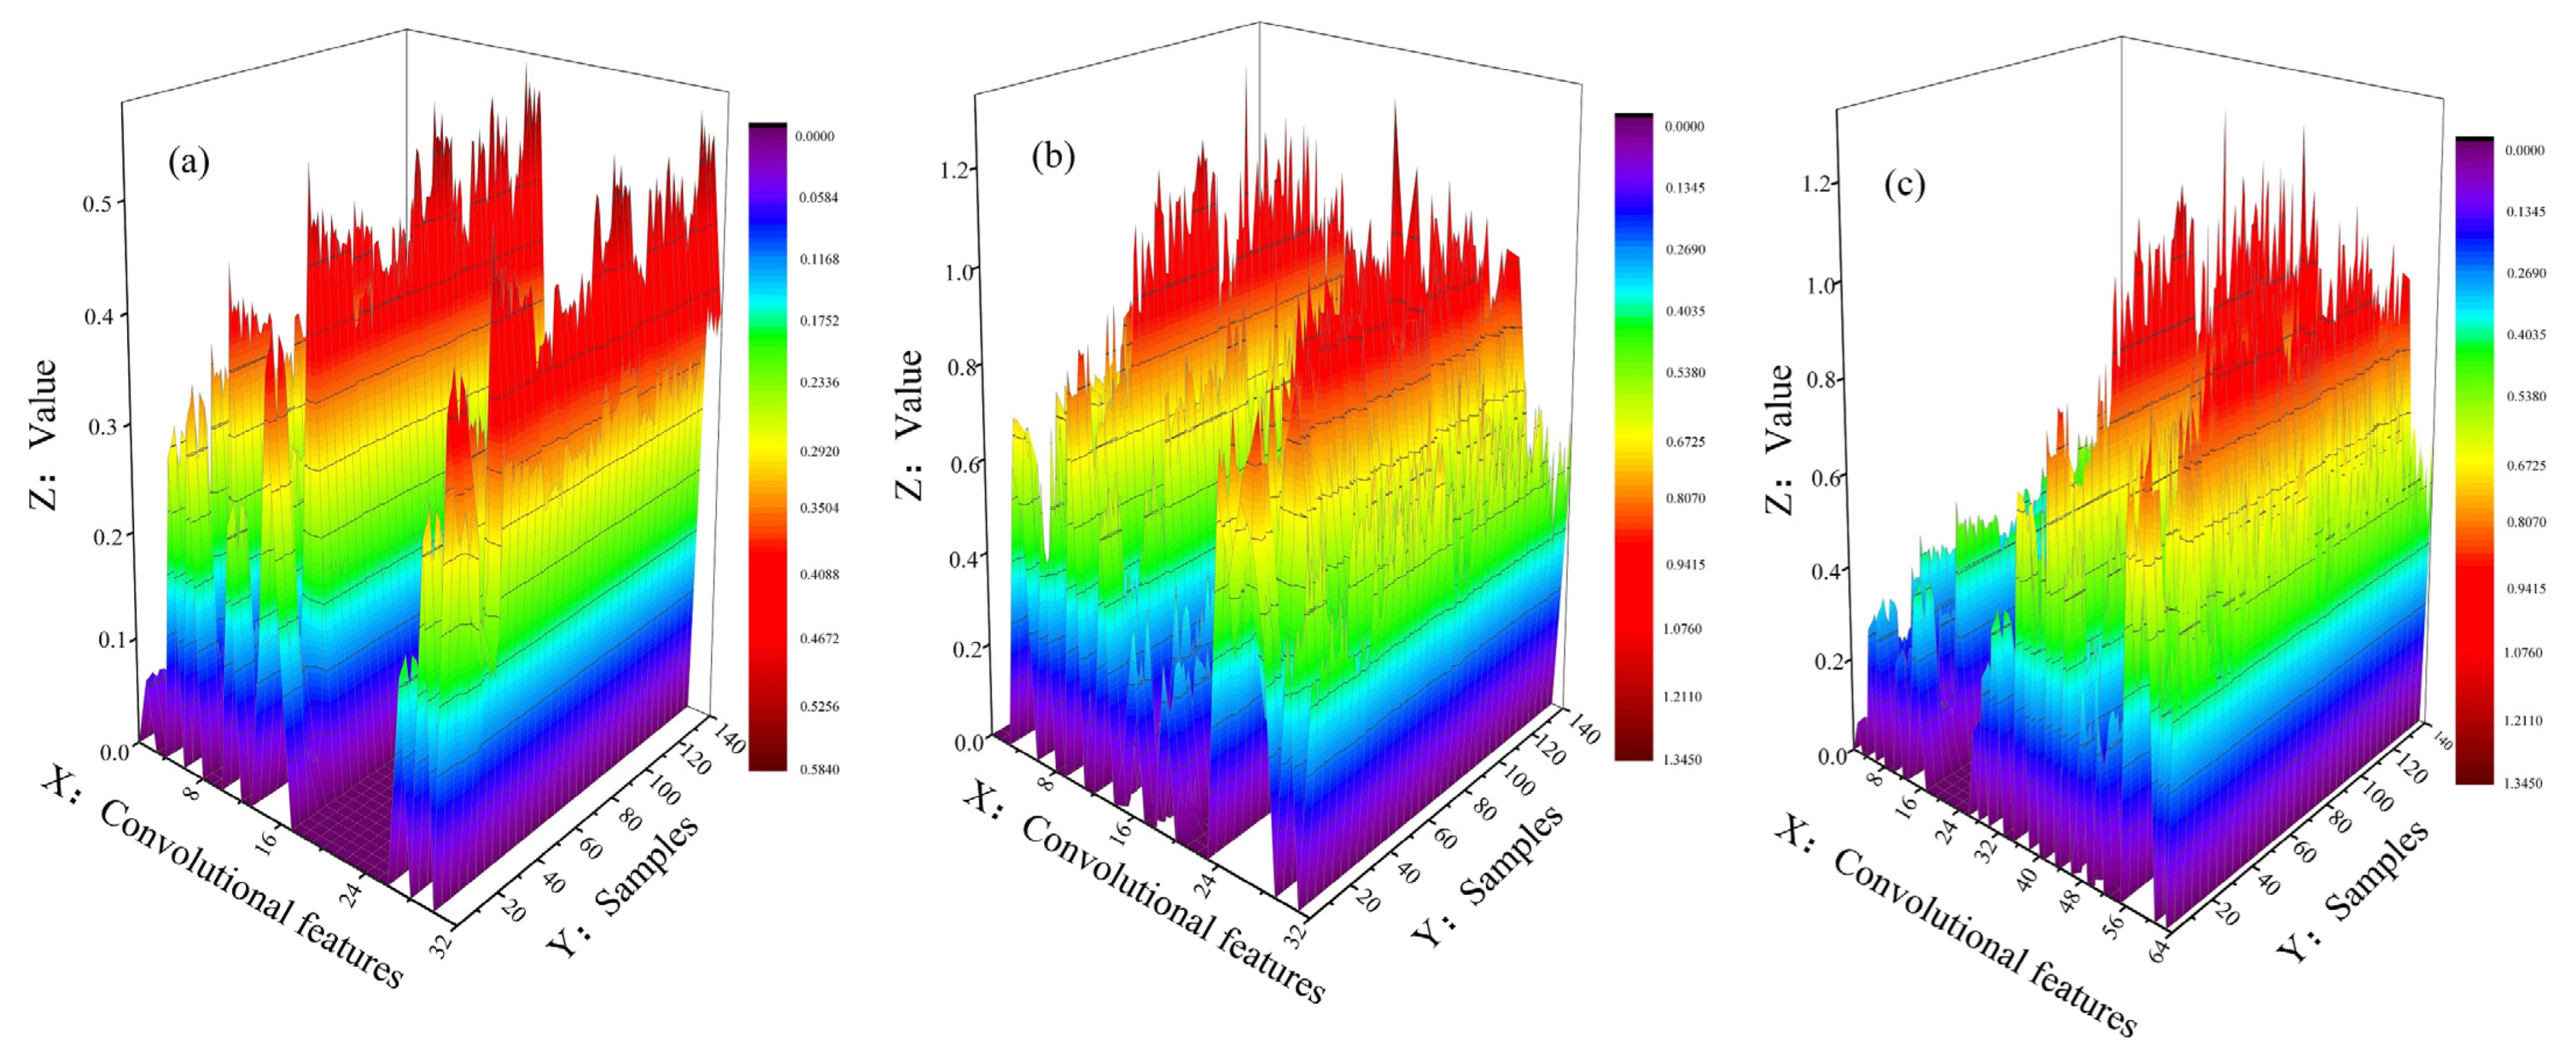
4.2. Comparison of Extraction Results of Different Deep Features

CNN has been shown to extract effective deep features from hyperspectral images [32]. To display different spectral-spatial deep features more intuitively, the extracted spectral-spatial deep features were generated into heat maps, and the results were shown in Figure 8. The mean value of the deep eigenvalues of the 32-dimensional spectrum was 0.0993, which was distributed between 0 and 0.5828. The mean value of the deep eigenvalues in the 32-dimensional space was 0.2896, which was distributed between 0 and 1.3428. Figure 8a showed the difference of the deep spectral features extracted from 140 tea samples. The maximum value of spectral deep features of different samples was between [0.2157, 0.5829], and the mean value was between [0.0474, 0.1224].
From Figure 8b it was shown that the values of the spatial deep features extracted from the 140 tea samples had a larger value range than the spectral deep features; the range of the maximum spectral deep features of different samples was [0.6370, 1.3429], and the mean value was between [0.1542, 0.4054]. Figure 8c showed the visualization of spectral-spatial deep features. The above results reflected the diversity of tea samples and provided the data basis for the construction of tea polyphenol prediction models.
In addition, it could be seen from Figure 6a that the extracted 32-dimensional spectral convolution features were 0 for 18–26 dimensions. It might be because there was a lot of redundant information in the full-band spectral, and the spectral information after convolution was basically useless. On the one hand, the feature dimension can be reduced through the convolutional neural network, especially through three sets of convolutional layers and pooling layers, so that the features can be reduced from 457 to 32 dimensions. On the other hand, the 1D-CNN and 2D-CNN proposed in this study could not only extract high-order semantic features, but also make up for the limitations of traditional feature representation.

4.3. Visualization of Tea Polyphenol Content Prediction Results

At present, deep learning models represented by CNN were increasingly applied to the analysis of hyperspectral images. The extraction and modeling of spectral deep features based on 1D-CNN has been applied to the classification of cotton seeds [33], the identification of low temperature stress in maize plants [34], detection of pesticide residues in leek leaves [35], the prediction of water content in maize plants [36], detection of anthocyanins in black wolfberry [37], etc. The spatial deep features extracted by 2D-CNN have been applied to classification of apple leaf status [38], estimation of seed vigor of maize [39], identification of diseased areas of potato plant canopy [40], identification of disease-resistant rice seeds [41], et al. In this study, the deep spatial features extracted by 1D-CNN and 2D-CNN were combined, and all models achieved good results, indicating the feasibility of using CNN for hyperspectral image analysis.
To visually demonstrate the estimation effect of the method proposed in this paper [42], the best model in the above experiments was selected for testing, that is, the RF regression model based on spectral-spatial deep features, as shown in Figure 9. Figure 9 showed the distribution of tea polyphenol content, which was a pseudo-color map of tea polyphenol content. As could be seen from Figure 9, the visualization of the polyphenol content of Huangshan Maofeng tea of different grades and different manufacturers. Among them, the colors of the pseudo-color mapped from blue to red represented the proportion of tea polyphenols from 0 to 30%, respectively.
According to the mass of each tea sample 20 g, Figure 9a showed that the content of tea polyphenols in L1-ZYYTF was about 3.6 g, Figure 9b showed that the content of tea polyphenols in L1-HSTF was about 4.4 g, Figure 9c showed that the content of tea polyphenols in T1-HSGMTF was about 5.4 g, Figure 9d showed that the content of tea polyphenols in T1-HZFSTF was about 6.0 g. Therefore, the prediction results of tea polyphenol content of different samples could be visually seen, which would further develop the technology of rapid and non-destructive detection of biochemical parameters of tea samples.

5. Conclusions

In this study, a tea polyphenol prediction model based on spectral-spatial deep features was proposed, aiming to improve the estimation accuracy of tea polyphenol content based on hyperspectral images. Among them, the deep features extracted by the CNN can not only make up for the shortcomings of traditional shallow features, such as color, texture and shape features, but also improve the feature expression ability; including deep spectral features were extracted based on 1D-CNN, and deep spatial features were extracted based on 2D-CNN.
Moreover, the spectral-spatial features contain more comprehensive information than single spectral deep feature or spatial deep feature, which greatly improved the estimation accuracy of the model. The experimental results showed that the spectral-spatial deep feature estimation from tea hyperspectral images was the best, with R2 = 0.949 for training sets, and R2 = 0.938 for test sets. In conclusion, deep feature for the hyperspectral image extracted using CNN proposed provided technical support for tea polyphenol content estimation. The application of deep learning technology will also promote the development of new technical paths in the field of the non-destructive testing of tea.

Author Contributions

Methodology and writing, N.L. and B.Y.; software, N.L.; data curation, B.L. and Y.L.; writing—review and editing, B.Y. and Q.D. All authors have read and agreed to the published version of the manuscript.

Funding

This work was supported by National Key Research and Development Program (2021YFD1601102), the Open Fund of State Key Laboratory of Tea Plant Biology and Utilization (SKLTOF20200116), the Major Science and Technology Projects in Anhui Province (202203a06020007), and the Opening Project of Key Laboratory of Power Electronics and Motion Control of Anhui Higher Education Institutions (PEMC2001).

Institutional Review Board Statement

Not applicable.

Informed Consent Statement

Not applicable.

Data Availability Statement

The raw data supporting the conclusions of this article will be made available by the authors, without undue reservation.

Conflicts of Interest

All the authors declare no conflict of interest.

References

  1. Murugesh, C.S.; Rastogi, N.K.; Subramanian, R. Athermal extraction of green tea: Optimisation and kinetics of extraction of polyphenolic compounds. Innov. Food Sci. Emerg. Technol. 2018, 50, 207–2162018. [Google Scholar] [CrossRef]
  2. Santanu, S.; Bhuyan, L.P.; Goswam, B.C.; Mridul, H. Seasonal and cultivar variation of catechin in north east Indian tea. Sci. Cult. 2011, 77, 406–411. [Google Scholar]
  3. Zhang, M.; Dai, E.; Zhang, Y.; Yu, Y.; Song, X. Advances in Research of Green Tea Polyphenols in Drug Development. Med. Plant 2020, 11, 10–16. [Google Scholar]
  4. Yang, B.; Zhu, Y.; Wang, M.; Ning, J. A model for yellow tea polyphenols content estimation based on multi-feature fusion. IEEE Access 2019, 7, 180054–180063. [Google Scholar] [CrossRef]
  5. Hocker, N.; Wang, C.; Prochotsky, J.; Eppurath, A.; Rudd, L.; Perera, M. Quantification of antioxidant properties in popular leaf and bottled tea by high-performance liquid chromatography (HPLC), spectrophotometry, and voltammetry. Anal. Lett. 2017, 50, 1640–1656. [Google Scholar] [CrossRef]
  6. Mirasoli, M.; Gotti, R.; di Fusco, M.; Leoni, A.; Colliva, C.; Roda, A. Electronic nose and chiral-capillary electrophoresis in evaluation of the quality changes in commercial green tea leaves during a long-term storage. Talanta 2014, 129, 32–38. [Google Scholar] [CrossRef]
  7. Lee, M.S.; Hwang, Y.S.; Lee, J.; Choung, M.G. The characterization of caffeine and nine individual catechins in the leaves of green tea (Camellia sinensis L.) by near-infrared reflectance spectroscopy. Food Chem. 2014, 158, 351–357. [Google Scholar] [CrossRef]
  8. Zhang, S.; Zuo, Y.; Wu, Q.; Wang, J.; Ban, L.; Yang, H.; Bai, Z. Development and Validation of Near-Infrared Methods for the Quantitation of Caffeine, Epigallocatechin-3-gallate, and Moisture in Green Tea Production. J. Anal. Methods Chem. 2021, 2021, 9563162. [Google Scholar] [CrossRef]
  9. Liu, Z.; Zhang, R.; Yang, C.; Hu, B.; Luo, X.; Li, Y.; Dong, C. Research on moisture content detection method during green tea processing based on machine vision and near-infrared spectroscopy technology. Spectrochim. Acta Part A Mol. Biomol. Spectrosc. 2022, 271, 120921. [Google Scholar] [CrossRef]
  10. Li, X.; Jin, J.; Sun, C.; Ye, D.; Liu, Y. Simultaneous determination of six main types of lipid-soluble pigments in green tea by visible and near-infrared spectroscopy. Food Chem. 2019, 270, 236–242. [Google Scholar] [CrossRef]
  11. Liu, P.; Wen, Y.; Huang, J.; Xiong, A.; Wen, J.; Li, H.; Huang, Y.; Zhu, X.; Ai, S.; Wu, R. A novel strategy of near-infrared spectroscopy dimensionality reduction for discrimination of grades, varieties and origins of green tea. Vib. Spectrosc. 2019, 105, 102984. [Google Scholar] [CrossRef]
  12. Hazarika, A.K.; Chanda, S.; Sabhapondit, S.; Sanyal, S.; Tamuly, P.; Tasrin, S.; Sing, D.; Tudu, B.; Bandyopadhyay, R. Quality assessment of fresh tea leaves by estimating total polyphenols using near infrared spectroscopy. J. Food Sci. Technol. 2018, 55, 4867–4876. [Google Scholar] [CrossRef] [PubMed]
  13. Chen, Q.; Zhao, J.; Liu, M.; Cai, J.; Liu, J. Determination of total polyphenols content in green tea using FT-NIR spectroscopy and different PLS algorithms. J. Pharm. Biomed. Anal. 2008, 46, 568–573. [Google Scholar] [CrossRef] [PubMed]
  14. Bian, M.; Skidmore, A.K.; Schlerf, M.; Wang, T.; Liu, Y.; Zeng, R.; Fei, T. Predicting foliar biochemistry of tea (Camellia sinensis) using reflectance spectra measured at powder, leaf and canopy levels. ISPRS J. Photogramm. Remote Sens. 2013, 78, 148–156. [Google Scholar] [CrossRef]
  15. Zhang, J.; Ma, Y.; Liu, G.; Fan, N.; Li, Y.; Sun, Y. Rapid evaluation of texture parameters of Tan mutton using hyperspectral imaging with optimization algorithms. Food Control. 2022, 135, 108815. [Google Scholar] [CrossRef]
  16. Yang, B.; Qi, L.; Wang, M.; Hussain, S.; Wang, H.; Wang, B.; Ning, J. Cross-Category Tea Polyphenols Evaluation Model Based on Feature Fusion of Electronic Nose and Hyperspectral Imagery. Sensors 2020, 20, 50. [Google Scholar] [CrossRef] [PubMed]
  17. Kang, Y.S.; Ryu, C.; Suguri, M.; Park, S.B.; Kishino, S.; Onoyama, H. Estimating the catechin concentrations of new shoots in green tea fields using ground-based hyperspectral imagery. Food Chem. 2022, 370, 130987. [Google Scholar] [CrossRef] [PubMed]
  18. Yang, B.; Gao, Y.; Li, H.; Ye, S.; He, H.; Xie, S. Rapid prediction of yellow tea free amino acids with hyperspectral images. PLoS ONE 2019, 14, e0210084. [Google Scholar] [CrossRef]
  19. Yang, C.; Zhao, Y.; An, T.; Liu, Z.; Jiang, Y.; Li, Y.; Dong, C. Quantitative prediction and visualization of key physical and chemical components in black tea fermentation using hyperspectral imaging. LWT 2021, 141, 110975. [Google Scholar] [CrossRef]
  20. Saikrithika, S.; Senthil Kumar, A. Electrochemical detections of tea polyphenols: A review. Electroanalysis 2020, 32, 2343–2360. [Google Scholar] [CrossRef]
  21. Cui, Q.; Yang, B.; Liu, B.; Li, Y.; Ning, J. Tea Category Identification Using Wavelet Signal Reconstruction of Hyperspectral Imagery and Machine Learning. Agriculture 2022, 12, 1085. [Google Scholar] [CrossRef]
  22. Yang, B.; Gao, Z.; Gao, Y.; Zhu, Y. Rapid Detection and Counting of Wheat Ears in the Field Using YOLOv4 with Attention Module. Agronomy 2021, 11, 1202. [Google Scholar] [CrossRef]
  23. Venugopal, N. Automatic semantic segmentation with DeepLab dilated learning network for change detection in remote sensing images. Neural Processing Lett. 2020, 51, 2355–2377. [Google Scholar] [CrossRef]
  24. Liu, L.; Shi, Z.; Pan, B.; Zhang, N.; Luo, H.; Lan, X. Multiscale deep spatial feature extraction using virtual RGB image for hyperspectral imagery classification. Remote Sens. 2020, 12, 280. [Google Scholar] [CrossRef]
  25. Diakite, A.; Jiangsheng, G.; Xiaping, F. Hyperspectral image classification using 3D 2D CNN. IET Image Process. 2021, 15, 1083–1092. [Google Scholar] [CrossRef]
  26. Yu, G.; Ma, B.; Chen, J.; Li, X.; Li, Y.; Li, C. Nondestructive identification of pesticide residues on the Hami melon surface using deep feature fusion by Vis/NIR spectroscopy and 1D-CNN. J. Food Process Eng. 2021, 44, e13602. [Google Scholar] [CrossRef]
  27. Xu, M.; Sun, J.; Yao, K.; Cai, Q.; Shen, J.; Tian, Y.; Zhou, X. Developing deep learning based regression approaches for prediction of firmness and pH in Kyoho grape using Vis/NIR hyperspectral imaging. Infrared Phys. Technol. 2022, 120, 104003. [Google Scholar] [CrossRef]
  28. Benediktsson, J.A.; Palmason, J.A.; Sveinsson, J.R. Classification of hyperspectral data from urban areas based on extended morphological profiles. IEEE Trans. Geosci. Remote Sens. 2005, 43, 480–491. [Google Scholar] [CrossRef]
  29. Wang, B.; Shao, Q.; Song, D.; Li, Z.; Tang, Y.; Yang, C.; Wang, M. A spectral-spatial features integrated network for hyperspectral detection of marine oil spill. Remote Sens. 2021, 13, 1568. [Google Scholar] [CrossRef]
  30. Cao, X.; Ge, Y.; Li, R.; Zhao, J.; Jiao, L. Hyperspectral imagery classification with deep metric learning. Neurocomputing 2019, 356, 217–227. [Google Scholar] [CrossRef]
  31. Guo, A.J.; Zhu, F. A CNN-based spatial feature fusion algorithm for hyperspectral imagery classification. IEEE Trans. Geosci. Remote Sens. 2019, 57, 7170–7181. [Google Scholar] [CrossRef]
  32. Kavitha, M.; Gayathri, R.; Polat, K.; Alhudhaif, A.; Alenezi, F. Performance evaluation of deep e-CNN with integrated spatial-spectral features in hyperspectral image classification. Measurement 2022, 191, 110760. [Google Scholar] [CrossRef]
  33. Zhu, S.; Zhou, L.; Gao, P.; Bao, Y.; He, Y.; Feng, L. Near-infrared hyperspectral imaging combined with deep learning to identify cotton seed varieties. Molecules 2019, 24, 3268. [Google Scholar] [CrossRef] [PubMed]
  34. Yang, W.; Yang, C.; Hao, Z.; Xie, C.; Li, M. Diagnosis of plant cold damage based on hyperspectral imaging and convolutional neural network. IEEE Access 2019, 7, 118239–118248. [Google Scholar] [CrossRef]
  35. He, W.; He, H.; Wang, F.; Wang, S.; Lyu, R. Non-destructive detection and recognition of pesticide residues on garlic chive (Allium tuberosum) leaves based on short wave infrared hyperspectral imaging and one-dimensional convolutional neural network. J. Food Meas. Charact. 2021, 15, 4497–4507. [Google Scholar] [CrossRef]
  36. Rehman, T.U.; Ma, D.; Wang, L.; Zhang, L.; Jin, J. Predictive spectral analysis using an end-to-end deep model from hyperspectral images for high-throughput plant phenotyping. Comput. Electron. Agric. 2020, 177, 105713. [Google Scholar] [CrossRef]
  37. Zhang, C.; Wu, W.; Zhou, L.; Cheng, H.; Ye, X.; He, Y. Developing deep learning based regression approaches for determination of chemical compositions in dry black goji berries (Lycium ruthenicum Murr.) using near-infrared hyperspectral imaging. Food Chem. 2020, 319, 126536. [Google Scholar] [CrossRef]
  38. Park, K.; Ki Hong, Y.; Hwan Kim, G.; Lee, J. Classification of apple leaf conditions in hyper-spectral images for diagnosis of Marssonina blotch using mRMR and deep neural network. Comput. Electron. Agric. 2018, 148, 179–187. [Google Scholar] [CrossRef]
  39. Pang, L.; Men, S.; Yan, L.; Xiao, J. Rapid vitality estimation and prediction of corn seeds based on spectra and images using deep learning and hyperspectral imaging techniques. IEEE Access 2020, 8, 123026–123036. [Google Scholar] [CrossRef]
  40. Polder, G.; Blok, P.M.; de Villiers, H.A.; van der Wolf, J.M.; Kamp, J. Potato virus Y detection in seed potatoes using deep learning on hyperspectral images. Front. Plant Sci. 2019, 10, 209. [Google Scholar] [CrossRef]
  41. Zhang, J.; Yang, Y.; Feng, X.; Xu, H.; Chen, J.; He, Y. Identification of bacterial blight resistant rice seeds using terahertz imaging and hyperspectral imaging combined with convolutional neural network. Front. Plant Sci. 2020, 11, 821. [Google Scholar] [CrossRef] [PubMed]
  42. Yang, B.; Gao, Y.; Yan, Q.; Qi, L.; Zhu, Y.; Wang, B. Estimation Method of Soluble Solid Content in Peach Based on Deep Features of Hyperspectral Imagery. Sensors 2020, 20, 5021. [Google Scholar] [CrossRef] [PubMed]
Figure 1. The Structure of 1D-CNN.
Agriculture 12 01299 g001
Figure 2. The Structure of 2D-CNN.
Agriculture 12 01299 g002
Figure 3. Technical flow chart of this study, including (a) data acquisition, (b) feature extraction, (c) modeling and analysis, and (d) visualization.
Agriculture 12 01299 g003
Figure 4. Hyperspectral Image and Spectral Data Acquisition Process, (a) hyperspectral imaging system, (b) hyperspectral image acquisition, and (c) extracted spectral reflectance.
Agriculture 12 01299 g004
Figure 5. Estimation results of TP based on RF models with different wavelength variables.
Agriculture 12 01299 g005
Figure 6. Ten hyperspectral images corresponding to characteristic wavelengths of different tea samples and their fusion images. Among them, hyperspectral images of 10 characteristic wavelengths are obtained from the original hyperspectral image of each tea sample, including the wavelengths from left to right in the first row are 944 nm, 951 nm, 1067 nm, 1104 nm, 1376 nm, and the second row is 1425 nm 1582 nm, 1655 nm, 1685 nm, 1688 nm, and then generate fusion image from ten wavelength images.
Agriculture 12 01299 g006
Figure 7. Prediction results of tea polyphenols based on different models with spectral deep features, spatial deep features and spectral-spatial deep features, including PLSR, SVR, RF with training set: (a1,b1,c1), and test set: (a2,b2,c2).
Agriculture 12 01299 g007
Figure 8. Heat map of deep features, including (a) spectral deep features, (b) spatial deep features, and (c) spectral-spatial deep features.
Agriculture 12 01299 g008
Figure 9. Distribution map of polyphenol content of different tea, including (a) L1-ZYY, (b) L1-HS, (c) L2-GM, and (d) L2-FS.
Agriculture 12 01299 g009
Table 1. Statistics of green tea samples.
VarietiesLevelManufacturerNamedSample
Huangshan MaofengL1GML1-GM10
ZXL1-ZX10
ZYYL1-ZYY10
HSL1-HS10
ZWL1-ZW10
FSL1-FS10
YHTL1-YHT10
L2ZWL2-ZW10
GML2-GM10
YHTL2-YHT10
ZYYL2-ZYY10
YJYL2-YJY10
WXSL2-WXS10
FSL2-FS10
Table 2. The structure parameters of 1D-CNN.
LayerKernelNumber KernelsStrideOutput
Input457 × 1
Conv13 × 11281455 × 1 × 128
Pool13 × 11281151 × 1 × 128
Conv23 × 1641149 × 1 × 64
Pool23 × 164149 × 1 × 64
Conv33 × 132147 × 1 × 32
Pool33 × 132115 × 1 × 32
Flatten480
Dense164
Dense232
Table 3. The structure parameters of 2D-CNN.
LayerKernelNumber KernelsStrideOutput
Input——————399 × 399
Conv13 × 31281399 × 399 × 128
Pool13 × 31283133 × 133 × 128
Conv23 × 3641133 × 133 × 64
Pool23 × 364344 × 44 × 64
Conv33 × 332144 × 44 × 32
Pool33 × 332314 × 14 × 32
Flatten6272
Dense164
Dense232
Table 4. Performance comparison of tea polyphenol prediction models based on different features.
FeaturesModelTraining SetTest Set
R2RMSEMAER2RMSEMAE
Spectral deep featuresPLSR0.7041.5951.2400.6832.3661.866
SVR0.7591.4251.0480.7452.2712.021
RF0.8141.2611.0170.8041.9011.762
Spatial deep featuresPLSR0.7661.4371.0310.7062.4621.957
SVR0.8511.1670.6130.8371.8311.596
RF0.9080.9240.5520.8891.6611.514
Spectral-spatial
Deep features
PLSR0.8801.0290.6260.8561.6421.123
SVR0.9080.8850.4270.8931.4561.279
RF0.9490.6650.5330.9381.0430.799
Publisher’s Note: MDPI stays neutral with regard to jurisdictional claims in published maps and institutional affiliations.

