Article

Establishment and Validation of a Structural Dynamics Model with Power Take-Off Driveline for Agricultural Tractors

1
College of Engineering, China Agricultural University, Beijing 100083, China
2
Beijing Key Laboratory of Optimized Design for Modern Agricultural Equipment, Beijing 100083, China
*
Author to whom correspondence should be addressed.
Agriculture 2022, 12(9), 1297; https://doi.org/10.3390/agriculture12091297
Submission received: 19 July 2022 / Revised: 22 August 2022 / Accepted: 23 August 2022 / Published: 24 August 2022
(This article belongs to the Section Agricultural Technology)

Abstract

:
As off-road vehicles, in addition to field transportation, another vital function of agricultural tractors is to provide power for field machinery. Therefore, the dynamic performance of the power take-off (PTO) driveline directly affects the field reliability of tractors. Firstly, a torsional vibration coupled spatial dynamics model of the power take-off driveline is proposed according to the classical machine driveline dynamics and gear dynamics theory. In the dynamics model, the interactions among the vertical, lateral, and rotational motions of the driveline parts are fully included. The coupling vibrations from internal excitations (such as tooth surface friction, gear time-varying mesh, and engine pulse) and external excitations (such as field machinery load) are also considered. Secondly, the simulation results of the model are obtained using the numerical solving algorithm ode15s. The actual experiment is carried out on the indoor Tractor PTO Test Bench. Then, the model is verified by comparing the test results with the simulation results. Finally, the dynamic characteristics of the whole driveline are revealed under different drive modes, especially strong interactions between the driveline and field machinery in low-speed and heavy-load mode. The gear mesh forces and the root mean square (RMS) values of the acceleration amplitude for the main parts generally decrease gradually with the increase in the PTO rotation speed and the decrease in PTO torque. Furthermore, the model can be applied to reliability assessment, for instance, vibration, damage, and fatigue of off-road vehicles considering gear transmissions, particularly in a field working environment.

1. Introduction

Agricultural tractors, as typical representatives of off-road vehicles (ORVs), differ from road vehicles in that they have a short working season, long centralized operation time, and heavy working load. Therefore, the power performance and reliability of tractors are the key issues of concern. The power take-off driveline is an important part of a wheeled tractor, which provides rotating power for field machines [1]. At present, the power required by many field machines comes from tractors, such as rotary tillers, fertilizer applicators, and seeders. When the tractor works in the field, its power take-off driveline is motivated by internal factors (such as engine excitation, gear time-varying mesh, and nonlinear forces) and external factors (such as the load from working machines and random road roughness) [2]. In addition, strong interactions between the driveline and field machines are incurred by the low-speed and heavy-load characteristics. As a key part of the driveline, the gear transmission system is seriously deteriorated due to strong interactions and generates correlative kinetics problems. When the driveline fails or is abnormal, the working quality and service performance of the tractor will be reduced. Broken shaft or gear teeth cause the power transmission to be interrupted and affect agricultural production [3,4]. Hence, taking the gear transmission system as the object, it is of great significance and necessity for us to study the dynamic behavior of the power take-off driveline.
The dynamics of vehicle transmission systems have been widely studied in the fields of road vehicles [5,6,7], rail vehicles [8,9,10], and engineering machinery [11]. Tang et al. [5] proposed a new simplified dynamic model for studying the vibration characteristics of hybrid electric vehicles and compared it with the previous 16 degrees-of-freedom model. Jiwon et al. [6] estimated the torque transmitted through each clutch of the dual clutch transmission and proposed an original approach for automotive driveline modeling. Crowther and Zhang [7] presented the use of torsional finite elements with a rigid or an elastic tooth mesh for developing dynamic models of various passenger vehicle powertrains to study the effect of low-frequency transients on gear backlash and clutch engagement. Chen et al. [8,9] established the locomotive-track coupled dynamics model, considering the coupling interactions between the vertical vibration of the track structure, the longitudinal and vertical motions of the vehicle, and the gear transmission motion. Wang et al. [10] investigated the dynamic characteristics of the traction transmission system in high-speed train vibration environments, particularly during the acceleration process. Lu et al. [11] analyzed the reasons for the dynamic forces of a mining shearer through the establishment of the dynamic model of the multistage transmission system.
In the above works, the gear transmission system is one of vital concerns in the dynamics model. Many scholars at home and abroad have studied the gear transmission system, and lots of work has been reported. The classical eight degrees-of-freedom model was originally proposed by Bartelmus [12] in 2001. Later, this model was improved by considering gear mesh friction [13], and it was used for dynamic analysis of gears with faults [14,15,16]. Lundvall [17] and Chen [18,19] studied the kinetic performances of a gear transmission system in detail by establishing different types of models, considering various motivations (e.g., dynamic transmission errors, tooth surface friction, time-varying mesh stiffness and tooth backlash). Ryali and Talbot [20] presented a three-dimensional dynamic load distribution model of planetary gear sets and explored the influence of pin position errors and gear tooth deformations on dynamic performance. Liu et al. [21] proposed a hybrid model by coupling the finite element model for the ring and carrier and the lumped-parameter dynamic model for the sun and planets.
Nevertheless, in many previous studies on gear transmission systems, only a few works have considered the dynamics of the power take-off driveline in agricultural tractors. In the actual field operation process, the tractor often breaks down under complex load excitations. Therefore, accurately establishing a dynamic model of the power take-off driveline is essential to study the dynamic behavior of the gear transmission system and to improve the reliability design of tractors.
At present, there are still some problems about the study of the tractor dynamics and reliability as follows:
(1)
The load transfer path of the power take-off driveline in agricultural tractors cannot be accurately described.
(2)
The lack of a dynamics model for the power take-off driveline of agricultural tractors.
(3)
The relationship between the excitation and the response of the power take-off driveline is unclear.
(4)
The key dynamic forces that the sensor cannot measure in the transmission process cannot be accurately obtained by dynamic analysis.
The aim of this paper is to develop a dynamic model that can describe the load transfer characteristics of the PTO driveline. The article is organized as follows: A torsional vibration coupled dynamics model is presented in Section 2.1. The experiment on the Tractor PTO Test Bench is carried out in Section 2.2. Comparisons between numerical simulation and test results are discussed in Section 3.1. The dynamic characteristics under different modes are analyzed detail in Section 3.2. Finally, a conclusion of this study is given in Section 4.

2. Materials and Methods

2.1. Coupled Spatial Dynamics Model of the Power Take-off Driveline

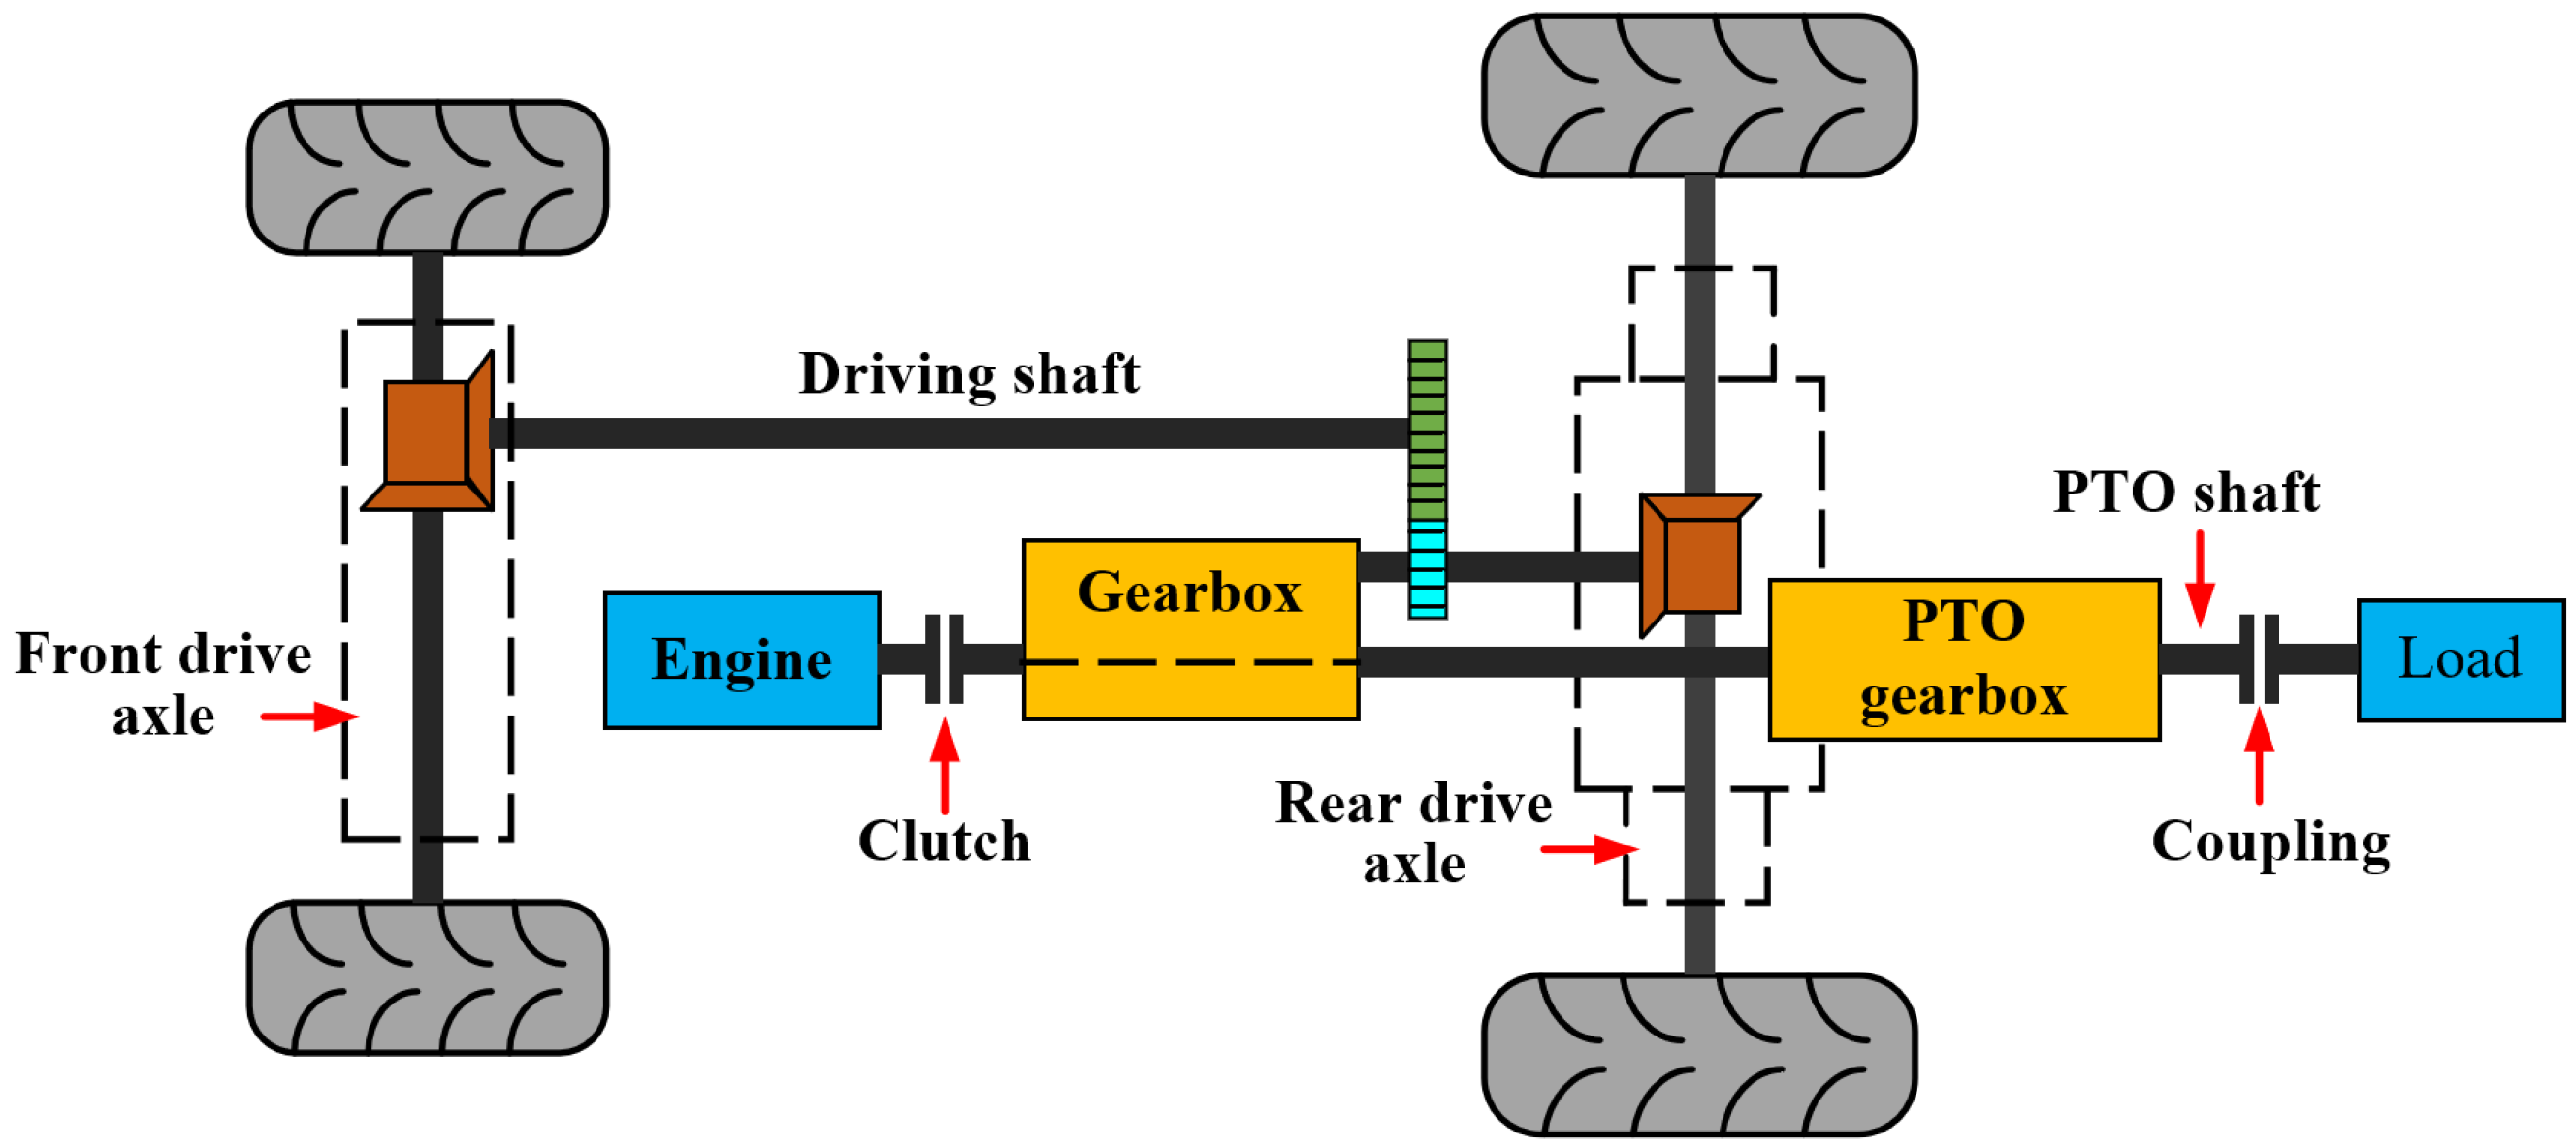
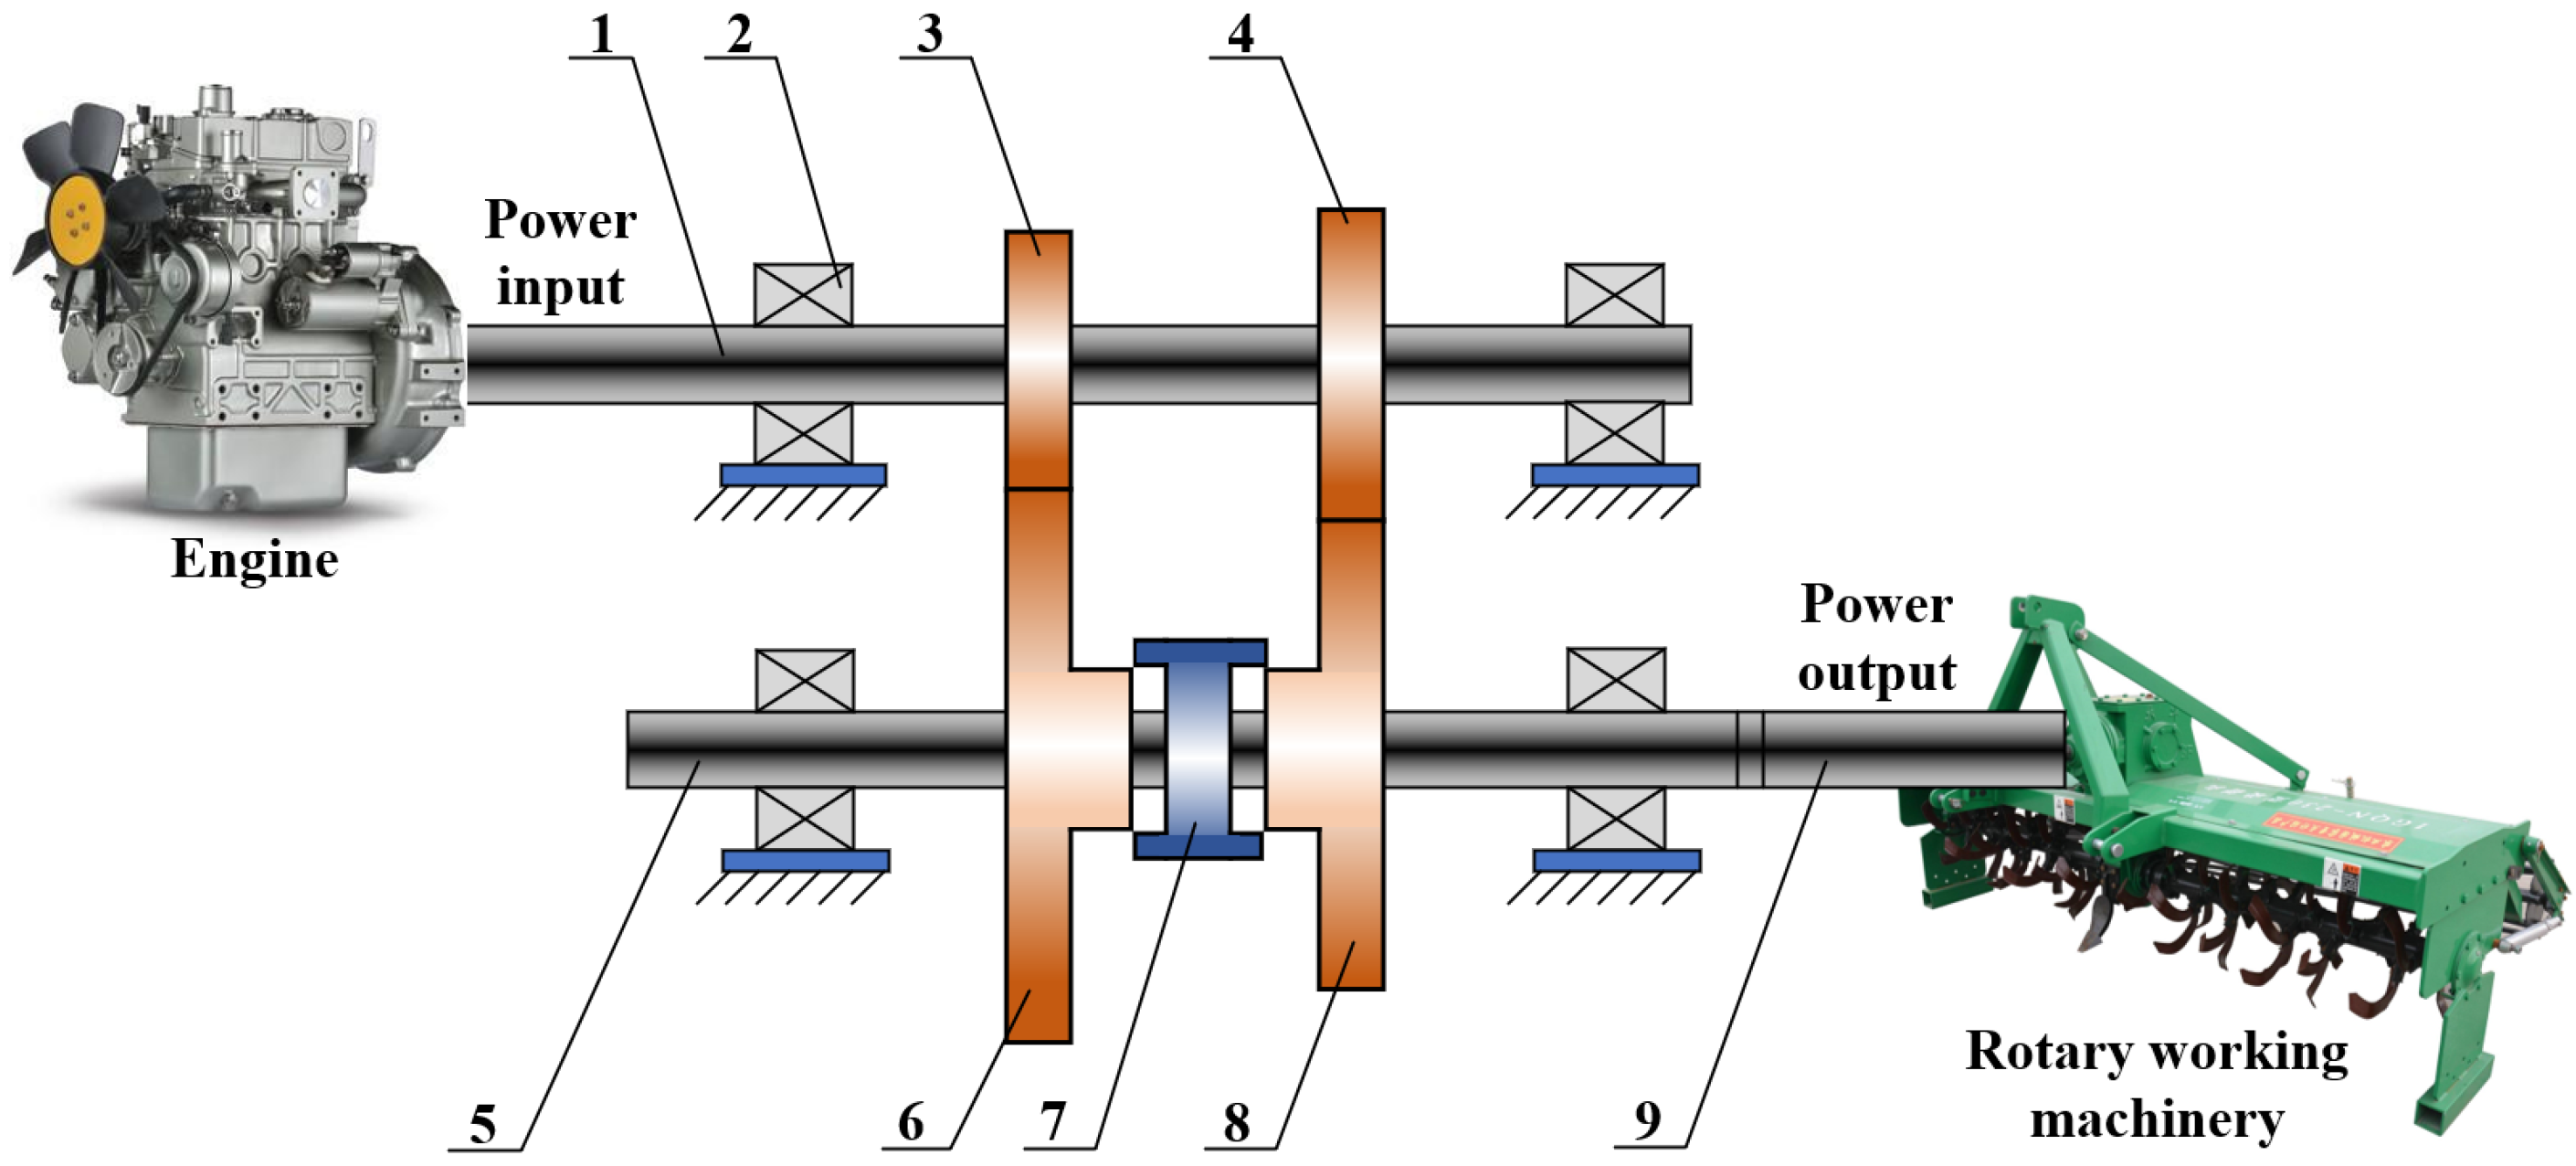
2.1.1. Structure Description

There are two main routes for power distribution of the tractor engine, as shown in Figure 1. On the one hand, power from the engine goes through the clutch, gearbox, and front and rear axles to drive the wheels. On the other hand, power is transferred from the engine to the PTO shaft through the clutch and PTO gearbox. The function of the power take-off driveline is to transfer the torque of the tractor engine to the agricultural machinery and tools. Therefore, the dynamic performances of the driveline play an important role in reflecting the reliability of the tractor.
The output power of the engine decreases speed and changes direction through the power take-off driveline, and its structural composition is shown in Figure 2, including the driving shaft, driving gear, driven gear, inside engaged gear, driven shaft, PTO shaft, etc. When the inside engaged gear moves to the left, the 540 r/min driven gear engages with it and is in the low-speed gear position. When the inside engaged gear moves to the right, the 1000 r/min driven gear engages with it and is in the high-speed gear position. A clutch is arranged between the engine and the PTO gearbox to control the interruption of power. In order to facilitate the use of rotary working machinery such as a rotary tiller, the Chinese national standard stipulates the rotational direction, speed, and size of the PTO shaft, which are in accordance with the international standard. There are three standard speeds of the tractor PTO shaft, which are 540 r/min, 720 r/min and 1000 r/min. Any combination of two types can be achieved by replacing the gear pairs.

2.1.2. Physical Model

Lumped parameter modeling (LPM) and finite element modeling (FEM) are widely used modeling methods in structural dynamics. FEM, which discretizes physical models into finite simple geometrical structures, is commonly used in the elastomer modeling such as plates, shells, and beams. Comparatively, LPM, whose basic idea is to concentrate the mass of components on a group of points, is also known as lumped mass modeling. The advantages of LPM are that the physical concept of the model is clear, and this method is suitable for multi-body dynamics modeling.
Based on the LPM method, a torsional vibration coupled spatial dynamics model of the power take-off driveline was established in this paper. The diagram is shown in Figure 3, and the model is composed of three parts: engine sub-model, load sub-model, and gear transmission sub-model.
The engine sub-model consists of an engine and a pair of clutches. The engine, as the power source, provides the input power to the power take-off driveline through the clutch. In dynamics modeling, the rotational inertia of the engine is mainly considered. The gear transmission sub-model consists of two driving gears, two driven gears, a driving shaft, a driven shaft, an internal engaged gear, and four bearings. Considering that bearings and driving shafts support the whole driveline, the mass of each bearing and each shaft segment is dispersed and concentrated on each gear for the convenience of modeling. The load sub-model includes flexible coupling and a rotary machinery group in which the common coupling in the tractor driveline is the cross universal joint; rotary working machinery usually refers to the rotary tiller. The elastic deformation and damping of the coupling in the process of power transmission are simulated by spring and damping elements.
The dynamics model of the driveline is composed of 7 rigid bodies with a total of 17 degrees of freedom (DOFs). Each gear has 3 DOFs, i.e., vertical (Y), lateral (X), and rotational (θ) motion. The engine and the load only consider the rotational (θ) motion. Table 1 shows the symbols representing the motions of each rigid body in the model.
In the process of simplifying the actual driveline in the present physical model, the complexity of the model depends on the required calculation accuracy, the purpose of dynamic analysis, the contribution of each component in the dynamic response, and other factors. After some simplification, the actual structural system can be analyzed and calculated mathematically. In essence, the present model should be very close to the actual structural system. The main assumptions on which the dynamics model is based are as follows:
(1)
The interaction between the driveline and the connection structure is not considered, so the resonance of the gearbox body is ignored.
(2)
The mass of the driving shafts and bearings are concentrated in the gears.
(3)
The transmission error of gear teeth is ignored in the process of gear transmission.
(4)
The gear pairs in idle position are subjected to very little resistance.

2.1.3. Mathematical Model

In this model, the power take-off driveline has two gears, low-speed gear and high-speed gear. The higher the speed gear of the PTO shaft, the heavier the working load of the tractor. The dynamic performances of the driveline under heavy loads are the focus of research. This paper took 1000 r/min gear as an example and established the differential equation of the dynamics model according to the classical model proposed by Bartelmus [12].
Figure 4 shows the three-dimensional dynamics model of gear transmission with eleven DOFs, which driven by engine moment Tin and loaded with additional moment Tout. The model consists of engine rotational inertia Je; gear rotational inertia J2, J4, J5; driven machine inertia JL; gear mass m2, m4, m5; gear stiffness force Fk24 and damping force Fc24; gear friction force Ff24; internal moment in the driving shaft M1, M1t; internal moment in the driven shaft M2, M2t; internal stiffness and damping force of left and right supports (Fq, Fqt; Fm, Fmt); internal stiffness and damping force of upper and lower supports (Fp, Fpt; Fn, Fnt).
The dynamics model contains three basic mechanical elements: the elastic element, the damping element, and the inertial element. In addition to the active force, the force on the object can be expressed by the elastic force, damping force, and inertia force. These main forces are expressed as follows.
(1) The internal moments in the clutch, coupling, and shafts
The internal moments in the driving and driven shafts can be written as
{ M 1 = k c l ( θ e θ 2 ) M 1 t = c c l ( θ ˙ e θ ˙ 2 ) M 2 = k c o ( θ 4 θ L ) M 2 t = c c o ( θ ˙ 4 θ ˙ L )
where θ, θ ˙ , θ ¨ are angular displacement, velocity, and acceleration, respectively; M1, M2 are the moments of shafts stiffness, and M1t, M2t are the damping moments of clutch and coupling; kcl, kco are the torsional stiffness of the driving and driven shafts, and ccl, cco are the torsional damping of clutch and coupling.
(2) The gear mesh forces
The power take-off driveline transmits forces and motions through gear meshing. During the meshing progress, the teeth’s deformation in the gear pairs can be modeled as a time-varying spring with damping. The dynamic mesh force of gear 2 and gear 4 can be expressed as
F m 24 = F k 24 + F c 24
where Fk24 is the elastic force, and Fc24 is the viscous force between gear teeth meshing. Based on the elastic theory, the elastic force and viscous force can be calculated as
{ F k 24 = k 24 ( x ¯ 2 x ¯ 4 ) F c 24 = c 24 ( x ¯ ˙ 2 x ¯ ˙ 4 )
where x ¯ 2 and x ¯ 4 are the displacements of the respective meshing points of gear 2 and gear 4 relative to the system along the X direction; k24 and c24 are the mesh comprehensive stiffness and damping of gear pair, respectively. The displacements of gear 2 and gear 4 at the mesh point along the X direction are defined as
{ x ¯ 2 = x 2 + r 2 θ 2 x ¯ 4 = x 4 r 4 θ 4
Then, the dynamic mesh force of gear 2 and gear 4 can be expressed as
F m 24 = k 24 ( r 2 θ 2 r 4 θ 4 + x 2 x 4 ) + c 24 ( r 2 θ ˙ 2 r 4 θ ˙ 4 + x ˙ 2 x ˙ 4 )
where r2 and r4 are the base circle radius of gear 2 and gear 4, respectively. The rotational (θ) and lateral (X) DOFs are coupled, and this phenomenon is called elastic coupling and viscous coupling. It is caused by the intermeshing of gear teeth, which makes the torsional and lateral vibration of gears interact.
(3) The gear time-varying mesh stiffness and damping
The gear time-varying mesh stiffness is mainly related to the elastic deformation of a single tooth, the comprehensive elastic deformation of a single pair of teeth, and the gear coincidence degree. According to the gear mesh damping model reported in Amabili and Rivola [22], the mesh comprehensive damping of gear teeth is calculated as
c 24 = 2 ξ m 2 m 4 m 2 + m 4 k 24
where ξ is the mesh damping ratio of gear teeth. In most situations, the gear mesh damping ratio ranges from 0.01 to 0.1.
(4) The tooth surface friction
When considering the effect of tooth friction, the translational DOF of the gear in the direction perpendicular to the meshing line must also be considered. The tooth surface friction can be expressed as
F f = λ f F m
where λ is equivalent friction coefficient; f is the direction coefficient of friction, which is “+1” when Ff is in the positive direction of y and “−1” when Ff is in the opposite direction.
(5) kinematic equation
D’Alembert’s principle comes up with the concept of inertial force (FQ = −ma), which transforms the establishment of differential equations in dynamic problems into the establishment of “equilibrium equations” in statics problems. In nature, it is still a method of establishing differential equations using Newton’s second law. According to D’Alembert’s principle, the equations of motion for the above multi-DOF dynamics system were established.
  • The motion equations of the engine and load:
{ J e θ ¨ e = T i n M 1 M 1 t J L θ ¨ L = M 2 + M 2 t T o u t
  • The motion equations of the driving and driven gears:
Rotational motion:
{ J 2 θ ¨ 2 = M 1 + M 1 t r 2 ( F k 24 + F c 24 ) J 45 θ ¨ 4 = r 4 ( F k 24 + F c 24 ) M 2 M 2 t
Lateral motion:
{ m 2 x ¨ 2 = ( F k 24 + F c 24 ) F q F q t ( m 4 + m 5 ) x ¨ 4 = ( F k 24 + F c 24 ) F m F m t
Vertical motion:
{ m 2 y ¨ 2 = F f 24 F p F p t ( m 4 + m 5 ) y ¨ 4 = F f 24 F n F n t
According to Equations (1)–(7), the differential Equations (8)–(11) can be expanded. The motion equations of the whole dynamics system are as follows:
{ J e θ ¨ e + c c l ( θ ˙ e θ ˙ 2 ) + k c l ( θ e θ 2 ) = T i n J 2 θ ¨ 2 + c c l ( θ ˙ 2 θ ˙ e ) + k c l ( θ 2 θ e ) = r 2 ( F k 24 + F c 24 ) J 45 θ ¨ 4 + c c o ( θ ˙ 4 θ ˙ L ) + k c o ( θ 4 θ L ) = r 4 ( F k 24 + F c 24 ) J L θ ¨ L + c c o ( θ ˙ L θ ˙ 4 ) + k c o ( θ L θ 4 ) = T o u t m 2 x ¨ 2 + c q x ˙ 2 + k q x 2 = ( F k 24 + F c 24 ) m 2 y ¨ 2 + c p y ˙ 2 + k p y 2 = F f 24 ( m 4 + m 5 ) x ¨ 4 + c m x ˙ 4 + k m x 4 = ( F k 24 + F c 24 ) ( m 4 + m 5 ) y ¨ 4 + c n y ˙ 4 + k n y 4 = F f 24

2.2. Dynamic Simulations and Experimental Validation

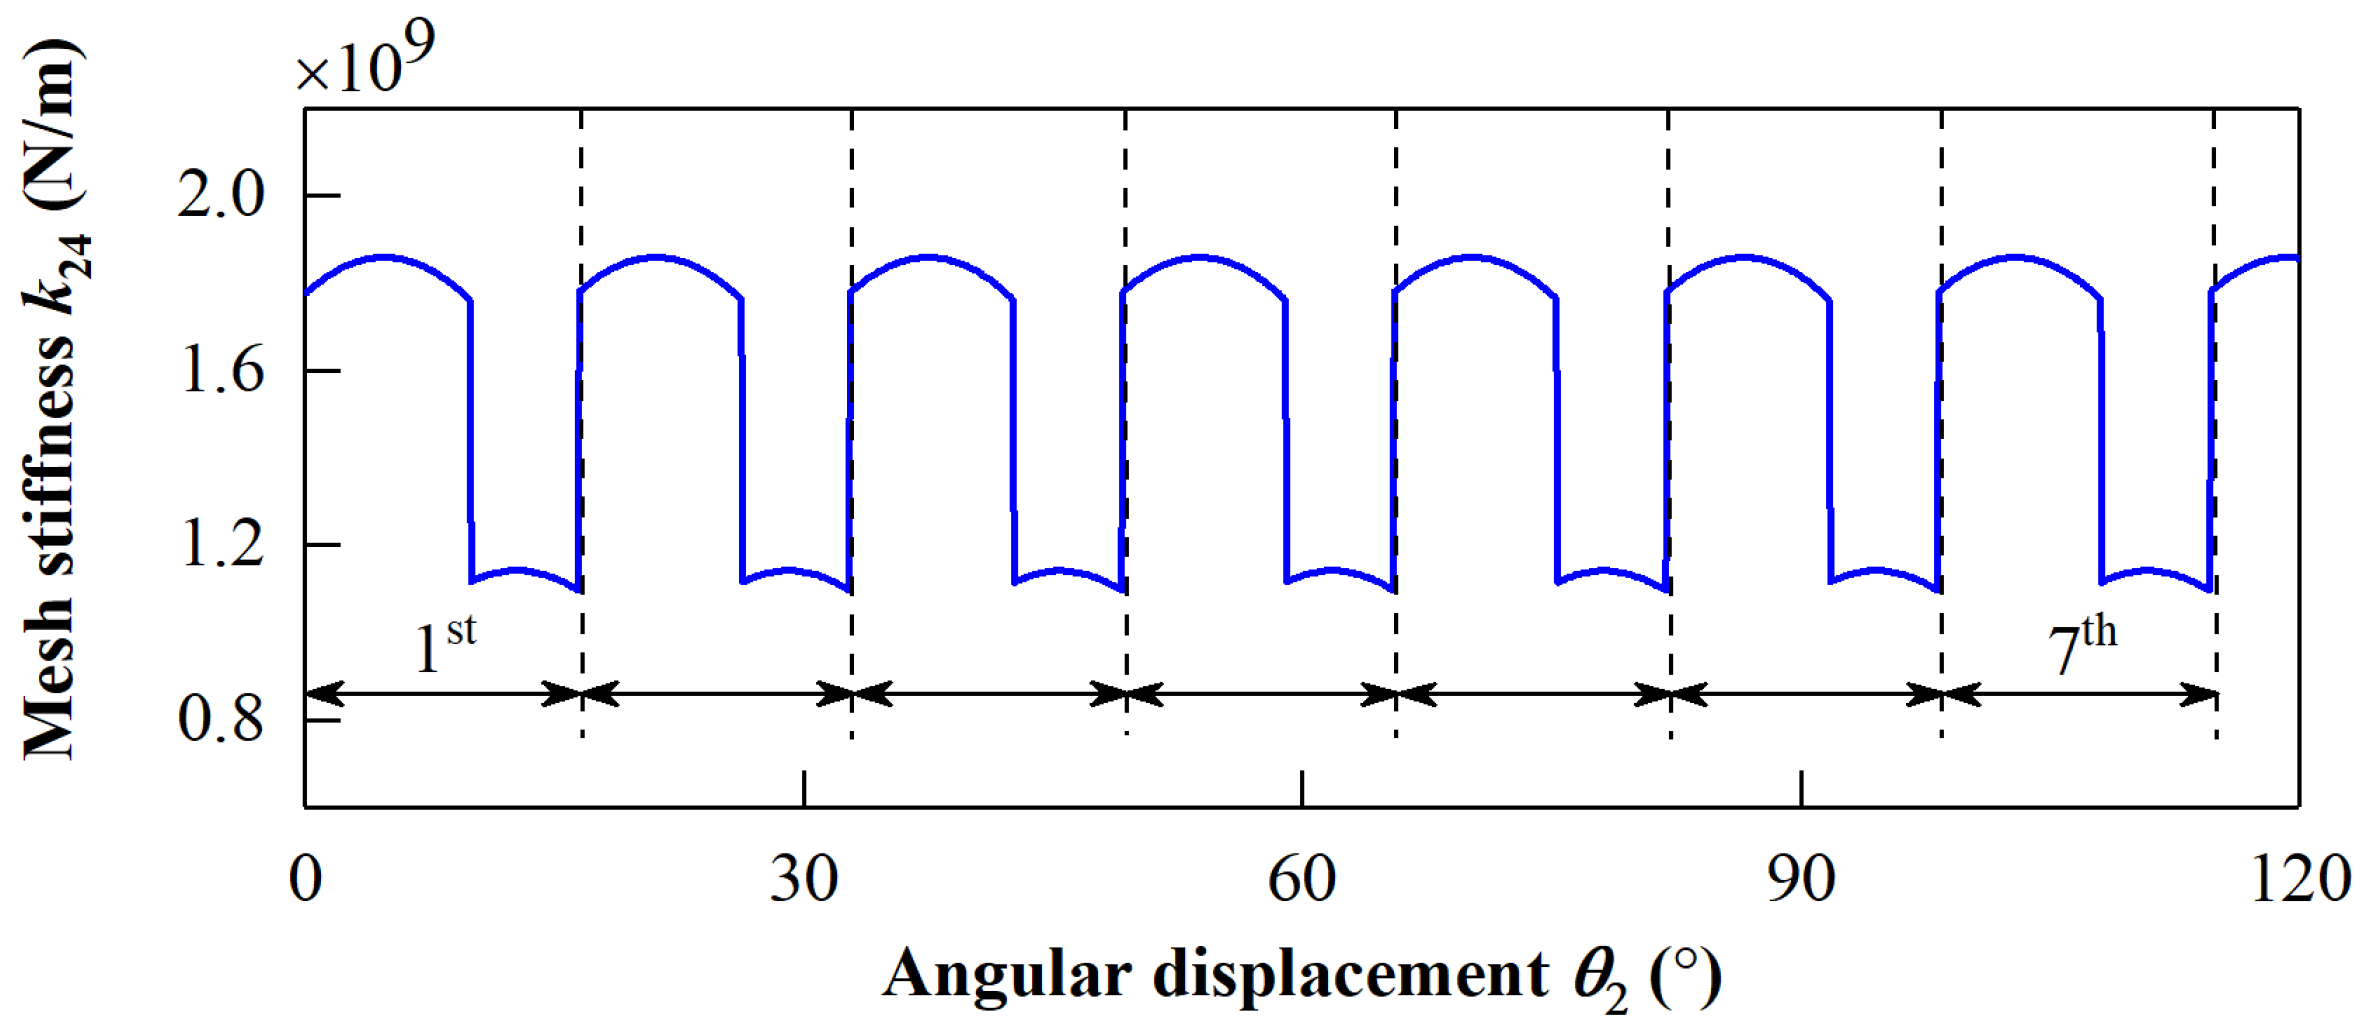
2.2.1. Numerical Simulation

In order to validate the proposed dynamics model and study dynamics characteristics under different driving modes, the vibration signals were simulated for the power take-off driveline. According to the actual structure and model simplification, the physical parameters of the power take-off driveline in the simulation are given in Table 2.
Based on the method mentioned in the Ref. [23], the results of mesh comprehensive stiffness are shown in Figure 5. As described in [22], the gear mesh damping is assumed to be directly proportional to the mesh stiffness. The mesh damping ratio of gear teeth is selected to be 0.07. A constant torque of 1460 N∙m is generated by the load, and the speed of the PTO shaft is constrained to be 1000 r/min. In the process of numerical simulation, the actual torque of the engine (namely, the input torque of the driveline) can be calculated from the PTO torque (namely, the load torque) by referring to the transmission ratio. Correspondingly, the torque of the engine is 784 N∙m and the theoretical rotation speed is 1864 r/min. The numerical results of the dynamics model were obtained using the ode15s algorithm with a sampling frequency of 6000 Hz.

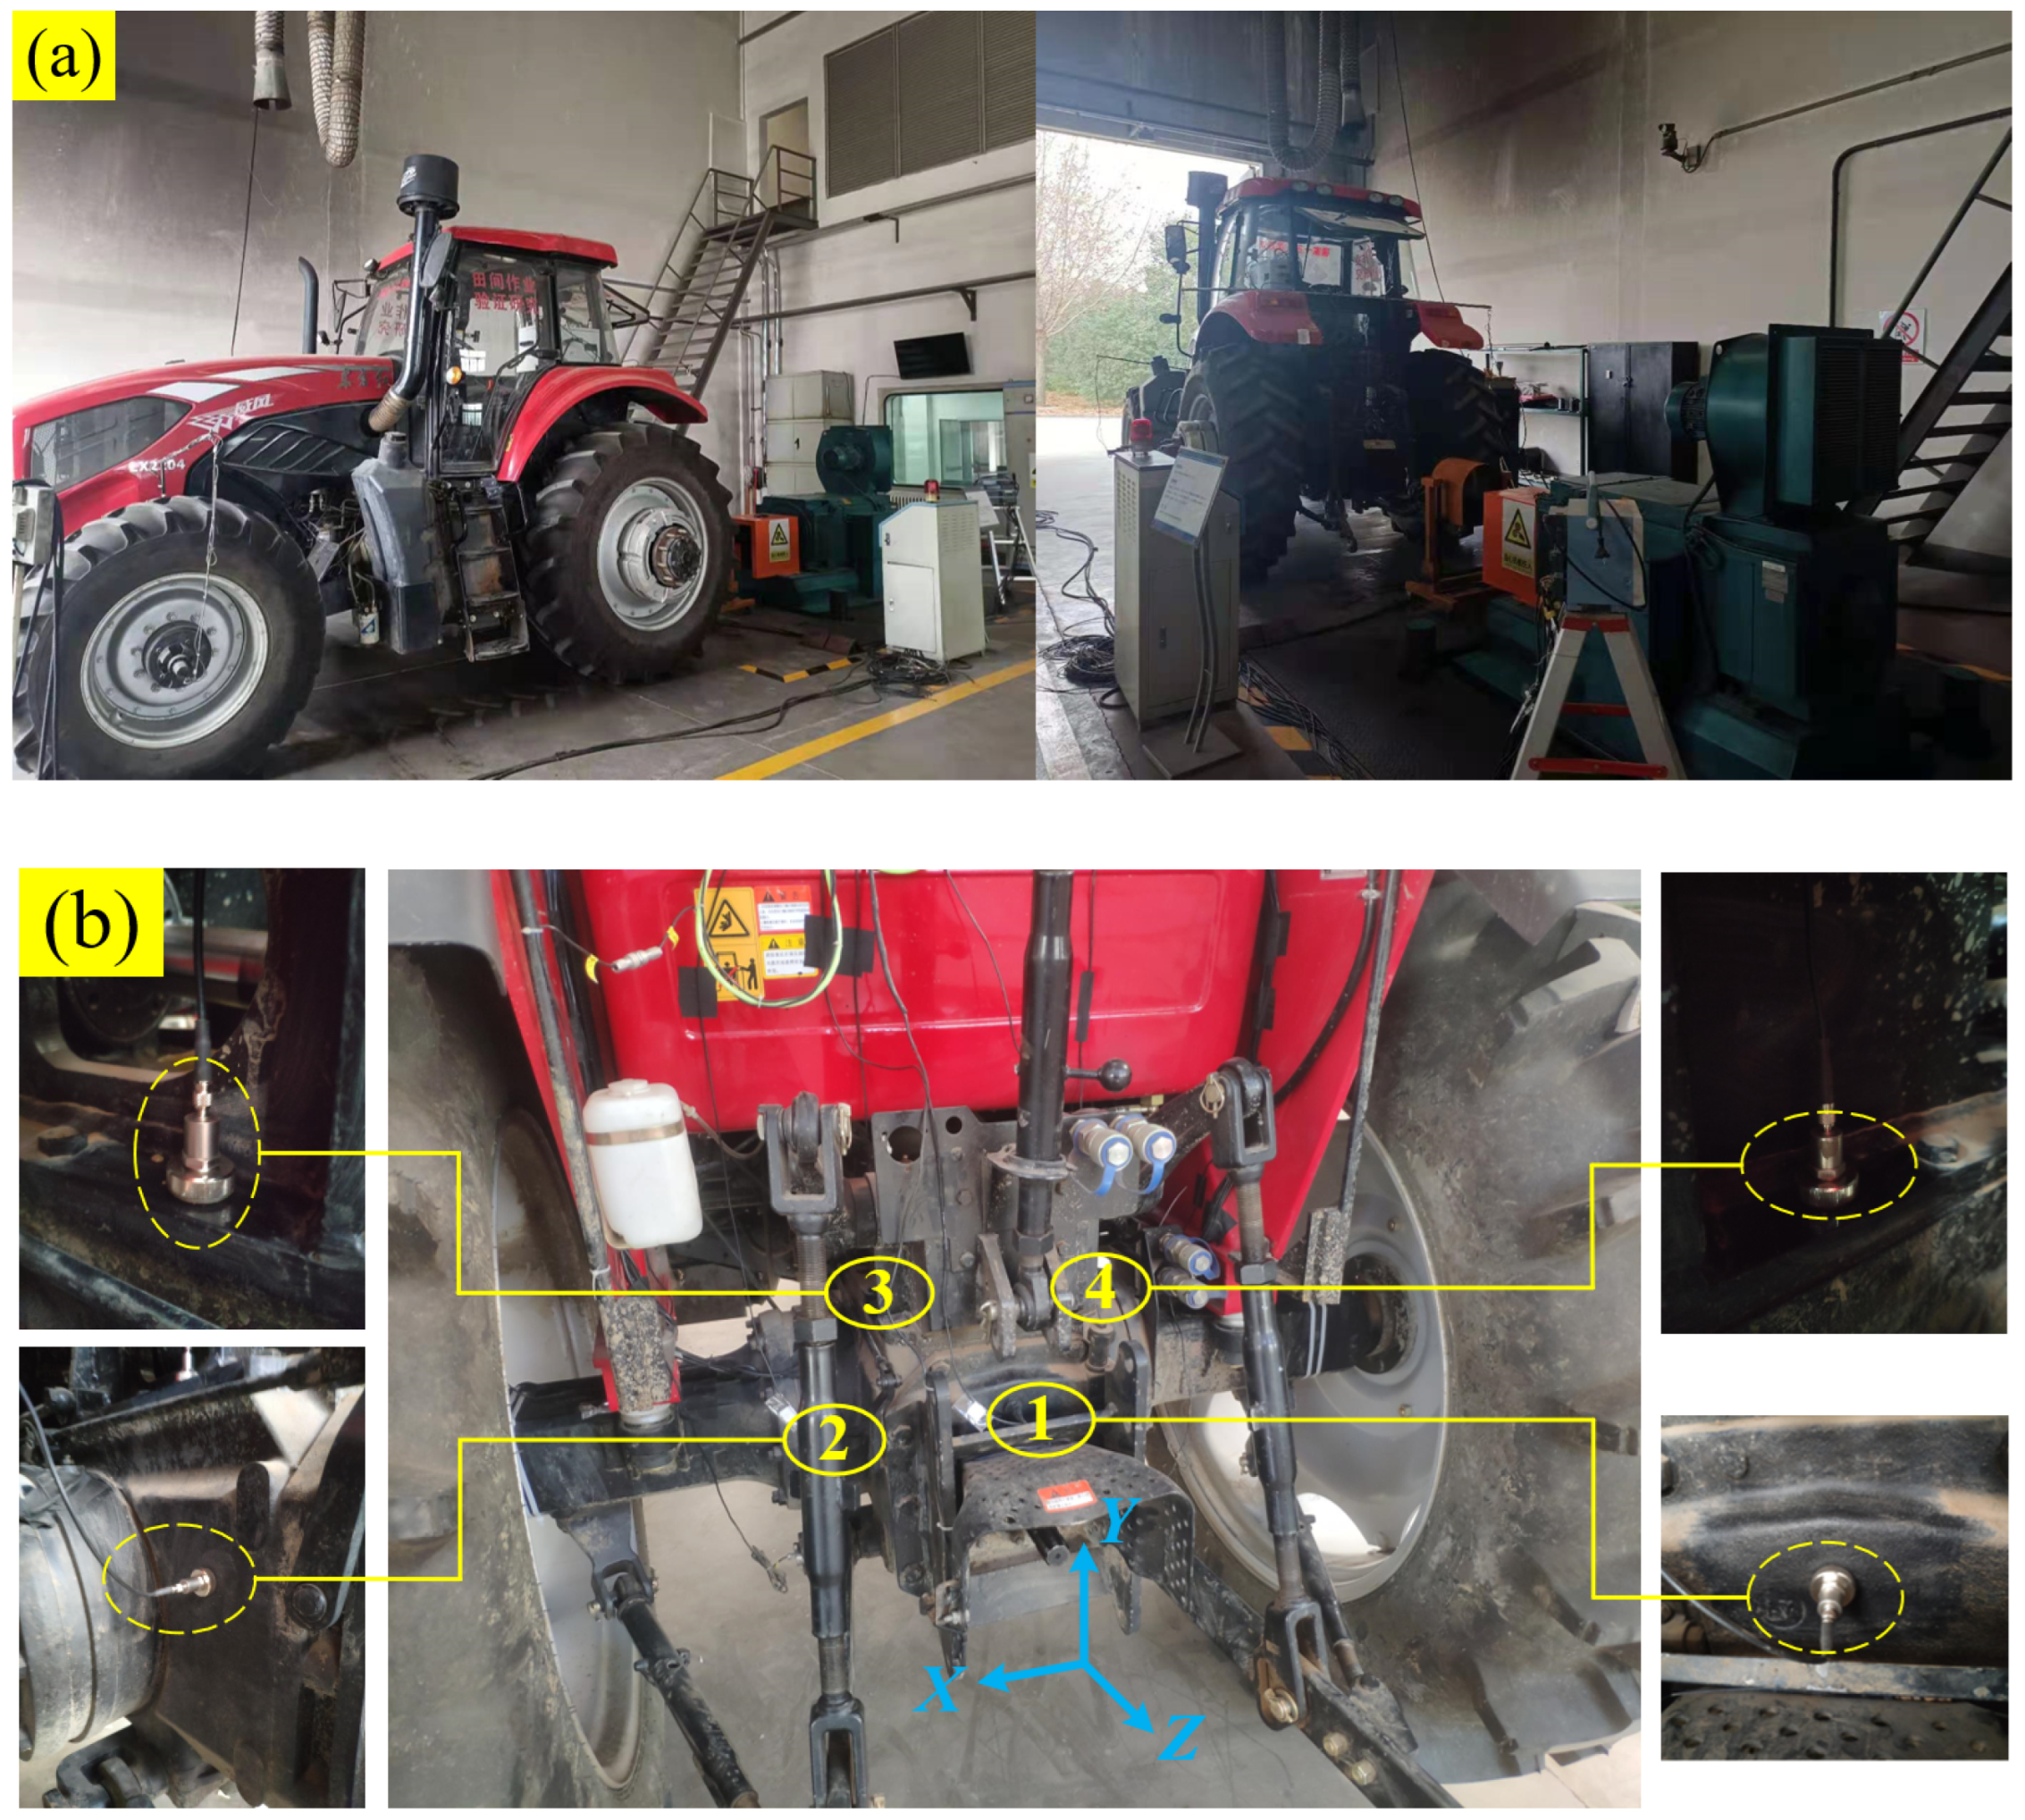
2.2.2. Bench Experimental

The tested tractor is one of the most widely used LX series four-wheel drive tractor in China, which has an engine with a rated power of 162 kW and rated speed of 2200 r/min. The experimental test was carried out on the indoor Tractor PTO Test Bench located in the State Key Laboratory of Power System of Tractor in Luoyang, Henan Province, as shown in Figure 6a. The Tractor PTO Test Bench is mainly composed of a loading motor, a torque sensor, a speed sensor, and the position adjuster. To verify the proposed dynamics model, the input parameters of the system in the actual test and simulation were consistent. The vibration acceleration signals of the power take-off driveline under a load condition were collected. The vibration sensors for the tractor test were arranged on the top, left, and shaft end of the gearbox housing to collect vibration acceleration signals of the whole driveline in the lateral (X), vertical (Y), and longitudinal (Z) directions, respectively. Figure 6b shows the layout of the acceleration sensors on the driveline parts. The sampling frequency in the vibration test was set as 6000 Hz, which is consistent with the numerical simulation setting.

3. Results and Discussion

3.1. Comparisons of Simulated and Tested Results

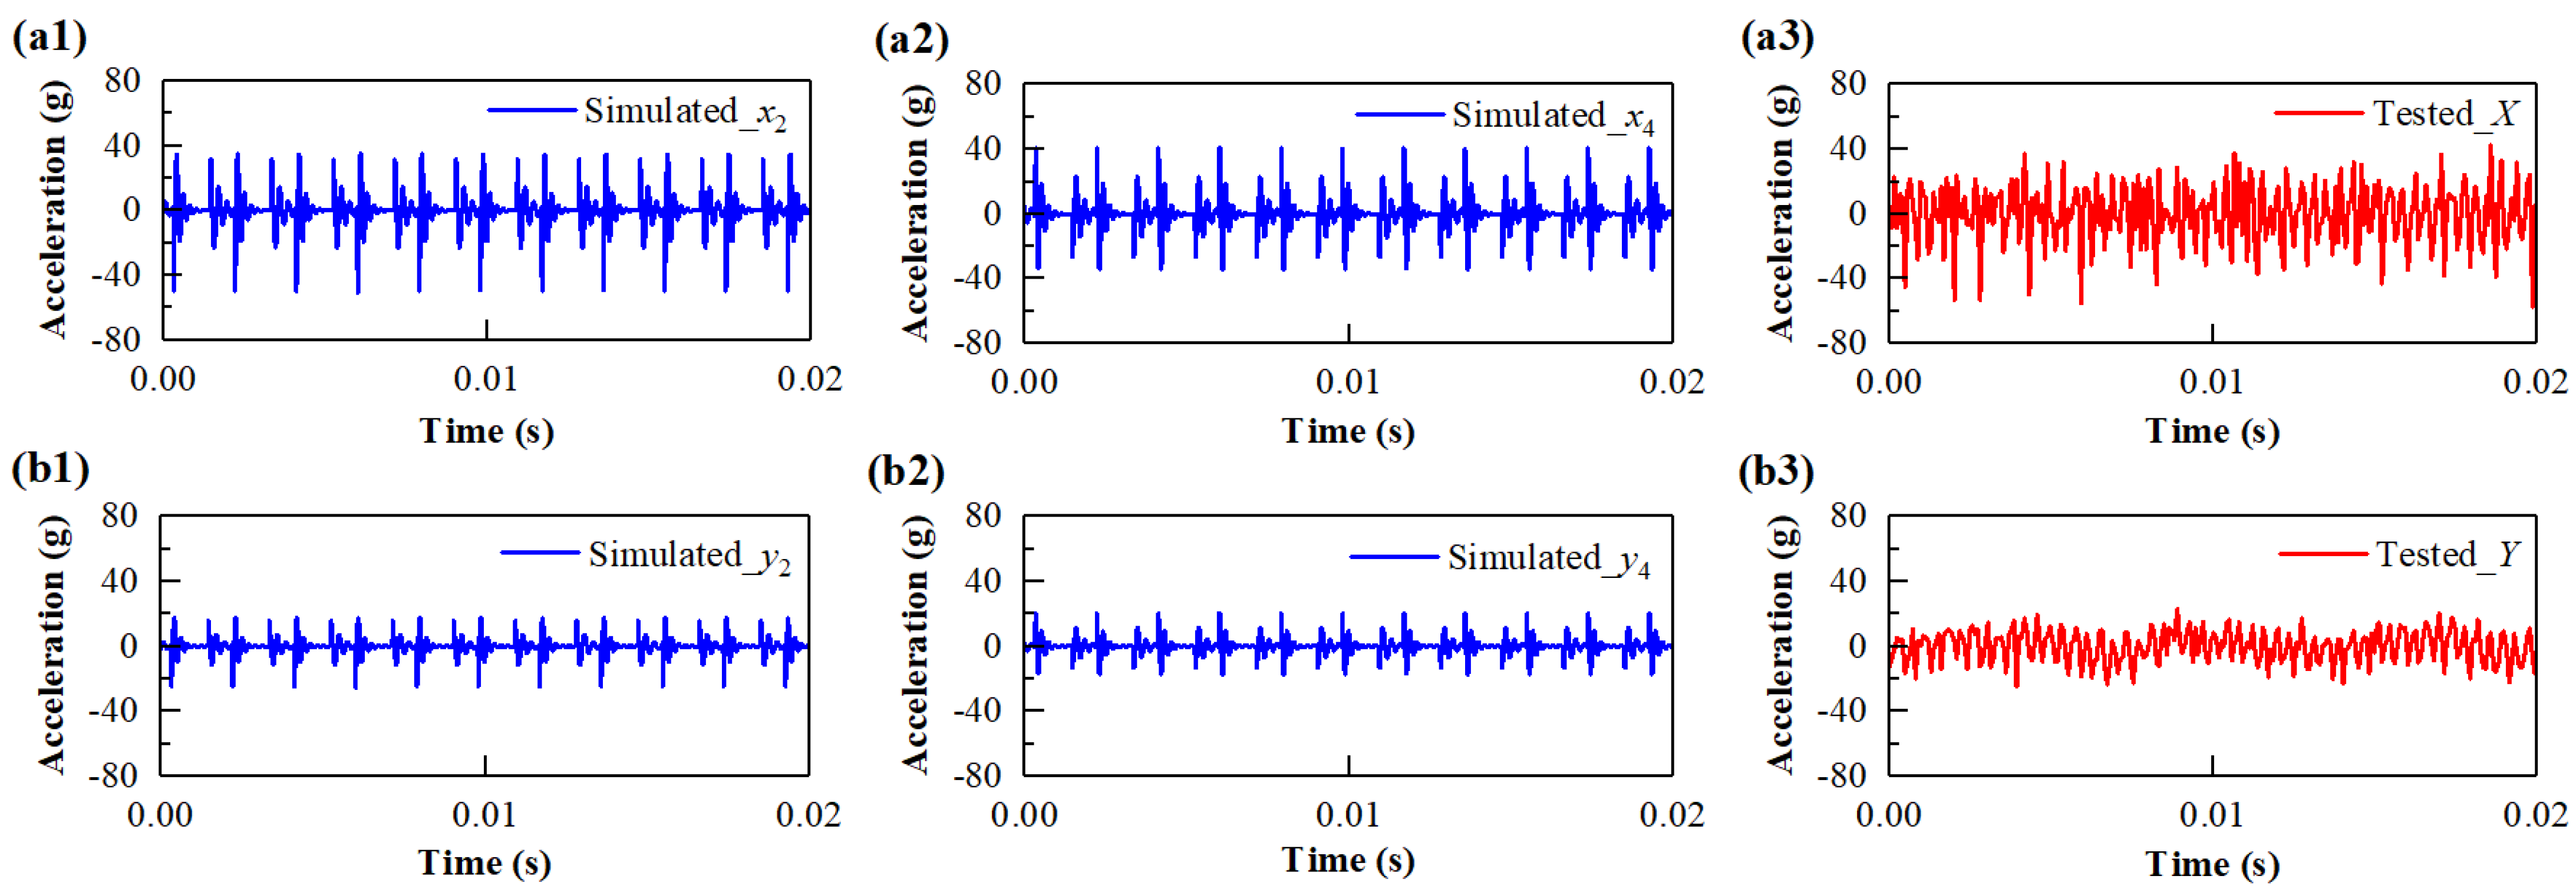
3.1.1. Time Domain Response Analysis

As shown in Figure 7, the tested results of the key components of the driveline were compared with the simulated results in the time domain. Figure 7(a1,a2,b1,b2) shows the lateral and vertical simulation results of vibration signals for the 1000 r/min driving gear and the 1000 r/min driven gear in the time domain. It can be seen that the simulated lateral acceleration amplitudes fluctuate generally between −40 g (g = 9.8 m/s2) and 40 g, the maximum value of simulated signals in the lateral direction does not exceed 40 g, and the minimum value is not lower than −50 g. While the vertical signals are in the range of −25 g and 20 g, the maximum value of the simulated vertical signals is not more than 20 g, and the minimum value is not lower than −25 g. Obviously, the amplitude of the lateral vibration responses is much larger than that of the vertical vibration responses. As can be seen from Equations (10) and (11), the lateral motions are mainly affected by gear mesh forces, while the vertical motions are mainly affected by tooth surface frictions in the process of meshing. However, the mesh forces of the gear teeth are much larger than the frictions. Hence, the lateral vibration of the gear pair is also caused by nonlinear excitation, namely, gear time-varying mesh stiffness and damping.
The tested lateral and vertical vibration responses of the driveline are shown in Figure 7(a3,b3). As the actual vibration signals of the driving gear, the driven gear, and inside engaged gear cannot be obtained directly, the acceleration sensors are arranged on the gearbox housing. It can be seen from the tested data that the lateral vibration amplitudes of the whole driveline mainly vary between −50 g and 40 g, the maximum value of the tested data in the lateral direction is not more than 45 g, and the minimum value is not lower than −55 g. The tested vertical signal amplitudes of the system mainly vary in the range of −20 g and 20 g. Compared with the lateral vibration signals, the tested data in the vertical direction have a smaller and concentrated amplitude range, and this phenomenon can be observed in both the tested results and simulated results. However, in both the lateral and vertical directions, the tested data are generally lower than the simulation results mentioned in Figure 7(a1,a2,b1,b2). This may be caused by neglecting the vibration transmission of the gearbox. The vibration signals are gradually weakened after transmission through the shaft, the bearing, and gearbox housing. The standard deviations (Stds) and maximum amplitudes of the vibration acceleration are used to compare the simulated and test data, which are given in Table 3.

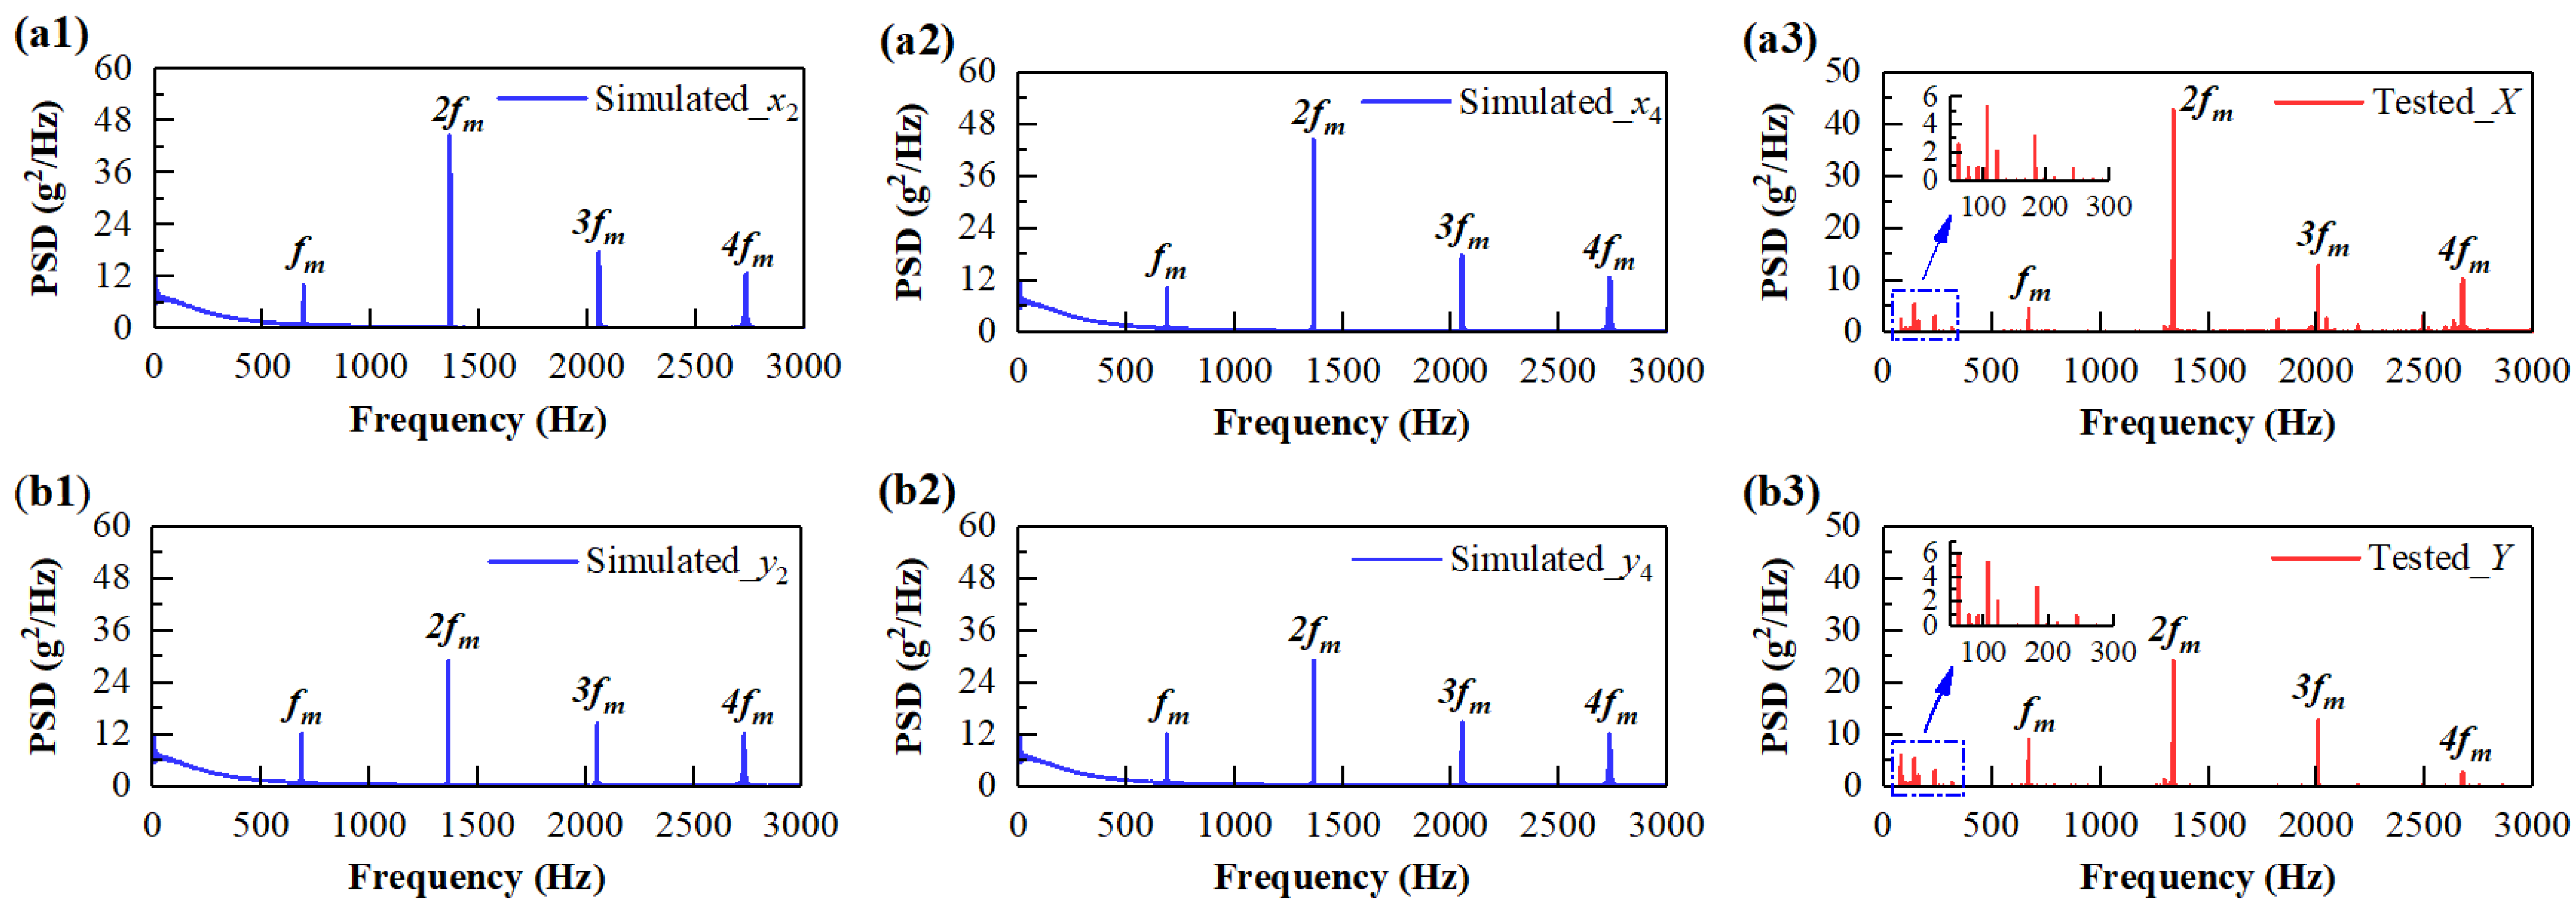
3.1.2. Frequency Domain Response Analysis

For further evaluation of the proposed driveline model, the vibration acceleration signals collected from the actual test and simulation were analyzed and compared in the aspect of the frequency domain distribution. To a certain extent, the vibration signal of the driveline was mainly affected by the time-varying mesh factor and the engine, which is also the main contribution of this work to kinetics modeling. All vibration signals steadily varied in the time domain, as show in Section 3.1.1. Thus, spectrum analysis methods, such as power spectral density (PSD), can be applied to transform the time history of vibration accelerations into the frequency domain. The spectrum results are represented in Figure 8.
In Figure 8(a1,a2,b1,b2), the frequency domain distribution results for the 1000 r/min driving gear and the 1000 r/min driven gear are shown in the simulation. It can be seen that the lateral frequency distributions are basically the same as the vertical frequency distributions. The rotational frequencies of the 1000 r/min driving and driven gears are constant at 31.06 Hz (fr2 = n2/60) and 16.67 Hz (fr4 = n4/60), respectively. For the results of the driving and driven gears, both the lateral and vertical vibration accelerations reveal the fundamental gear mesh frequency fm (fm = z2fr2 = z4fr4 = 683.33 Hz) and frequency multiplication (nfm).
Similarly, the frequency distribution results of the vibration signals in the actual test are also displayed in Figure 8(a3,b3), which are similar to the simulated results. Regardless of the lateral or vertical direction, the tested frequency components of the driveline are slightly smaller than the simulated ones. These result errors may be caused by the transmission error and coupling effect of the vibration frequency. The phenomenon that the lateral and vertical spectrums are basically the same is also verified by the test results. More specifically, not only in the high frequency range, but also in the low frequency range (50–300 Hz), the frequency components of the lateral vibration also appear in the vertical vibration.
Table 4 shows the frequency comparison between simulation and test values. Regardless of the lateral or vertical direction, the error is not more than 5.12%. In general, the frequency spectrum characteristics of the test results are basically similar to those of the simulated results. Since differences between the theoretical model and the actual system seem inevitable, some acceptable differences can also be observed.
In summary, regardless of time domain analysis or frequency domain analysis, it can be concluded that the simulated results of the proposed model are basically consistent with the actual test results. It is believed that these results can verify the established torsional vibration coupled model of the tractor driveline.

3.2. Dynamic Responses of Gear Transmission System

Compared with traditional mechanical model of the power take-off driveline, the dynamic model established in this paper takes into account the spatial coupled effect, which involves the dynamic influence of the gear transmission system. The dynamic responses of the gear transmission system can be acquired by the established model, and the purpose is to reveal the dynamic influence under different drive modes.
The dynamic responses of some typical operating modes shown in Table 5 (including the standard rotation speed 540 & 1000 r/min of the PTO in Group 6 and the rated rotation speed of engine 2200 r/min in Group 12) are extracted and displayed for explanation and analysis.

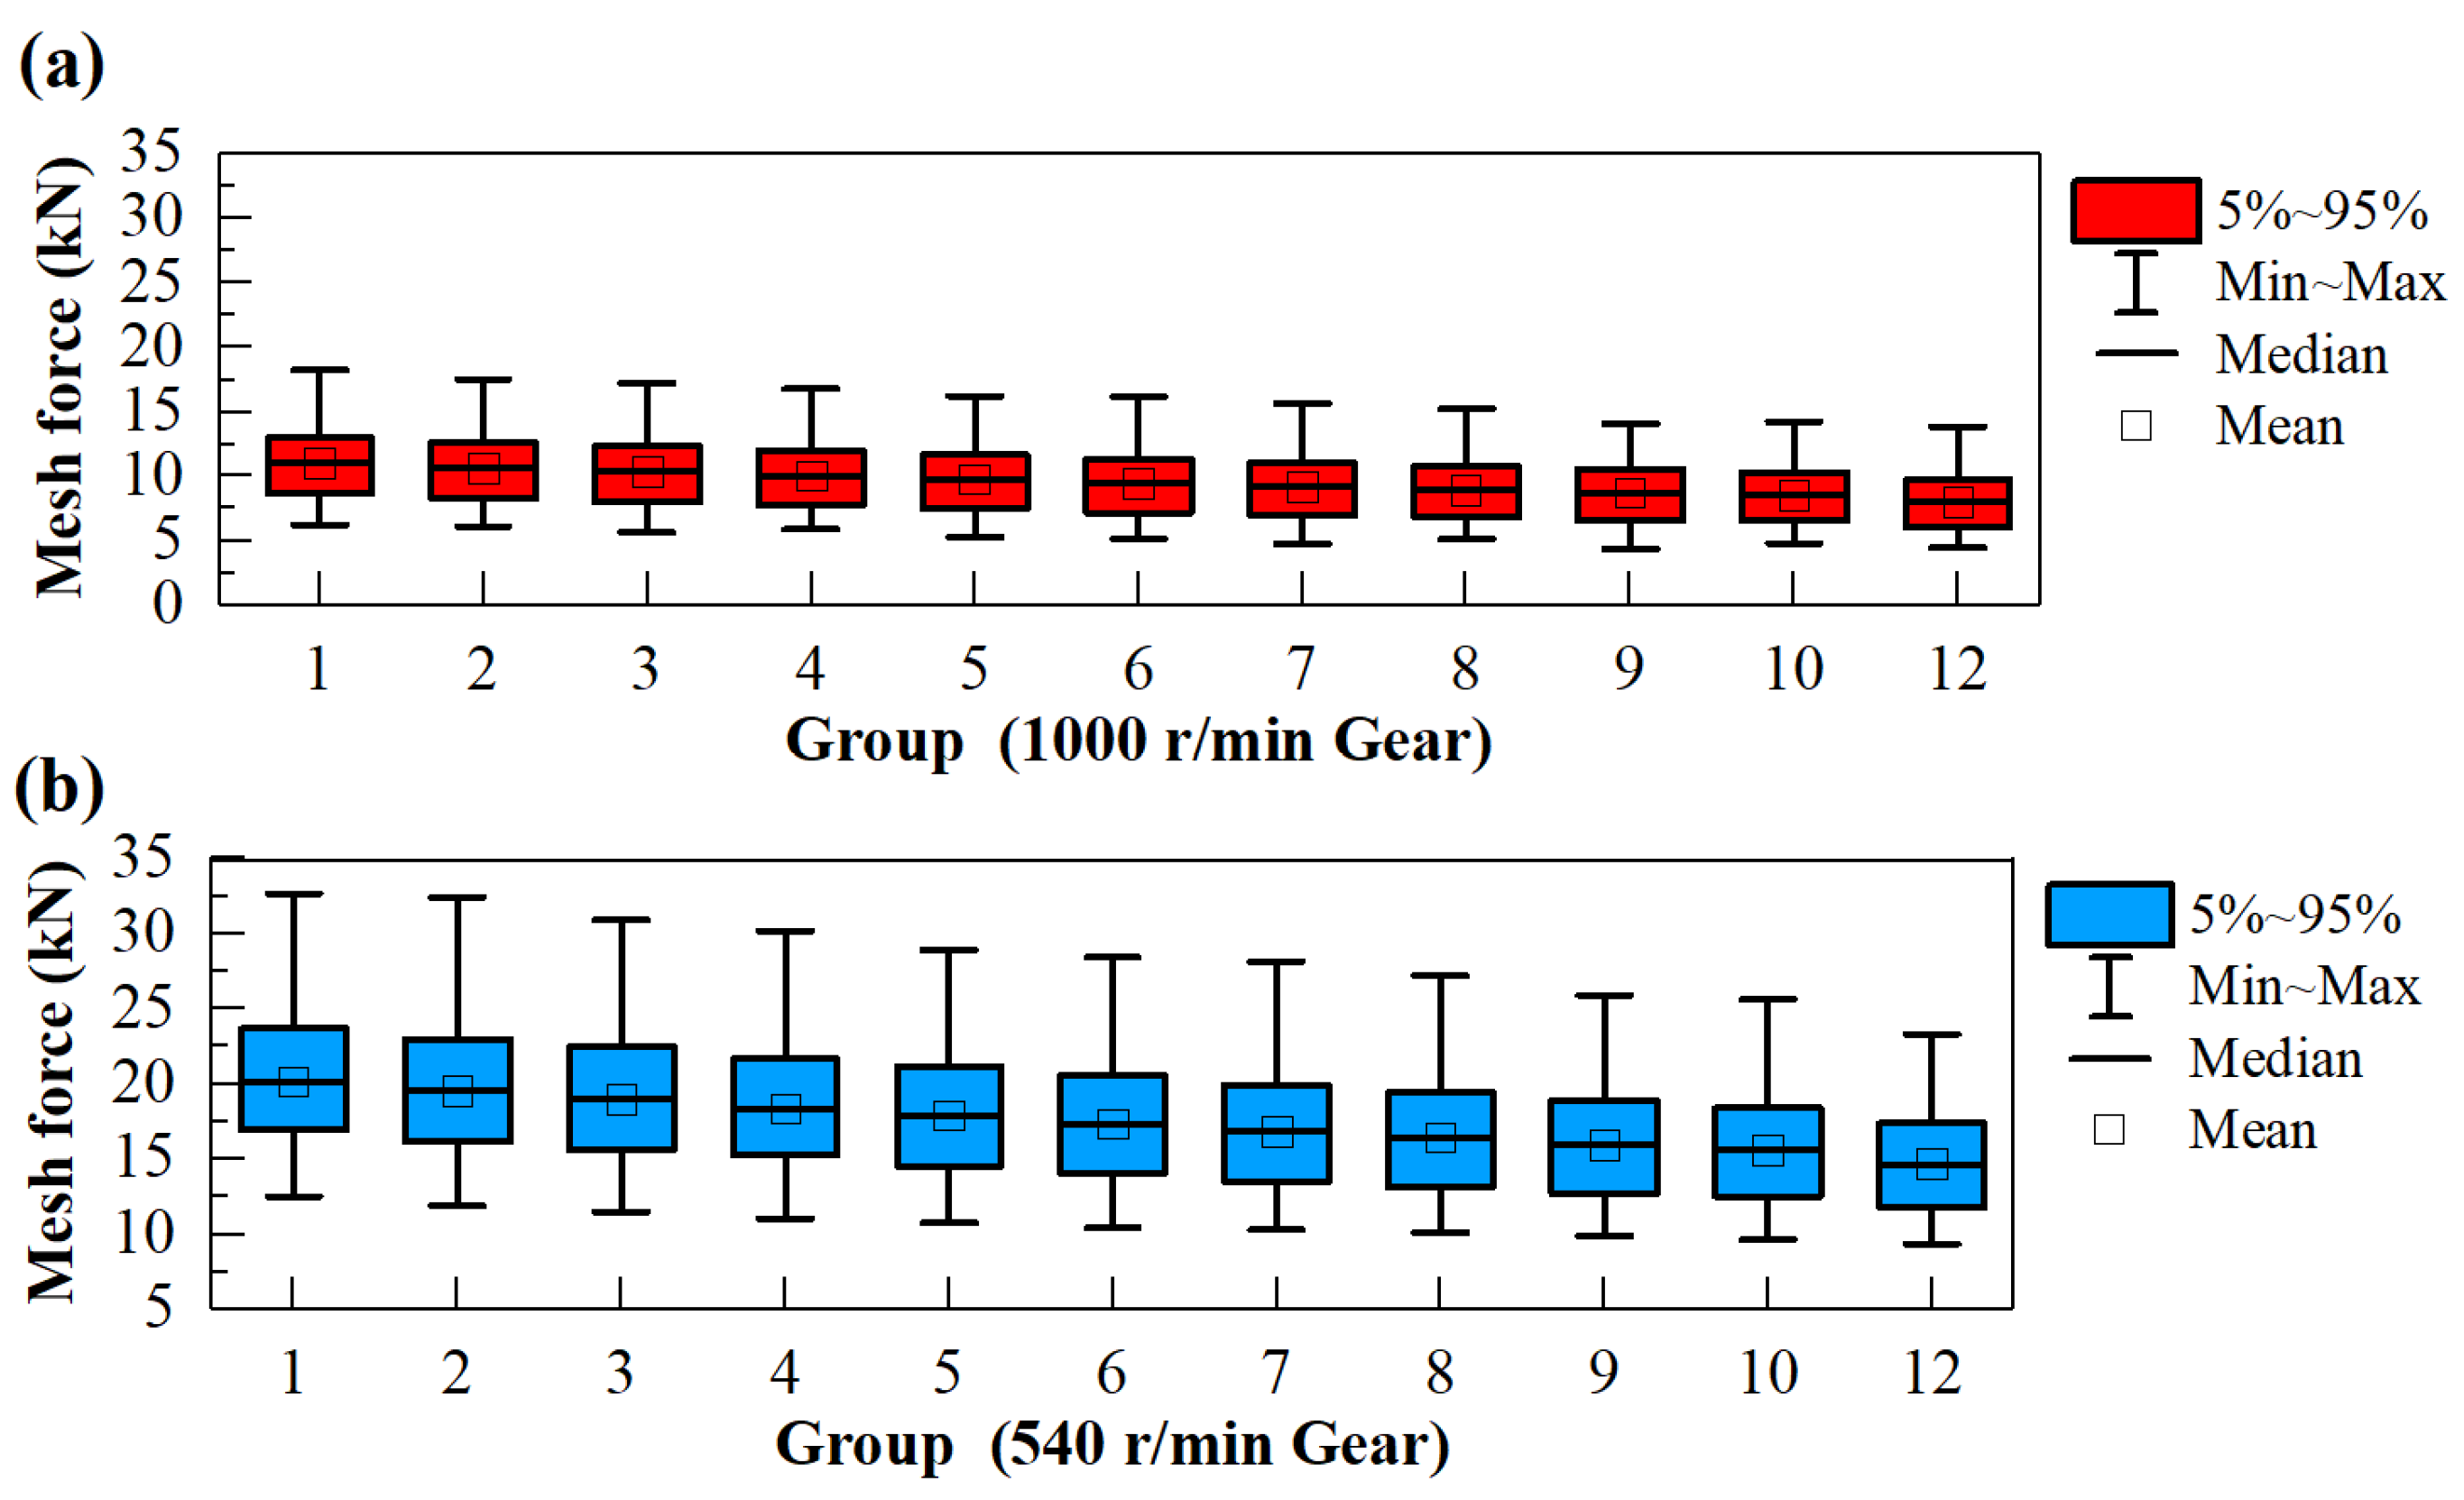
3.2.1. Mesh Forces under Different Drive Modes

The time histories of the gear dynamic mesh force between the 1000 (or 540) r/min driving gear and the 1000 (or 540) r/min driven gear are shown in Figure 9. It can be clearly seen that the gear mesh force Fm13 under the 540 r/min Gear position is greater than the mesh force Fm24 under the 1000 r/min Gear position, and the force Fm13 fluctuates even more strongly. This is because when the 1000 r/min Gear and 540 r/min Gear transmit the same amount of power, the latter has a lower rotation speed and higher torque. Hence, more attention should be paid to the reliability failure of meshing gear in the whole transmission process, especially in the PTO low-speed operation mode.
In Figure 10, the statistical parameters of the gear mesh force under different drive modes are compared through dynamics simulation. The mean and median represent the magnitude of the mesh forces, and the extremum and percentile reflect the fluctuation range of the mesh forces. From group 1 to 12, with the increase in the PTO rotation speed and the decrease in PTO torque, the mean and fluctuation level of the gear mesh forces decrease gradually. Different from road vehicles, the power take-off driveline of tractors is usually in drive mode with low speed and high torque when they plough in the field. The results of the simulation groups shown in Figure 10 quantitatively describe the change and delivery process of the gear dynamic mesh force.

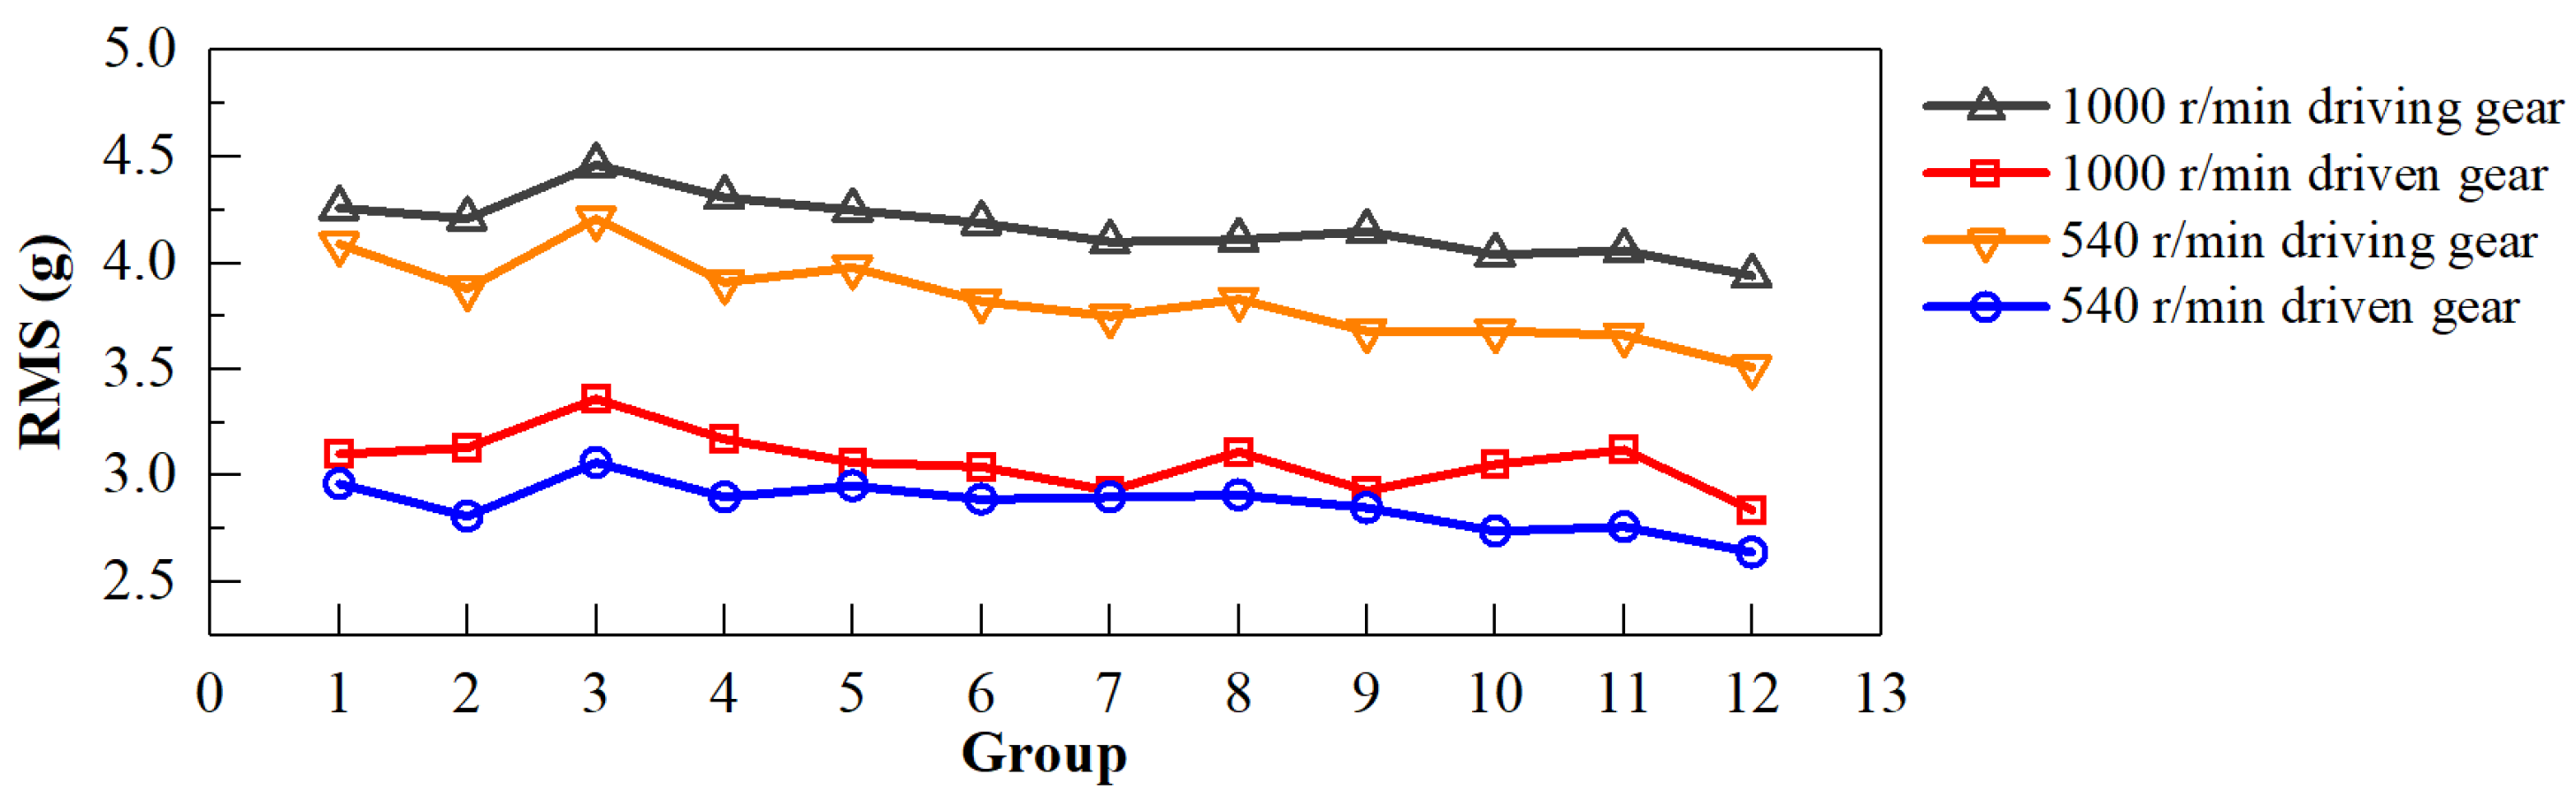
3.2.2. Vibration Responses under Different Drive Modes

The vibration responses of different components were calculated under different drive modes and RMS values of the vibration responses; RMS is a well-established statistical parameter in gear system dynamics [24], and values were subsequently extracted to characterize the dynamic responses and the further vibration changes. The RMS value was calculated using the data with a response time duration of 10 s, and the formulation is expressed as
RMS = i = 1 n x i 2 n
where n is the total number of data points in the response time duration, and xi is the vibration acceleration value of each data point.
Figure 11 shows the calculated RMS values of lateral vibration acceleration under different drive modes. Similar to the variation trend of mesh forces, the fluctuation change of the acceleration amplitude for RMS values from group 1 to 12 can be clearly seen. The RMS values almost exhibit a gradual decay decrease as the load torque decreases and the PTO rotation speed increases, and then the difference in the acceleration amplitude reaches the minimum when the engine reaches the rated speed of 2200 r/min.

4. Conclusions

Based on gear dynamics theory and a lumped parameter modeling method, a novel coupled spatial dynamics model considering different speed gears was established for the tractor driveline to investigate the torsional vibration coupling effects. The torsional vibration coupling effects between different speed gears were first considered. Furthermore, some complex elements such as the time-varying mesh stiffness, nonlinear mesh damping, gear mesh force, and tooth surface friction have been fully considered in this model. The established dynamics model of the power take-off driveline exposes the coupled dynamic impacts between the engine and the load PTO under different drive modes in a realistic way, especially in the drive mode with low speed and high torque.
To acquire the transmission dynamics under the load operation, the load rotation speed and torque are based on the actual test results on the Tractor PTO Test Bench, and the responses of the torsional vibration spatial coupled kinetic system are acquired. The proposed kinetic model is demonstrated by comparison with the test results from the indoor Test Bench. The established kinetic model well shows the main dynamic performances in both the time and frequency domains.
The driveline dynamics with different drive modes are further researched under load rotation speed and torque excitations. The gear dynamic mesh force and lateral vibrations of the main components are assessed in the power take-off driveline. The mesh forces between the 540 r/min driving gear and driven gear fluctuate most strongly. Hence, the reliability failure in the PTO low-speed operation mode should be paid more attention. Moreover, the mean and fluctuation level of the gear mesh forces decrease gradually with the increase in the PTO rotation speed and the decrease in PTO torque. A similar trend also appears in the RMS values of the lateral vibration amplitude.
In the future, the dynamics model can be also applied to study the dynamic effects of the power take-off driveline under familiar modes, such as no-load running on a cement road, no-load running in farmland, and field operations. The dynamics model can iterate the load spectrum unavailable by sensors, and its applications are meaningful to the reliability and fatigue damage analysis of tractors, which can be further studied.

Author Contributions

Conceptualization, X.S.; methodology, B.Z. and Z.L.; software, X.S.; validation, X.S., B.Z. and Z.L.; investigation, Z.S.; data curation, B.Z.; writing—original draft preparation, X.S.; writing—review and editing, Z.S.; supervision, Z.L.; project administration, Z.S.; funding acquisition, Z.S. All authors have read and agreed to the published version of the manuscript.

Funding

This research was funded by the National Key Research and Development Plan of China, grant number 2017YFD0700301.

Institutional Review Board Statement

Not applicable.

Informed Consent Statement

Not applicable.

Data Availability Statement

Not applicable.

Acknowledgments

All of the authors would like to acknowledge the technical support from Luoyang Xiyuan Vehicle and Power Inspection Institute Co., Ltd.

Conflicts of Interest

The authors declare no conflict of interest. The Luoyang Xiyuan Vehicle and Power Inspection Institute Co., Ltd. had no role in the design of the study; in the collection, analyses, or interpretation of data; in the writing of the manuscript, or in the decision to publish the results.

References

  1. Kim, W.-S.; Kim, Y.-J.; Kim, Y.-S.; Park, S.-U.; Lee, K.-H.; Hong, D.-H.; Choi, C.-H. Evaluation of the fatigue life of a tractor’s transmission spiral bevel gear. J. Terramechanics 2021, 94, 13–22. [Google Scholar] [CrossRef]
  2. Shao, X.; Song, Z.; Yin, Y.; Xie, B.; Liao, P. Statistical distribution modelling and parameter identification of the dynamic stress spectrum of a tractor front driven axle. Biosyst. Eng. 2021, 205, 152–163. [Google Scholar] [CrossRef]
  3. Wen, C.; Xie, B.; Li, Z.; Yin, Y.; Zhao, X.; Song, Z. Power density based fatigue load spectrum editing for accelerated durability testing for tractor front axles. Biosyst. Eng. 2020, 200, 73–88. [Google Scholar] [CrossRef]
  4. Wen, C.; Xie, B.; Song, Z.; Yang, Z.; Dong, N.; Han, J.; Yang, Q.; Liu, J. Methodology for designing tractor accelerated structure tests for an indoor drum-type test bench. Biosyst. Eng. 2021, 205, 1–26. [Google Scholar] [CrossRef]
  5. Tang, X.; Yang, W.; Hu, X.; Zhang, D. A novel simplified model for torsional vibration analysis of a series-parallel hybrid electric vehicle. Mech. Syst. Signal Process. 2017, 85, 329–338. [Google Scholar] [CrossRef]
  6. Oh, J.J.; Choi, S.B.; Kim, J. Driveline modeling and estimation of individual clutch torque during gear shifts for dual clutch transmission. Mechatronics 2014, 24, 449–463. [Google Scholar] [CrossRef]
  7. Crowther, A.; Zhang, N. Torsional finite elements and nonlinear numerical modelling in vehicle powertrain dynamics. J. Sound Vib. 2005, 284, 825–849. [Google Scholar] [CrossRef]
  8. Chen, Z.; Zhai, W.; Wang, K. Dynamic investigation of a locomotive with effect of gear transmissions under tractive conditions. J. Sound Vib. 2018, 408, 220–233. [Google Scholar] [CrossRef]
  9. Chen, Z.; Zhai, W.; Wang, K. Locomotive dynamic performance under traction/braking conditions considering effect of gear transmissions. Veh. Syst. Dyn. 2017, 56, 1097–1117. [Google Scholar] [CrossRef]
  10. Wang, Z.; Mei, G.; Xiong, Q.; Yin, Z.; Zhang, W. Motor car–track spatial coupled dynamics model of a high-speed train with traction transmission systems. Mech. Mach. Theory 2019, 137, 386–403. [Google Scholar] [CrossRef]
  11. Lu, W.; Zhang, Y.; Cheng, H.; Zhou, Y.; Lv, H. Research on dynamic behavior of multistage gears-bearings and box coupling system. Meas. J. Int. Meas. Confed. 2020, 150, 107096. [Google Scholar] [CrossRef]
  12. Bartelmus, W. Mathematical modelling and computer simulations as an aid to gearbox diagnostics. Mech. Syst. Signal Process. 2001, 15, 855–871. [Google Scholar] [CrossRef]
  13. Howard, I.; Jia, S.; Wang, J. The dynamic modelling of a spur gear in mesh including friction and a crack. Mech. Syst. Signal Process. 2001, 15, 831–853. [Google Scholar] [CrossRef]
  14. Wu, S.; Zuo, M.J.; Parey, A. Simulation of spur gear dynamics and estimation of fault growth. J. Sound Vib. 2008, 317, 608–624. [Google Scholar] [CrossRef]
  15. Tian, Z.; Zuo, M.J.; Wu, S. Crack propagation assessment for spur gears using model-based analysis and simulation. J. Intell. Manuf. 2012, 23, 239–253. [Google Scholar] [CrossRef]
  16. Liang, X.H.; Liu, Z.L.; Pan, J.; Zuo, M.J. Spur Gear Tooth Pitting Propagation Assessment Using Model-based Analysis. Chin. J. Mech. Eng. 2017, 30, 1369–1382. [Google Scholar] [CrossRef] [Green Version]
  17. Lundvall, O.; Strömberg, N.; Klarbring, A. A flexible multi-body approach for frictional contact in spur gears. J. Sound Vib. 2004, 278, 479–499. [Google Scholar] [CrossRef]
  18. Chen, Z.; Shao, Y. Dynamic simulation of spur gear with tooth root crack propagating along tooth width and crack depth. Eng. Fail. Anal. 2011, 18, 2149–2164. [Google Scholar] [CrossRef]
  19. Chen, Z.; Zhai, W.; Shao, Y.; Wang, K.; Sun, G. Analytical model for mesh stiffness calculation of spur gear pair with non-uniformly distributed tooth root crack. Eng. Fail. Anal. 2016, 66, 502–514. [Google Scholar] [CrossRef]
  20. Ryali, L.; Talbot, D. A dynamic load distribution model of planetary gear sets. Mech. Mach. Theory 2021, 158, 104229. [Google Scholar] [CrossRef]
  21. Liu, C.; Yin, X.; Liao, Y.; Yi, Y.; Qin, D. Hybrid dynamic modeling and analysis of the electric vehicle planetary gear system. Mech. Mach. Theory 2020, 150, 103860. [Google Scholar] [CrossRef]
  22. Amabili, M.; Rivola, A. Dynamic analysis of spur gear pairs: Steady-state response and stability of the SDOF model with time-varying meshing damping. Mech. Syst. Signal Process. 1997, 11, 375–390. [Google Scholar] [CrossRef]
  23. Liang, X.; Zhang, H.; Liu, L.; Zuo, M.J. The influence of tooth pitting on the mesh stiffness of a pair of external spur gears. Mech. Mach. Theory 2016, 106, 1–15. [Google Scholar] [CrossRef]
  24. Tandon, N.; Choudhury, A. A review of vibration and acoustic measurement methods for the detection of defects in rolling element bearings. Tribol. Int. 1999, 32, 469–480. [Google Scholar] [CrossRef]
Figure 1. Structure diagram for the power transmission system of a four-wheel drive tractor. PTO: power take-off.
Agriculture 12 01297 g001
Figure 2. Structure diagram for the power take-off driveline. 1—Driving shaft; 2—Bearing; 3—Driving gear with a speed of 540 r/min; 4—Driving gear with a speed of the 1000 r/min; 5—Driven shaft; 6—Driven gear with a speed of 540 r/min; 7—Inside engaged gear; 8—Driven gear with a speed of the 1000 r/min; 9—PTO shaft.
Agriculture 12 01297 g002
Figure 3. Torsional vibration coupled spatial dynamics model.
Agriculture 12 01297 g003
Figure 4. Three-dimension dynamics model of the driveline under 1000 r/min gear.
Agriculture 12 01297 g004
Figure 5. Mesh stiffness of the 1000 r/min driving gear.
Agriculture 12 01297 g005
Figure 6. Dynamics experiment of the tractor power take-off driveline: (a) vibration test on the Tractor PTO Test Bench; (b) arrangements of acceleration sensors in the experiment.
Agriculture 12 01297 g006
Figure 7. Simulated and test results in the time domain: (a1) lateral vibration of the 1000 r/min driving gear; (b1) vertical vibration of the 1000 r/min driving gear; (a2) lateral vibration of the 1000 r/min driven gear; (b2) vertical vibration of the 1000 r/min driven gear; (a3) lateral vibration signals of the driveline; (b3) vertical vibration signals of the driveline.
Agriculture 12 01297 g007
Figure 8. Simulation and test results in the frequency domain: (a1) lateral vibration of the 1000 r/min driving gear; (b1) vertical vibration of the 1000 r/min driving gear; (a2) lateral vibration of the 1000 r/min driven gear; (b2) vertical vibration of the 1000 r/min driven gear; (a3) lateral vibration signals of the driveline; (b3) vertical vibration signals of the driveline.
Agriculture 12 01297 g008
Figure 9. Time histories of the gear dynamic mesh force under 1000 r/min Gear and 540 r/min Gear.
Agriculture 12 01297 g009
Figure 10. Box plots of the gear mesh force under different drive modes: (a) mesh force Fm24; (b) mesh force Fm13.
Agriculture 12 01297 g010
Figure 11. The calculated RMS values of lateral vibration acceleration under different drive modes.
Agriculture 12 01297 g011
Table 1. DOFs of the tractor driveline model.
ComponentVerticalLateralRoll
Engine--θe
Gear (i = 1–5)yixiθi
Load--θL
Table 2. Physical parameters of the power take-off driveline.
ParameterGear 2Gear 4Gear 5
Number of teeth224124
Tooth width/mm282822
Module663.5
Base circle radius/mm6211640
Pressure angle/°202020
Lateral support stiffness/(N∙m−1)5.0 × 1085.0 × 1085.0 × 108
Vertical support stiffness/(N∙m−1)5.0 × 1085.0 × 1085.0 × 108
Lateral support damping/(N∙m−1∙s)4.0 × 1054.0 × 1054.0 × 105
Vertical support damping/(N∙m−1∙s)4.0 × 1054.0 × 1054.0 × 105
Poisson’s ratio0.30.30.3
Young’s modulus/GPa206.8206.8206.8
Table 3. The statistical index of the tested and simulated data in the time domain.
Index for the Lateral (Vertical) Direction
Maximum AmplitudeStds
Tested/gSimulated/gTested/gSimulated/g
Gear 254.98 (24.14)49.18 (24.66)10.42 (7.06)4.55 (2.73)
Gear 440.33 (20.20)5.76 (3.45)
Table 4. Frequency comparison between simulation and test values.
Frequency ComponentSimulated (X)/HzTested (X)/HzErrorSimulated (Y)/HzTested (Y)/HzError
fm6836682.20%6836632.93%
2 fm136713163.73%136712975.12%
3 fm205020241.27%205020141.76%
4 fm273326174.24%273326293.81%
Table 5. Set simulation parameters under different drive modes.
Frequency Component540 r/min1000 r/min
PTO Rotation Speed/(r/min)PTO Torque/(N∙m)PTO Rotation Speed/(r/min)PTO Torque/(N∙m)
149029809501537
250029209601521
351028639701505
452028089801490
553027559901475
6540270410001460
7550265511001327
8560260712001217
9570256113001123
10580251714001043
1159024751500973
1260024331600913
Publisher’s Note: MDPI stays neutral with regard to jurisdictional claims in published maps and institutional affiliations.

