Abstract
The cultivation of rice under irrigation provides fundamental sustenance for nearly half of the world’s population. Rice yields need to increase in order to maintain the rapidly growing population and meet growing food requirements. In this research, we applied the coupled atmospheric–crop model, which is based on the WRF and CERES-Rice models, to find the appropriate nitrogen fertilizer level for improving rice yield in northern Thailand. The model was conducted from June to December in 2011 and 2015. To evaluate the model’s capability, the output from the model, including meteorological data (i.e., precipitation and temperature) and rice production, was compared to actual observation data. The modeling system showed an acceptable level of output for statistical examination; for example, the R2 values were 0.93, 0.76, and 0.97 for precipitation, temperature, and rice production, respectively. To assess the optimization of the nitrogen fertilizer level, we designed nine experiments: control cases and other cases that were multiplied by a factor of 2–10 times the nitrogen fertilizer levels. The model suggested that we can produce substantial rice yields by increasing nitrogen fertilizer levels by 12 kg/ha.
1. Introduction
Irrigated rice cultivation in Asia accounts for around 70% of global rice production, providing basic food to nearly half of the world’s population [1]. However, rice yields must expand to supply the increasing food demand of a rapidly growing population [2]. Nitrogen (N) is a necessary ingredient for high grain yields of lowland rice [3]. High N fertilizer rates may increase yields, but they may also reduce grain quality. Modern production agriculture, on the other hand, necessitates environmentally sound and sustainable farming practices. The widespread use of chemical fertilizers, particularly nitrogen fertilizers, is one of the most serious environmental challenges, serving as a major source of ammonia, nitrate, and nitrogen oxides in the environment [4]. Nitrogen fertilization can have a wide range of effects on grain yield, depending on the variety and climatic conditions [5]. In different parts of Asia, yields for local types without the addition of fertilizer ranged from 3.6 to 5.3 t/ha [6], presumably limited by low levels of indigenous soil N [7].
Northern Thailand produced around six million tons of rice in 2017, accounting for 25% of Thailand’s total rice production, with a well-known aromatic and high-quality rice variety known as Khao Daw Mali 105 (KDML105) [8]. Furthermore, global climate change is expected to reduce rice production in Northern Thailand by 8 ± 3.5% per °C in the near future [9]. To cope with this situation, crop-production technology could be used to increase agricultural productivity by reducing business costs and finding new ways and places to produce food sustainably, to make sure people have access to safe and healthy food all the time. At the same time, nitrogen fertilizers have increased significantly in importance in recent years, particularly in the context of the global climate change situation [10,11,12]. As a result of climate change, crop yields have declined in many parts of the world [10,12]. Therefore, for the agricultural system to maintain crop production, an equilibrium study on the effective use of nitrogen to enhance crop production is essential. One of the key challenges for sustainable agriculture is regulating nitrogen fertilizer use in order to maximize crop output while utilizing valuable N inputs.
Crop productivity is strongly influenced by weather and climate. Tropical areas are regions that often experience monsoons, and they have limited crop-management technology [13]. A better understanding of the effects of seasonal and interannual weather and climatic variability on crop yields would facilitate agricultural planning [13]. These effects are found at several spatial scales, but they are comparatively large spatial scales, similar to those of regional and global climate models, which provide an integrated modeling approach to the problem. As a result, there is a need for process-based crop models that can capture the impact of weather and climatic variability at various regional scales. Crop models aim to determine the interactions between crop growth and weather, as well as some of the implications of crop management. At the field scale, these models frequently perform adequately. Atmospheric models (e.g., the Weather Research and Forecasting Model, WRF) use a process-based approach to preserve as wide a range of spatial and temporal applicability as possible and to account for the effects of sub-seasonal weather variability [14]. The coupled atmospheric–crop model could capture weather/climate impacts on yield [15,16]. The Decision Support System for Agrotechnology Transfer (DSSAT) is a cropping-system model that is used for a wide range of agricultural studies at various spatial and temporal scales. It involves farming and precision management, regional climate variability and climate change impact assessments, gene-based modeling and selection, water usage, greenhouse gas emissions, and long-term sustainability through the use of organic soil carbon and nitrogen balance. DSSAT has been used by many academics, educators, consultants, expanders, farmers, and policymakers in over 150 countries. DSSAT was chosen because the module’s ability to simulate crop growth and yields in smallholder farming systems has been successfully demonstrated across a wide range of land, management, and climate conditions [17,18,19,20,21,22]. For example, Saseendran et al. [23] conducted a plant-growth survey to improve yield and nitrogen simulation using DSSAT in tissue flow in relation to the general effects of model administration on the water content. A common and well-accepted way to avoid expensive long-term experiments is to use crop models that change over time. Several studies have used a coupled atmospheric–crop model that is based on DSSAT and WRF models to study the interaction between weather and crops. For example, Dias et al. [24] used DSSAT to identify yield and growth changes in the two most popular rice varieties (At362 and Bg357), cultivated in the Nilwala river basin during the Yala season under the global climate change scenario Representative Concentrate Pathway (RCP) 8.5. Their findings revealed that rising temperatures, solar radiation, and decreased rainfall in the mid-century influenced rice yield and growth. Meanwhile, Chandran et al. [25] investigated the impact of the projected climate on the growth and yield of the rice–wheat–groundnut cropping sequence in Mohanpur, India under the new alluvial soil region. Their study provided a better understanding of how a cropping sequence, rather than just a single crop in a sequence, responds to the projected climate, which can be utilized to develop better adaptation techniques.
There are several methods to address the issues of modeling crop complexity, such as empirical/process-based modeling and spatial scale. Brooks et al. [26], for example, developed a meta-model of the wheat simulation model SIRIUS based on monthly mean meteorological input data for regional impact assessments. Landau et al. [27] proposed a multiple-regression model of wheat yield in the United Kingdom that employed weather factors averaged throughout five phases of development. This semi-empirical technique attempted to integrate empirical modeling’s pragmatism with simulated phenology. This model captures the average spatial variability in crop yield effectively, but it cannot be generalized beyond the current UK climate conditions. Jagtap and Jones [28] emphasized the impracticality of modeling yields at the field scale for large-area applications. Their study maintained the process-based approach by simulating regional variability in soybean yields on a 0.5 × 0.5 square grid with an ensemble of nine CROPGRO-soybean runs. They used daily weather forecasts generated by a weather generator. The root-mean-square error (RMSE) of the simulated yields ranged between 7% and 85%. Such methods assume a degree of stationarity in crop–weather interactions, which is not always accurate in weather/climate variability because the spatial scale of a mathematically one-dimensional crop model is defined by the level of detail and spatial aggregation of its input data. The spatial scale of the atmospheric model can be modified by adjusting the high spatial scale of the inputs by aiming for an intermediate degree of input data requirement. Concurrently, weather conditions could also have an influence on fertilizer application. For example, the lag response, or the application of fertilizer in the time period subsequent to the event of a weather shock, seems to be more predictable. Because a substantial departure from expected levels of wetness is connected with a reduction in productivity, this indicates that the plants are taking in lower nutrients. This further causes a lower need for fertilization in the subsequent year. However, while heavy rains might damage crops as much as drought, they may also cause fertilizer run-off from the soil, effectively offsetting this argument [29]. As a result, the high spatial resolution of the atmospheric model could be used to specify the precise spatial scale of nitrogen fertilizer application. In this study, we used a coupled atmospheric model based on the Weather Research and Forecasting Model (WRF) and a crop model based on the DSSAT modeling system to find the optimal nitrogen fertilizer rate for improving rice production in Northern Thailand.
2. Materials and Methods
We used a coupled atmospheric model, namely the Weather Research and Forecasting Model (WRF), version 3.8 [14], and a crop model called the CERES-Rice model [30] in DSSAT, version 4.7. The WRF model was performed on the meteorological data, including maximum and minimum temperature, rainfall, and solar radiation for DSSAT. The results from DSSAT were then used to analyze the proportion of nitrogen fertilizer used in rice production in Northern Thailand. To examine the performance of environmental factors from the WRF model, such as temperature and precipitation, they were compared with ground-based measurement data from the Thai Meteorological Department. While the output from DSSAT was validated with an on-farm dataset from the Department of Agriculture in Thailand.
2.1. Study Area
The northern parts of Thailand are marked by mountainous terrain, separated by tectonic plates. The dominant river in this region is the Chao Phraya River, the origin of which is at a confluence of four rivers: the Ping, the Wang, the Yom, and the Nan. Many kinds of natural disasters occur because of these characteristics. The mountain ranges in the north are steepened by deep river valleys and highlands in the middle region. These natural features have accommodated a wide variety of agriculture such as paddy cultivation in rice-growing valleys and moving cultivation in upland meadows. The mountains dominate the landscape and make it a mountainous area. It contains the headwaters of the major rivers. The Ping, Wang, Yom, and Nan are the smallest, middle, and largest growers, respectively. In particular, KDML 105 is globally recognized as the highest-quality rice, with a total rice yield area of approximately 405,801 hectares and 1,487,506 tons per year [8]. There are a great deal of paddy fields in this place. Farmers typically grow watered plots as well as upland plots devoted to field or plant products. Northern Thailand’s irrigated lands are located in fertile valley bottoms so are strongly confined by geography [8]. Irrigation uses a lot of water, and competition from non-agricultural uses, mostly family usage in urban and suburban areas, is growing more common [31]. The rice crop is harvested annually from November to December. The locations of the rice planting areas in Northern Thailand are shown in Figure 1.
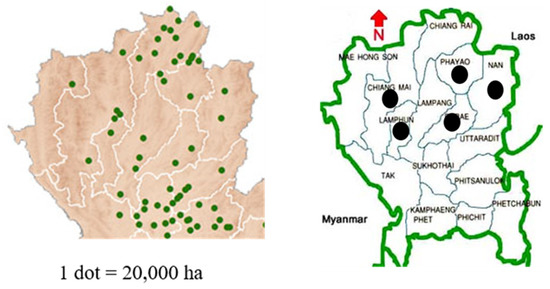
Figure 1.
Rice plating areas in Northern Thailand (left) (Ricepedia.org) and locations of the Thai Meteorological Department (TMD) (black dot) (right).
2.2. WRF Model
The WRF model has been used to investigate several aspects of atmospheric research. It is a nonhydrostatic mesoscale model that consists of many physical schemes. The CERES-Rice Model [24] in DSSAT was chosen for simulating the growth and yield of rice in Northern Thailand. The Thai rice cultivar used in the study was KDML-105. In this paper, we configured two WRF domains with a grid spacing of 50 km and 10 km. In addition, the model was set to 30 vertical levels up to 50 hPa. The outer domain mainly covered most of Southeast Asia and some parts of East and South Asia, such as South China and East India, as shown in Figure 2.
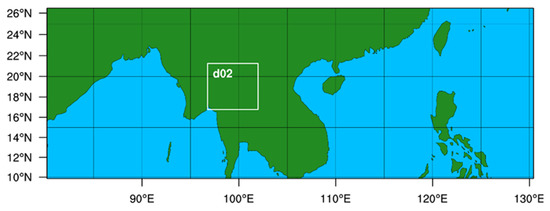
Figure 2.
WRF domain configuration.
The inner domain covered Northern Thailand. The WRF configurations were similar to those of Amnuaylojaroen et al. [32]. The rapid radiative transfer model (RRTMG) was used for the evolution and feedback of atmospheric aerosol in both longwave and shortwave radiation in the model calculation [33]. At the same time, the feedback of aerosol effects on meteorology was included in the model through computing using the Thompson scheme [34]. The Grell-3 scheme was used for the calculation of subgrid-scale atmospheric processes, while the Noah Land Surface Model [35] was responsible for the land and atmospheric interactions. A grid-nudging technique [36] was applied in the model configuration for accurate meteorology for all variables in the model, with nudging coefficients of 0.0003 s−1 every 6 h. The WRF model was performed from January to December from 2011 to 2015 to simulate the weather conditions for the DSSAT modeling system. The environmental factors, including maximum and minimum temperature, rainfall, and radiation from the WRF output in the rainy season between June and December, were used as inputs into DSSAT. The environmental factors of the daily WRF model output from June to December from 2011 to 2015 were selected based on the nearest longitude and latitude locations to the specified model grid indices on the rice planting area in each province (Figure 1).
2.3. DSSAT Model
To simulate crop yield, we used the Decision Support System for Agrotechnology Transfer (DSSAT), version 4.7.5, from June to December from 2011 to 2015. June to October is defined as the planting period, while November to December is defined as the harvesting period. The seasonal run involved crop development, growth, and yield along with changes in the water, soil, carbon, and nitrogen balance under the cropping system [30]. These calculations were based on CERES-Rice, which is an individual submodule embedded in DSSAT that simulates the phonology, daily growth, plant nitrogen and carbon demands, and senescence of plant material. Based on complete information on total crop production, we selected 5 provinces, including Phrae, Chiang Mai (CM), Nan, Lamphune, and Phayao, to analyze rice production. The crop model configurations, including water demand, fertilizer level, and soil analysis, were similar to Amnuaylojaroen et al. [8]. The water demand for the growing rice each month was configured as shown in Table 1 [31]. The fertilizer level was used according to the report of the Department of Agriculture of Thailand, with N: 6 kg/ha, P2O5: 7.5 kg/ha, and K2O: 7.5 kg/ha. The soil analysis layers were set up with a bulk density of 1.035 g/cm3, organic carbon of 1.46%, total nitrogen of 0.601%, pH in buffer of 5.63, pH in water of 6.59, extractable phosphorus of 5.766 mg/kg, exchangeable potassium of 5.766 cmol/kg, and stable organic of 1.46%.

Table 1.
Water demand for the grown rice in each month.
The rice variety known as Khao Daw Mali 105 (KDML105) was the cultivar used in this research. The genotype coefficients for the cultivars KDML105 were calculated by Buddhaboon et al. [37] as listed in Table 2. The genetic coefficients from the analysis “KDML105” by Jongkaewattana and Vejpas, [38], were used. They performed a monthly planting experiment from May 1997 to May 1998 at the Multiple Cropping Center, University of Chiang Mai. The data used were obtained using the standard procedures of the International Benchmark Sites Network for Agrotechnology Transfer (IBSNAT). Data from the experience were used to estimate the genetic parameters by using the “genotype coefficient calculator” given by the DSSAT shell [37].
Table 2.
Genotype coefficient of Khao Dawk Mali 105 (KDML105).
2.4. Statistical Model Used
To evaluate the model’s ability, we compared the model output to the ground-based measurement from the Thai Meteorological Department (TMD) and total rice yield production from the Department of Agriculture. Model reliability can be indicated via statistical analysis, including correlation determination (R2), mean absolute error (MAE), and standard deviation (SD).
The R-squared value is calculated from the correlation coefficient r in (1):
where n is the number of model and observation data points, is the model data, and is the observation data.
The mean absolute error (MAE) is calculated in (2):
where O is the observational data, M is the model data, and n is the number of model and observational data points.
The standard deviation of residuals is calculated following (3).
where is the observation data, is the model data, is the mean of the observation data, is the mean of the model data and n is the number of model and observation data points.
3. Results and Discussion
3.1. Model Performance
The daily validation of the model and observations averaged over 2011–2015 based on five station locations of the TMD in Phrae, Chiang Mai, Nan, Lamphune, and Phayao is illustrated in Figure 2. The modeled precipitation, temperature, and rice production were compared to observations, as shown in Figure 3, Figure 4 and Figure 5. In general, the meteorological factors such as temperature and precipitation from the WRF model were agreeable and well predicted compared with the TMD data. However, the monthly average temperature using WRF was higher than the observation using TMD by 1–2 °C, while the modeled precipitation agreed fairly well with the ground-based data from TMD. However, the WRF model predicted an underestimation of precipitation by 1–5 mm/day compared to observations in the rainy season (May–September). The total rice yield production of DSSAT based on the CERES-Rice submodule was compared to information from the Department of Agriculture in Thailand. Total rice production was averaged from the location in Figure 2 in each province, including Phrae, Chiang Mai (CM), Nan, Lamphune, and Phayao. As a result of model comparison, the model showed good simulation of rice production, with slightly higher totals of crop yield at the five sites (Figure 5).
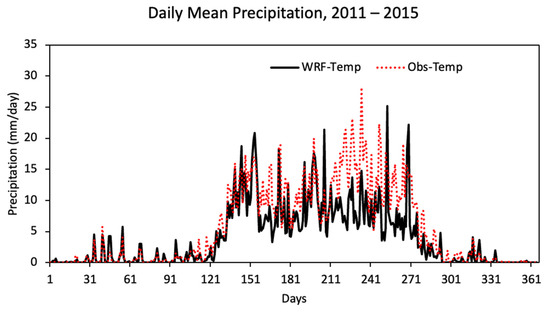
Figure 3.
Daily mean precipitation (mm/day)) averaged over 2011–2015 based on 5 station locations of the Thai Meteorological Department (TMD) model (red dot) and the WRF model (black line).
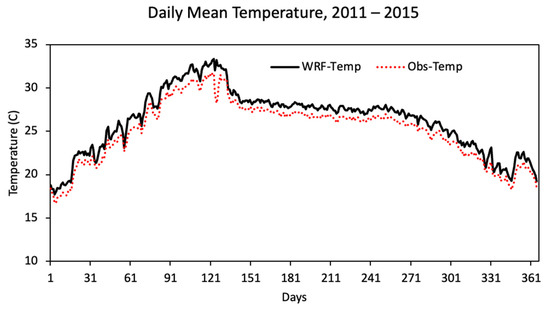
Figure 4.
Daily mean temperature (°C) averaged over 2011–2015 based on 5 station locations of the Thai Meteorological Department (TMD) model (red dot) and the WRF model (black line).
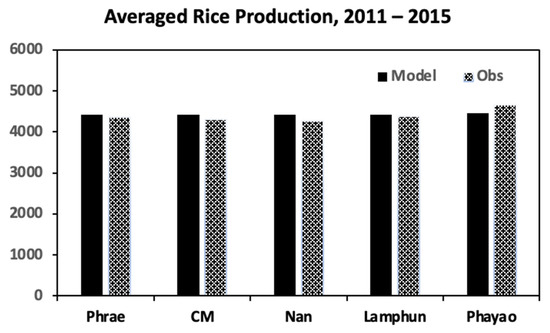
Figure 5.
Average total rice production over 2011–2015 based on location in Figure 2 between the DSSAT model (black) and information from the Department of Agriculture.
The statistical analysis comparing the model and the observed data was averaged over 2011–2015 from five station locations of the TMD annually, as shown in Table 3. Rice yield production was estimated at the location of the planting area (Figure 2) in five provinces. The model had an acceptable ability to capture temperature, precipitation, and rice production, which are indicated by R-squared values ranging from 0.8–0.9. The modeled temperature, precipitation, and rice productivity were generally underestimated compared to the observations, with a mean absolute error of 1.12 °C, 1.55 mm/day, and 30.49 kg/ha for temperature, precipitation, and rice productions, respectively. The standard deviations of the model are 3.58, 5.68, and 100.61 for temperature, precipitation, and rice productions, respectively. Overestimation of the modeled temperature has a likely effect on the yield. As discussed in Gumel et al. [39], the severity of the impact of a temperature rise on rice yield is possibly attributable to the increased respiration losses [40], as well as the reduction in the rate of grain growth in the initial and later stages of grain filling and diminished cell size and endoplasmic surface area [41,42]. Meanwhile underprediction in the amount of rainfall and distribution is the most important factor limiting rainfed rice production [32].
Table 3.
Statistics comparing the model and observations.
3.2. Analysis the Optimal Nitrogen Fertilizer Rate on Rice Production
To examine the sensitivity of the level of nitrogen fertilizer on rice production, we designed eight experiments, as listed in Table 4, and a control case, which was the normal fertilizer level during rice growth according to the report of the Department of Agriculture of Thailand (N: 6 kg/ha, P2O5: 7.5 kg/ha, and K2O: 7.5 kg/ha). The modeled rice production was averaged from five locations, including Phrae, Chiang Mai, Nan, Lamphune, and Phayao, from 2011 to 2015. The sensitivity of nitrogen fertilizer levels to rice production is shown in Figure 6. The plot displays the rice production variation with each nitrogen fertilizer rate in Northern Thailand. The plot shows that Exp. 1 tended to increase the rice product, with a substantial nitrogen fertilizer level of approximately 12 kg/ha and with a rice production level of 4793.00 ± 25.7 ha.
Table 4.
Percentage of rice growing when the level of nitrogen fertilizer increased.
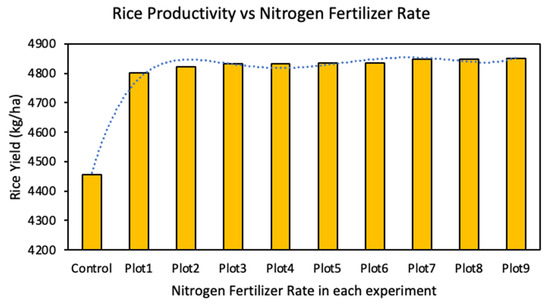
Figure 6.
Normal distribution of nitrogen fertilizer rate on rice yield production in northern Thailand.
The relationship between weather and rice productivity, as well as nitrogen fertilizer, is described by the Pearson correlation coefficient in Table 5. Precipitation and temperature are associated with rice productivity, with values of 0.85 and 0.92, respectively. Rainfall during the tillering and stem-elongation stages has a positive impact on the rice plant, resulting in an increase in the rate of tillering, which enhances rice productivity [43]. Meanwhile, an increase in temperature promotes leaf emergence, increasing rice crop yield during the replantation stage during the vegetative phase [44]. Furthermore, Jagadish et al. [45] stated that rice flowering is the most sensitive stage in the face of both heat and cold stress, with the male reproductive organ dictating the extent of spikelet sterility. Nitrogen fertilizer, on the other hand, has a negative correlation with temperature and precipitation of −0.91 and −0.92, respectively. The intensity of precipitation would also have an influence on nitrogen leaching. Higher rainfall intensity causes splash erosion of cultivated land’s surface soil [46,47], as well as the loss of some nitrogen fertilizer. Higher temperatures dramatically reduces nitrogen uptake from fertilizer for both early and late rice [48]. According to Ju et al. [49], 48% of the nitrogen applied was lost by ammonia volatilization and denitrification, while nitrogen leaching accounted for just 0.3% of the applied nitrogen. Nitrogen fertilizer has a good correlation with rice productivity. According to Xu et al. [50], the combination effect of optimal N fertilizer and cold temperature enhanced rice productivity. High temperature exposure accelerated grain filling and shortened grain filling duration, resulting in insufficient starch accumulation and a chalky occurrence for high-temperature-ripening grains, whereas appropriate panicle nitrogen fertilizer application prolonged the lasting duration of the grain-filling process and decreased the chalky occurrence of rice grains, with a significant increase in chalky grain rate for both insufficient supply and the overuse of panicle nitrogen fertilizer [51,52,53,54,55]. Additionally, Jiang et al. [56], who used the coupled WRF-DSSAT to study the future effects of climate change on rice production, found that under rain-fed conditions, winter rice yield was likely to drop by nearly 24% and summer rice yield was likely to drop by nearly 49% over the Mekong River Delta.
Table 5.
Pearson correlation coefficient between modeled temperature, precipitation, rice productivity and nitrogen fertilizer.
The analysis of the significant output of the WRF and DSSAT encourages us to determine the optimal level of nitrogen fertilizers that would enhance rice production with a substantial return while also being profitable. The model performance was initially evaluated in comparison with actual data for both environmental factors from WRF and rice production from DSSAT. The WRF model shows an acceptable performance when representing the environmental factors in this region. It simulates the patterns of precipitation and temperature for the whole year well. However, the modeled precipitation, in particular, is underestimated compared to observations in the rainy season. This is likely due to the fact that the atmospheric model uses grid nudging to keep the constant values of large-scale meteorology from the global model; thus, it is vital to discuss the error from initial and boundary conditions. Another possibility is that the model calculation did not include a soil moisture estimation, which is critical in the simulation of precipitation in tropical regions.
In this case, variability in weather simulation had an impact on crop simulation. The environmental temperature did not contribute a large amount to crop model uncertainty but had a major effect on the range of wheat period that could be generated. The lack of precipitation could raise concerns about nitrogen in the field. Nitrogen fertilization is a crucial input for rice growth in the region. In humidified soil, the N losses can vary greatly. Deng et al. [57] also suggested that highlands and regions that struggle with irrigation-water resources are likely to undergo more rainy seasons. The dissolved fertilizer N contained in surface water rose by 89% in 2003 and 73% in 2004 from the previous application. The rate dropped to 1% of the total N submitted 6–7 days after submission. If surface water runs off within a week of urea fertilization, up to 79% of the nitrogen will be lost to the groundwater. Additionally, Woli et al. [58] recorded that river N concentrations increased significantly during the rice-planting season in central Hokkaido, Japan.
Other studies in each region used different optimal nitrogen fertilizers for increasing rice production. For example, Ghoneim et al. [59], who studied the application of the appropriate level of nitrogen fertilization for rice in Egypt, revealed the appropriate nitrogen fertilization level for rice (variety Sakha 108) to be 168 kg/ha. According to a 2020 study by Sapkota et al. in India, nitrogen rates of 120–200 kg/ha in rice (variant CSR-30) produced the best economical returns, and nitrogen rates above these ranges would be both practically and environmentally unsustainable. In Northern Thailand, we determined that the most effective nitrogen fertilizer rate was 12 kg/ha. Different tillage methods and plant attributes are likely to have an impact on the addition of nitrogen fertilizer in different areas. Soil nitrate concentrations generally improved with increased nitrogen inputs, as reported in Squires [60]. Nitrates can build up in the soil if the rate of addition exceeds the rate of uptake by crops. Because nitrogen accumulation is considered to develop more slowly in strip-tilled fields, tillage practice may possibly be contributing to variances in nitrate concentrations in different locations [59]. In this study, more traditional tillage practices are believed to have resulted in nitrate buildup in the soil. More nitrate was taken up by the plants since there was more available. When compared to the studies of Ghoneim et al. [59] and Sapkota et al. [61], this study reveals that the most effective nitrogen fertilizer rate for improving rice production in Northern Thailand has a low impact on the environment.
Agriculture management contexts necessitate distinct policies and planning efforts. The crop model could provide important information to city officials in addressing opposing demands and developing alternate future plans. Agricultural paradigms have evolved, from a focus on increasing output to the goal of attaining food security while also preserving the environment [62]. In order to keep up with changes in the agricultural paradigm, the RDA [63] suggested a new standard fertilizer application. This study’s alternate fertilizing procedures could help farmers increase their productivity. Even though there are a lot of simulation results in this study, more research is still needed to find out the best ways to fertilize, even though not many studies have been conducted on how different N fertilizer rates affect rice production.
Excessive N fertilizer application beyond crop demand, on the other hand, has resulted in harmful environmental and socioeconomic impacts. The increased use of nitrogen fertilizers in food production has increased N2O concentrations in the atmosphere, where it lingers as a greenhouse gas 298 times more potent than carbon dioxide [62]. The current N2O concentrations are beginning to exceed those expected by the International Panel on Climate Change (IPCC) in most emission scenarios [64,65] and are incompatible with the Paris Agreement’s climate targets. According to IPCC estimates, the current global mean value of N2O emitted by N fertilizers is approximately 0.9% of the N applied to crops [66,67]. In addition, discharge of the nutrient-overloaded aquifer to a surface body might result in freshwater eutrophication. Anthropogenic activities such as agricultural fertilization and urban effluents are to blame for the majority of eutrophication processes. Practices for the sustainable management of N should be applied. There are several practices. For example, the EU approach is focused on the best practices and nutrient balance and promotes the adoption of nutrient-management planning (NMP) [63]. Several socioeconomic factors (farm size, farmer age, etc.) have been proposed to explain the low rate of NMP adoption. Daxini et al. [68] investigate the reasons for the low adoption rate and find that farmer psychology in relation to the application of management strategies needs to be better understood in order to deliver both environmental and economic benefits. Another interesting fact is that China is the world’s largest fertilizer consumer, with an average annual growth rate of 5.2% over the last three decades (2.5 times the EU growth rate) and accounts for more than one-third of global chemical fertilizer consumption [69]. In terms of eutrophication induced by leaching, there have been numerous reports of high concentrations of cyanobacterial blooms in the Chinese river network [70]. The Chinese government’s 2015 action plan to reduce fertilizer consumption, as well as the Indian government’s support for the “Zero Budget Natural Agriculture” project to provide financial aid to farmers, could serve as suitable examples [62]. Furthermore, the prevailing strategy for enhancing nitrogen-use efficiency (NUE) should be used for long-term N management. It is technological in nature and is defined by the ‘4Rs’ label: applying the right supply, at the right rate, at the right time, and in the right place. This strategic strategy is supplemented by research and innovation in plant breeding, irrigation, and agronomic practice. New technological innovations are also required, such as slow-release and controlled-release fertilizers, which attempt to deliver N when the crop requires it, reducing fertilizer loss and enhancing NUE. Furthermore, some authors advocate for the use of nitrification and urease inhibitors, which are currently commonly used in agriculture [69]. Precision irrigation and drip irrigation are also rising trends that are being supported by several governments [69]. The use of fertigation is also made easier by the adoption of water-saving devices in the context of the application of fertilizer via irrigation water. Chen et al. [70] show that financing innovation is a good way to lower agricultural emissions. While subsidies for production in China are not good for the environment, subsidies for innovation reduce total pollutant emissions while helping farmers increase their margins.
4. Conclusions
In this paper, we used a coupled atmospheric–crop modeling system to find out the optimal nitrogen fertilizer level to improve rice production in Northern Thailand. We designed it to have 10 plots: the control was N: 6 kg/ha, P2O5: 7.5 kg/ha, and K2O: 7.5 kg/ha, while the nitrogen fertilizer level was increased by factors of 2 to 10 for other cases. We used the Weather Research and Forecasting Model (WRF) for meteorological inputs such as precipitation and temperature in a crop model that is based on the Crop-Environment Resource Synthesis-Rice (CERES-Rice) model. The modeled precipitation and temperature from the WRF model were compared to a dataset from ground-based measurements from the Thai Meteorological Department (TMD) in Thailand. The rice yield production of the model was compared to information from the Department of Agriculture of Thailand. Reliability in the modeling system was examined using statistical analysis, including correlation determination (R2), standard deviation (SD), and mean absolute error (MAE). The statistical values indicate that the output from the model shows an acceptable level compared with the real information. The R2 values are 0.93, 0.76, and 0.87 for precipitation, temperature, and rice production, respectively. The MAEs were 1.55 ± 2.43, 1.62 ± 1.21, and 30.49 ± 100.61 kg/ha, respectively. The results showed that the optimal nitrogen level for improving the maximum rice production in Northern Thailand requires increasing the nitrogen fertilizer by 12 kg/ha. This tends to produce satisfactory rice yield production in Northern Thailand. According to the Pearson correlation coefficient, precipitation and temperature are associated with rice productivity with correlations of 0.85 and 0.92, respectively, whereas nitrogen fertilizer showed a negative correlation with temperature and precipitation of −0.91 and −0.92, respectively. Furthermore, nitrogen fertilizer has a strong relationship with rice productivity. In the case of agriculture management for rice paddy fields, these recommended alternate nitrogen fertilizer application procedures, along with a strategy to enhance nitrogen-use efficiency, may be helpful to achieve the desired rice output.
Author Contributions
Conceptualization, T.A.; methodology, T.A.; software, T.A.; validation, T.A.; formal analysis, T.A.; investigation, T.A.; resources, T.A.; data curation, T.A. and P.C.; writing—original draft preparation, T.A.; writing—review and editing, T.A. and P.C.; visualization, T.A.; supervision, T.A. All authors have read and agreed to the published version of the manuscript.
Funding
This APC was funded by the University of Phayao, Thailand.
Institutional Review Board Statement
Not applicable.
Data Availability Statement
The data presented in this study are available in this article.
Acknowledgments
We are thankful to the Thai Meteorological Department (TMD) and Department of Agriculture for providing the meteorological (temperature and precipitation) and total rice production observation data.
Conflicts of Interest
The authors declare no conflict of interest.
References
- Bouwman, A.F.; Lee, D.S.; Asman, W.A.; Dentener, F.J.; Van Der Hoek, K.W.; Olivier, J.G.J. A global high-resolution emission inventory for ammonia. Glob. Biogeochem. Cycle 1997, 11, 561–587. [Google Scholar] [CrossRef]
- Khush, G. What it will take to feed 5.0 billion rice consumers in 2030. Plant Mol. Biol. 2005, 59, 1–6. [Google Scholar] [CrossRef] [PubMed]
- Fageria, N.K.; Baligar, V.C. Lowland rice response to nitrogen fertilization. Commun. Soil. Sci. Plant Anal. 2001, 32, 1405–1429. [Google Scholar] [CrossRef]
- Soltani, A.; Rajabi, M.H.; Zeinali, E.; Soltani, E. Evaluation of environmental impact of crop production using LCA: Wheat in Gorgan. Elect. J. Crop. Prod. 2010, 3, 201–218. [Google Scholar]
- Huo, Z.-Y.; Gu, H.-Y.; Ma, Q.; Yang, X.; Li, M.; Li, G.-Y.; Dai, Q.-G.; Xu, K.; Wei, H.Y.; Gao, H.; et al. Differences of nitrogen absorption and utilization in rice varieties with different productivity levels. Acta. Agron. Sin. 2012, 38, 2061–2068. [Google Scholar] [CrossRef]
- Dobermann, A.; Witt, C.; Abdulrachman, S.; Gines, H.C.; Nagarajan, R.; Son, T.T.; Tan, P.S.; Wang, G.H.; Chien, N.V.; Thoa, V.T.K.; et al. Soil fertility and indigenous nutrient supply in irrigated rice domains of Asia. Agron. J. 2003, 95, 913–923. [Google Scholar] [CrossRef]
- Cassman, K.; Peng, S.; Olk, D.; Ladha, J.; Reichardt, W.; Dobermann, A.; Singh, U. Opportunities for increased nitrogen-use efficiency from improved resource management in irrigated rice systems. Field Crop. Res. 1998, 56, 7–39. [Google Scholar] [CrossRef]
- Amnuaylojaroen, T.; Chanvichit, P.; Janta, R.; Surapipith, V. Projection of Rice and Maize Productions in Northern Thailand under Climate Change Scenario RCP8.5. Agriculture 2021, 11, 23. [Google Scholar] [CrossRef]
- Amnuaylojaroen, T.; Parasin, N. The Future Extreme Temperature under RCP8. 5 Reduces the Yields of Major Crops in Northern Peninsular of Southeast Asia. Sci. World J. 2022, 2022, 1410849. [Google Scholar] [CrossRef]
- Jallouli, S.; Ayadi, S.; Landi, S.; Capasso, G.; Santini, G.; Chamekh, Z.; Zouari, I.; Azaiez, F.B.A.; Trifa, Y.; Esposito, S. Physiological and molecular osmotic stress responses in three durum wheat (Triticum turgidum ssp. Durum) genotypes. Agronomy 2019, 9, 550. [Google Scholar] [CrossRef]
- Ayadi, S.; Jallouli, S.; Landi, S.; Capasso, G.; Chamekh, Z.; Cardi, M.; Paradisone, V.; Lentini, M.; Karmous, C.; Trifa, Y.; et al. Nitrogen assimilation under different nitrate nutrition in Tunisian durum wheat landraces and improved genotypes. Plant Biosyst. Int. J. Deal. All Asp. Plant Biol. 2020, 154, 924–934. [Google Scholar] [CrossRef]
- Ritchie, J.T.; Alocijia, E.E.C.; Uehara, G. IBSNAT/CERES Rice Model. Agrotech. Transf. 1986, 3, 1–5. [Google Scholar]
- Challinor, A.J.; Slingo, J.M.; Wheeler, T.R.; Craufurd, P.Q.; Grimes, D.I.F. Towards a combined seasonal weather and crop productivity forecasting system: Determination of the spatial correlation scale. J. Appl. Meteorol. 2003, 42, 175–192. [Google Scholar] [CrossRef]
- Skamarock, W.C.; Klem, J.B.; Duhia, J.; Gill, D.O.; Barker, D.M.; Duda, M.G.; Huang, X.-Y.; Wang, W.; Powers, J.G. A Description of the Advanced Research WRF Version 3; NCAR Technical Note; National Center for Atmospheric Research: Boulder, CO, USA, 2008. [Google Scholar]
- Ramankutty, N.; Delire, C.; Snyder, P. Feedbacks between agriculture and climate: An illustration of the potential unintendedconsequences of human land use activities. Glob. Planet Change 2006, 54, 79–93. [Google Scholar] [CrossRef]
- Pielke, R.A.; Adegoke, J.O.; Chase, T.N.; Marshall, C.H.; Matsui, T.; Niyogi, D. A new paradigm for assessing the role of agriculture inthe climate system and in climate change. Agric. For. Meteorol. 2007, 142, 234–254. [Google Scholar] [CrossRef]
- MacCarthy, D.S.; Adiku, S.G.K.; Freduah, B.S.; Gbefo, F.; Kamara, A.Y. Using CERESMaize and ENSO as decision support tools to evaluate climate-sensitive farm management practices for maize production in the northern regions of Ghana. Front. Plant Sci. 2017, 8, 31. [Google Scholar] [CrossRef]
- MacCarthy, D.S.; Vlek, P.L.G. Impact of climate change on sorghum production under different nutrient and crop residue management in semi-arid region of Ghana: A modeling perspective. Afr. Crop. Sci. J. 2012, 20, 275–291. Available online: https://www.ajol.info/index.php/acsj/article/view/81717 (accessed on 1 July 2022).
- Ngwira, A.R.; Aune, J.B.; Thierfelder, C. DSSAT modelling of conservation agriculture maize response to climate change in Malawi. Soil Tillage Res. 2014, 143, 85–94. [Google Scholar] [CrossRef]
- Corbeels, M.; Chirat, G.; Messad, S.; Thierfelder, C. Performance and sensitivity of the DSSAT crop growth model in simulating maize yield under conservation agriculture. Eur. J. Agron. 2016, 76, 41–53. [Google Scholar] [CrossRef]
- Adnan, A.A.; Jibrin, J.M.; Abdulrahman, B.L.; Shaibu, A.S.; Garba, I.I. CERES–maize model for determining the optimum planting dates of early maturing maize varieties in Northern Nigeria. Front. Plant Sci. 2017, 8, 1118. [Google Scholar] [CrossRef]
- Adnan, A.A.; Jibrin, J.M.; Kamara, A.Y.; Abdulrahman, B.L.; Shaibu, A.S. Using CERES-Maize model to determine the nitrogen fertilization requirements of early maturing maize in the Sudan Savanna of Nigeria. J. Plant Nutr. 2017, 40, 1066–1082. [Google Scholar] [CrossRef]
- Saseendran, S.A.; Ma, L.; Malone, R.; Heilman, P.; Ahuja, L.R.; Kanwar, R.S.; Karlen, D.L.; Hoogenboom, G. Simulating management effects on crop production, tile drainage, and water quality using RZWQM–DSSAT. Geoderma 2007, 140, 297–309. [Google Scholar] [CrossRef][Green Version]
- Dias, M.P.; Navaratne, C.M.; Weerasinghe, K.D.; Hettiarachchi, R.H. Application of DSSAT crop simulation model to identify the changes of rice growth and yield in Nilwala river basin for mid-centuries under changing climatic conditions. Procedia Food Sci. 2016, 6, 159–163. [Google Scholar] [CrossRef]
- Chandran, M.A.; Banerjee, S.; Mukherjee, A.; Nanda, M.K.; Mondal, S.; Kumari, V.V. Evaluating the impact of projected climate on rice–wheat-groundnut cropping sequence in lower Gangetic plains of India: A study using multiple GCMs, DSSAT model, and long-term sequence analysis. Theor. Appl. Climatol. 2021, 145, 1243–1258. [Google Scholar] [CrossRef]
- Brooks, R.J.; Semanov, M.A.; Jamieson, P.D. Simplifying sirus: Sensitivity analysis and development of a meta-model for wheat yield prediction. Eur. J. Agron. 2001, 14, 43–60. [Google Scholar] [CrossRef]
- Landau, S.; Mitchell, R.A.C.; Barnett, V.; Colls, J.J.; Craigon, J.; Payne, R.W. A parsimonious, multiple-regression model of wheat yield response to environment. Agric. For. Meteorol. 2000, 101, 151–166. [Google Scholar] [CrossRef]
- Jagtap, S.S.; Jones, J.W. Adaptation and evaluation of the CROPGRO-soybean model to predict regional yield and production. Agric. Ecosyst. Environ. 2002, 93, 73–85. [Google Scholar] [CrossRef]
- Billé, A.G.; Rogna, M. The effect of weather conditions on fertilizer applications: A spatial dynamic panel data analysis. J. R. Stat. Soc. Ser. A (Stat. Soc.) 2022, 185, 3–36. [Google Scholar] [CrossRef]
- Jones, J.W.; Hoogenboom, G.; Porter, C.H.; Boote, K.J.; Batchelor, W.D.; Hunt, L.A.; Wilkens, P.W.; Singh, U.; Gijsman, A.J.; Ritchie, J.T. The DSSAT cropping system model Eur. J. Agron. 2003, 18, 235–265. [Google Scholar]
- Intaboot, N. The Study of Water Demand to Grow Rice in Thailand. In Proceedings of the 6th International Symposium on the Fusion of Science and Technologies (ISFT2017), Jeju, Korea, 17–21 July 2017; Available online: http://www.rdi.rmutsb.ac.th/2011/digipro/isft2017/CA/11.%5BCA003%5D_F.pdf (accessed on 1 July 2022).
- Amnuaylojaroen, T.; Chanvichit, P. Projection of near-future climate change and agricultural drought in Mainland Southeast Asia under RCP8.5. Clim. Change 2019, 155, 175–193. [Google Scholar] [CrossRef]
- Iacono, M.J.; Delamere, J.S.; Mlawer, E.J.; Shephard, M.W.; Clough, S.A.; Collins, W.D. Radiative forcing by long-lived greenhouse gases: Calculations with the AER radiative transfer models. J. Geophys. Res. 2008, 113, D13103. [Google Scholar] [CrossRef]
- Thompson, G.; Rasmussen, R.M.; Manning, K. Explicit forecasts of winter precipitation using an improved bulk microphysics scheme. Part I: Description and sensitivity analysis. Mon Weather. Rev. 2004, 132, 519–542. [Google Scholar] [CrossRef]
- Chen, F.; Dudhia, J. Coupling an advanced land-surface/hydrology model with the Penn State/NCAR MM5 modeling system. Part I: Model description and implementation. Mon. Weather. Rev. 2001, 129, 569–585. [Google Scholar] [CrossRef]
- Stauffer, D.R.; Seaman, N.L. Use of four-dimensional data assimilation in a limited area mesoscale model, Part 1: Experiments with synoptic-scale data. Mon. Weather. Rev. 1990, 118, 1250–1277. [Google Scholar] [CrossRef]
- Buddhaboon, C.; Kongton, S.; Jintrawet, A. Climate Scenario Verification; Impact on Rainfed Rice Production. Report of APN CAPABLE Project; Southeast Asia START Regional Center, Chulalongkorn University: Bangkok, Tailand, 2004; Available online: http://startcc.iwlearn.org/doc/Doc_eng_1.pdf (accessed on 6 July 2022).
- Jongkaewattana, S.; Vejpas, C. Validation of CERES-RICE Model. 2020. Available online: http://www.mcc.cmu.ac.th/research/DSSARM/ThaiRice/ricevalid.html (accessed on 4 December 2020).
- Gumel, D.Y.; Abdullah, A.M.; Sood, A.M.; Elhadia, R.E.; Jamalani, M.A.; Youssefa, K.A. Assessing paddy rice yield sensitivity to temperature and rainfall variability in Peninsular Malaysia using DSSAT model. Int. J. Appl. Environ. Sci. 2017, 12, 1521–1545. [Google Scholar]
- Nyang, A.W.; Mati, B.M.; Kalamwa, K.; Wanjogu, R.K.; Kiplagat, L.K. Estimating rice yield under changing weather conditions in Kenya using CERES rice model. Int. J. Agron. 2014, 26, 2014. [Google Scholar] [CrossRef][Green Version]
- Morita, S.; Yonemaru, J.-I.; Takanashi, J.-I. Grain growth and endosperm cell size under high night temperatures in rice (Oryza sativa L.). Ann. Bot. 2005, 95, 695–701. [Google Scholar] [CrossRef]
- Nguyen, N.V. Global Climate Changes and Rice Food Security; FAO: Rome, Italy, 2002. [Google Scholar]
- Abbas, S.; Mayo, Z.A. Impact of temperature and rainfall on rice production in Punjab, Pakistan. Environ. Dev. Sustain. 2021, 23, 1706–1728. [Google Scholar] [CrossRef]
- Gao, L.; Jin, Z.; Huang, Y.; Zhang, L. Rice clock model—A computer model to simulate rice development. Agric. For. Meteorol. 1992, 60, 1–16. [Google Scholar] [CrossRef]
- Jagadish, S.V.K.; Muthurajan, R.; Oane, R.; Wheeler, T.R.; Heuer, S.; Bennett, J.; Craufurd, P.Q. Physiological and proteomic approaches to dissect reproductive stage heat tolerance in rice (Oryza sativa L.). J. Exp. Bot. 2010, 61, 143–156. [Google Scholar] [CrossRef]
- Meisinger, J.J.; Palmer, R.E.; Timlin, D.J. Effects of tillage practices on drainage and nitrate leaching from winter wheat in the Northern Atlantic Coastal-Plain USA. Soil Tillage Res. 2015, 151, 18–27. [Google Scholar] [CrossRef]
- Fang, H. Impacts of soil conservation measures on runoff and soil loss in a hilly region, Northern China. Agric. Water Manag. 2021, 247, 106740. [Google Scholar]
- Yang, T.; Zeng, Y.; Sun, Y.; Zhang, J.; Tan, X.; Zeng, Y.; Huang, S.; Pan, X. Experimental warming reduces fertilizer nitrogen use efficiency in a double rice cropping system. Plant Soil Environ. 2019, 65, 483–489. [Google Scholar] [CrossRef]
- Ju, X.T.; Xing, G.X.; Chen, X.P.; Zhang, S.L.; Zhang, L.J.; Liu, X.J.; Cui, Z.L.; Yin, B.; Christie, P.; Zhu, Z.L.; et al. Reducing environmental risk by improving N management in intensive Chinese agricultural systems. Proc. Natl. Acad. Sci. USA 2009, 106, 3041–3046. [Google Scholar] [CrossRef]
- Xu, Y.; Guan, X.; Han, Z.; Zhou, L.; Zhang, Y.; Asad, M.A.U.; Wang, Z.; Jin, R.; Pan, G.; Cheng, F. Combined Effect of Nitrogen Fertilizer Application and High Temperature on Grain Quality Properties of Cooked Rice. Front. Plant Sci. 2022, 13, 874033. [Google Scholar] [CrossRef]
- Wei, H.Y.; Zhu, Y.; Qiu, S.; Han, C.; Hu, L.; Xu, D.; Zhou, N.; Xing, Z.; Hu, Y.; Cui, P.; et al. Combined effect of shading time and nitrogen level on grain filling and grain quality in japonica super rice. J. Integr. Agric. 2018, 17, 2405–2417. [Google Scholar] [CrossRef]
- Yang, L.X.; Wang, Y.L.; Dong, G.C.; Gu, H.; Huang, J.; Zhu, J.; Yang, H.; Liu, Z.; Han, Y. The impact of free-air CO2 enrichment (FACE) and nitrogen supply on grain quality of rice. Field Crop. Res. 2007, 102, 128–140. [Google Scholar] [CrossRef]
- Ning, H.F.; Sun, J.S.; Liu, H.; Gao, Y.; Shen, X.; Wang, G.; Zhang, K. The effects of nitrogen application rate on the grain physicochemical properties of japonica rice under controlled and flooding irrigation. J. Sci. Food Agric. 2020, 101, 2428–2438. [Google Scholar] [CrossRef]
- Mitsui, T.; Yamakawa, H.; Kobata, T. Molecular physiological aspects of chalking mechanism in rice grains under high-temperature stress. Plant Prod. Sci. 2016, 19, 22–29. [Google Scholar] [CrossRef]
- Cheng, C.; Ali, A.; Shi, Q.H.; Zeng, Y.; Tan, X.; Shang, Q.; Huang, S.; Xie, X.; Zeng, Y. Response of chalkiness in high-quality rice (Oryza sativa L.) to temperature across different ecological regions. J. Cereal Sci. 2019, 87, 39–45. [Google Scholar] [CrossRef]
- Jiang, Z.; Raghavan, S.V.; Hur, J.; Sun, Y.; Liong, S.Y.; Nguyen, V.Q.; Van Pham Dang, T. Future changes in rice yields over the Mekong River Delta due to climate change—Alarming or alerting? Theor. Appl. Climatol. 2019, 137, 545–555. [Google Scholar] [CrossRef]
- Deng, M.H.; Shi, X.J.; Tian, Y.H.; Yin, B.; Zhang, S.L.; Zhu, Z.L.; Kimura, S.D. Optimizing nitrogen fertilizer application for rice production in the Taihu Lake region, China. Pedosphere 2012, 22, 48–57. [Google Scholar] [CrossRef]
- Woli, K.P.; Nagumo, T.; Lie, L.; Hatano, R. Evaluation of the impact of paddy fields on stream water nitrogen concentration in central Hokkaido. Soil Sci. Plant Nutr. 2004, 50, 45–55. [Google Scholar] [CrossRef]
- Ghoneim, A.M.; Gewaily, E.E.; Osman, M.M. Effects of nitrogen levels on growth, yield and nitrogen use efficiency of some newly released Egyptian rice genotypes. Open Agric. 2018, 3, 310–318. [Google Scholar] [CrossRef]
- Squires, E. The impact of different nitrogen fertilizer rates on soil characteristics, plant properties, and economic returns in a southeastern Minnesota cornfield. Available online: https://wp.stolaf.edu/naturallands/files/2015/08/Squires_2013.pdf (accessed on 1 July 2022).
- Sapkota, T.B.; Singh, L.K.; Yadav, A.K.; Khatri-Chhetri, A.; Jat, H.S.; Sharma, P.C.; Stirling, C.M. Identifying optimum rates of fertilizer nitrogen application to maximize economic return and minimize nitrous oxide emission from rice–wheat systems in the Indo-Gangetic Plains of India. Arch. Agron. Soil Sci. 2020, 66, 2039–2054. [Google Scholar] [CrossRef]
- Flores, I. Agroquímicos en China. In ICEX. Instituto de Comercio Exterior. Ministerio de Industria Cormercio y Turismo; Oficina Económica y Comercial de la Embajada de España en Shanghai: Shanghai, China, 2018. [Google Scholar]
- Ulrich-Schad, J.D.; de Jalón, S.G.; Babin, N.; Pape, A.; Prokopy, L.S. Measuring and understanding agricultural producers’ adoption of nutrient best management practices. J. Soil Water Conserv. 2017, 72, 506–518. [Google Scholar] [CrossRef]
- Xiang, L.; Li, Y.-W.; Liu, B.-L.; Zhao, H.-M.; Li, H.; Cai, Q.-Y.; Mo, C.-H.; Wong, M.-H.; Li, Q.X. High ecological and human health risks from microcystins in vegetable fields in southern China. Environ. Int. 2019, 133, 105142. [Google Scholar] [CrossRef]
- Feng, H.; Clara, T.; Huang, F.; Wei, J.; Yang, F. Identification and characterization of the dominant Microcystissp cyanobacteria detected in Lake Dong Ting, China. J. Toxicol. Environ. Health Part A 2019, 82, 1143–1150. [Google Scholar] [CrossRef]
- Sutton, M.; Raghuram, N.; Adhya, T.K.; Baron, J.; Cox, C.; de Vries, W.; Hicks, K.; Howard, C.; Ju, X.; Kanter, D. The Nitrogen Fix: From Nitrogen Cycle Pollution to Nitrogen Circular Economy. In Frontiers 2018/19: Emerging Issues of Environmental Concern; Pinya, S., Ed.; United Nations Environment Programme: Nairobi, Kenya, 2019; pp. 52–64. [Google Scholar]
- Beeckman, F.; Motte, H.; Beeckman, T. Nitrification in agricultural soils: Impact, actors and mitigation. Curr. Opin. Biotechnol. 2018, 50, 166–173. [Google Scholar] [CrossRef]
- Daxini, A.; Ryan, M.; O’Donoghue, C.; Barnes, A.P. Understanding farmers’ intentions to follow a nutrient management plan using the theory of planned behaviour. Land Use Policy 2019, 85, 428–437. [Google Scholar] [CrossRef]
- Berbel, J.; Esteban, E. Droughts as a catalyst for water policy change. Analysis of Spain, Australia (MDB), and California. Glob. Environ. Change 2019, 58, 101969. [Google Scholar] [CrossRef]
- Chen, Y.-H.; Wen, X.-W.; Wang, B.; Nie, P.Y. Agricultural pollution an dregulation: How to subsidize agriculture. J. Clean. Prod. 2017, 164, 258–264. [Google Scholar] [CrossRef]
Publisher’s Note: MDPI stays neutral with regard to jurisdictional claims in published maps and institutional affiliations. |
© 2022 by the authors. Licensee MDPI, Basel, Switzerland. This article is an open access article distributed under the terms and conditions of the Creative Commons Attribution (CC BY) license (https://creativecommons.org/licenses/by/4.0/).