
On-Line Detection Method and Device for Moisture Content Measurement of Bales in a Square Baler


Abstract
:1. Introduction
2. Optimization of Capacitor Plates
2.1. Analysis of Detection Principle
2.2. Structural Design of Capacitor Plates
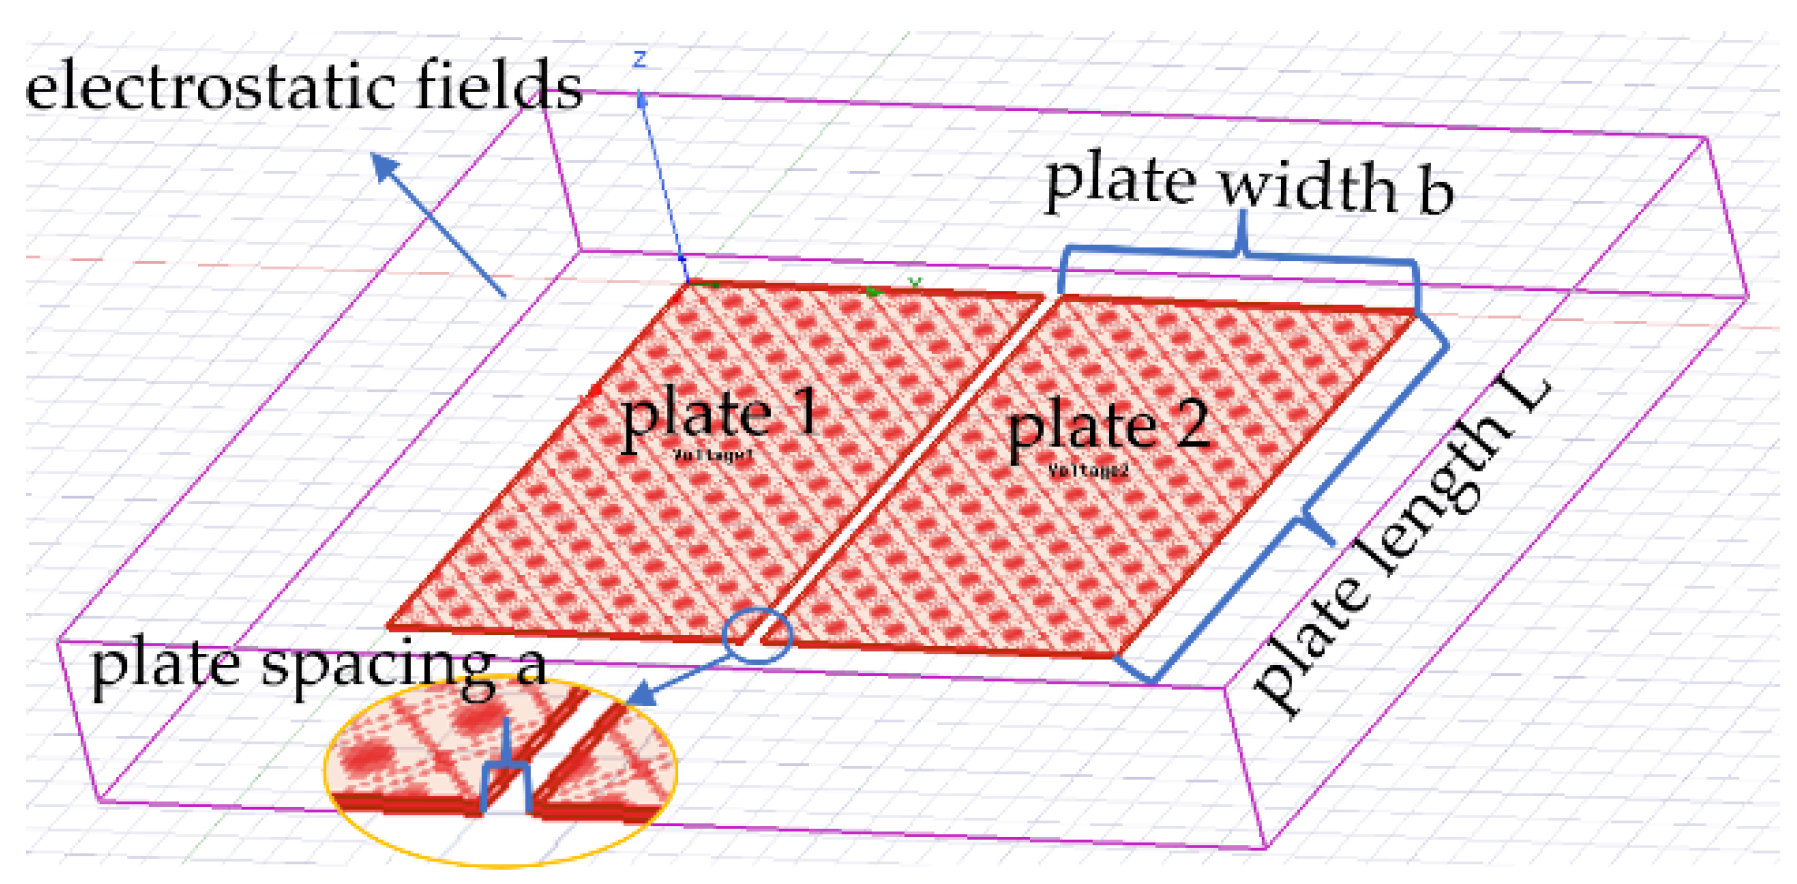
2.2.1. Establishment of Three-Dimensional Simulation Model of Capacitor Plates
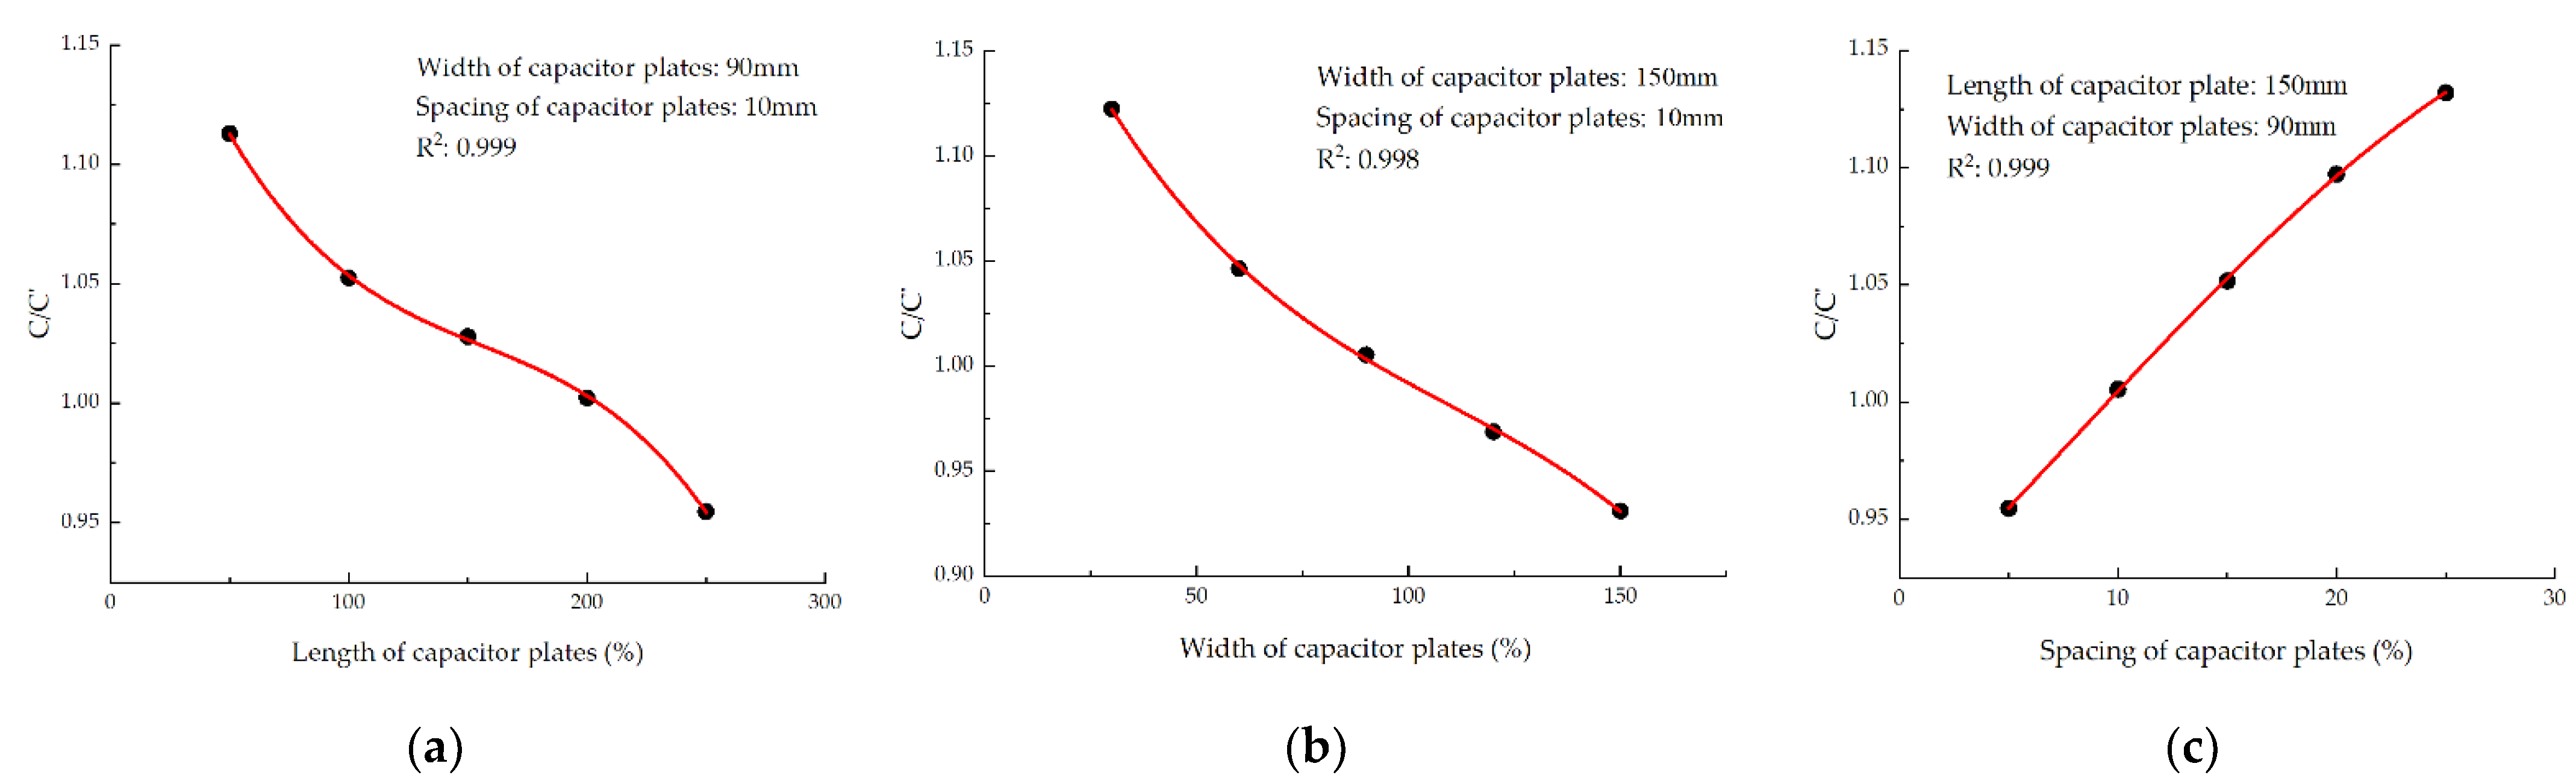
2.2.2. Simulation Analysis of Edge Effect
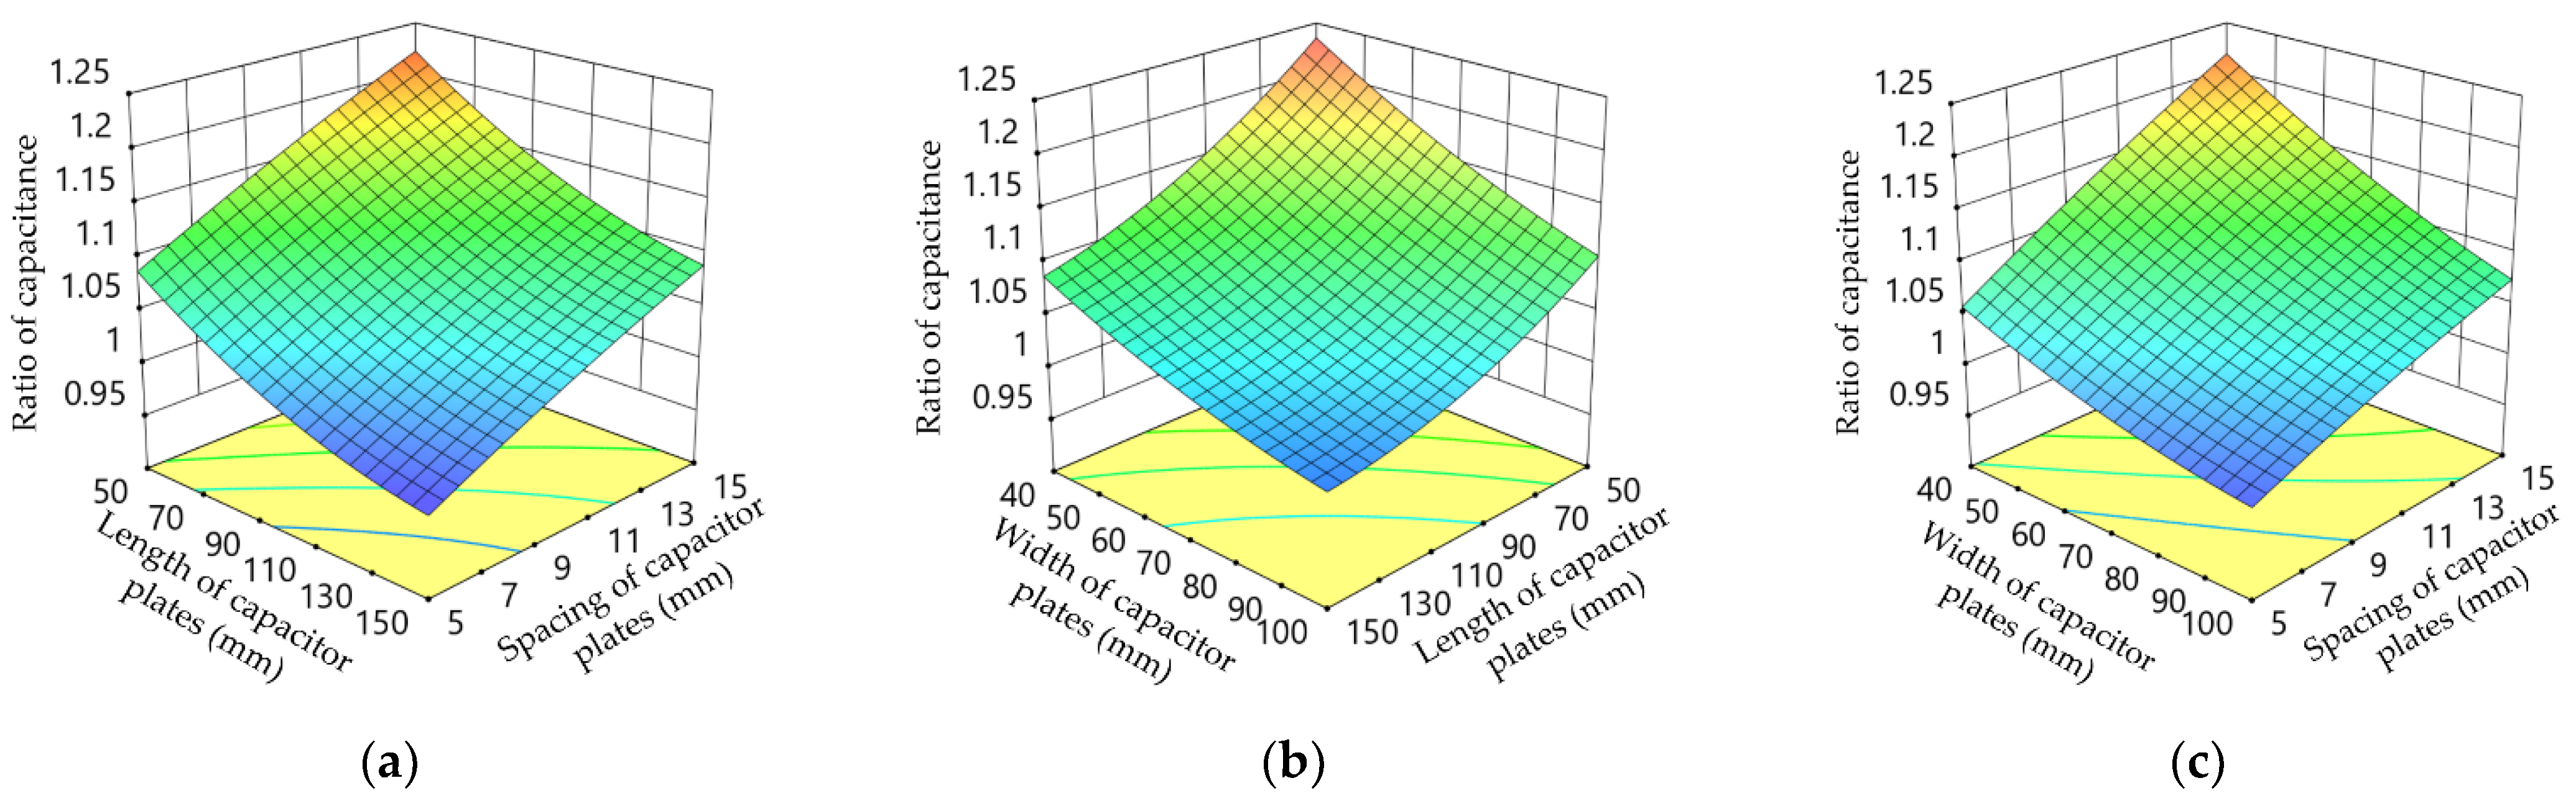
2.2.3. Optimization of Structural Parameters of Capacitor Plates
3. Materials and Methods
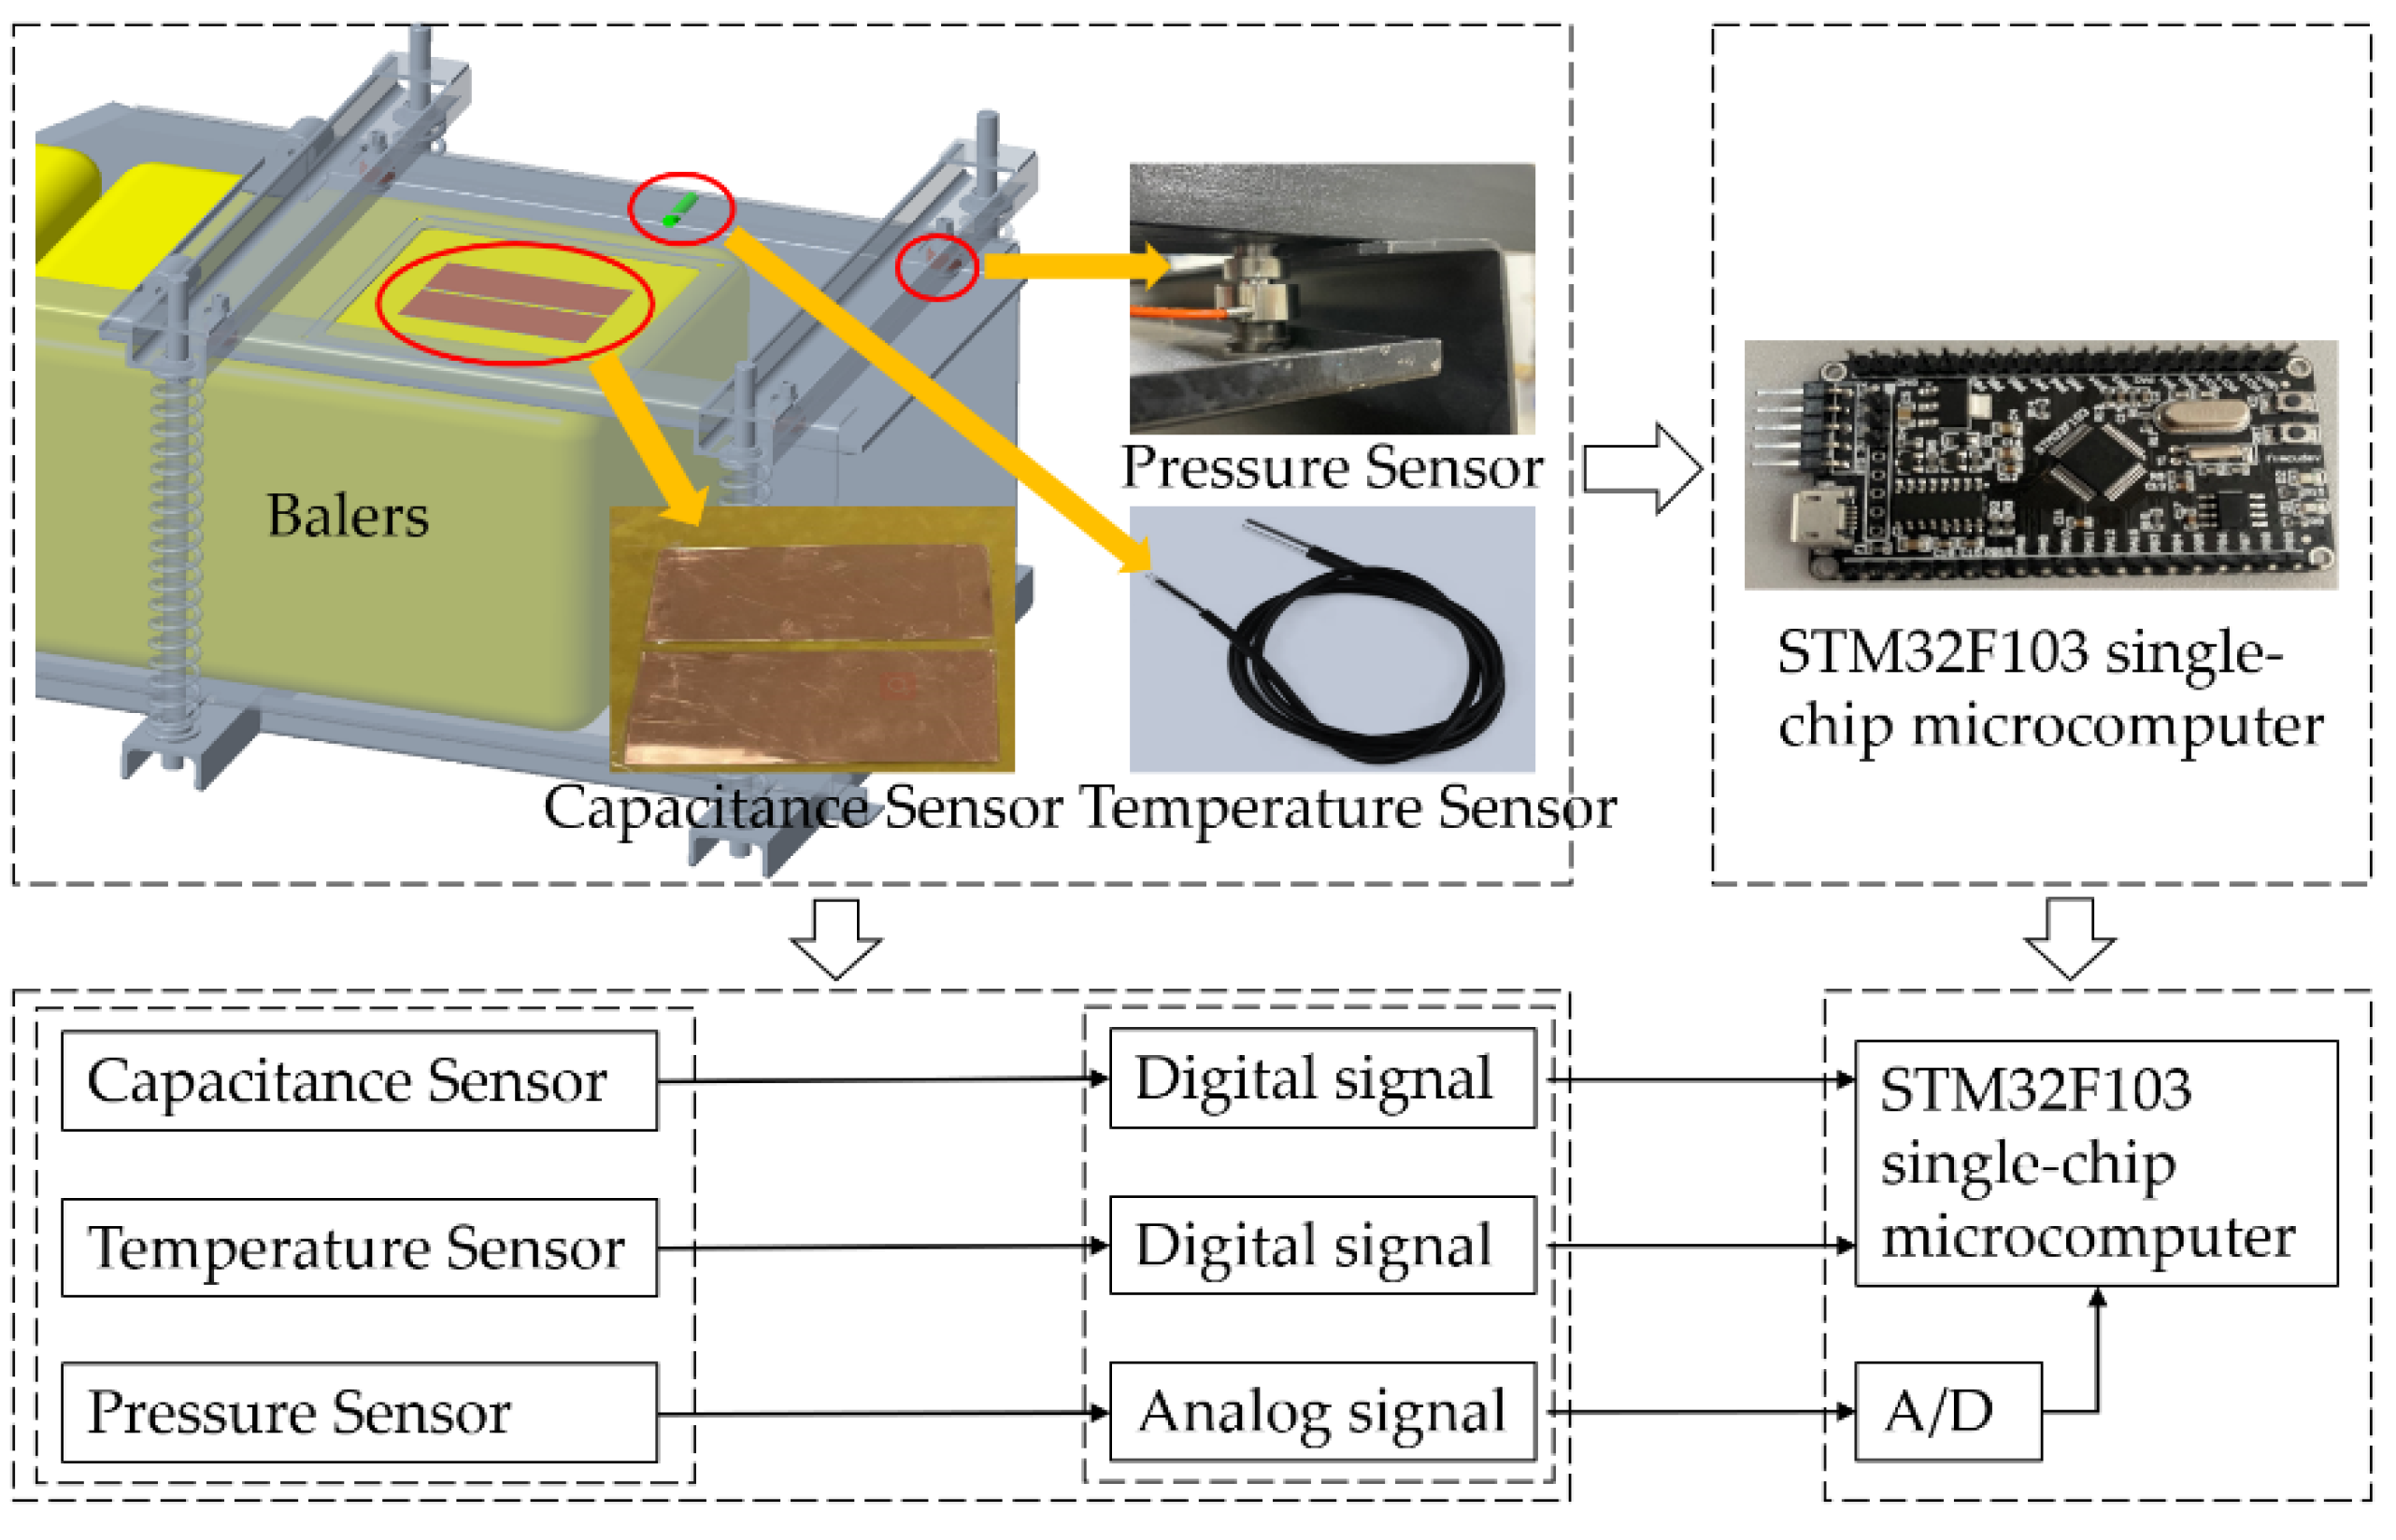
3.1. Hardware Design of Moisture Content Detection Device
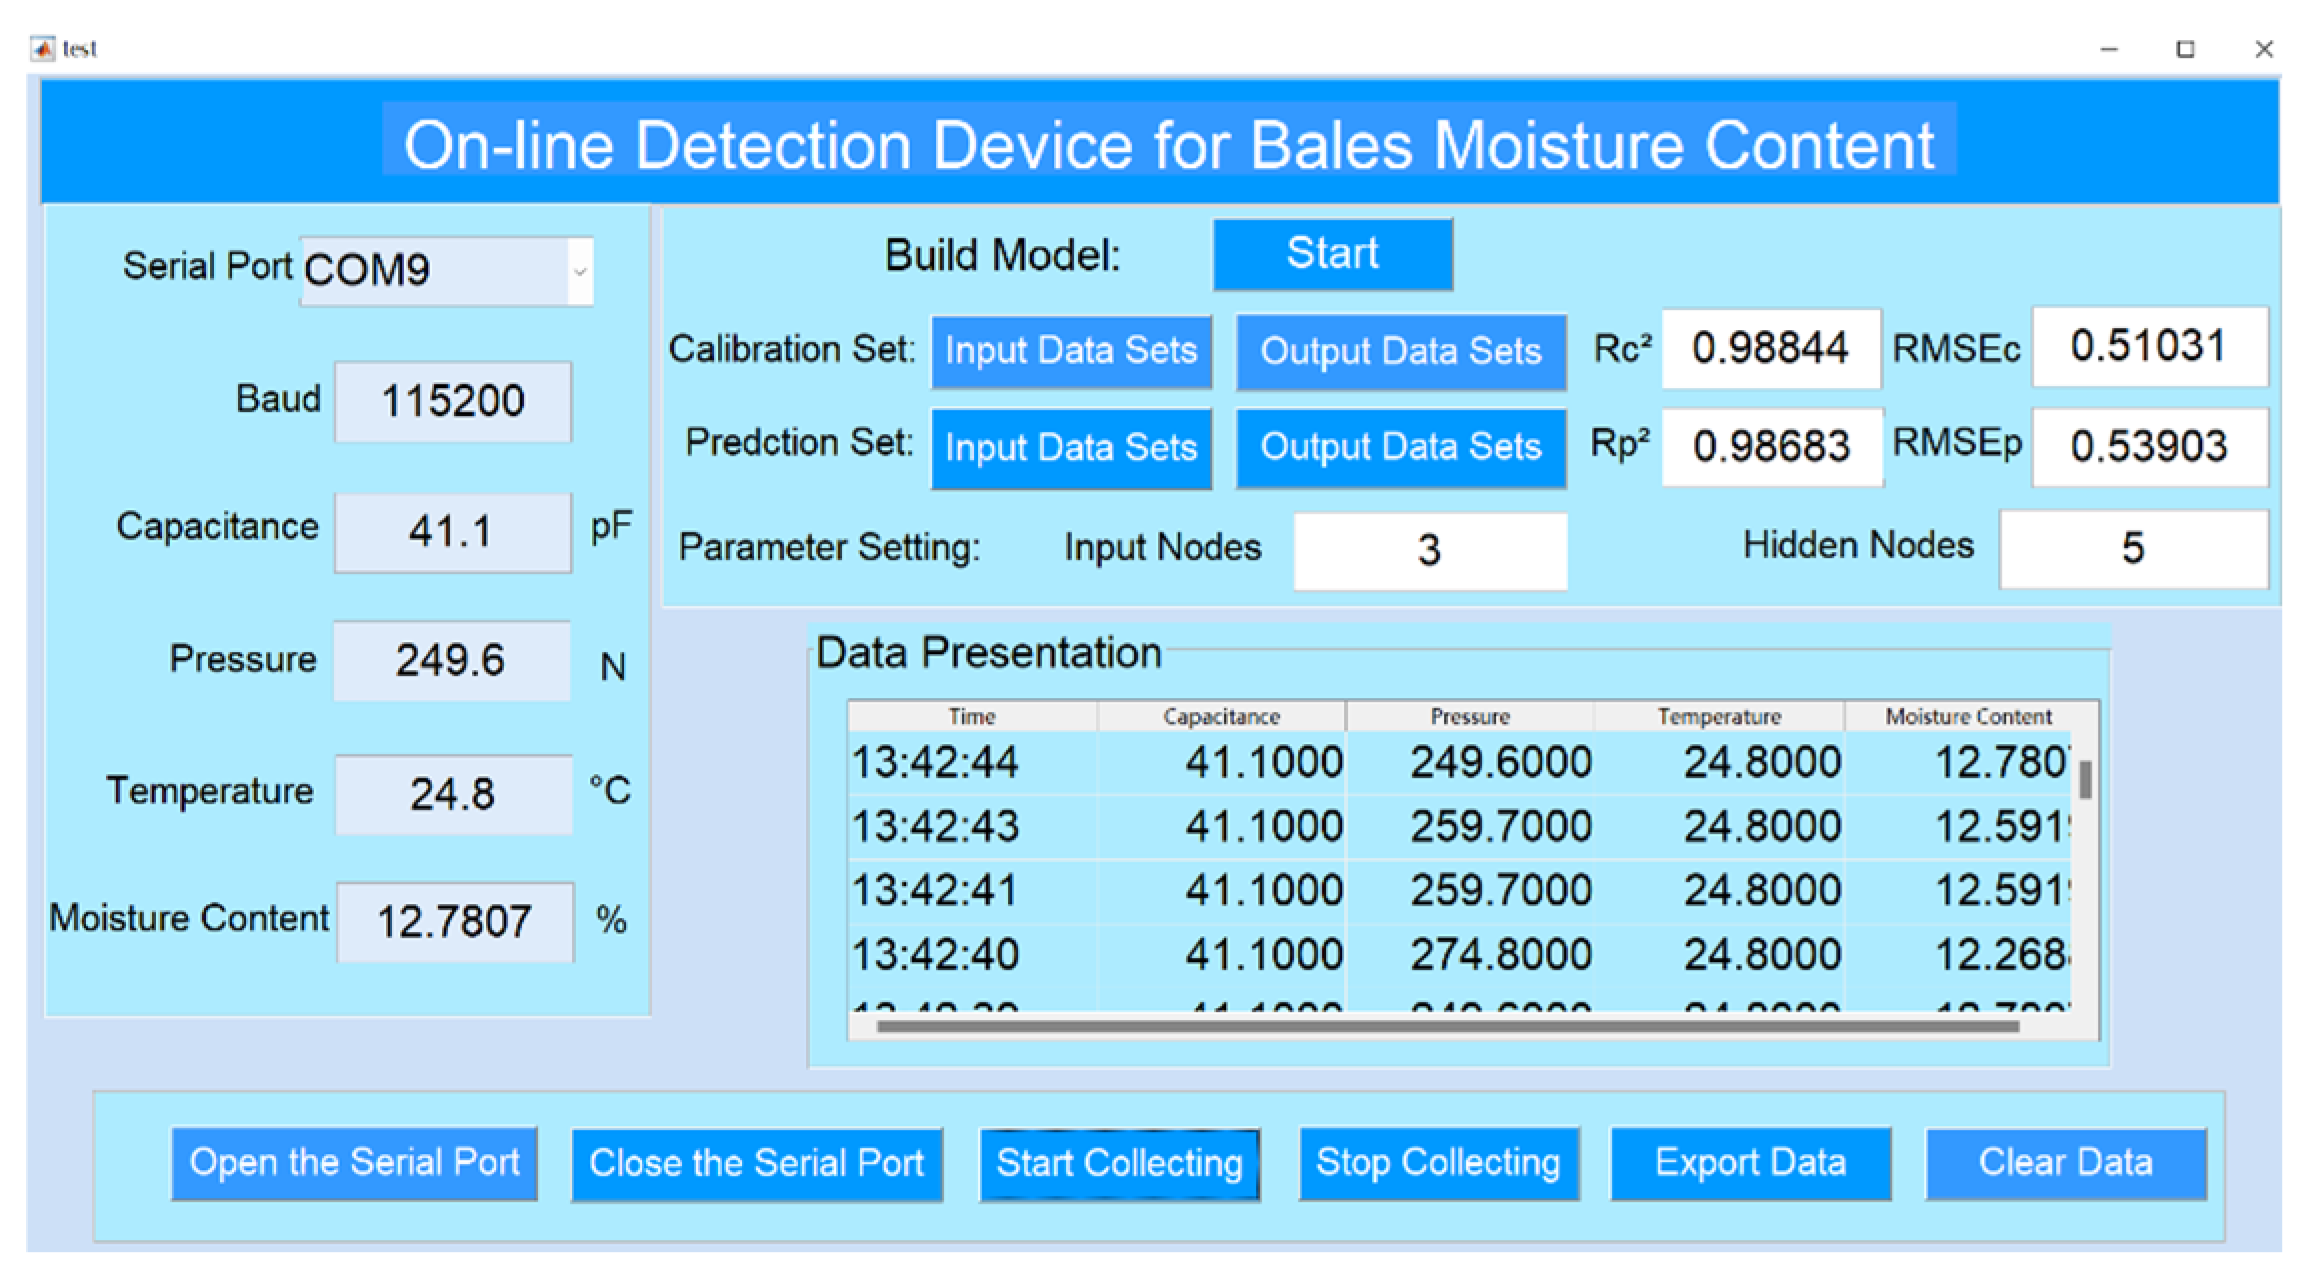
3.2. Software Design of Moisture Content Detection Device
3.3. Materials and Methods
3.3.1. Test Materials
3.3.2. Test Equipment
3.4. Test Methods
4. Results and Discussion
4.1. Establishment of the MLR Model
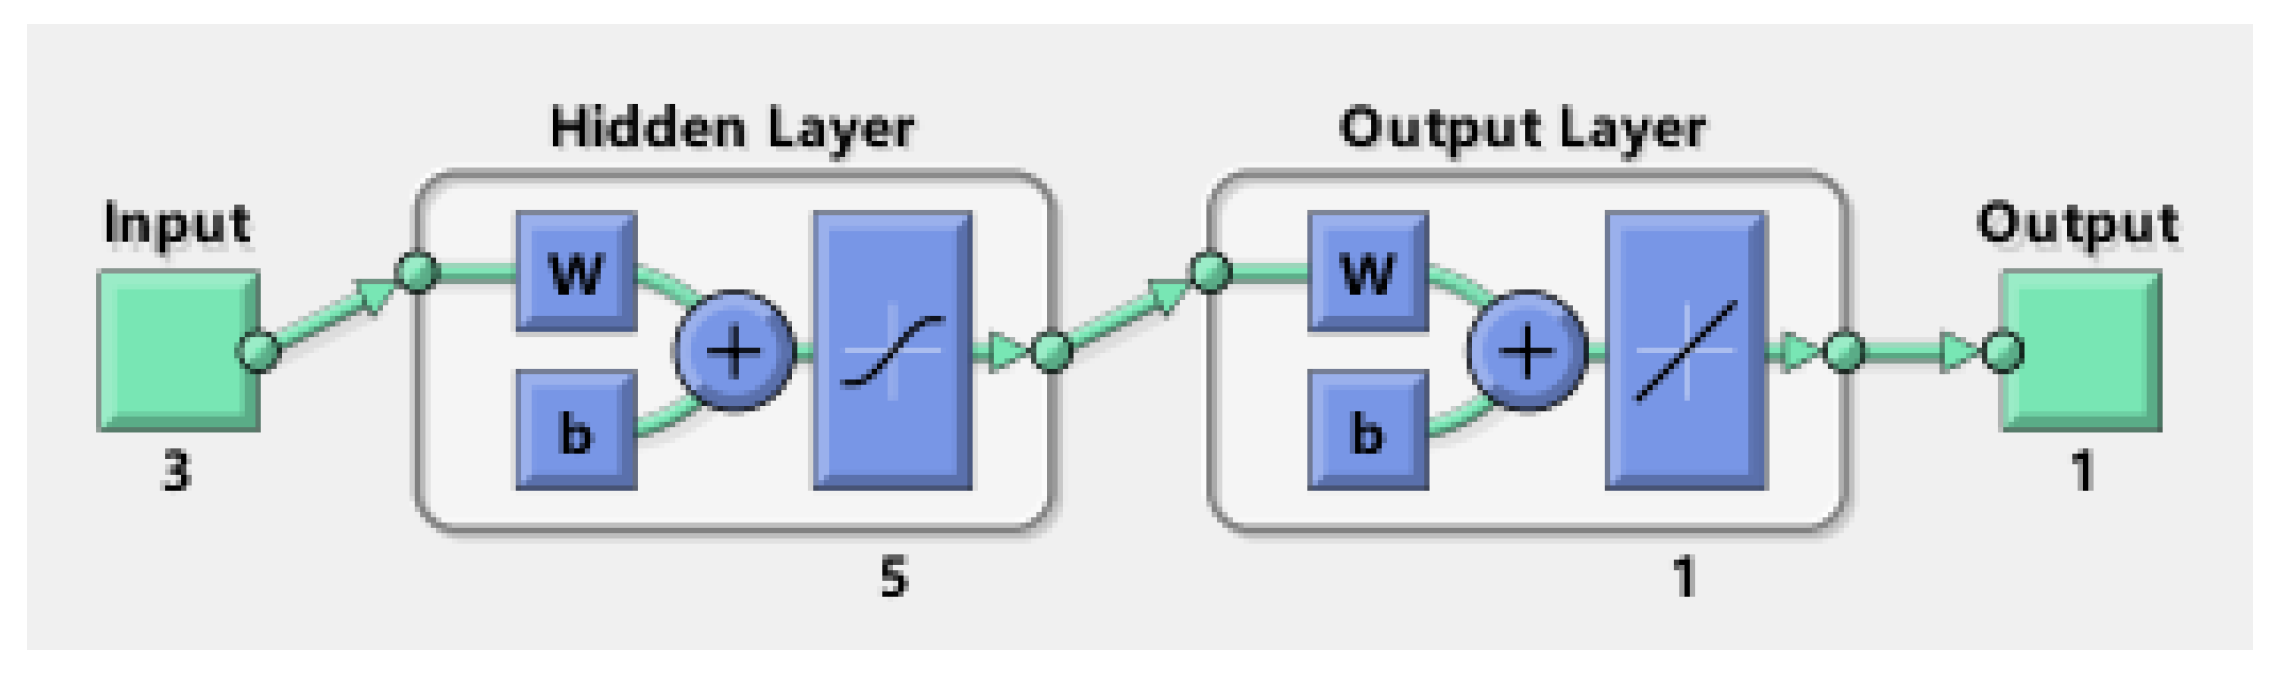
4.2. Establishment of the BPNN Model
4.3. Model Performance Verification and Comparative Analysis
5. Performance Test of Straw Bale Moisture Content On-line Detecting Device
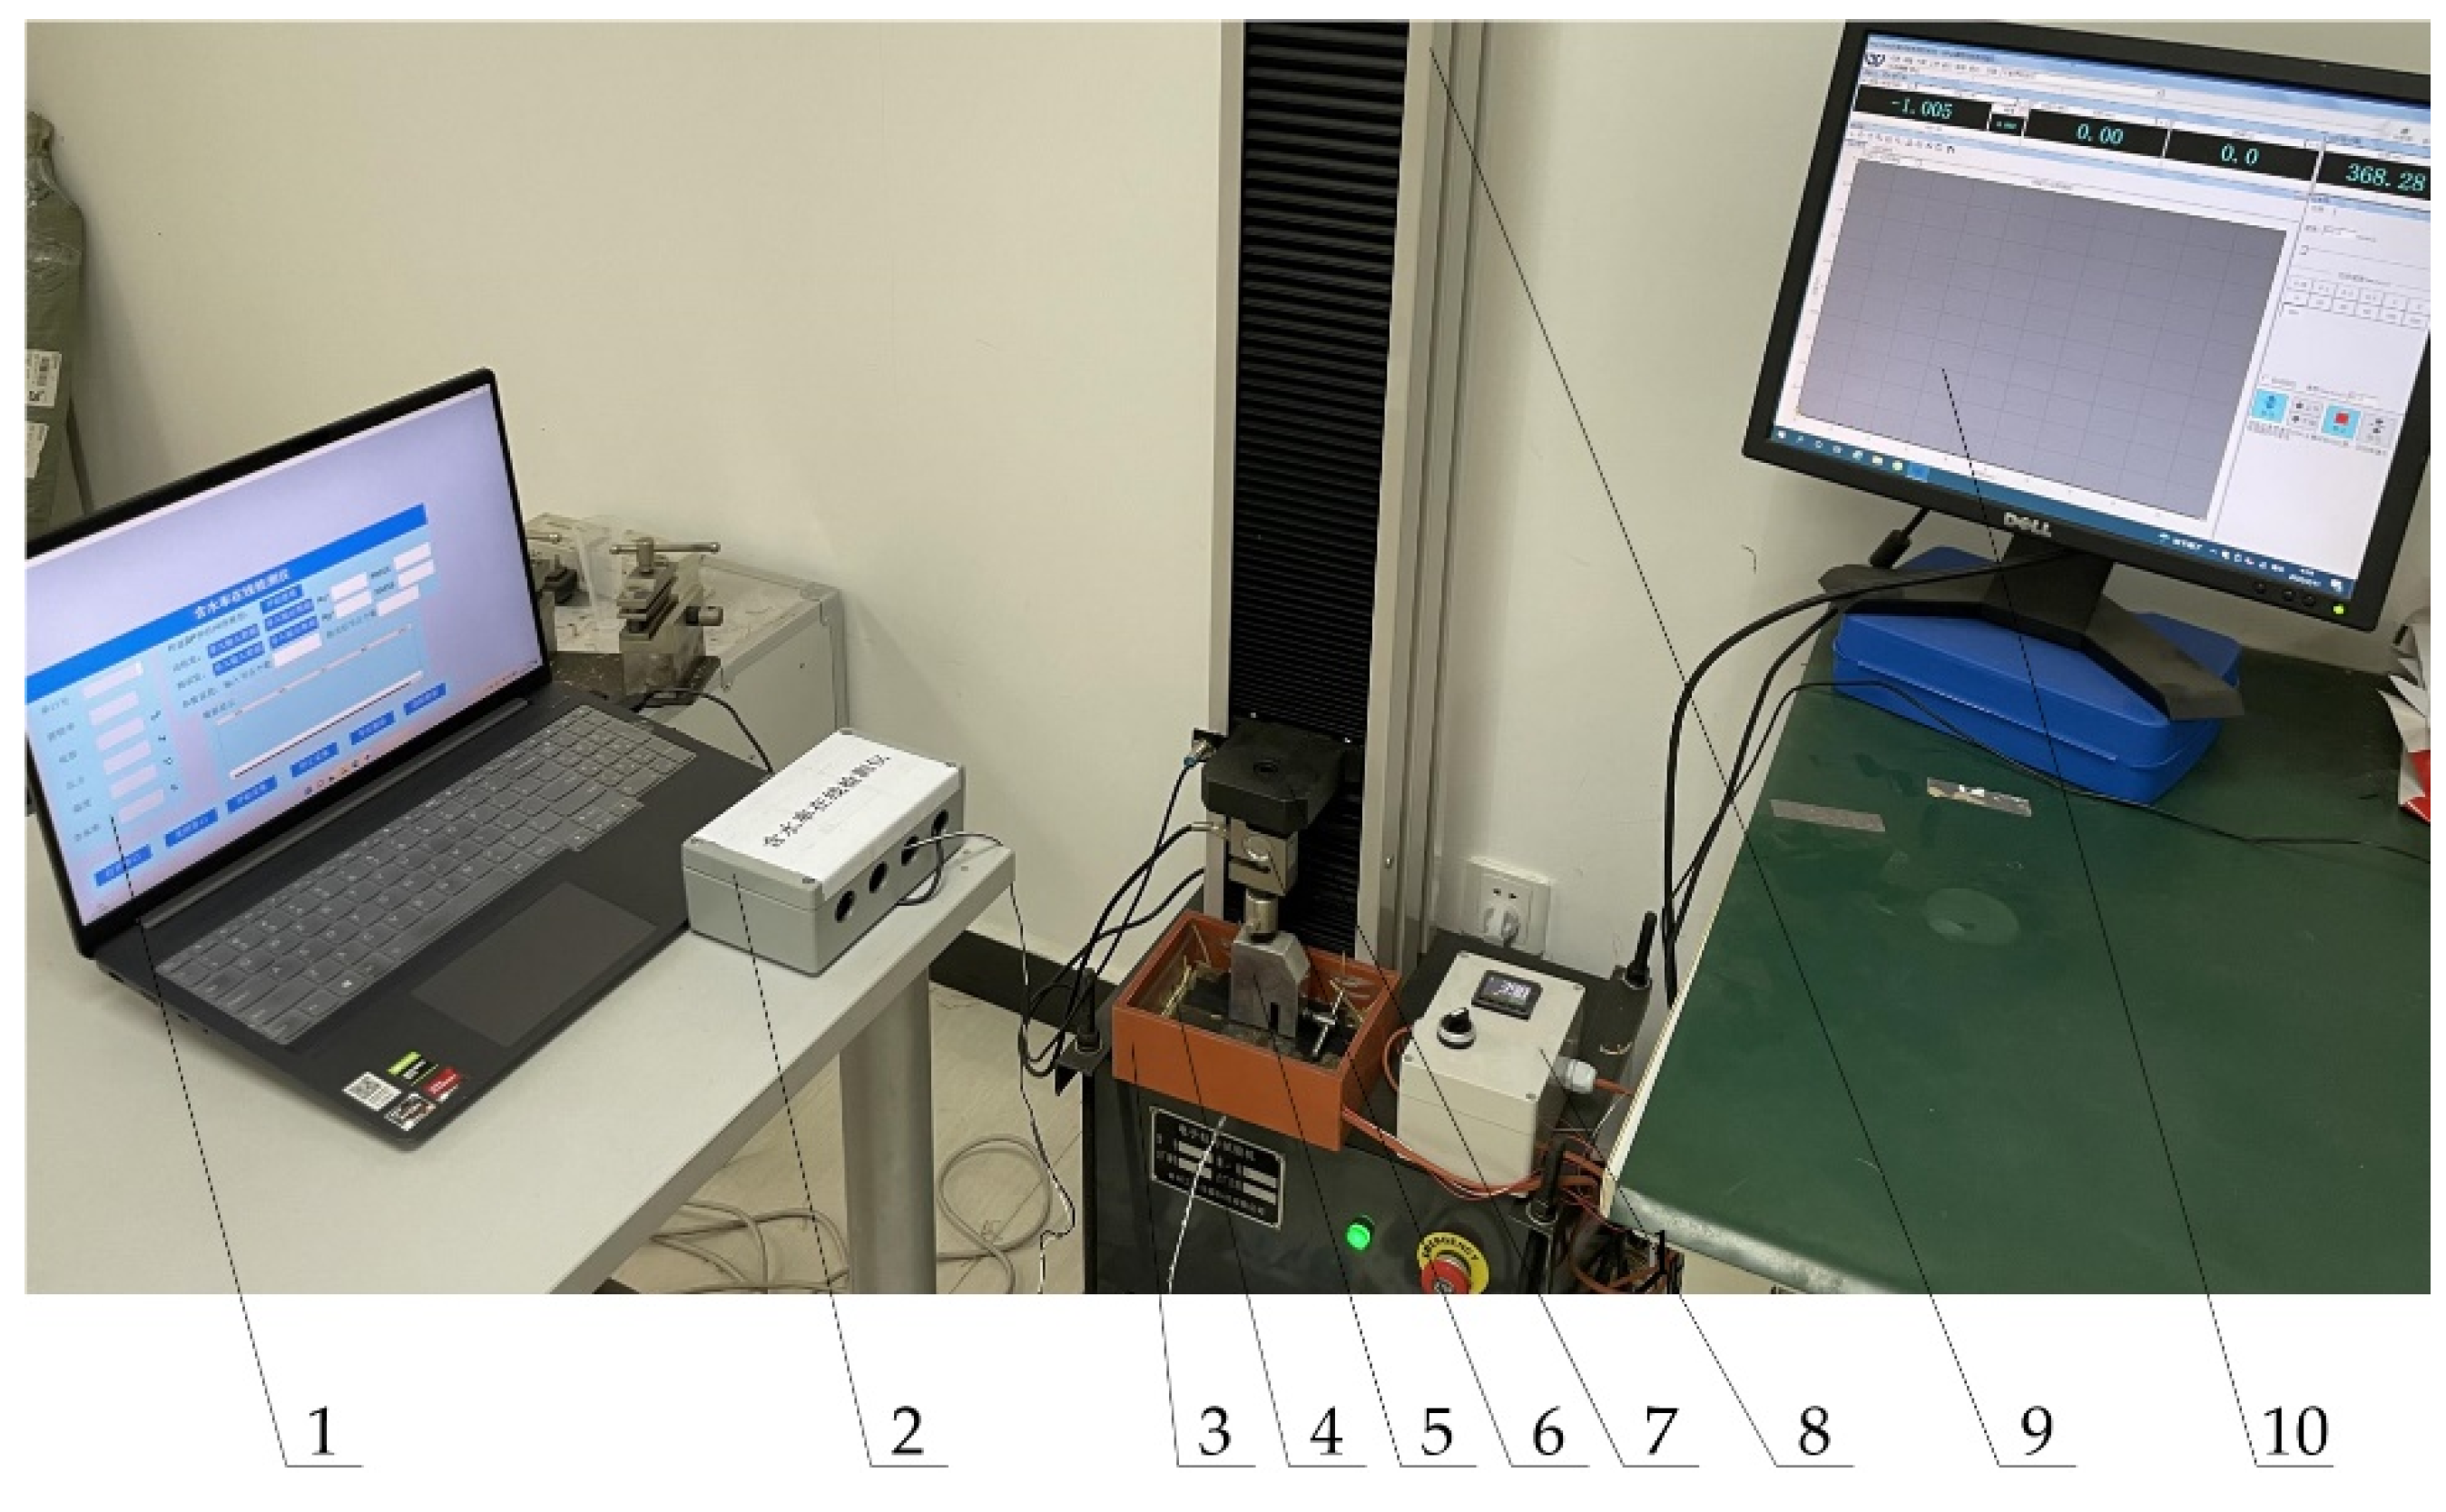
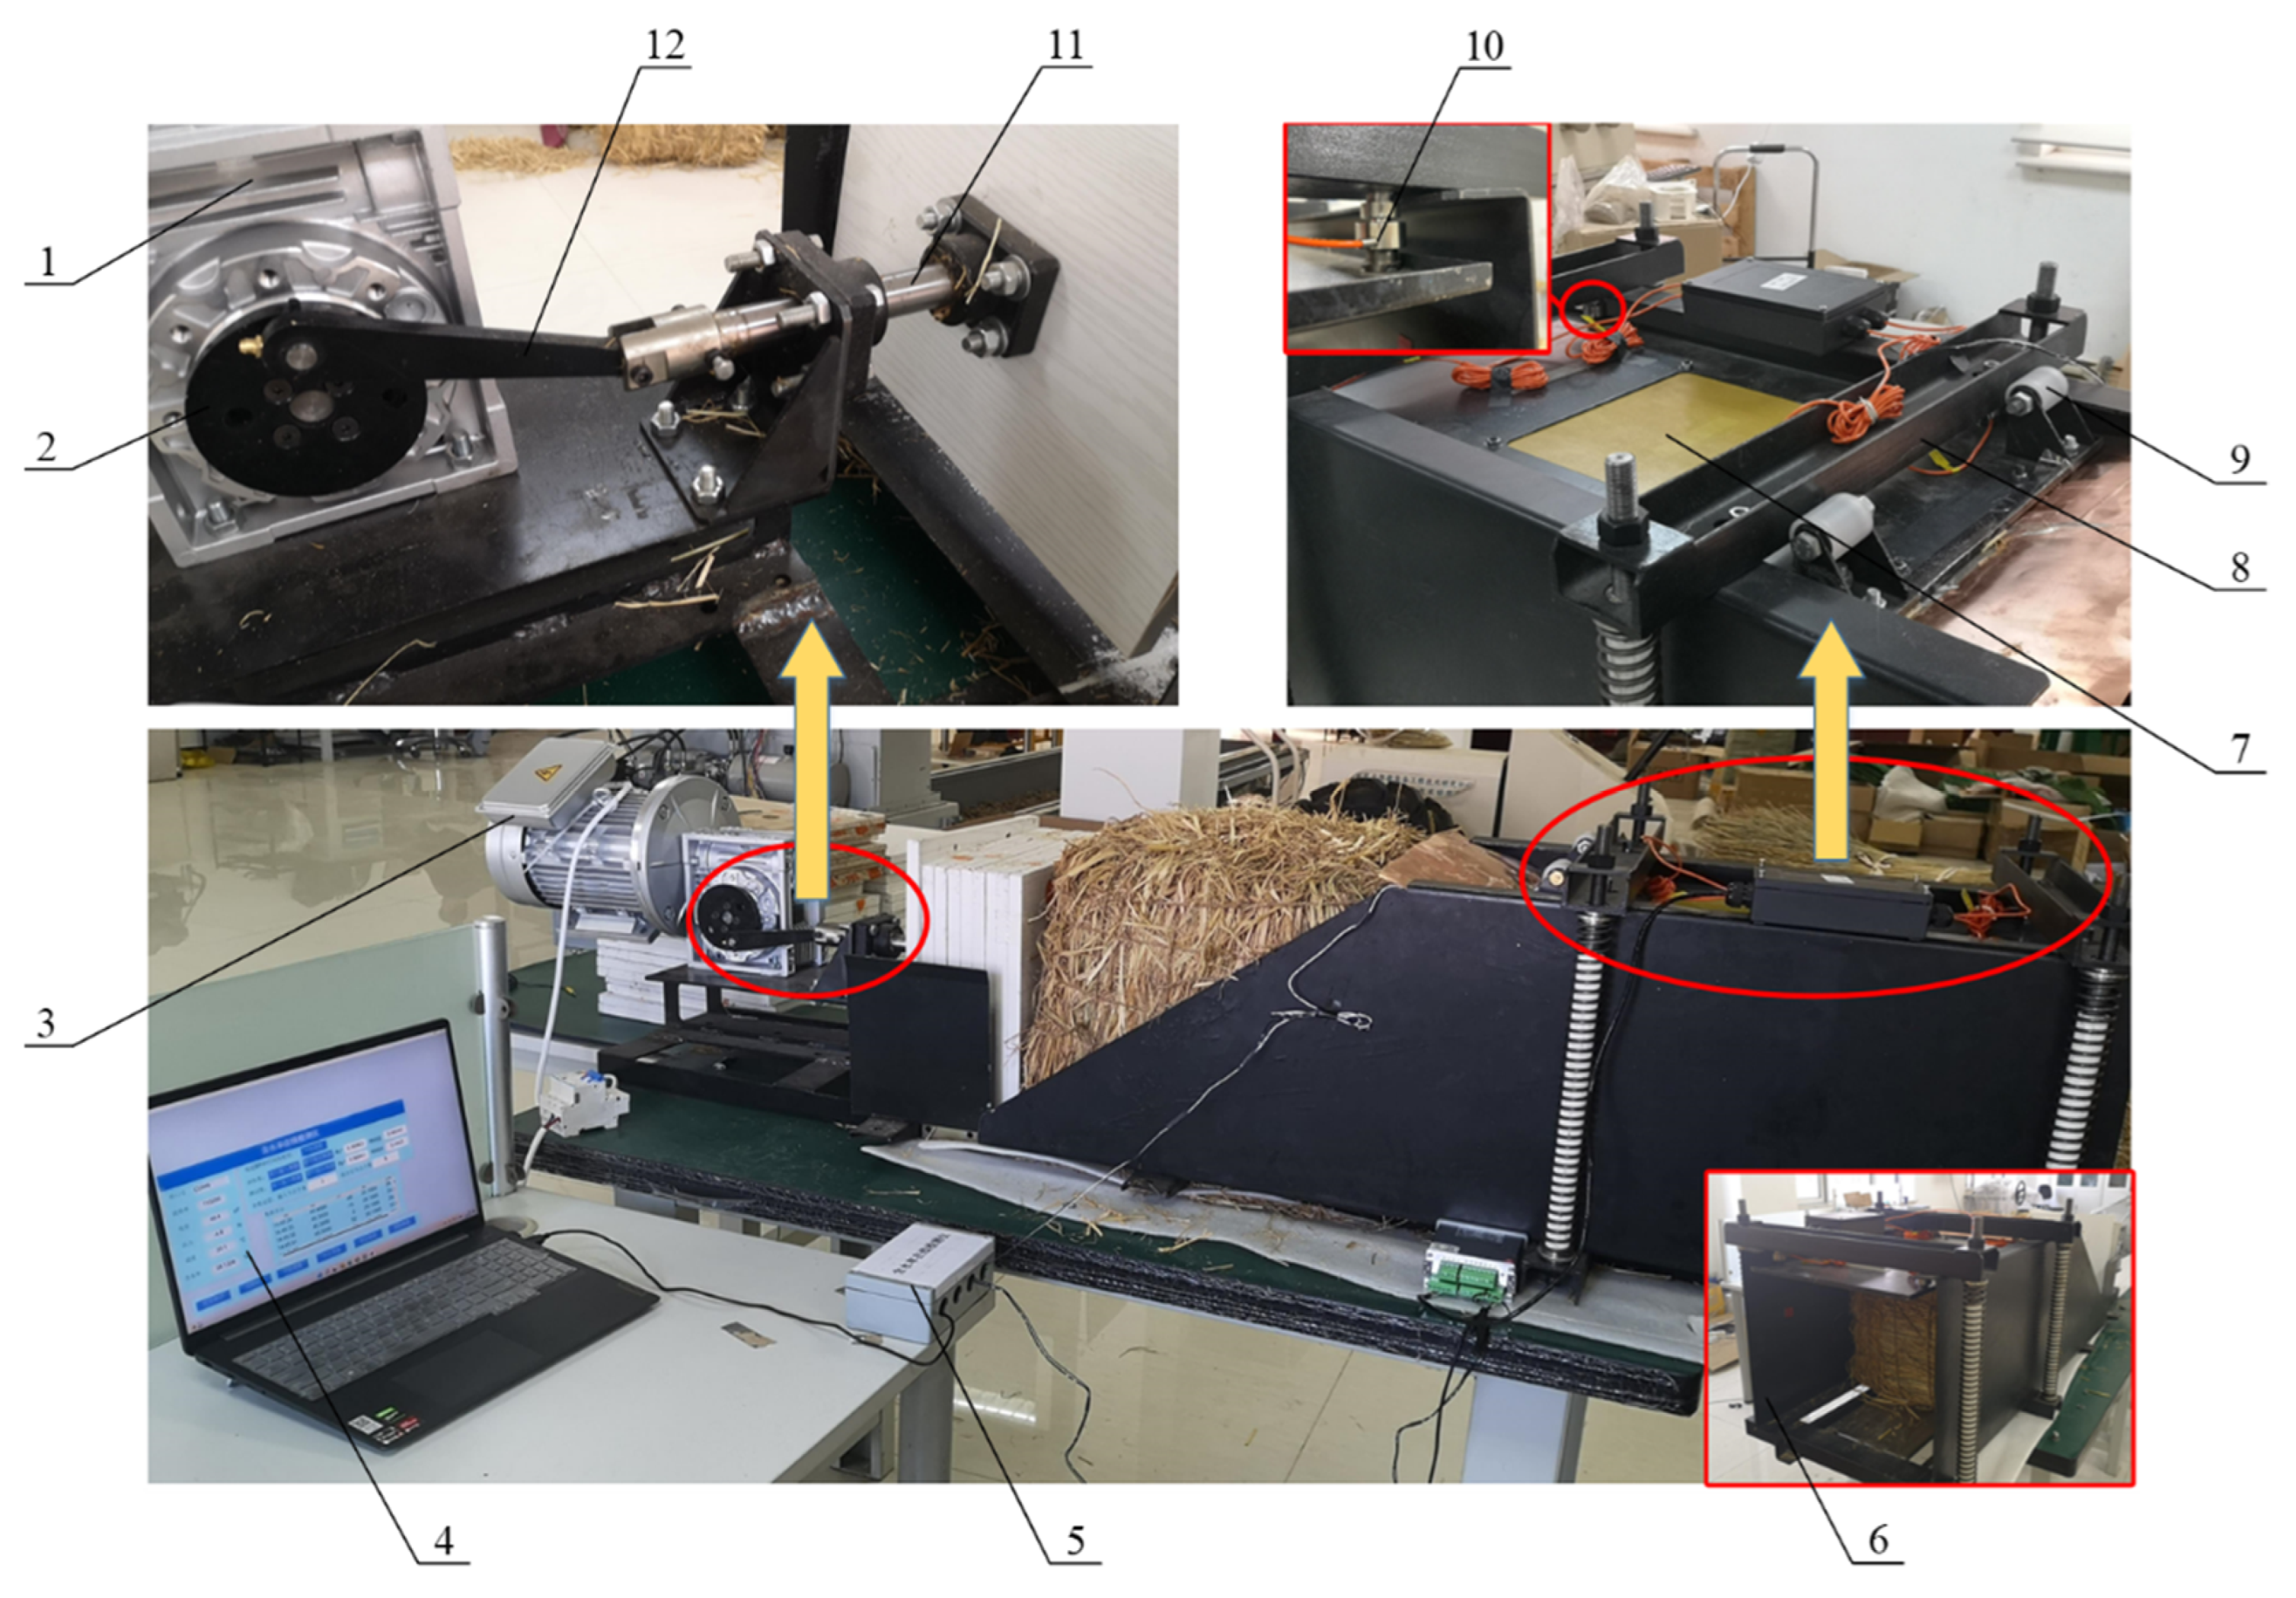
5.1. Design of Experiment Bench for Square Baler
5.2. Calibration Test of Moisture Content Detection Model
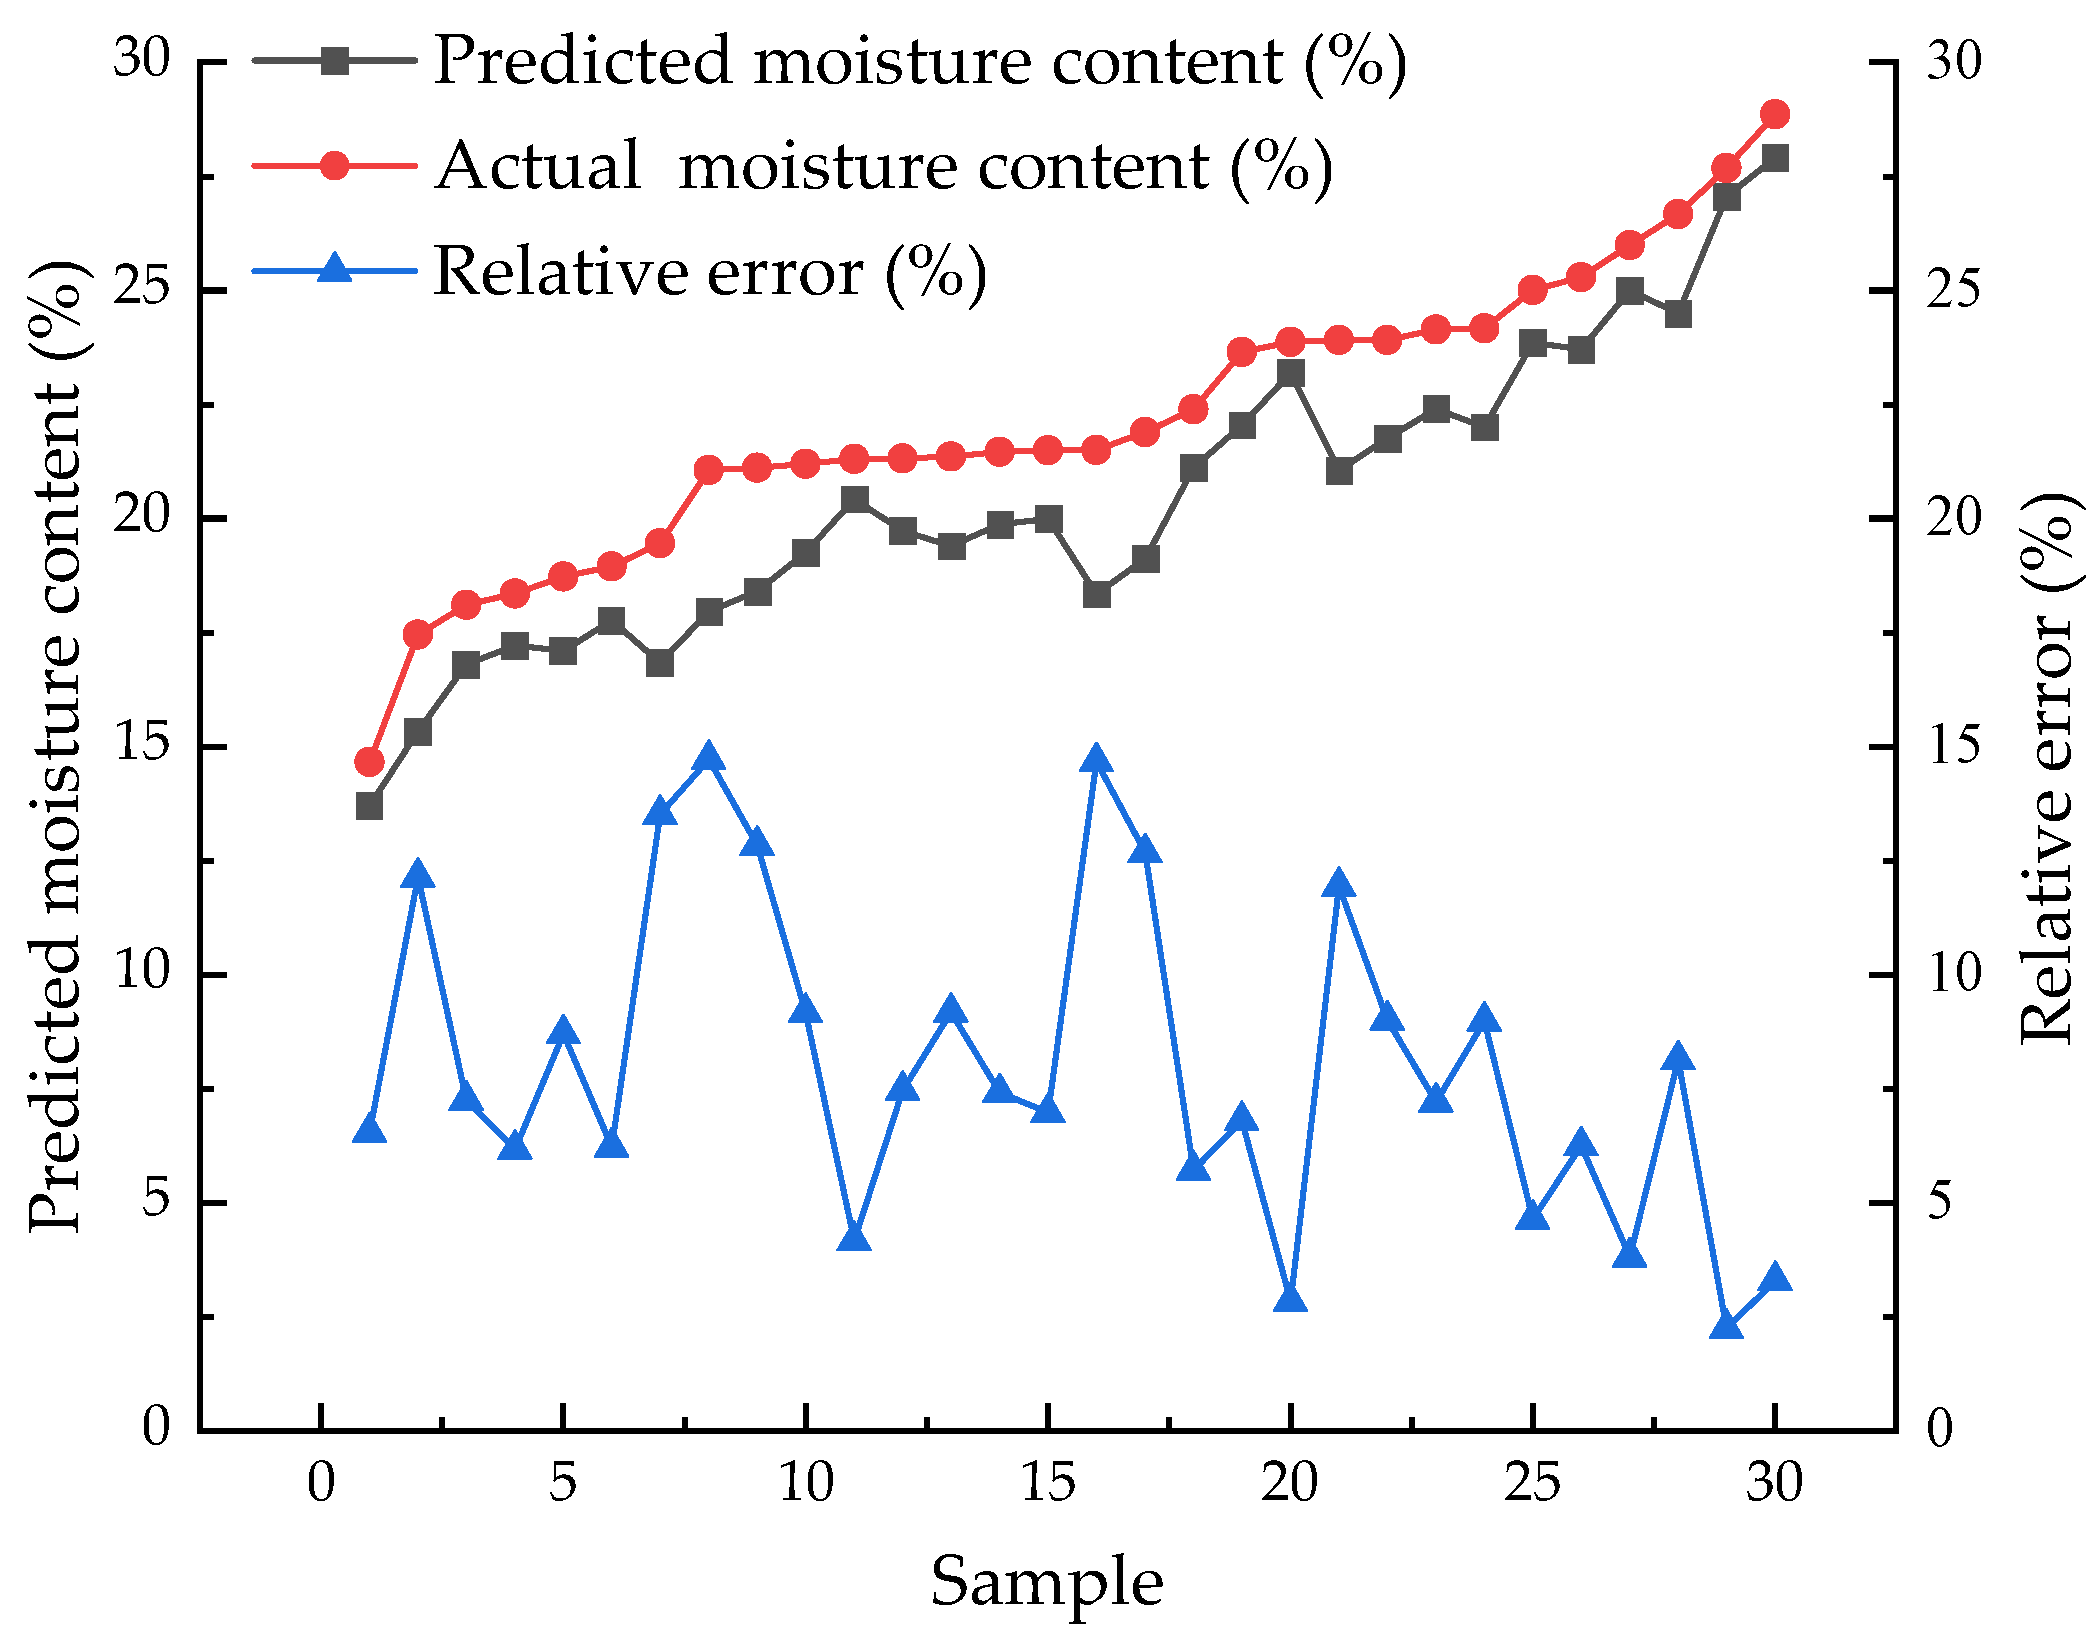
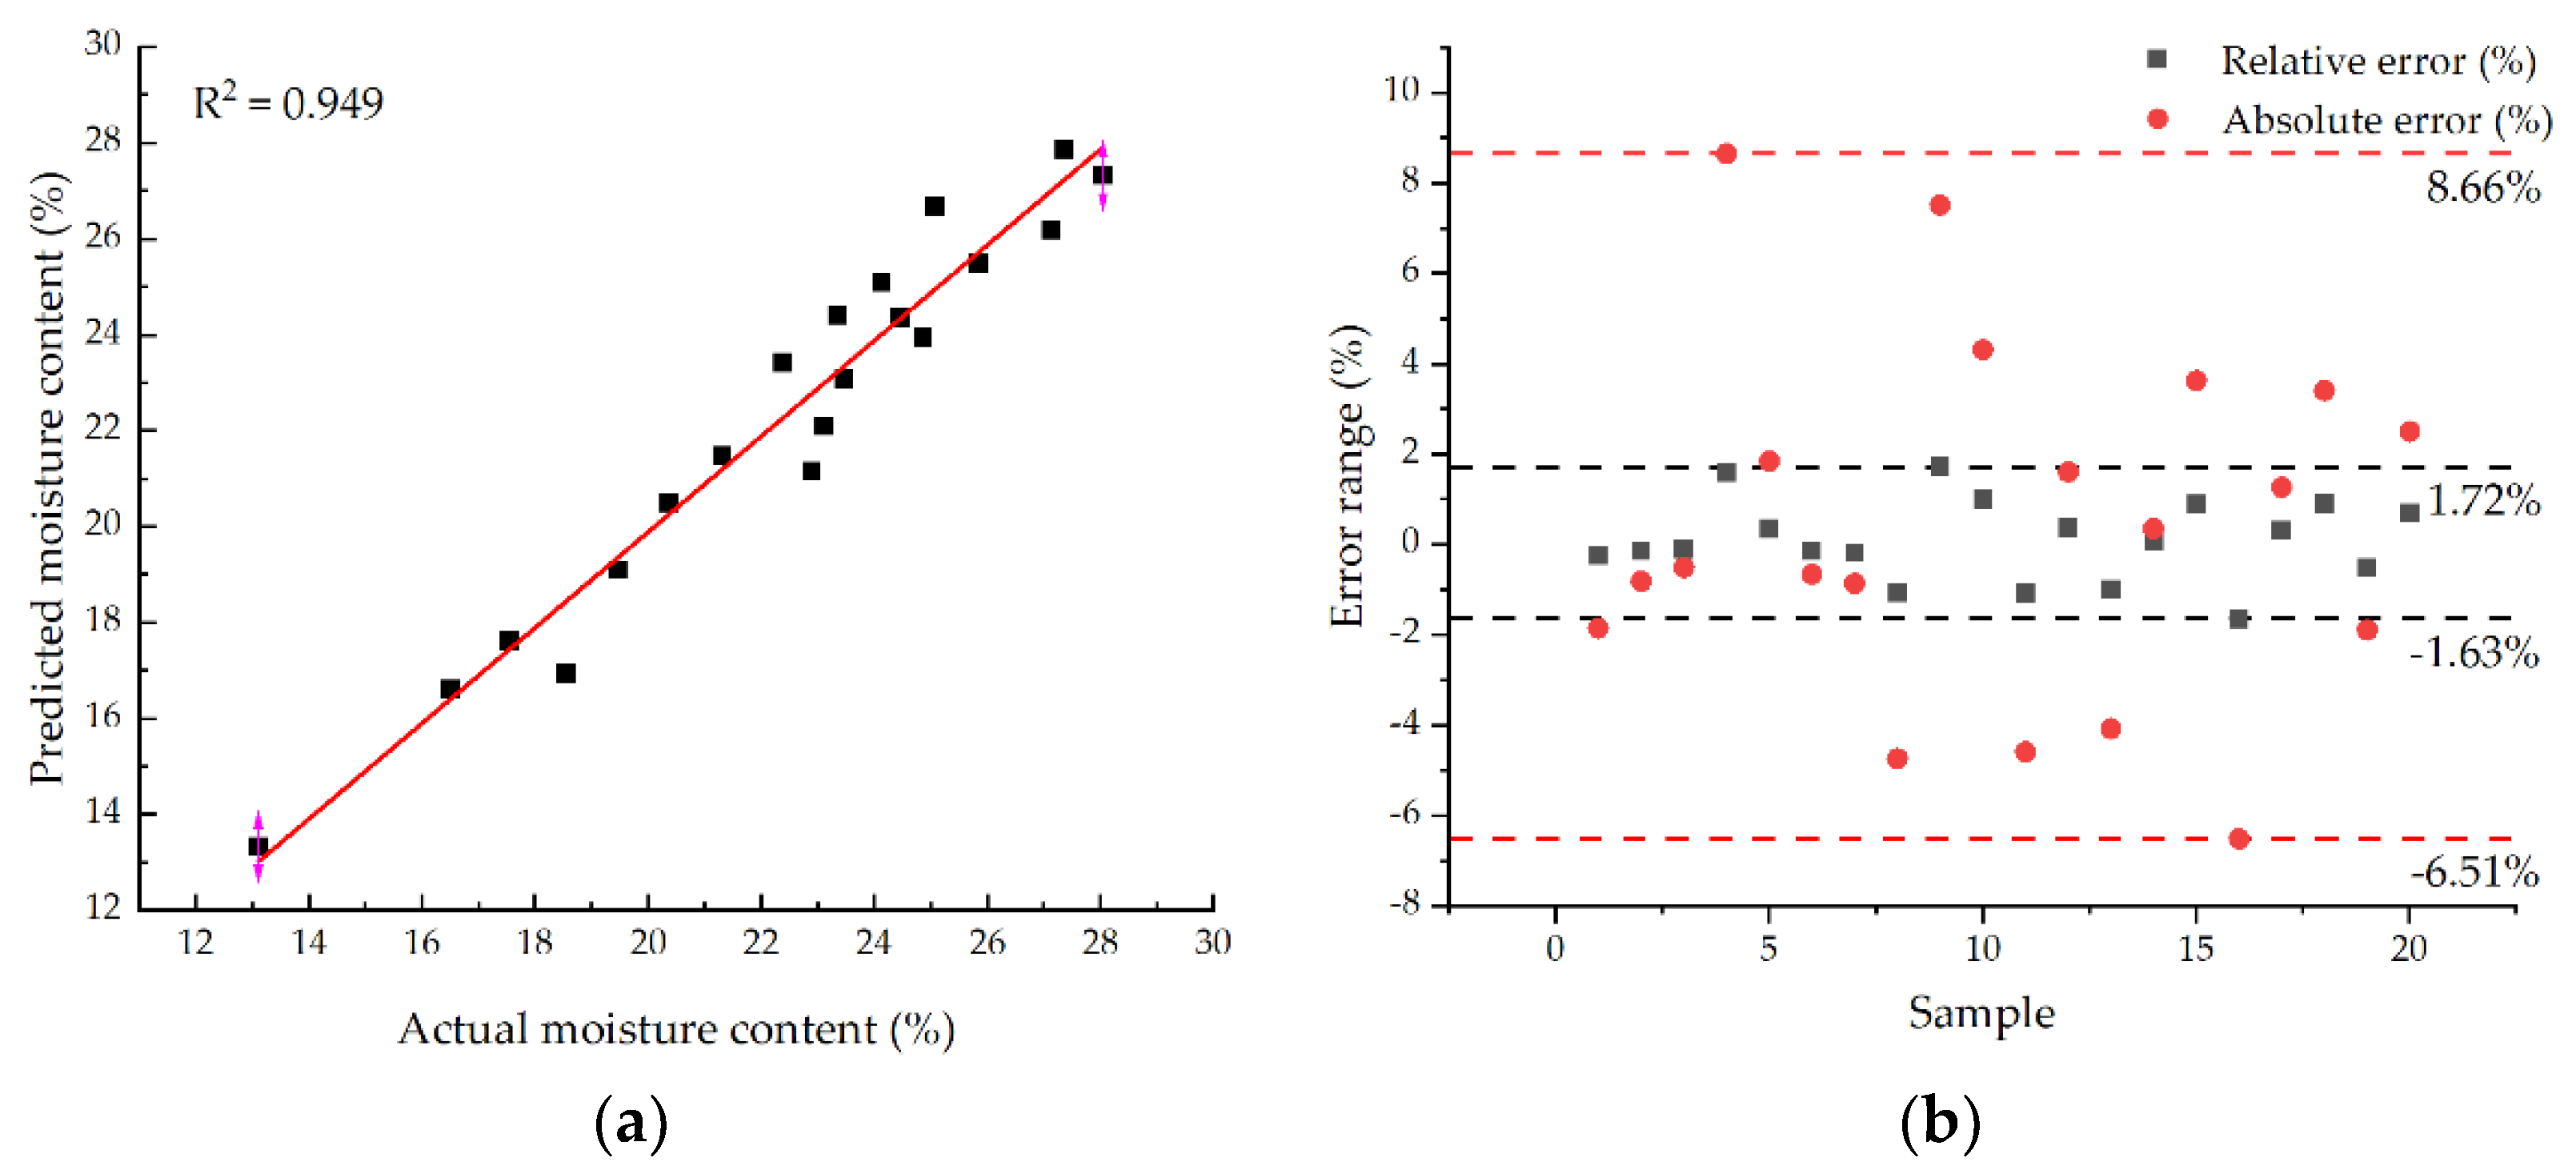
5.3. Performance Verification Test of Moisture Content Detection Device
6. Conclusions
- The aim of this study was to solve the problems of low detection accuracy and poor stability of current devices for the on-line detection for moisture content of bales, due to the weak anti-interference ability of the bridge circuit and operational amplification circuit and the influence on capacitance of the bulk density and temperature of the bales. The designed device integrates a capacitor sensor, pressure sensor, and temperature sensor. The optimum structure size of the capacitor plate was determined by a simulation test of the capacitor plate structure of the capacitor sensor. A moisture content monitoring system based on the MATLAB language was established, and the moisture content detection model was constructed based on a BPNN algorithm. Finally, a test bench for a square baling machine was designed, and the performance verification test of the on-line detection device for moisture content of bales of square baler was carried out.
- The simulation results of the capacitor plate show that when the length, width, and spacing of the plates are 148.6, 47.7, and 5.1 mm, respectively, the detection sensitivity of the capacitor plate is the highest. The experimental results show that the R2, RMSE, and RPD of the BPNN model are 0.986, 0.008998, and 5.99, respectively. Compared with the MLR model, BPNN model has stronger data fitting ability, lower prediction error, and a more stable prediction effect. The results of the bench test show that the determination coefficient R2 of the fitting curve between the predicted value of moisture content and the actual value is 0.949, the relative error range of the predicted value of moisture content is −6.51–8.66%, and the absolute error range is −1.63–1.72% for the samples with moisture content between 13.1 and 28.04%. The on-line detection device for moisture content of bales has good accuracy and stability.
- To summarize, the on-line detection device for moisture content of bales of square balers has a simple structure, easy installation, and high detection upper limit. It can effectively overcome the influence of straw bulk density and temperature on detection accuracy. Compared with the current detection device for moisture content, it yields a noticeable improvement in accuracy and stability and meets the actual needs of field operation of square balers.
Author Contributions
Funding
Institutional Review Board Statement
Informed Consent Statement
Data Availability Statement
Acknowledgments
Conflicts of Interest
References
- Huang, L.; Ma, M.; Ji, X.; Choi, S.; Si, C. Recent Developments and Applications of Hemicellulose From Wheat Straw: A Review. Frontiers in Bioengineering and Biotechnology. Front. Bioeng. Biotechnol. 2021, 9, 440. [Google Scholar] [CrossRef] [PubMed]
- Li, J.; Jiao, X.; Jin, S.; Pan, Y. Effects of aerated irrigation and straw returning on paddy nitrogen and phosphorus losses. Trans. Chin. Soc. Agric. Eng. 2021, 37, 42–51. [Google Scholar] [CrossRef]
- Pascuzzi, S.; Guerrieri, A.S.; Vicino, F.; Santoro, F. Assessment of required torque and power bybig square baler during the wrapping and baling process. In Proceedings of the 20th International Scientific Conference Engineering for Rural Development (ERD 2021), Jelgava, Latvia, 26–28 May 2021; pp. 298–302. [Google Scholar]
- Zhang, A.; Meng, Z.; Chen, L.; Wu, G.; Cong, Y.; An, X. Design and Experiment of Dynamic Weighing System for Small Square Baler. Trans.Chin. Soc. Agric. Mach. 2020, 51, 170–175, 185. [Google Scholar] [CrossRef]
- Hamilton, K.J. Baler with NIR Sensor in Plunger Face. U.S. Patent 20200375114A1, 3 December 2020. [Google Scholar]
- Kraus, T.J. Baler with Dry Matter Content Detection System. U.S. Patent 20190098836A1, 4 April 2019. [Google Scholar]
- Pemrick, P. Device and Method for Measuring Hay Bale Moisture. U.S. Patent 6377058B1, 23 April 2002. [Google Scholar]
- Falbo, J. System and Method for Determining Moisture Content in a Bale of Hay. U.S. Patent 20110068809A1, 24 March 2011. [Google Scholar]
- Roberts, J.S.; Johnson, R.P. Device and Method for Measuring the Moisture of Hay in the Pre-Compression Chamber of a Rectangular Baler. U.S. Patent 20130319263A1, 5 December 2013. [Google Scholar]
- Wan, L.; Tang, H.; Ma, G.; Che, G.; Zou, D.; Sun, W. Optimization Design and Experiment on Finned Double Plates Rice Moisture Content Measuring Device. Trans. Chin. Soc. Agric. Mach. 2021, 52, 320–328. [Google Scholar]
- Niu, Z.; Liu, F.; Liu, M.; Ren, Z.; Li, P. Design of dielectric pellet feed moisture detector based on parallel plate capacitance sensor. Trans. Chin. Soc. Agric. Eng. 2019, 35, 36–43. [Google Scholar]
- Xi, Q.; Zhang, Z.; Xu, Y.; Zuo, Y.; Song, H.; Han, X.; Yang, W. Rapid moisture determination of oat grains with capacitance method and PLS modeling. J. Shanxi Agric. Univ. 2018, 38, 52–57. [Google Scholar] [CrossRef]
- Li, Y. Development of Plate Capacitive Roof Seepage Detector. Master’s Thesis, Zhengzhou University, Zhengzhou, China, 2005. [Google Scholar]
- Kumar, G.A.A.U.; Jindal, S.K.; Sreekanth, P.K. Capacitance Response of Concave Well Substrate MEMS Double Touch Mode Capacitive Pressure Sensor: Robust Design, Theoretical Modeling, Numerical Simulation and Performance Comparison. Silicon 2022, 1–9. [Google Scholar] [CrossRef]
- Abraham, S.; Heckenthaler, T.; Morgenstern, Y.; Kaufman, Y. Effect of temperature on the structure, electrical resistivity, and charge capacitance of supported lipid bilayers. Langmuir 2019, 35, 8709–8715. [Google Scholar] [CrossRef] [PubMed]
- Dong, Y.; Han, R.; Wang, D.; Wang, R.; Guo, C. An Analytical Model Including Interface Traps and Temperature Effects in Negative Capacitance Double Gate Field Effect Transistor. Silicon 2021, 13, 3101–3111. [Google Scholar] [CrossRef]
- Chen, J.; Wang, Y.; Lian, Y.; Wang, S.; Liu, X. Development of on-line monitoring device of grain moisture content in combine harvester with high frequency capacitance. Trans. Chin. Soc. Agric. Eng. 2018, 34, 36–45. [Google Scholar]
- Bouasria, A.; Ibno Namr, K.; Rahimi, A.; Ettachfini, E.M.; Rerhou, B. Evaluation of Landsat 8 image pansharpening in estimating soil organic matter using multiple linear regression and artificial neural networks. Geo-Spat. Inf. Sci. 2022, 1–12. [Google Scholar] [CrossRef]
- Bu, J.; Tian, Y.; Zong, Y. Analysis on the influencing factors of multiple indicators in the United States based on multiple linear regression model. In Proceedings of the 2021 Asia-Pacific Conference on Image Processing, Electronics and Computers (IPEC 2021), Dalian, China, 14–16 April 2021. [Google Scholar]
- Ohana-Levi, N.; Ben-Gal, A.; Munitz, S.; Netzer, Y. Grapevine crop evapotranspiration and crop coefficient forecasting using linear and non-linear multiple regression models. Agric. Water Manag. 2022, 262, 107317. [Google Scholar] [CrossRef]
- Ruan, B. Prediction of Stock Market by BP Neural Network Model. In Proceedings of the 2020 International Conference on Mechanical Automation and Computer Engineering (MACE 2020), Xi’an, China, 28–30 October 2020. [Google Scholar]
- Yu, W.; Guan, G.; Li, J.; Wang, Q.; Xie, X.; Zhang, Y.; Huang, Y.; Yu, X.; Cui, C. Claim Amount Forecasting and Pricing of Automobile Insurance Based on the BP Neural Network. Complexity 2021, 2021, 6616121. [Google Scholar] [CrossRef]


| Serial Number | Size of Capacitor Plate (mm) | Capacitance (pF) | C/C’ | |||
|---|---|---|---|---|---|---|
| Length L | Width b | Spacing a | Simulated Value C | Theoretical Value C’ | ||
| 1 | 150 | 90 | 5 | 26.2 | 27.4 | 0.95 |
| 2 | 150 | 90 | 10 | 22.5 | 22.4 | 1.01 |
| 3 | 150 | 90 | 15 | 20.5 | 19.5 | 1.05 |
| 4 | 150 | 90 | 20 | 19.2 | 17.5 | 1.10 |
| 5 | 150 | 90 | 25 | 18.1 | 16.0 | 1.13 |
| 6 | 50 | 90 | 10 | 8.3 | 7.5 | 1.11 |
| 7 | 100 | 90 | 10 | 15.7 | 14.9 | 1.05 |
| 8 | 150 | 90 | 10 | 23 | 22.4 | 1.03 |
| 9 | 200 | 90 | 10 | 29.9 | 29.8 | 1.00 |
| 10 | 250 | 90 | 10 | 35.6 | 37.3 | 0.95 |
| 11 | 150 | 30 | 10 | 16.6 | 14.8 | 1.12 |
| 12 | 150 | 60 | 10 | 20.4 | 19.5 | 1.05 |
| 13 | 150 | 90 | 10 | 22.5 | 22.4 | 1.01 |
| 14 | 150 | 120 | 10 | 23.7 | 24.5 | 0.97 |
| 15 | 150 | 150 | 10 | 24.3 | 26.1 | 0.93 |
| Level | L (mm) | b (mm) | a (mm) |
|---|---|---|---|
| 1 | 50 | 40 | 5 |
| 2 | 100 | 60 | 10 |
| 3 | 150 | 80 | 15 |
| Source of Variation | p-Value | Calibration R2 | Prediction R2 |
|---|---|---|---|
| Linear model | <0.0001 | 0.9456 | 0.9145 |
| Two-factor equation | 0.1081 | 0.9605 | 0.9020 |
| Quadratic equation | 0.0004 | 0.9952 | 0.9666 |
| Cubic equation | 1.000 | 0.9145 |
| Source of Variation | Sum of Squares | df | T | F Value | p-Value |
|---|---|---|---|---|---|
| Model | 0.0899 | 9 | 0.0100 | 372.23 | <0.0001 |
| L | 0.0308 | 1 | 0.0308 | 1148.16 | <0.0001 |
| b | 0.0236 | 1 | 0.0236 | 879.77 | <0.0001 |
| a | 0.0317 | 1 | 0.0317 | 1180.84 | <0.0001 |
| L × b | 0.0005 | 1 | 0.0005 | 19.71 | 0.0030 |
| L× a | 0.0001 | 1 | 0.0001 | 2.47 | 0.1630 |
| b × a | 0.0012 | 1 | 0.0012 | 43.17 | 0.0003 |
| L2 | 0.0015 | 1 | 0.0015 | 55.49 | 0.0001 |
| b2 | 0.0004 | 1 | 0.0004 | 15.76 | 0.0054 |
| a2 | 0.0001 | 1 | 0.0001 | 3.3 | 0.1120 |
| Residual | 0.0002 | 7 | 0.0000 | ||
| Lack of Fit | 0.0002 | 3 | 0.0001 | ||
| Pure Error | 0.0000 | 4 | 0.0000 | ||
| Cor Total | 0.0900 | 16 |
| R | R2 | Adjusted R2 | Std. Error of Estimate | Durbin Watson |
|---|---|---|---|---|
| 0.947 | 0.898 | 0.894 | 0.0154781 | 0.715 |
| Source | Sum of Squares | Degree of Freedom | Mean Square | F | Significance |
|---|---|---|---|---|---|
| Regression | 0.550 | 9 | 0.061 | 255.102 | <0.0001 |
| Residual | 0.063 | 262 | 0.000 | ||
| Total | 0.613 | 271 |
| Source of Variation | Unstandardized Beta | T | Significance | Variance Inflation Factor |
|---|---|---|---|---|
| Constant | 0.176 | 46.178 | <0.0001 | |
| C2 | −6.725 × 10⁻⁷ | −11.510 | <0.0001 | 468.006 |
| P2 | 1.251 × 10⁻⁷ | 6.098 | <0.0001 | 817.390 |
| CP | −4.917 × 10⁻⁷ | −6.753 | <0.0001 | 1231.378 |
| CT | 6.271 × 10⁻⁵ | 23.607 | <0.0001 | 126.217 |
| C3 | 1.759 × 10⁻¹⁰ | 10.403 | <0.0001 | 89.766 |
| P3 | −3.417 × 10⁻¹¹ | −5.003 | <0.0001 | 349.823 |
| CP2 | 1.308 × 10⁻¹⁰ | 4.015 | <0.0001 | 783.966 |
| C2P | 8.269 × 10⁻¹¹ | 2.143 | 0.033 | 608.402 |
| PT2 | −6.388 × 10⁻⁷ | −8.391 | <0.0001 | 127.276 |
| Calibration Sets | Test Sets | ||||
|---|---|---|---|---|---|
| R2C | RMSEC | RPDC | R2P | RMSEP | RPDP |
| 0.9895 | 0.004846 | 6.92 | 0.9865 | 0.005584 | 6.11 |
| Modeling Methods | Evaluation Index for Verifying the Performance of the Model | ||
|---|---|---|---|
| R2 | RMSE | RPD | |
| MLR model | 0.910 | 0.025931 | 2.41 |
| BPNN model | 0.986 | 0.008998 | 5.99 |
| MCP (%) | MCA (%) | RECB (%) | RECA (%) | MCP (%) | MCA (%) | RECB (%) | RECA (%) | MCP (%) | MCA (%) | RECB (%) | RECA (%) |
|---|---|---|---|---|---|---|---|---|---|---|---|
| 13.7 | 14.66 | 6.55 | −1.03 | 20.42 | 21.31 | 4.16 | −3.61 | 21.06 | 23.91 | 11.93 | 4.79 |
| 15.33 | 17.45 | 12.14 | 5.02 | 19.73 | 21.32 | 7.46 | −0.05 | 21.76 | 23.91 | 9.01 | 1.63 |
| 16.80 | 18.11 | 7.25 | −0.27 | 19.4 | 21.36 | 9.18 | 1.81 | 22.4 | 24.14 | 7.21 | −0.32 |
| 17.22 | 18.35 | 6.17 | −1.44 | 19.87 | 21.46 | 7.41 | −0.10 | 22 | 24.17 | 8.98 | 1.60 |
| 17.1 | 18.73 | 8.70 | 1.30 | 19.99 | 21.49 | 6.98 | −0.56 | 23.85 | 25.01 | 4.64 | −3.10 |
| 17.77 | 18.95 | 6.22 | −1.39 | 18.35 | 21.50 | 14.67 | 7.75 | 23.71 | 25.29 | 6.25 | −1.36 |
| 16.83 | 19.46 | 13.51 | 6.50 | 19.12 | 21.89 | 12.67 | 5.59 | 25 | 25.99 | 3.81 | −3.99 |
| 17.96 | 21.06 | 14.72 | 7.80 | 21.11 | 22.39 | 5.72 | −1.93 | 24.5 | 26.67 | 8.14 | 0.69 |
| 18.4 | 21.11 | 12.84 | 5.77 | 22.04 | 23.65 | 6.80 | −0.76 | 27.06 | 27.68 | 2.24 | −5.69 |
| 19.26 | 21.20 | 9.17 | 1.80 | 23.19 | 23.87 | 2.84 | −5.04 | 27.91 | 28.86 | 3.29 | −4.55 |
Publisher’s Note: MDPI stays neutral with regard to jurisdictional claims in published maps and institutional affiliations. |
© 2022 by the authors. Licensee MDPI, Basel, Switzerland. This article is an open access article distributed under the terms and conditions of the Creative Commons Attribution (CC BY) license (https://creativecommons.org/licenses/by/4.0/).
Share and Cite
Liu, H.; Meng, Z.; Zhang, A.; Cong, Y.; An, X.; Fu, W.; Wu, G.; Yin, Y.; Jin, C. On-Line Detection Method and Device for Moisture Content Measurement of Bales in a Square Baler. Agriculture 2022, 12, 1183. https://doi.org/10.3390/agriculture12081183
Liu H, Meng Z, Zhang A, Cong Y, An X, Fu W, Wu G, Yin Y, Jin C. On-Line Detection Method and Device for Moisture Content Measurement of Bales in a Square Baler. Agriculture. 2022; 12(8):1183. https://doi.org/10.3390/agriculture12081183
Chicago/Turabian StyleLiu, Huaiyu, Zhijun Meng, Anqi Zhang, Yue Cong, Xiaofei An, Weiqiang Fu, Guangwei Wu, Yanxin Yin, and Chengqian Jin. 2022. "On-Line Detection Method and Device for Moisture Content Measurement of Bales in a Square Baler" Agriculture 12, no. 8: 1183. https://doi.org/10.3390/agriculture12081183
APA StyleLiu, H., Meng, Z., Zhang, A., Cong, Y., An, X., Fu, W., Wu, G., Yin, Y., & Jin, C. (2022). On-Line Detection Method and Device for Moisture Content Measurement of Bales in a Square Baler. Agriculture, 12(8), 1183. https://doi.org/10.3390/agriculture12081183