
Evaluation of Agriculture Tires Deformation Using Innovative 3D Scanning Method


Abstract
:1. Introduction
2. Materials and Methods
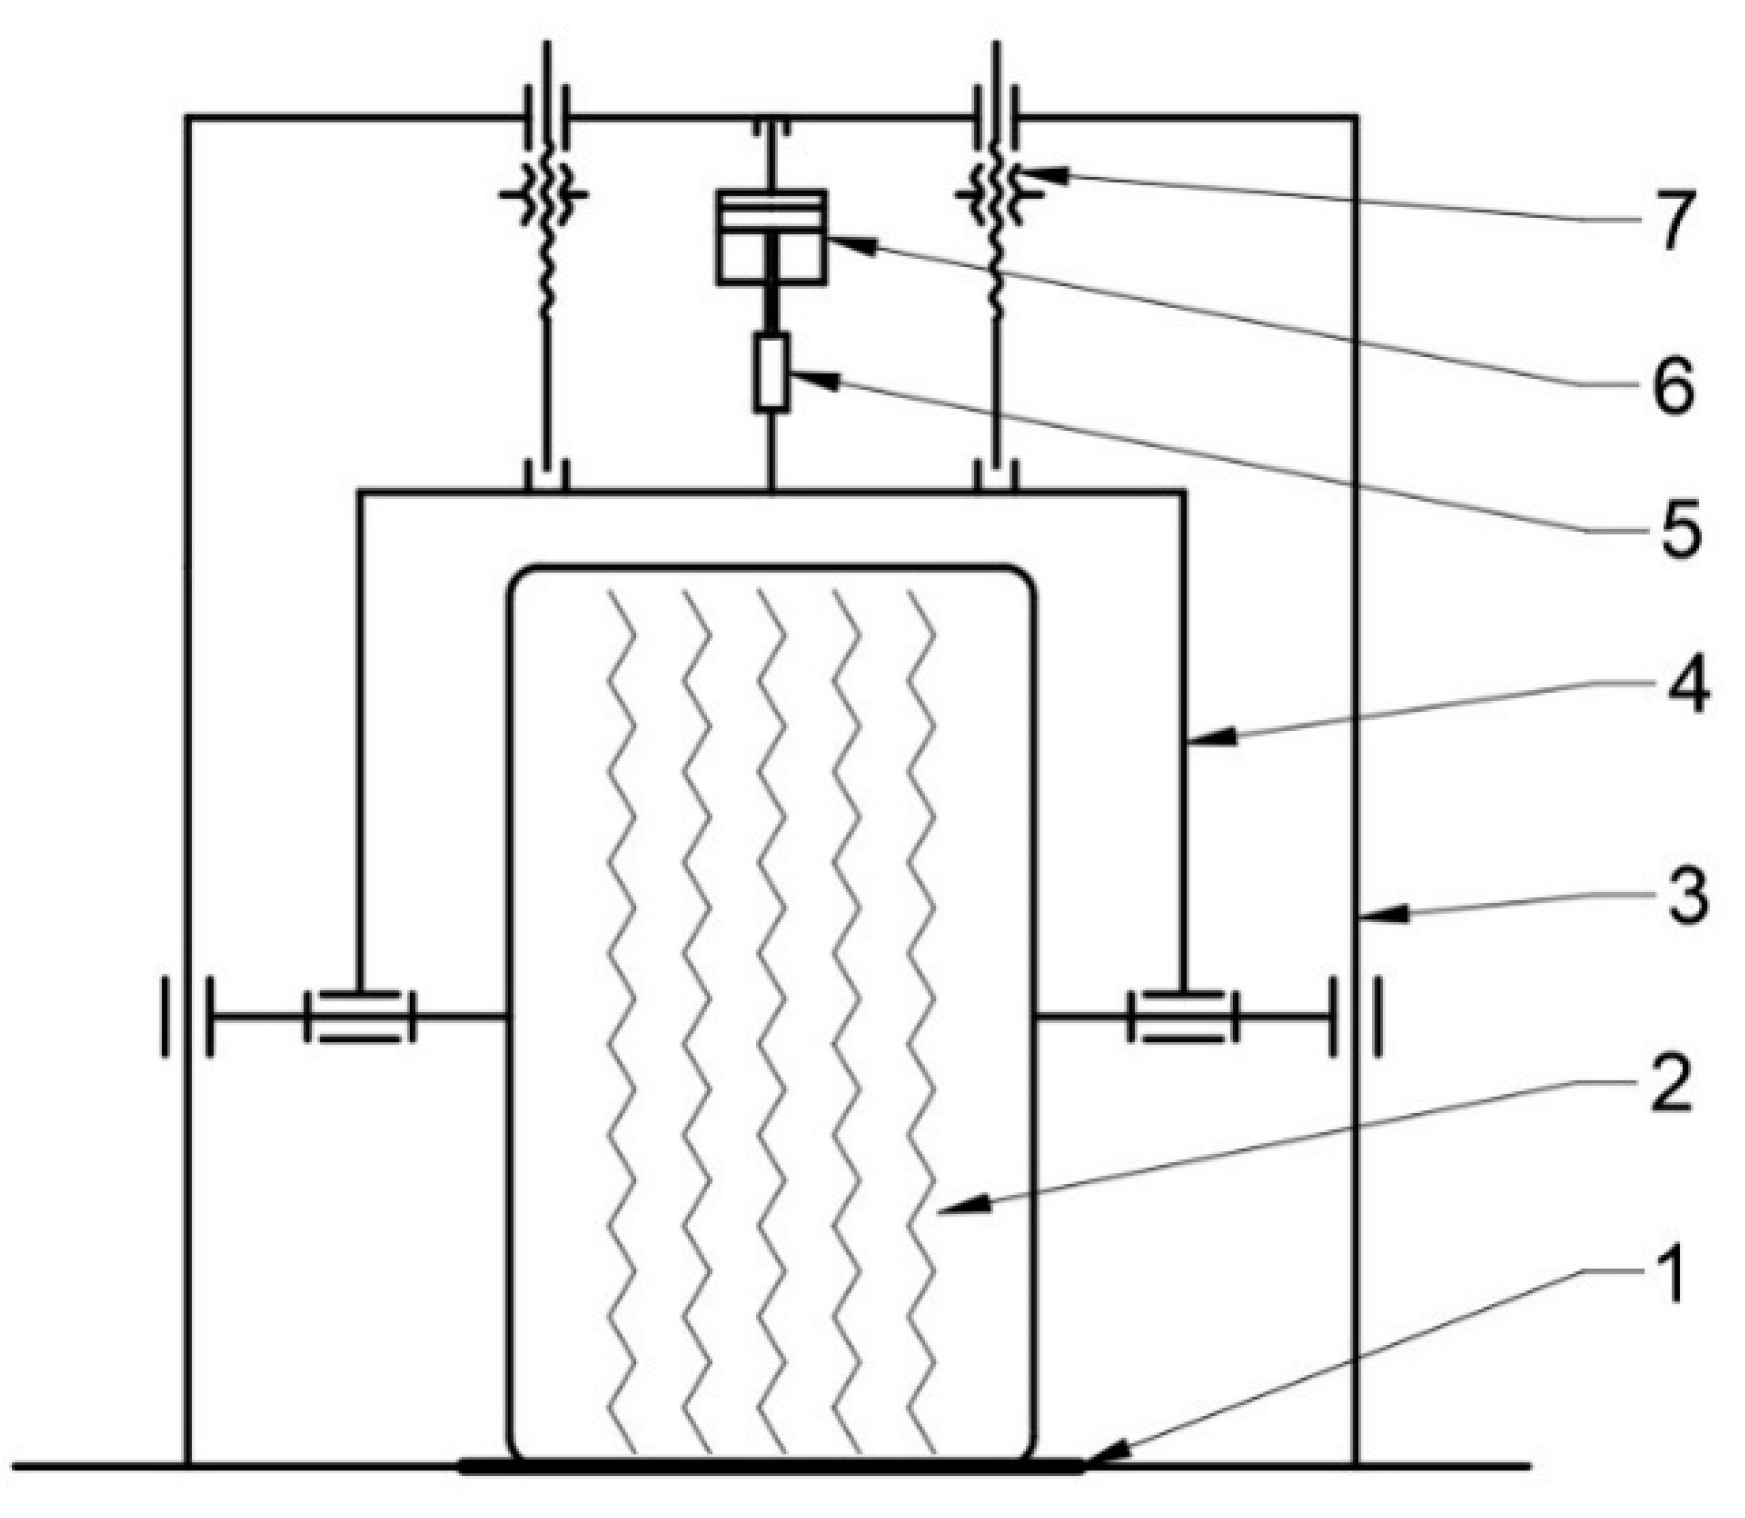
2.1. Test Bench
2.2. Scanning Process
2.3. Management of Obtained Data
2.4. Statistical Analysis of Results
3. Results
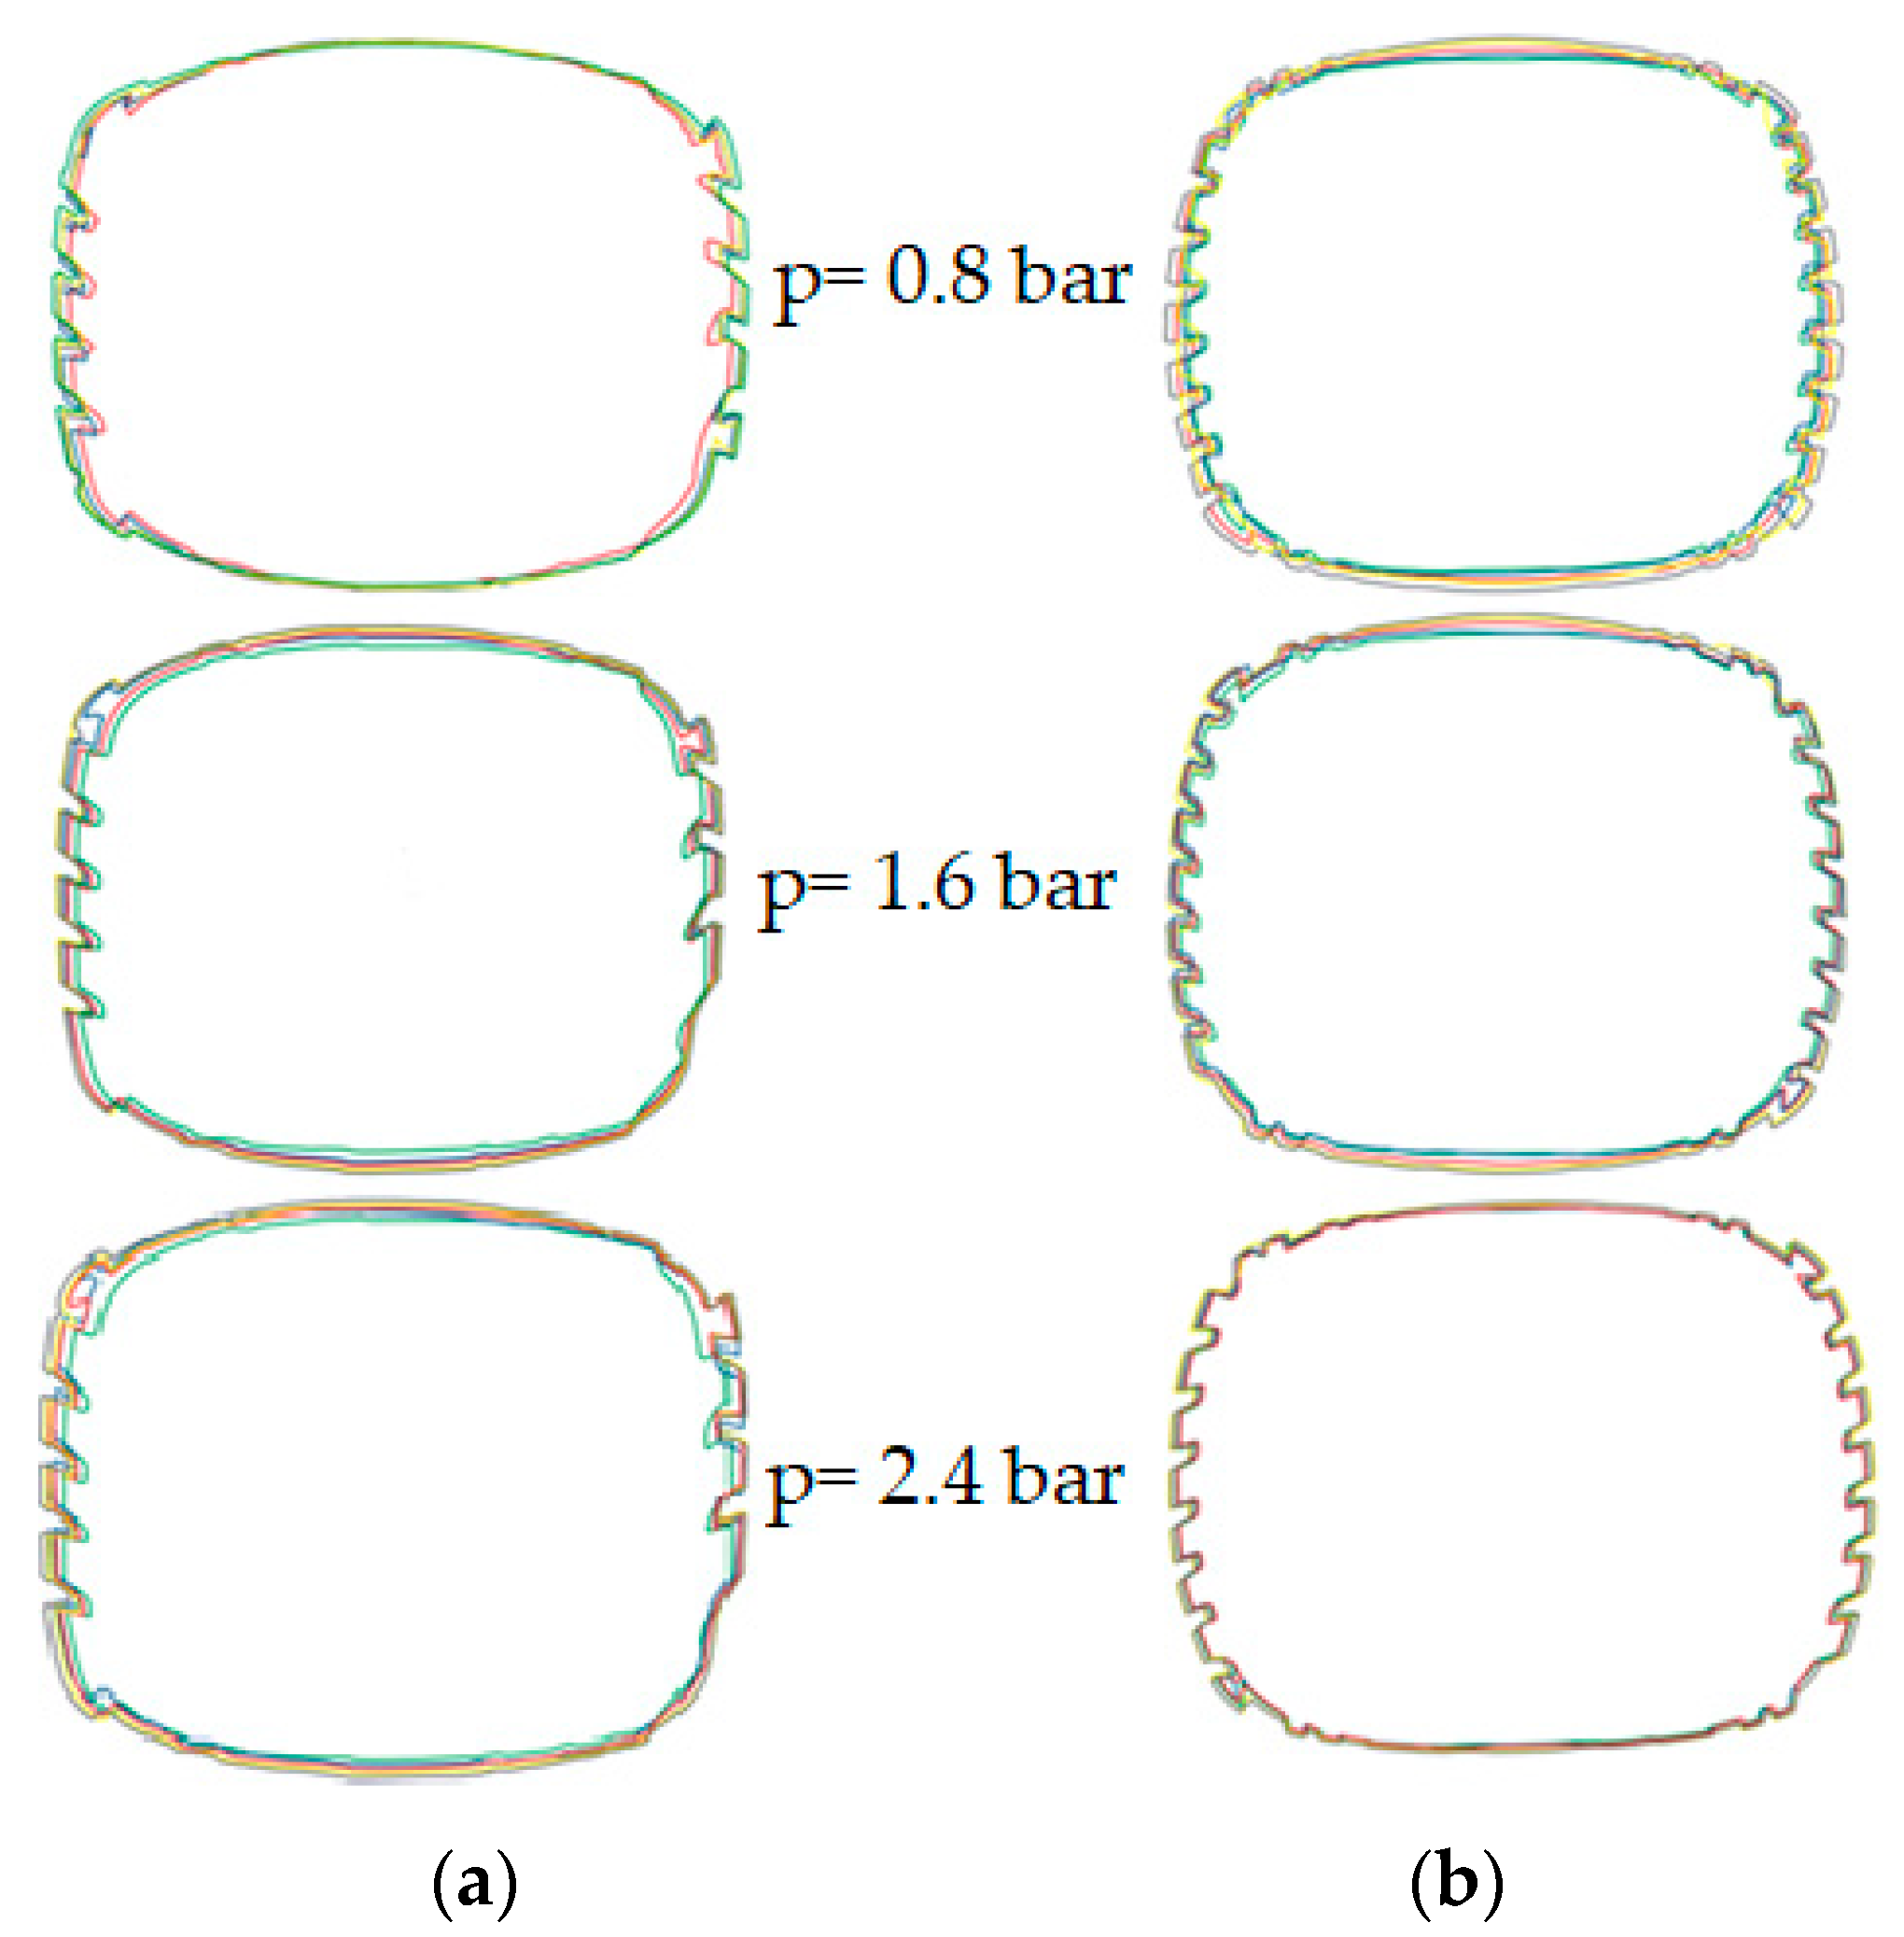
3.1. Model for Radial Tire
- Ahu—area of horizontal cross-section (m2),
- G—vertical load (kg),
- p—inflation pressure (bar),
- a, b, c, d—parameters (constants of equation).
- Err—error of estimation, %,
- Am—measured area of cross-section, m2,
- Ac—calculated area of cross-section, m2.
- Analysis of obtained results made it possible to conclude that the highest error was 4.68%, the lowest error was 0.17%, and the mean error was at the level of 1.62%.

| Parameter | Value |
|---|---|
| a | 0.491 |
| b | −0.081 |
| c | 0.007 |
| d | 0.028 |
| Vertical Load, kg | Inflation Pressure, bar | Area of Cross-Section (Measured) | Area of Cross-Section (Calculated from Model) | Error, % |
|---|---|---|---|---|
| 800 | 0.8 | 0.315 | 0.305 | 3.22 |
| 1200 | 0.8 | 0.322 | 0.313 | 2.93 |
| 1600 | 0.8 | 0.309 | 0.319 | 3.21 |
| 2000 | 0.8 | 0.324 | 0.325 | 0.29 |
| 2400 | 0.8 | 0.325 | 0.331 | 1.71 |
| 800 | 1.6 | 0.275 | 0.288 | 4.68 |
| 1200 | 1.6 | 0.297 | 0.295 | 0.73 |
| 1600 | 1.6 | 0.294 | 0.302 | 2.47 |
| 2000 | 1.6 | 0.312 | 0.308 | 1.32 |
| 2400 | 1.6 | 0.314 | 0.313 | 0.34 |
| 800 | 2.4 | 0.281 | 0.282 | 0.17 |
| 1200 | 2.4 | 0.291 | 0.289 | 0.59 |
| 1600 | 2.4 | 0.296 | 0.296 | 0.22 |
| 2000 | 2.4 | 0.304 | 0.302 | 0.72 |
| 2400 | 2.4 | 0.313 | 0.307 | 1.76 |
3.2. Model for Bias-Ply Tire
- Ahu—area of horizontal cross-section (m2),
- G—vertical load (kg),
- p—inflation pressure (bar),
- a, b, c, d, e—parameters (constants of equation).
4. Discussion
5. Conclusions
Author Contributions
Funding
Institutional Review Board Statement
Informed Consent Statement
Data Availability Statement
Conflicts of Interest
References
- Lyu, X.; Peng, W.; Niu, S.; Qu, Y.; Xin, Z. Evaluation of sustainable intensification of cultivated land use according to farming households’ livelihood type. Ecol. Ind. 2022, 138, 108848. [Google Scholar] [CrossRef]
- Zhou, K.; Bochtis, D.; Jensen, A.L.; Kateris, D.; Soerensen, C.G. Introduction of a New Index of Field Operations Efficiency. Appl. Sci. 2020, 10, 329. [Google Scholar] [CrossRef] [Green Version]
- Keller, T.; Sandin, M.; Colombi, T.; Horn, R.; Or, D. Historical increase in agricultural machinery weights enhanced soil stress levels and adversely affected soil functioning. Soil Till. Res. 2019, 194, 104293. [Google Scholar] [CrossRef]
- Moinfara, A.; Ghoalmhossein, M.; Yousef, S.; Gilandeha, A.; Kavehb, M.; Szymanek, M. Investigating the effect of the tractor driving system type on soil compaction using different methods of ANN, ANFIS and step wise regression. Soil Till. Res. 2022, 222, 105444. [Google Scholar] [CrossRef]
- Carman, K. Compaction characteristics of towed wheels on clay loam in a soil bin. Soil Till. Res. 2002, 65, 37–43. [Google Scholar] [CrossRef]
- Da Silva Guimarães Júnnyor, W.; Diserens, E.; De Maria, I.C.; Junior, C.F.A.; Farhate, C.V.V.; de Souza, Z.M. Prediction of soil stresses and compaction due to agricultural machines in sugarcane cultivation systems with and without crop rotation. Sci. Total Environ. 2019, 681, 424–434. [Google Scholar] [CrossRef]
- Berisso, F.E.; Schjønning, P.; Lamandé, M.; Weisskopf, P.; Stettler, M.; Keller, T. Effects of the stress field induced by a running tyre on the soil pore system. Soil Till. Res. 2013, 131, 36–46. [Google Scholar] [CrossRef]
- Augustin, K.; Kuhwald, M.; Brunotte, J.; Duttmann, R. Wheel Load and Wheel Pass Frequency as Indicators for Soil Compaction Risk: A Four-Year Analysis of Traffic Intensity at Field Scale. Geosciences 2020, 10, 292. [Google Scholar] [CrossRef]
- Ren, L.; Vanden Nest, T.; Ruysschaert, G.; D’Hose, T.; Wim Cornelis, W. Short-term effects of cover crops and tillage methods on soil physical properties and maize growth in a sandy loam soil. Soil Till. Res. 2019, 192, 76–86. [Google Scholar] [CrossRef]
- Hamza, M.A.; Anderson, W.K. Soil compaction in cropping systems. Soil Till. Res. 2005, 82, 121–145. [Google Scholar] [CrossRef]
- Botta, G.F.; Tolon-Becerra, A.; Lastra-Bravo, X.; Tourn, M. Tillage and traffic effects (planters and tractors) on soil compaction and soybean (Glycine max L.) yields in Argentinean pampas. Soil Till. Res. 2010, 110, 167–174. [Google Scholar] [CrossRef]
- Naujokienė, V.; Šarauskis, E.; Lekavičienė, K.; Adamavičienė, A.; Buragienė, S.; Kriaučiūnienė, Z. The influence of biopreparations on the reduction of energy consumption and CO2 emissions in shallow and deep soil tillage. Sci. Total Environ. 2018, 626, 1402–1413. [Google Scholar] [CrossRef]
- Sivarajan, S.; Maharlooei, M.; Bajwa, S.; Nowatzki, J. Impact of soil compaction due to wheel traffic on corn and soybean growth, development and yield. Soil Till. Res. 2018, 175, 234–243. [Google Scholar] [CrossRef]
- Farhadi, P.; Golmohammadi, A.; Sharifi, A.; Shahgholi, G. Potential of three-dimensional footprint mold in investigating the effect of tractor tire contact volume changes on rolling resistance. J. Terramech. 2018, 78, 63–72. [Google Scholar] [CrossRef]
- Ungureanu, N.; Vladut, V.; Biris, S.; Matache, M. Research in distribution of pressure in soil depth under wheels of different machines. In Proceedings of the 17th International Scientific Conference Engineering for Rural Development, Jelgava, Latvia, 23–25 May 2018. [Google Scholar] [CrossRef]
- Elkins, C.B. Plant roots as tillage tools. J. Terramech. 1985, 22, 177–178. [Google Scholar] [CrossRef]
- Keller, T.; Arvidsson, J. Technical solutions to reduce the risk of subsoil compaction: Effects of dual wheels, tandem wheels and tyre inflation pressure on stress propagation in soil. Soil Till. Res. 2004, 79, 191–205. [Google Scholar] [CrossRef]
- Becker, C.; Schalk, E. Agricultural tyre stiffness change as a function of tyre wear. J. Terramech. 2022, 102, 1–15. [Google Scholar] [CrossRef]
- Khemis, C.; Abrougui, K.; Ren, L.; Mutuku, E.A.; Chehaibi, S.; Cornelis, W. Effects of tractor loads and tyre pressures on soil compaction in Tunisia under different moisture conditions. In Proceedings of the European Geosciences Union General Assembly, Vienna, Austria, 23–28 April 2017. [Google Scholar]
- Lindemuth, B.E. An overview of tire technology. In The Pneumatic Tire; U.S. Department of Transportation, National Highway Traffic Safety Administration: Washington, DC, USA, 2006; pp. 3–7. [Google Scholar]
- Taghavifar, H.; Mardani, A. Investigating the effect of velocity, inflation pressure, and vertical load on rolling resistance of a radial ply tire. J. Terramech. 2013, 50, 99–106. [Google Scholar] [CrossRef]
- Diserens, E.; Défossez, P.; Duboisset, A.; Alaoui, A. Prediction of the contact area of agricultural traction tires on firm soil. Biosyst. Engine 2011, 110, 73–82. [Google Scholar] [CrossRef]
- Arvidsson, J.; Keller, T. Soil stress as affected by wheel load and tire inflation pressure. Soil Till. Res. 2007, 96, 284–291. [Google Scholar] [CrossRef]
- Ten Damme, L.; Stettler, M.; Pinet, F.; Vervaet, P.; Keller, T.; Munkholm, L.J.; Lamandé, M. The contribution of tyre evolution to the reduction of soil compaction risks. Soil Till. Res. 2019, 194, 104283. [Google Scholar] [CrossRef] [Green Version]
- Kumar, S.; Pandey, K.P.; Kumar, R.; Ashok Kumar, A. Effect of ballasting on performance characteristics of bias and radial ply tyres with zero sinkage. Measurement 2018, 121, 218–224. [Google Scholar] [CrossRef]
- Botta, G.F.; Rivero, D.; Tourn, M.; Bellora Melcona, F.; Pozzolo, O.; Nardon, G.; Balbuena, R.; Tolon Becerra, A.; Rosatto, H.; Stadler, S. Soil compaction produced by tractor with radial and cross-ply tyres in two tillage regimes. Soil Till. Res. 2008, 101, 44–51. [Google Scholar] [CrossRef]
- Svoboda, M.; Brennensthul, M.; Pospíšil, J. Evaluation of changes in soil compaction due to the passage of combine harvester. Acta Univ. Agric. Silvic. Mendel. Brun. 2016, 64, 877–882. [Google Scholar] [CrossRef] [Green Version]
- Raper, R.L.; Bailey, A.C.; Burt, E.C.; Way, T.R.; Liberati, P. Inflation pressure and dynamic load effects on soil deformation and soil-tire interface stresses. Trans. ASAE 1995, 38, 685–689. [Google Scholar] [CrossRef] [Green Version]
- Renčín, L.; Polcar, A.; Bauer, F. The Effect of the Tractor Tires Load on the Ground Loading Pressure. Acta Univ. Agric. Silvic. Mendel. Brun. 2017, 65, 1607–1614. [Google Scholar] [CrossRef] [Green Version]
- Filipovic, D.; Kovacev, I.; Copec, K.; Fabijanic, G.; Kosutic, S.; Husnjak, S. Effects of Tractor Bias-ply Tyre Inflation Pressure on Stress Distribution in Silty Loam Soil. Soil Water Res. 2016, 11, 190–195. [Google Scholar] [CrossRef]
- Kenarsari, A.E.; Vitton, S.J.; Beard, J.E. Creating 3D models of tractor tire footprints using close-range digital photogrammetry. J. Terramech. 2017, 74, 1–11. [Google Scholar] [CrossRef]
- Schwanghart, H. Measurement of contact area, contact pressure and compaction under tires in soft soil. J. Terramech. 1991, 28, 309–318. [Google Scholar] [CrossRef]
- Derafshpour, S.; Valizadeh, M.; Mardani, A.; Saray, M.T. A novel system developed based on image processing techniques for dynamical measurement of tire-surface contact area. Measurement 2019, 139, 270–276. [Google Scholar] [CrossRef]
- Błaszkiewicz, Z. A method for the determination of the contact area between a tyre and the ground. J. Terramech. 1990, 27, 263–282. [Google Scholar] [CrossRef]
- Lamande, M.; Schjønning, P.; Togersen, F.A. Mechanical behaviour of an undisturbed soil subjected to loadings: Effects of load and contact area. Soil Till. Res. 2007, 97, 91–106. [Google Scholar] [CrossRef]
- Bagnall, D.K.; Morgan, C.S. SLAKES and 3D Scans characterize management effects on soil structure in farm fields. Soil Till. Res. 2021, 208, 104893. [Google Scholar] [CrossRef]
- Diserens, E. Calculating the contact area of trailer tyres in the field. Soil Till. Res. 2009, 103, 302–309. [Google Scholar] [CrossRef]
- Ptak, W.; Czarnecki, J.; Brennensthul, M. Use of 3D scanning technique to determine tire deformation in static conditions. J. Agric. Eng. 2022, 53, 1–7. [Google Scholar] [CrossRef]
- Sharma, A.K.; Pandey, K.P. The deflection and contact characteristics of some agricultural tyres with zero sinkage. J. Terramech. 1996, 33, 293–299. [Google Scholar] [CrossRef]
- Grečenko, A. Tyre footprint area on hard ground computed from catalogue values. J. Terramech. 1995, 32, 325–333. [Google Scholar] [CrossRef]
- Teimourlou, R.F.; Taghavifar, H. Determination of the Super-Elliptic Shape of Tire-Soil Contact Area Using Image Processing Method. Cercet. Agron. Mold. 2015, 48, 5–14. [Google Scholar] [CrossRef]
- McKyes, E. Soil Cutting and Tillage; Developments in Agricultural Science Elsevier Science: Amsterdam, The Netherlands, 1985; Volume 7, pp. 140–141. [Google Scholar]
- Godin, T.; Defossez, P.; Leveque, E.; Le Bas, C.; Boizard, H.; Debuisson, S. Evaluation des contraintes engendrées par les engins dans les systèmes de grandes cultures, viticoles et forestiers français. In Proceedings of the 69th Congress e Brussels, Brussels, Belgium, 15–16 February 2006. [Google Scholar]
- Schjønning, P.; Lamandé, M.; Tøgersen, F.A.; Arvidsson, J.; Keller, T. Modelling effects of tyre inflation pressure on the stress distribution near the soil–tyre interface. Biosyst. Engine 2008, 99, 119–133. [Google Scholar] [CrossRef]
- Way, T.R.; Kishimoto, T. Interface pressures of a tractor drive tyre on structured and loose soils. Biosyst. Engine 2004, 87, 375–386. [Google Scholar] [CrossRef]

| Parameter | Description |
|---|---|
| Scanning technology | white structural light-LED |
| Measuring volume (x, y, z) [mm] | 400 × 300 × 240 |
| Distance between points [mm] | 0.156 |
| Accuracy [mm] | 0.08 |
| Power consumption during measurement [W] | 200 |
| Weight [kg] | 4.40 |
| Working temperature [°C] | 20 ± 0.5 |
| Analyzed Parameter | Factor | Factor Level | Arithmetic Mean | ± SD | p-Value |
|---|---|---|---|---|---|
| Height of tire profile (hp), mm | Vertical load | 800 kg | 175.1 A | 24.03 | <0.00001 |
| 1200 kg | 164.7 B | 26.41 | |||
| 1600 kg | 155.8 C | 22.01 | |||
| 2000 kg | 149.8 CD | 18.21 | |||
| 2400 kg | 143.9 D | 17.25 | |||
| Inflation pressure | 0.08 MPa | 132.6 A | 9.89 | <0.00001 | |
| 0.16 MPa | 163.3 B | 15.71 | |||
| 0.24 MPa | 177.9 C | 16.35 | |||
| Height of maximum deformation of the tire (hu), mm | Vertical load | 800 kg | 72.2 A | 7.92 | 0.00008 |
| 1200 kg | 74.4 A | 12.58 | |||
| 1600 kg | 64.1 B | 13.02 | |||
| 2000 kg | 64.9 B | 6.82 | |||
| 2400 kg | 63.1 B | 5.42 | |||
| Inflation pressure | 0.08 MPa | 58.9 A | 5.58 | <0.00001 | |
| 0.16 MPa | 66.8 B | 7.71 | |||
| 0.24 MPa | 77.5 C | 7.70 | |||
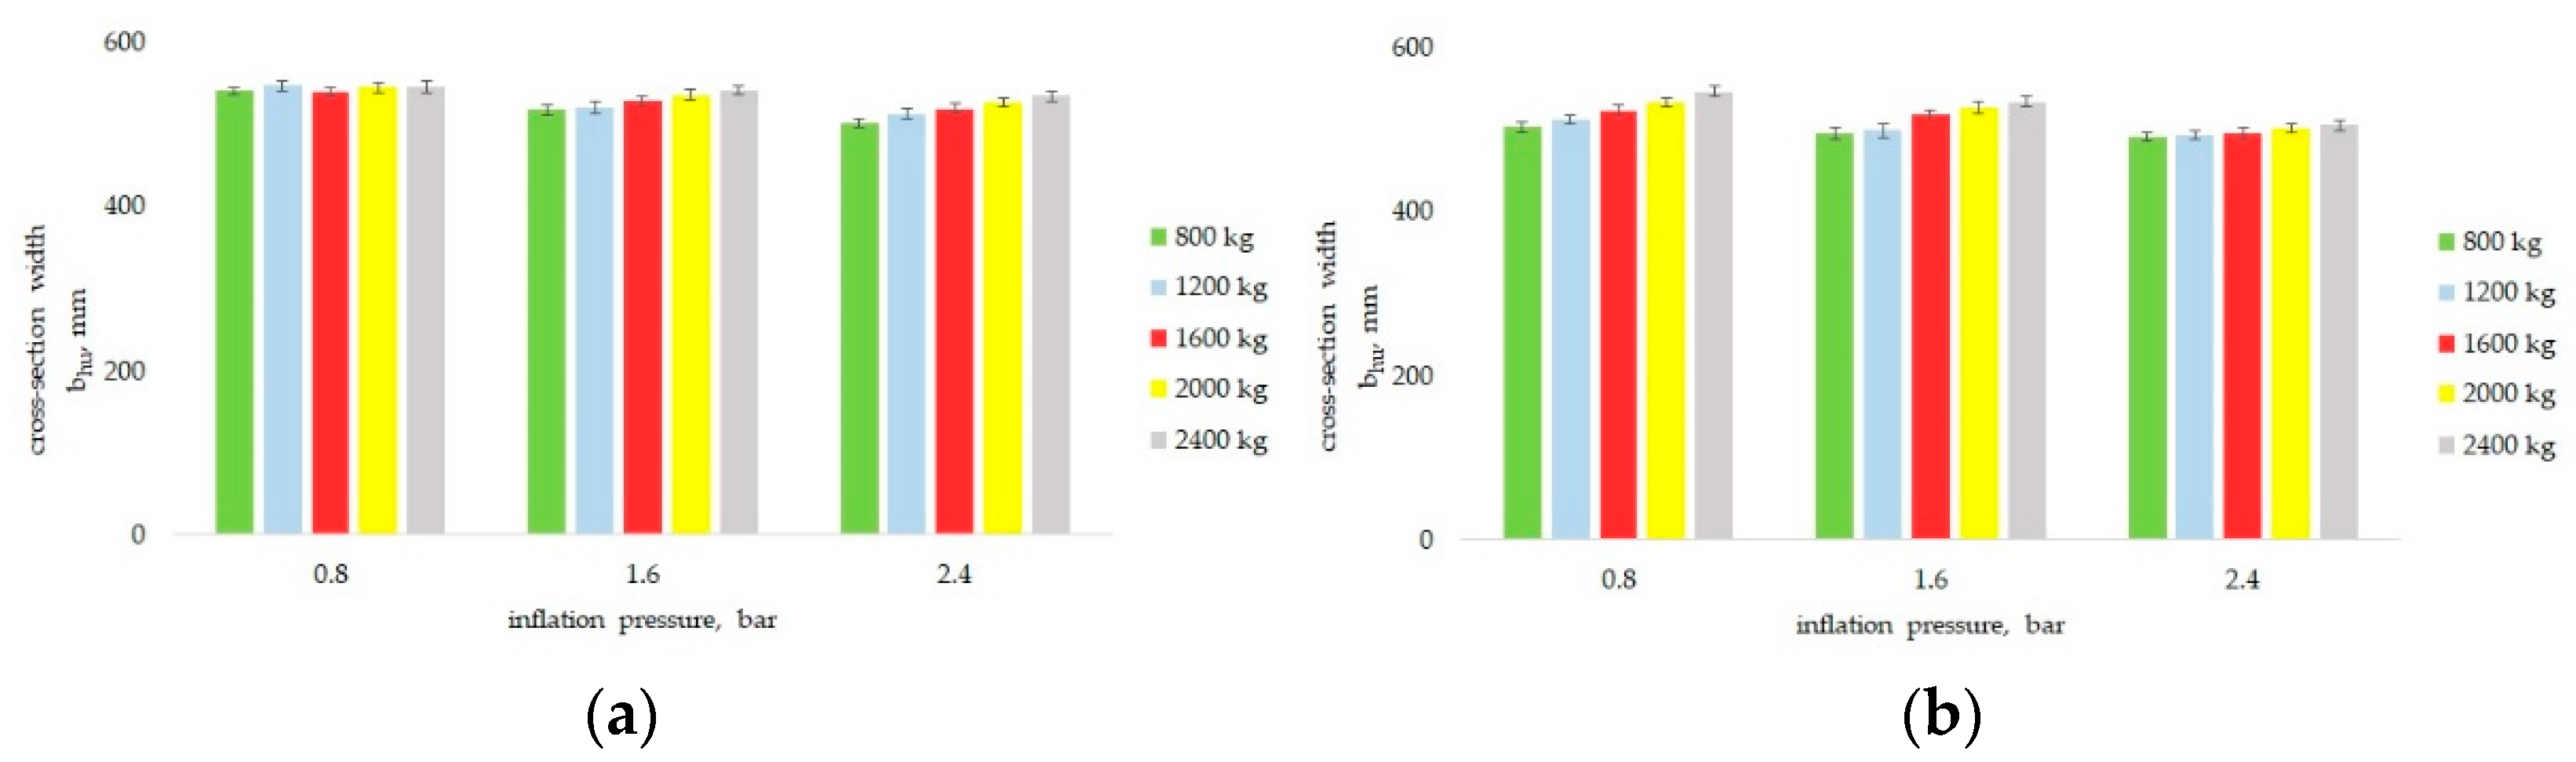
| Width of the tire (bhu), mm | Vertical load | 800 kg | 522.5 A | 17.87 | 0.00002 |
| 1200 kg | 527.4 A | 16.57 | |||
| 1600 kg | 529.2 AB | 10.50 | |||
| 2000 kg | 536.5 B | 9.35 | |||
| 2400 kg | 541.5 C | 7.08 | |||
| Inflation pressure | 0.08 MPa | 544.1 A | 5.68 | ||
| 0.16 MPa | 530.8 B | 9.60 | |||
| 0.24 MPa | 519.3 C | 13.07 | |||
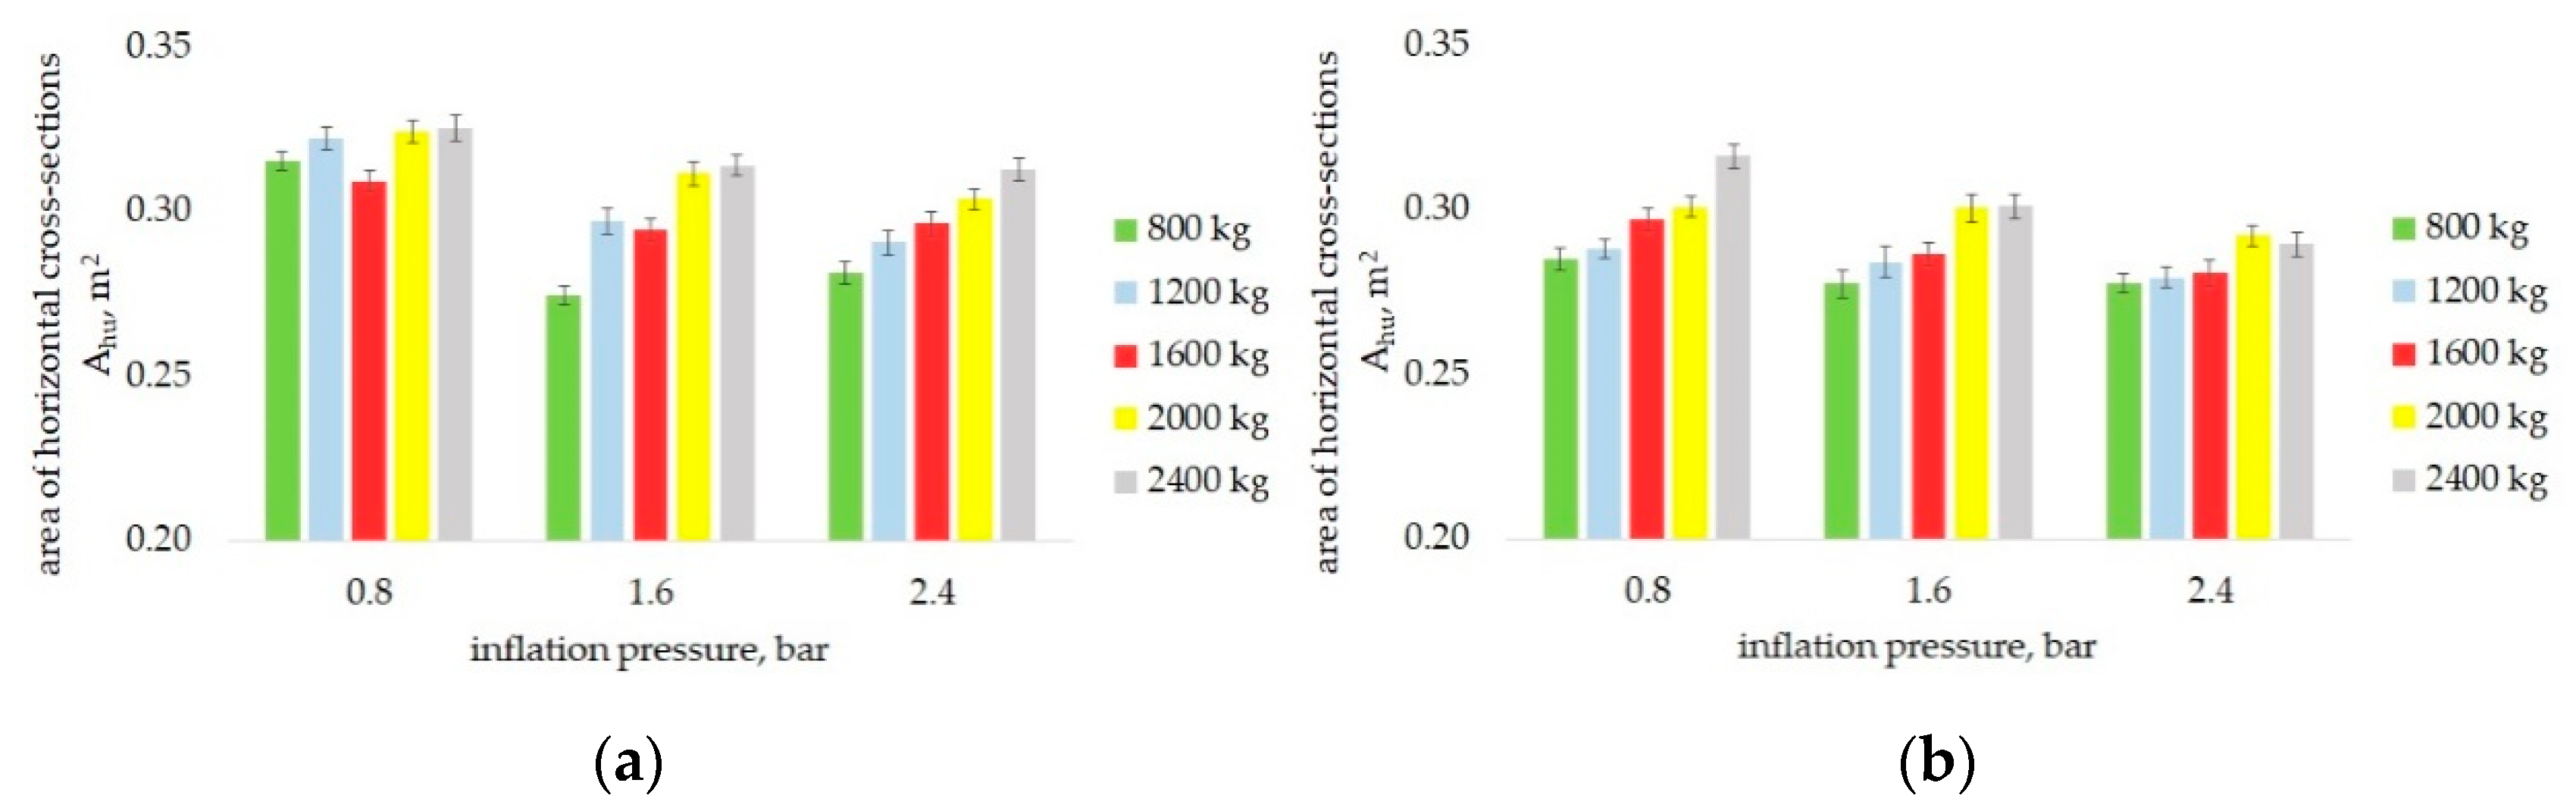
| Area of cross-section (Ahu) m2 | Vertical load | 800 kg | 0.290 A | 0.019 | <0.00001 |
| 1200 kg | 0.300 B | 0.015 | |||
| 1600 kg | 0.303 B | 0.008 | |||
| 2000 kg | 0.313 C | 0.009 | |||
| 2400 kg | 0.317 C | 0.007 | |||
| Inflation pressure | 0.08 MPa | 0.319 A | 0.007 | <0.00001 | |
| 0.16 MPa | 0.298 B | 0.015 | |||
| 0.24 MPa | 0.297 B | 0.011 |
| Analyzed Parameter | Factor | Factor Level | Arithmetic Mean | ± SD | p-Value |
|---|---|---|---|---|---|
| Height of tire profile (hp), mm | Vertical load | 800 kg | 195.3 A | 12.34 | <0.00001 |
| 1200 kg | 188.9 A | 11.32 | |||
| 1600 kg | 170.7 B | 17.38 | |||
| 2000 kg | 159.7 B | 19.72 | |||
| 2400 kg | 145.7 C | 24.88 | |||
| Inflation pressure | 0.08 MPa | 159.2 A | 25.94 | <0.00001 | |
| 0.16 MPa | 166.8 A | 23.33 | |||
| 0.24 MPa | 190.2 B | 14.40 | |||
| Height of maximum deformation of the tire (hu), mm | Vertical load | 800 kg | 89.8 A | 6.54 | <0.00001 |
| 1200 kg | 85.6 A | 6.15 | |||
| 1600 kg | 71.3 B | 11.63 | |||
| 2000 kg | 65.7 B | 12.92 | |||
| 2400 kg | 51.9 C | 17.33 | |||
| Inflation pressure | 0.08 MPa | 65.5 A | 18.40 | <0.00001 | |
| 0.16 MPa | 67.0 A | 17.33 | |||
| 0.24 MPa | 86.0 B | 8.94 | |||
| Width of the tire (bhu), mm | Vertical load | 800 kg | 497.5 A | 7.38 | <0.00001 |
| 1200 kg | 501.8 A | 10.05 | |||
| 1600 kg | 512.8 B | 14.14 | |||
| 2000 kg | 521.0 B | 15.38 | |||
| 2400 kg | 528.9 C | 19.04 | |||
| Inflation pressure | 0.08 MPa | 524.2 A | 16.56 | ||
| 0.16 MPa | 515.1 B | 16.55 | |||
| 0.24 MPa | 497.9 C | 7.27 | |||
| Area of cross-section (Ahu), m2 | Vertical load | 800 kg | 0.280 A | 0.005 | <0.00001 |
| 1200 kg | 0.284 AB | 0.005 | |||
| 1600 kg | 0.288 B | 0.008 | |||
| 2000 kg | 0.297 C | 0.005 | |||
| 2400 kg | 0.302 C | 0.012 | |||
| Inflation pressure | 0.08 MPa | 0.297 A | 0.012 | <0.00001 | |
| 0.16 MPa | 0.290 B | 0.010 | |||
| 0.24 MPa | 0.283 C | 0.007 |
| Parameter | Value |
|---|---|
| a | 3.523 |
| b | −1.250 |
| c | 0.158 |
| d | −0.006 |
| e | −0.008 |
| Vertical Load, kg | Inflation Pressure, bar | Area of Cross-Section (Measured) | Area of Cross-Section (Calculated from Model) | Error, % |
|---|---|---|---|---|
| 800 | 0.8 | 0.285 | 0.287 | 0.65 |
| 1200 | 0.8 | 0.288 | 0.290 | 0.66 |
| 1600 | 0.8 | 0.295 | 0.296 | 0.17 |
| 2000 | 0.8 | 0.301 | 0.303 | 0.78 |
| 2400 | 0.8 | 0.316 | 0.310 | 2.14 |
| 800 | 1.6 | 0.278 | 0.280 | 0.95 |
| 1200 | 1.6 | 0.284 | 0.283 | 0.29 |
| 1600 | 1.6 | 0.287 | 0.290 | 1.03 |
| 2000 | 1.6 | 0.301 | 0.296 | 1.39 |
| 2400 | 1.6 | 0.301 | 0.303 | 0.54 |
| 800 | 2.4 | 0.278 | 0.274 | 1.52 |
| 1200 | 2.4 | 0.280 | 0.277 | 1.10 |
| 1600 | 2.4 | 0.281 | 0.283 | 0.71 |
| 2000 | 2.4 | 0.292 | 0.290 | 0.84 |
| 2400 | 2.4 | 0.290 | 0.296 | 2.27 |
Publisher’s Note: MDPI stays neutral with regard to jurisdictional claims in published maps and institutional affiliations. |
© 2022 by the authors. Licensee MDPI, Basel, Switzerland. This article is an open access article distributed under the terms and conditions of the Creative Commons Attribution (CC BY) license (https://creativecommons.org/licenses/by/4.0/).
Share and Cite
Ptak, W.; Czarnecki, J.; Brennensthul, M.; Lejman, K.; Małecka, A. Evaluation of Agriculture Tires Deformation Using Innovative 3D Scanning Method. Agriculture 2022, 12, 1108. https://doi.org/10.3390/agriculture12081108
Ptak W, Czarnecki J, Brennensthul M, Lejman K, Małecka A. Evaluation of Agriculture Tires Deformation Using Innovative 3D Scanning Method. Agriculture. 2022; 12(8):1108. https://doi.org/10.3390/agriculture12081108
Chicago/Turabian StylePtak, Weronika, Jarosław Czarnecki, Marek Brennensthul, Krzysztof Lejman, and Agata Małecka. 2022. "Evaluation of Agriculture Tires Deformation Using Innovative 3D Scanning Method" Agriculture 12, no. 8: 1108. https://doi.org/10.3390/agriculture12081108
APA StylePtak, W., Czarnecki, J., Brennensthul, M., Lejman, K., & Małecka, A. (2022). Evaluation of Agriculture Tires Deformation Using Innovative 3D Scanning Method. Agriculture, 12(8), 1108. https://doi.org/10.3390/agriculture12081108