Article

Pest Region Detection in Complex Backgrounds via Contextual Information and Multi-Scale Mixed Attention Mechanism

1
Institutes of Physical Science and Information Technology, Anhui University, Hefei 230601, China
2
Institute of Intelligent Machines, Hefei Institutes of Physical Science, Chinese Academy of Sciences, Hefei 230031, China
3
Department of Computer Science, Sheffield University, Sheffield S1 1DA, UK
*
Author to whom correspondence should be addressed.
Agriculture 2022, 12(8), 1104; https://doi.org/10.3390/agriculture12081104
Submission received: 10 June 2022 / Revised: 4 July 2022 / Accepted: 25 July 2022 / Published: 27 July 2022
(This article belongs to the Section Digital Agriculture)

Abstract

:
In precision agriculture, effective monitoring of corn pest regions is crucial to developing early scientific prevention strategies and reducing yield losses. However, complex backgrounds and small objects in real farmland bring challenges to accurate detection. In this paper, we propose an improved model based on YOLOv4 that uses contextual information and attention mechanism. Firstly, a context priming module with simple architecture is designed, where effective features of different layers are fused as additional context features to augment pest region feature representation. Secondly, we propose a multi-scale mixed attention mechanism (MSMAM) with more focus on pest regions and reduction of noise interference. Finally, the mixed attention feature-fusion module (MAFF) with MSMAM as the kernel is applied to selectively fuse effective information from additional features of different scales and alleviate the inconsistencies in their fusion. Experimental results show that the improved model performs better in different growth cycles and backgrounds of corn, such as corn in vegetative 12th, the vegetative tasseling stage, and the overall dataset. Compared with the baseline model (YOLOv4), our model achieves better average precision (AP) by 6.23%, 6.08%, and 7.2%, respectively. In addition, several comparative experiments were conducted on datasets with different corn growth cycles and backgrounds, and the results verified the effectiveness and usability of the proposed method for such tasks, providing technical reference and theoretical research for the automatic identification and control of pests.

1. Introduction

Corn is one of the most cultivated planted crops worldwide and a crucial source of grain in the world. It was estimated that, by 2020, about a third of global farms were cultivating corn [1]. Ensuring production is of great importance for world food security. Corn yield is subject to various factors, among which the influence of pests is prominent. For instance, the corn borer, a very menacing pest, first eats the mesophyll during the growth of corn, and then damages the leaves. After being gnawed, the yield of the crop is seriously reduced, and the stalk is easily broken in windy conditions. As a result, early meticulous pest control has great significance. Moreover, a prerequisite for control is accurate monitoring of the degree of pest damage. In traditional agriculture, this monitoring behavior depends on agricultural experts, but manual investigation has many drawbacks: low efficiency, strong subjectivity, and being error prone. Fortunately, the development of information science provides new problem-solving ideas [2]; for example, precision agriculture combines information technology and agricultural production. In precision agriculture, a crucial issue is that of to accurately detecting pest regions and applying pesticides in a targeted and precise manner according to the degree of damage in different areas. As shown in Figure 1, crop images are first taken at fixed points according to the flight path planned by the UAV. The images are then preprocessed and the pest regions are detected by computer vision techniques. Finally, the severity of damage to different regions is assessed using clustering algorithms, which produce a heat map of degree of infestation. The key to this entire set of algorithms for automatically assessing the damage degree of the pest regions is the ability to accurately identify targets. Therefore, an automatic pest region detection model with accurate identification and fast localization is required.
In previous studies, computer vision techniques based on machine learning received attention in order to develop accurate and fast methods for pest monitoring. Qin et al. [3] proposed extracting edge features of stored-grain pests by the spectral residual (SR) method and used this feature to perform saliency edge detection. Camargo et al. [4] extracted the image features of cotton-crop disease areas, retained the main features and used the features as the input of the Support Vector Machine to identify cotton crop diseases. The above models based on traditional machine learning achieved good results. However, their performance mainly depended on the accuracy of manually extracted target region features and the controllability of the external environment. There are often several problems in the actual farmland, such as a complex environment and the small size of the pest region in the collected image; the detection accuracy of traditional methods are, therefore, adversely affected.
Deep learning technology developed rapidly in recent years, achieving much better performance than traditional machine learning, so it is being widely applied in the agricultural field. As early as 2016, Ding et al. [5] proposed a sliding-window detection algorithm with a convolutional neural network to automatically detect and count pests. Huang et al. [6] proposed a Multi-Attention and Multi-Part convolutional neural Network (MAMPNet) for citrus fly identification, combined with electronic traps for monitoring. Wang et al. [7] proposed a sampling-balanced region proposal network and introduced an attention mechanism into the residual network to enhance the features of small-object pest regions. In addition to the improvement of the network, many scholars discussed the issues from the perspective of data. Li et al. [8] proposed an effective data augmentation strategy for the CNN-based method, which rotates images to various degrees and crops them to different grids during the training phase to obtain a large number of multi-scale representations. In the final step, the detection results of different scale images are fused. By so doing, they demonstrated the effectiveness of the strategy in four pest datasets. Dai et al. [9] proposed a generative adversarial network with multiple attention, residual, and dense fusion mechanisms to upscale low-resolution pest images to increase spatial resolution and reconstruct high-frequency details of images, resulting in the recall rate of pest detection being observably improved.
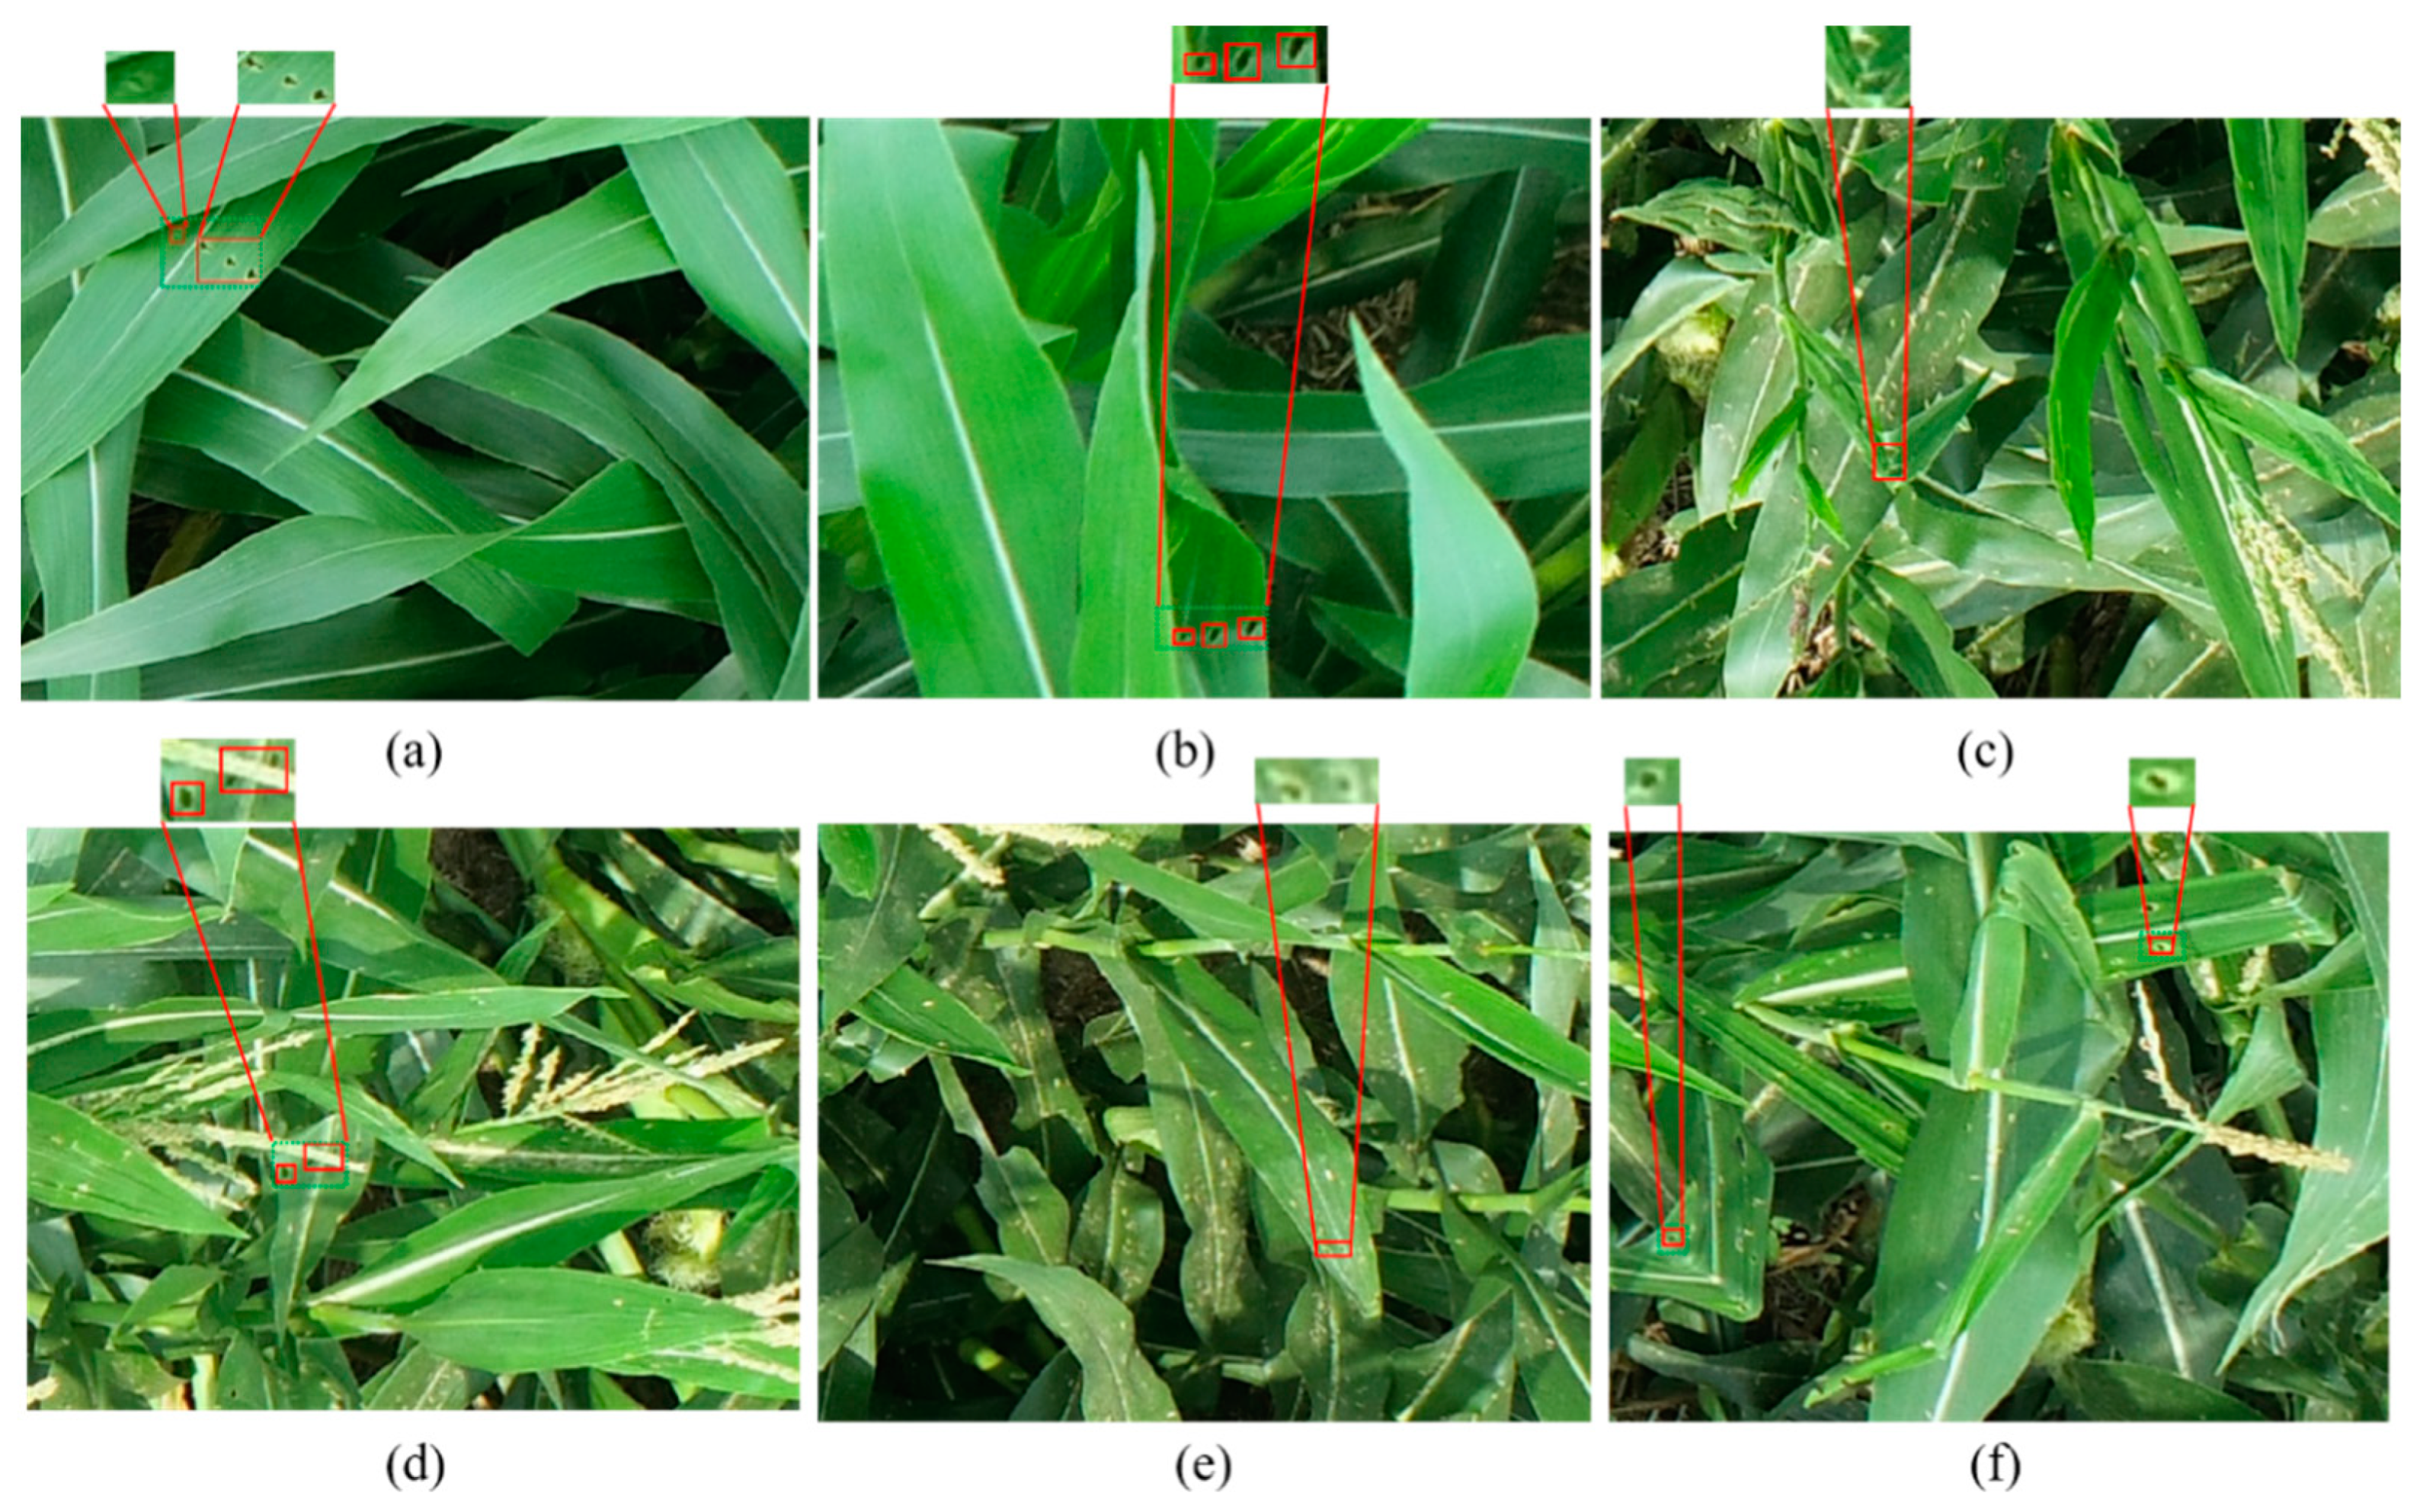
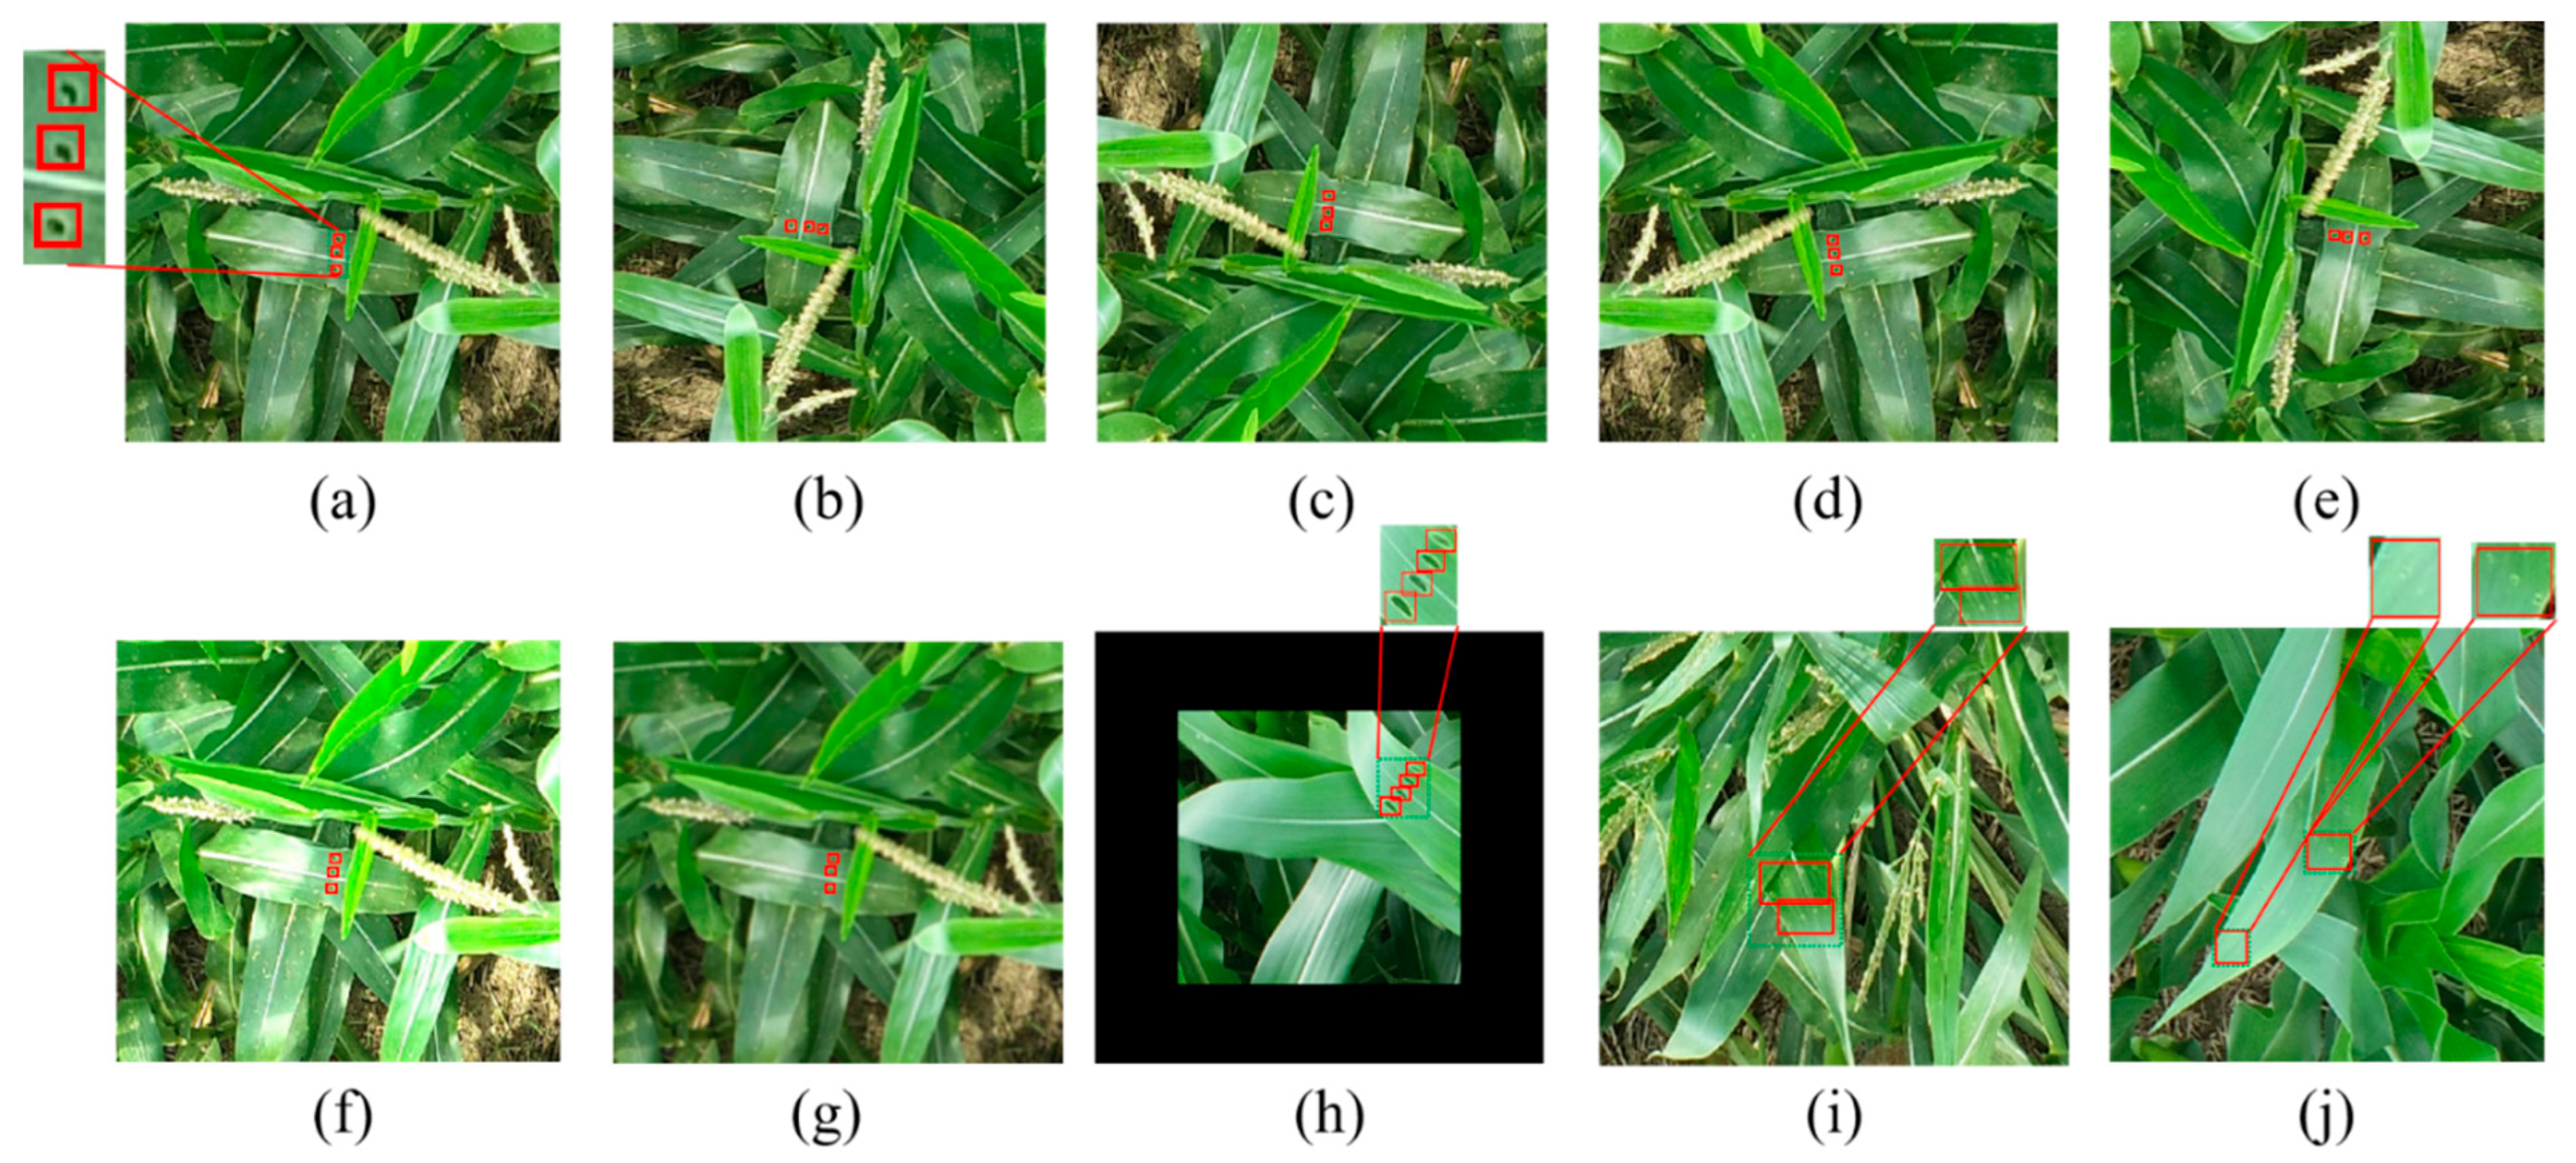
Most pest detection tasks are special subtasks of small-object detection, similar to the study in this paper; small objects are difficult to detect due to low resolution and limited pixels [10]. The object on the top left of Figure 2a is hard to identify on its own; however, by considering the surrounding information, such as a row of small holes appearing to its right, the target on the left can be recognized as a pest region. Therefore, we believe that reinforcing the target feature context can alleviate the difficulty of small pest region detection shown in Figure 2. In the research of small object detection, the context-priming method is the currently popular and is being applied in various fields. Lim et al. [9] proposed FA-SSD based on SSD [11]; the model consists of an attention block and a feature-fusion module, introducing high-level context information to improve the accuracy of small target detection. Wang et al. [12] presented a two-stage, mobile-vision-based cascading pest detection approach (DeepPest), which uses the multi-scale context information of images to build a context-aware attention network, and fuses features from different layers through a multi-projection pest detection model (MDM). Xu et al. [13] introduced a knowledge graph into object detection, encoded the context by constructing the knowledge graph which enhanced the features with the prior context information, and verified the superiority of the model through experiments. Ilyas et al. [14] adopted a multi-scale context aggregation approach for strawberry recognition, where the size of the receptive field was dynamically modified by the adaptive receptive field module to aggregate context information at different scales.
However, the above approaches either tend to build complicated models to learn contextual information, or when learning the information at different scales, the feature fusion methods adopted are not sufficient to fully utilize the features to overcome semantic gap. This paper, therefore, proposes a context-priming module with a simple structure, which introduces additional contextual information to augment the features of a corn-borer pest region. On the other hand, to suppress the interference similar to the complex background shown in 
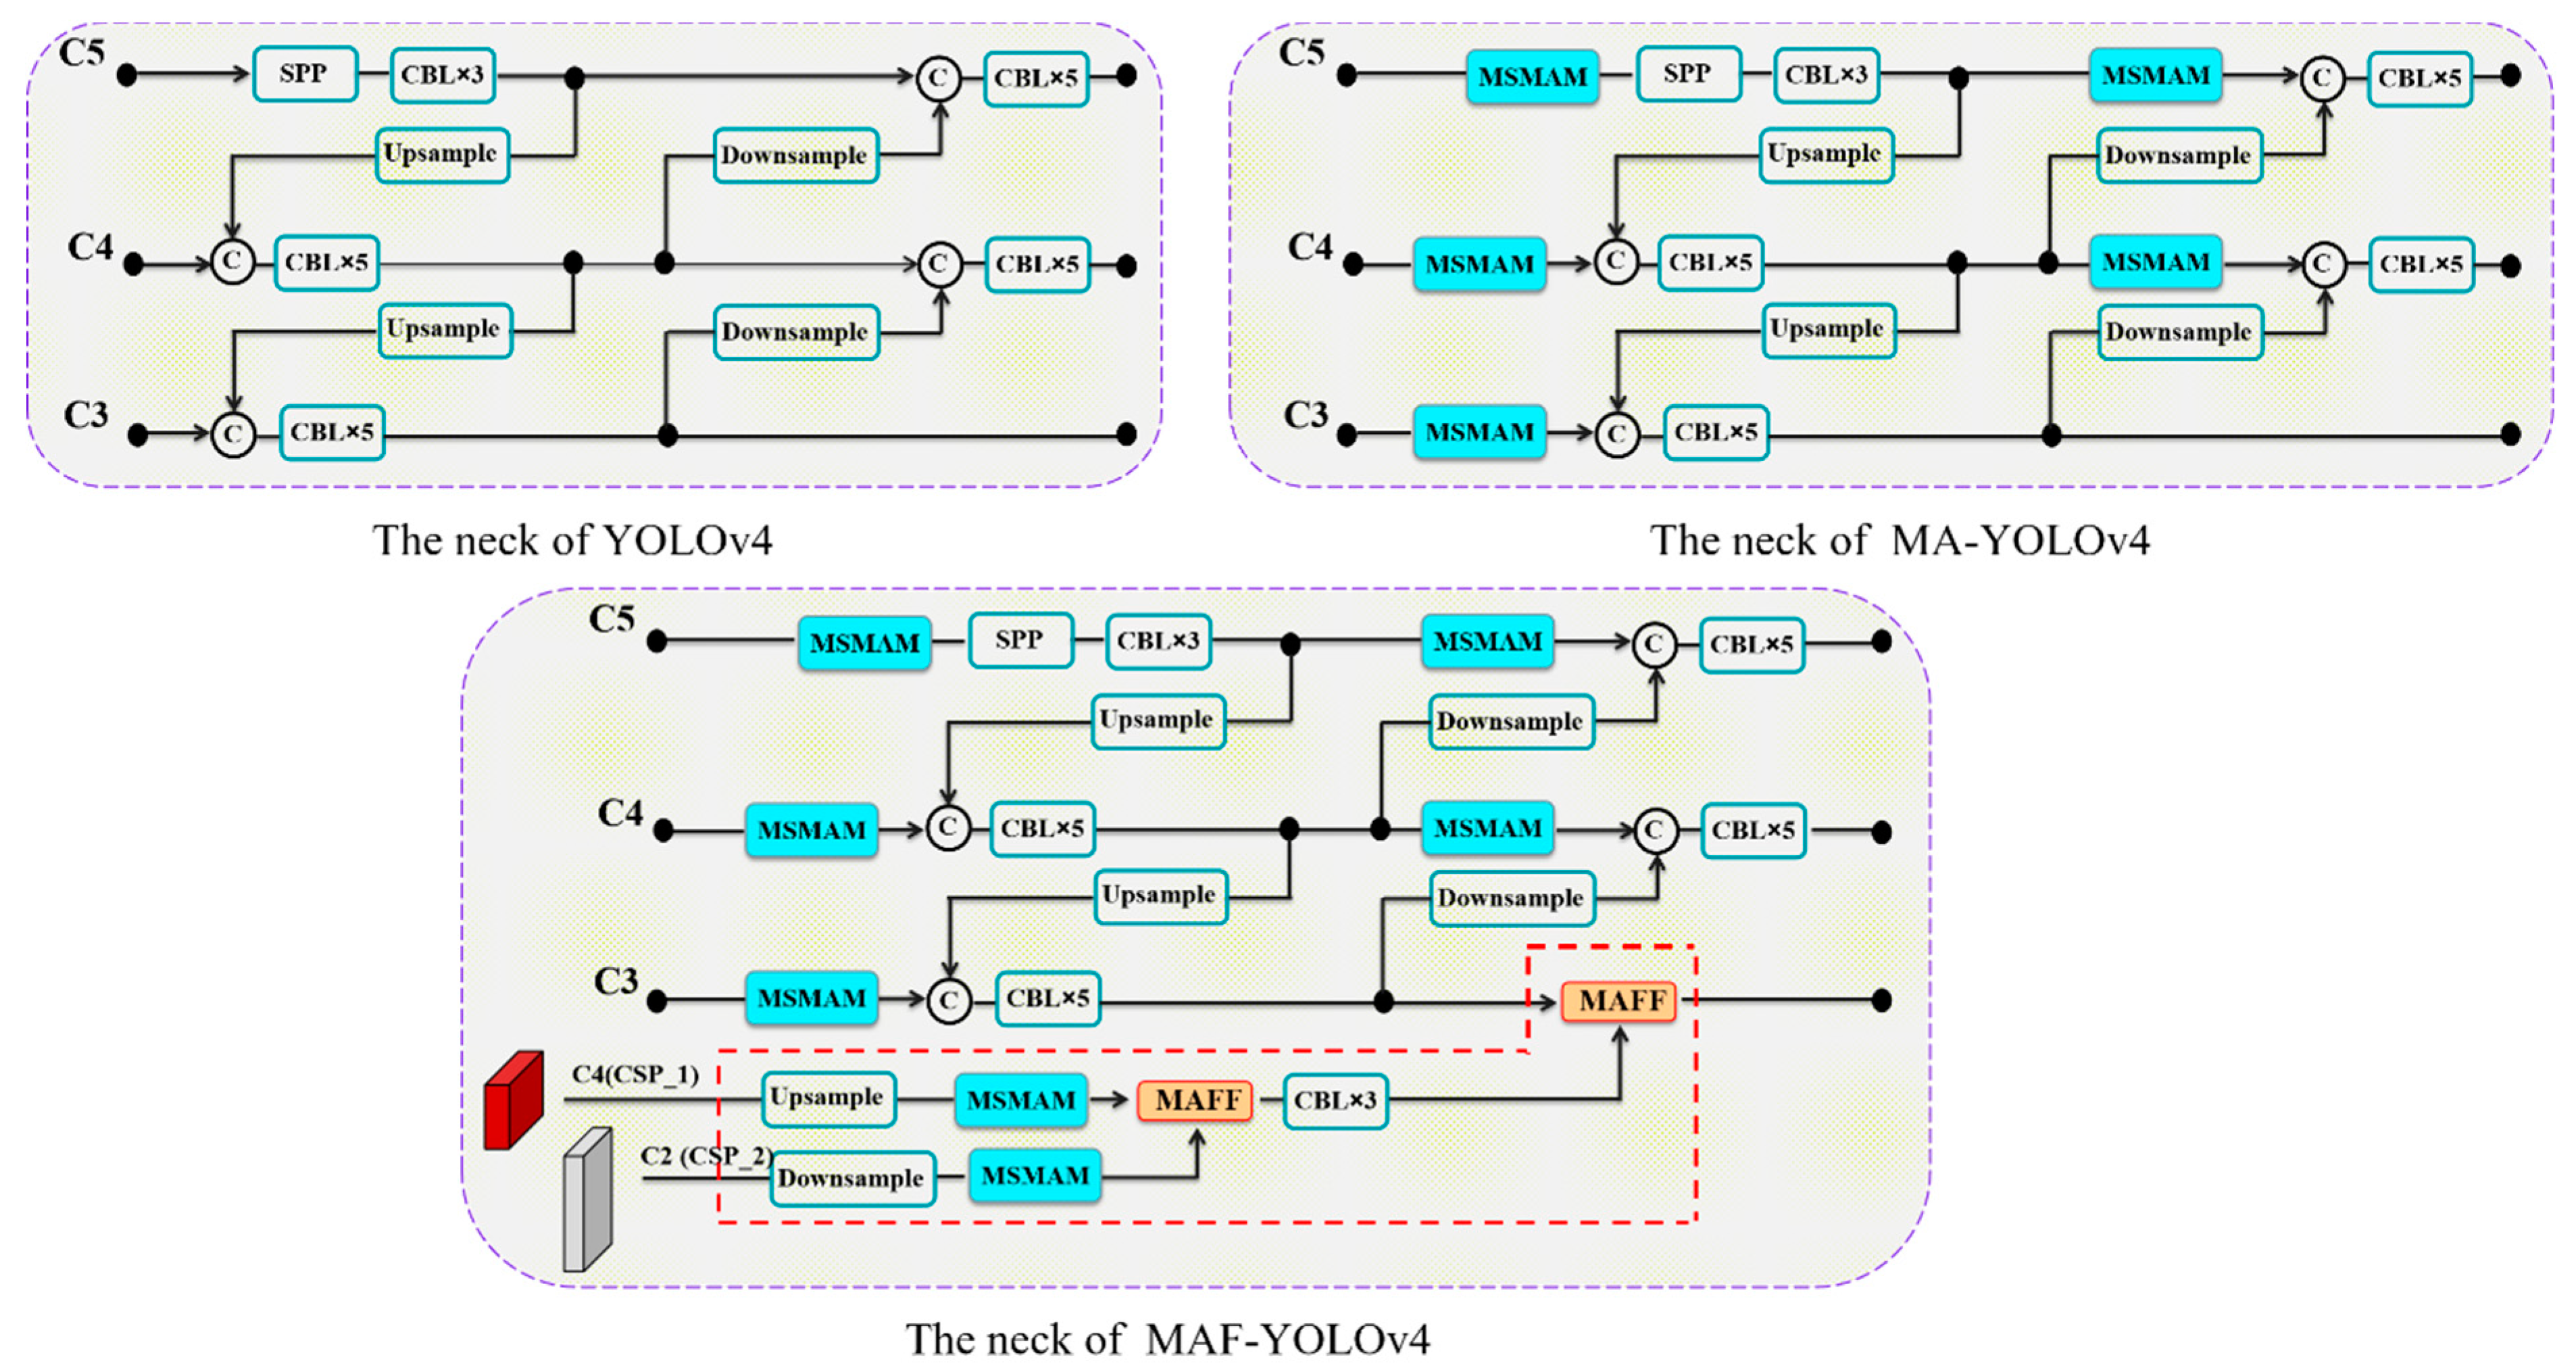
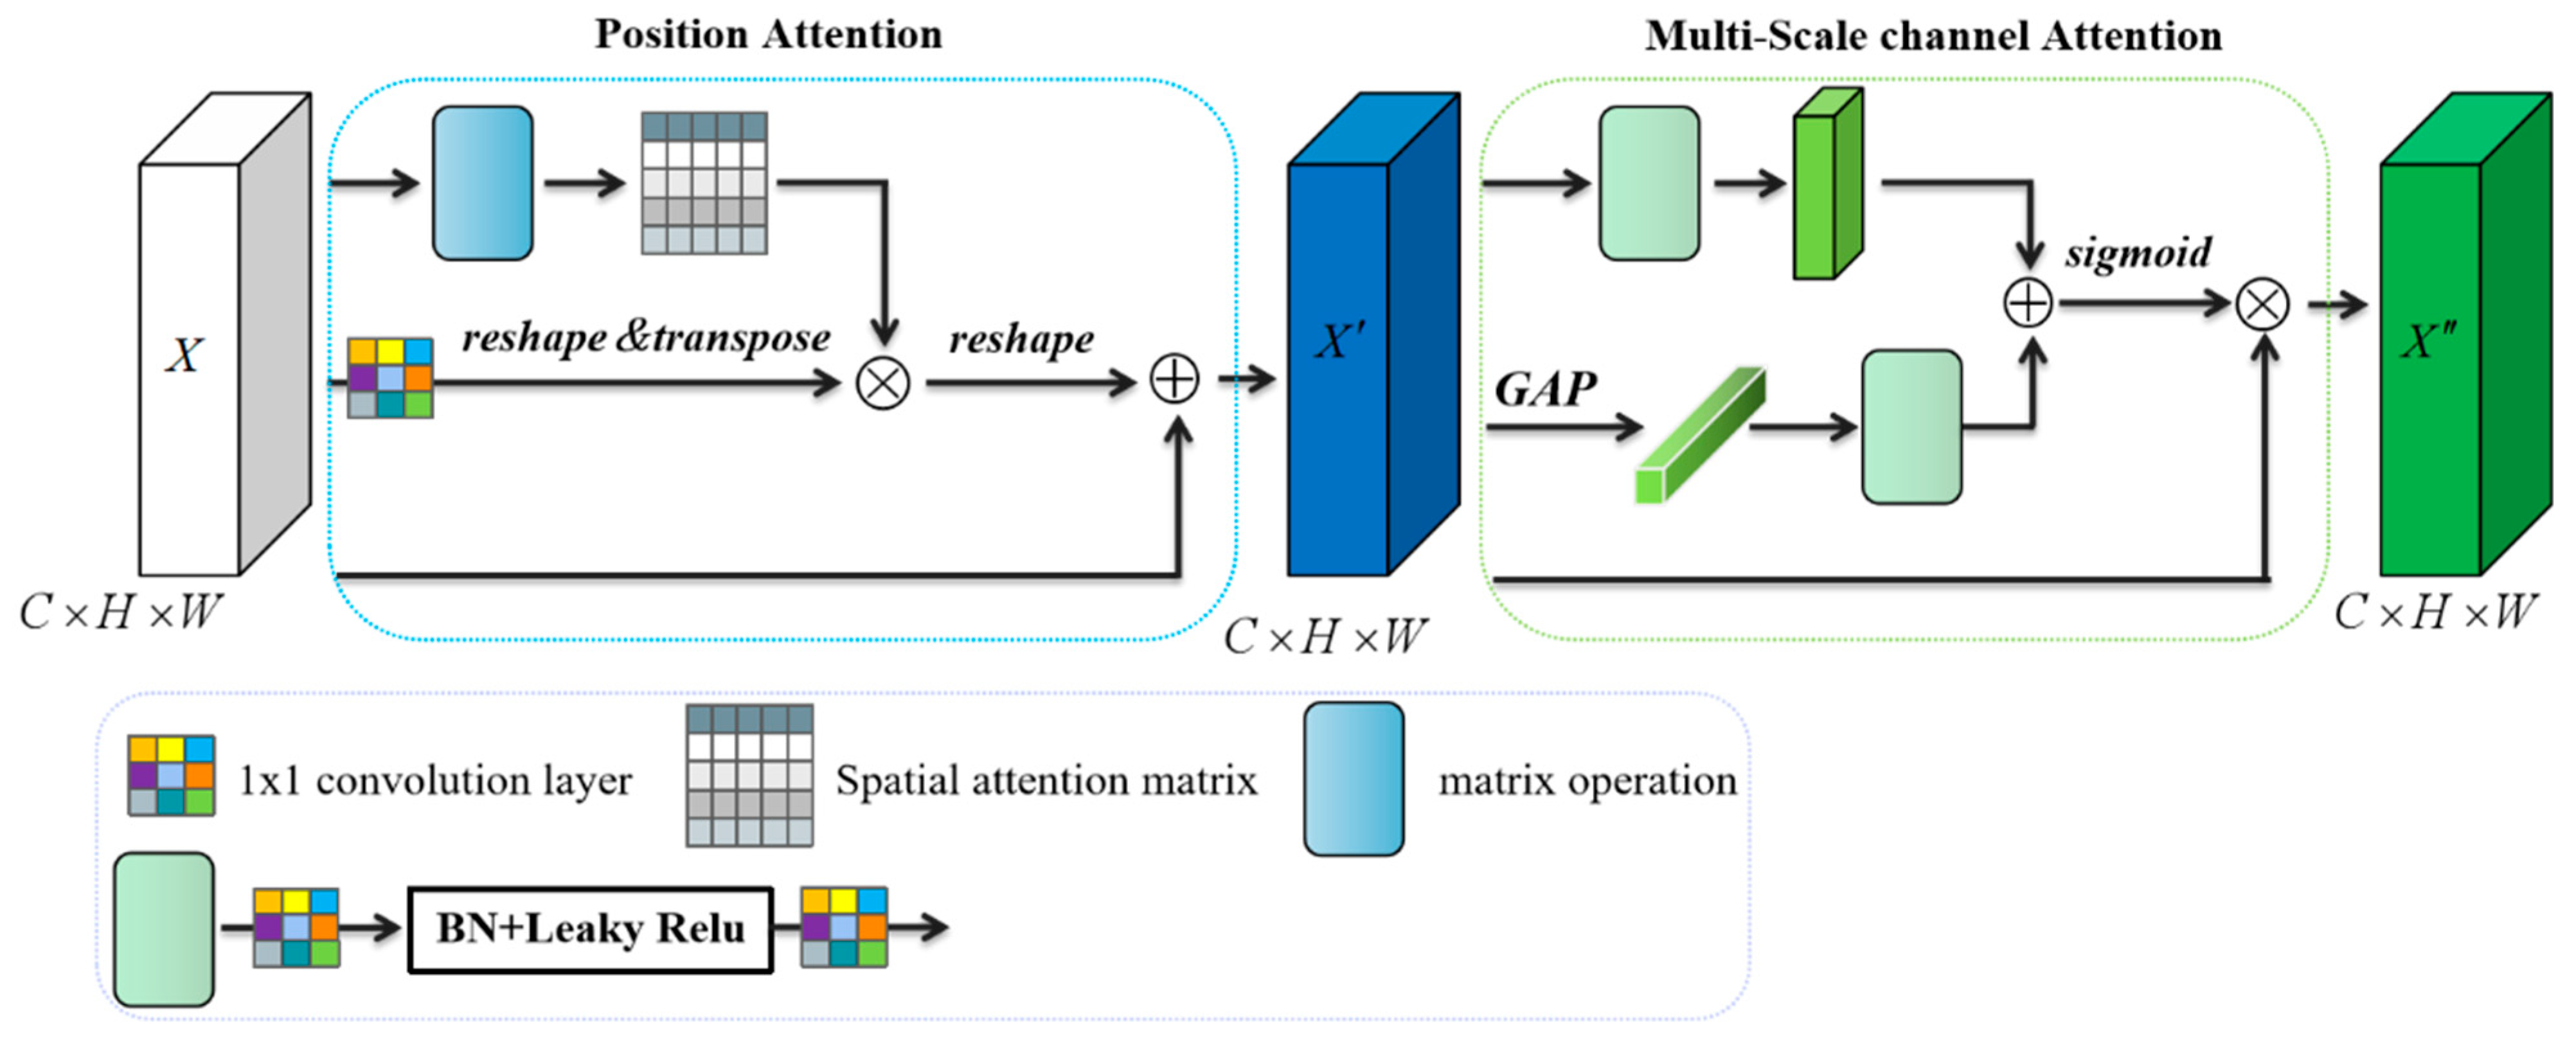
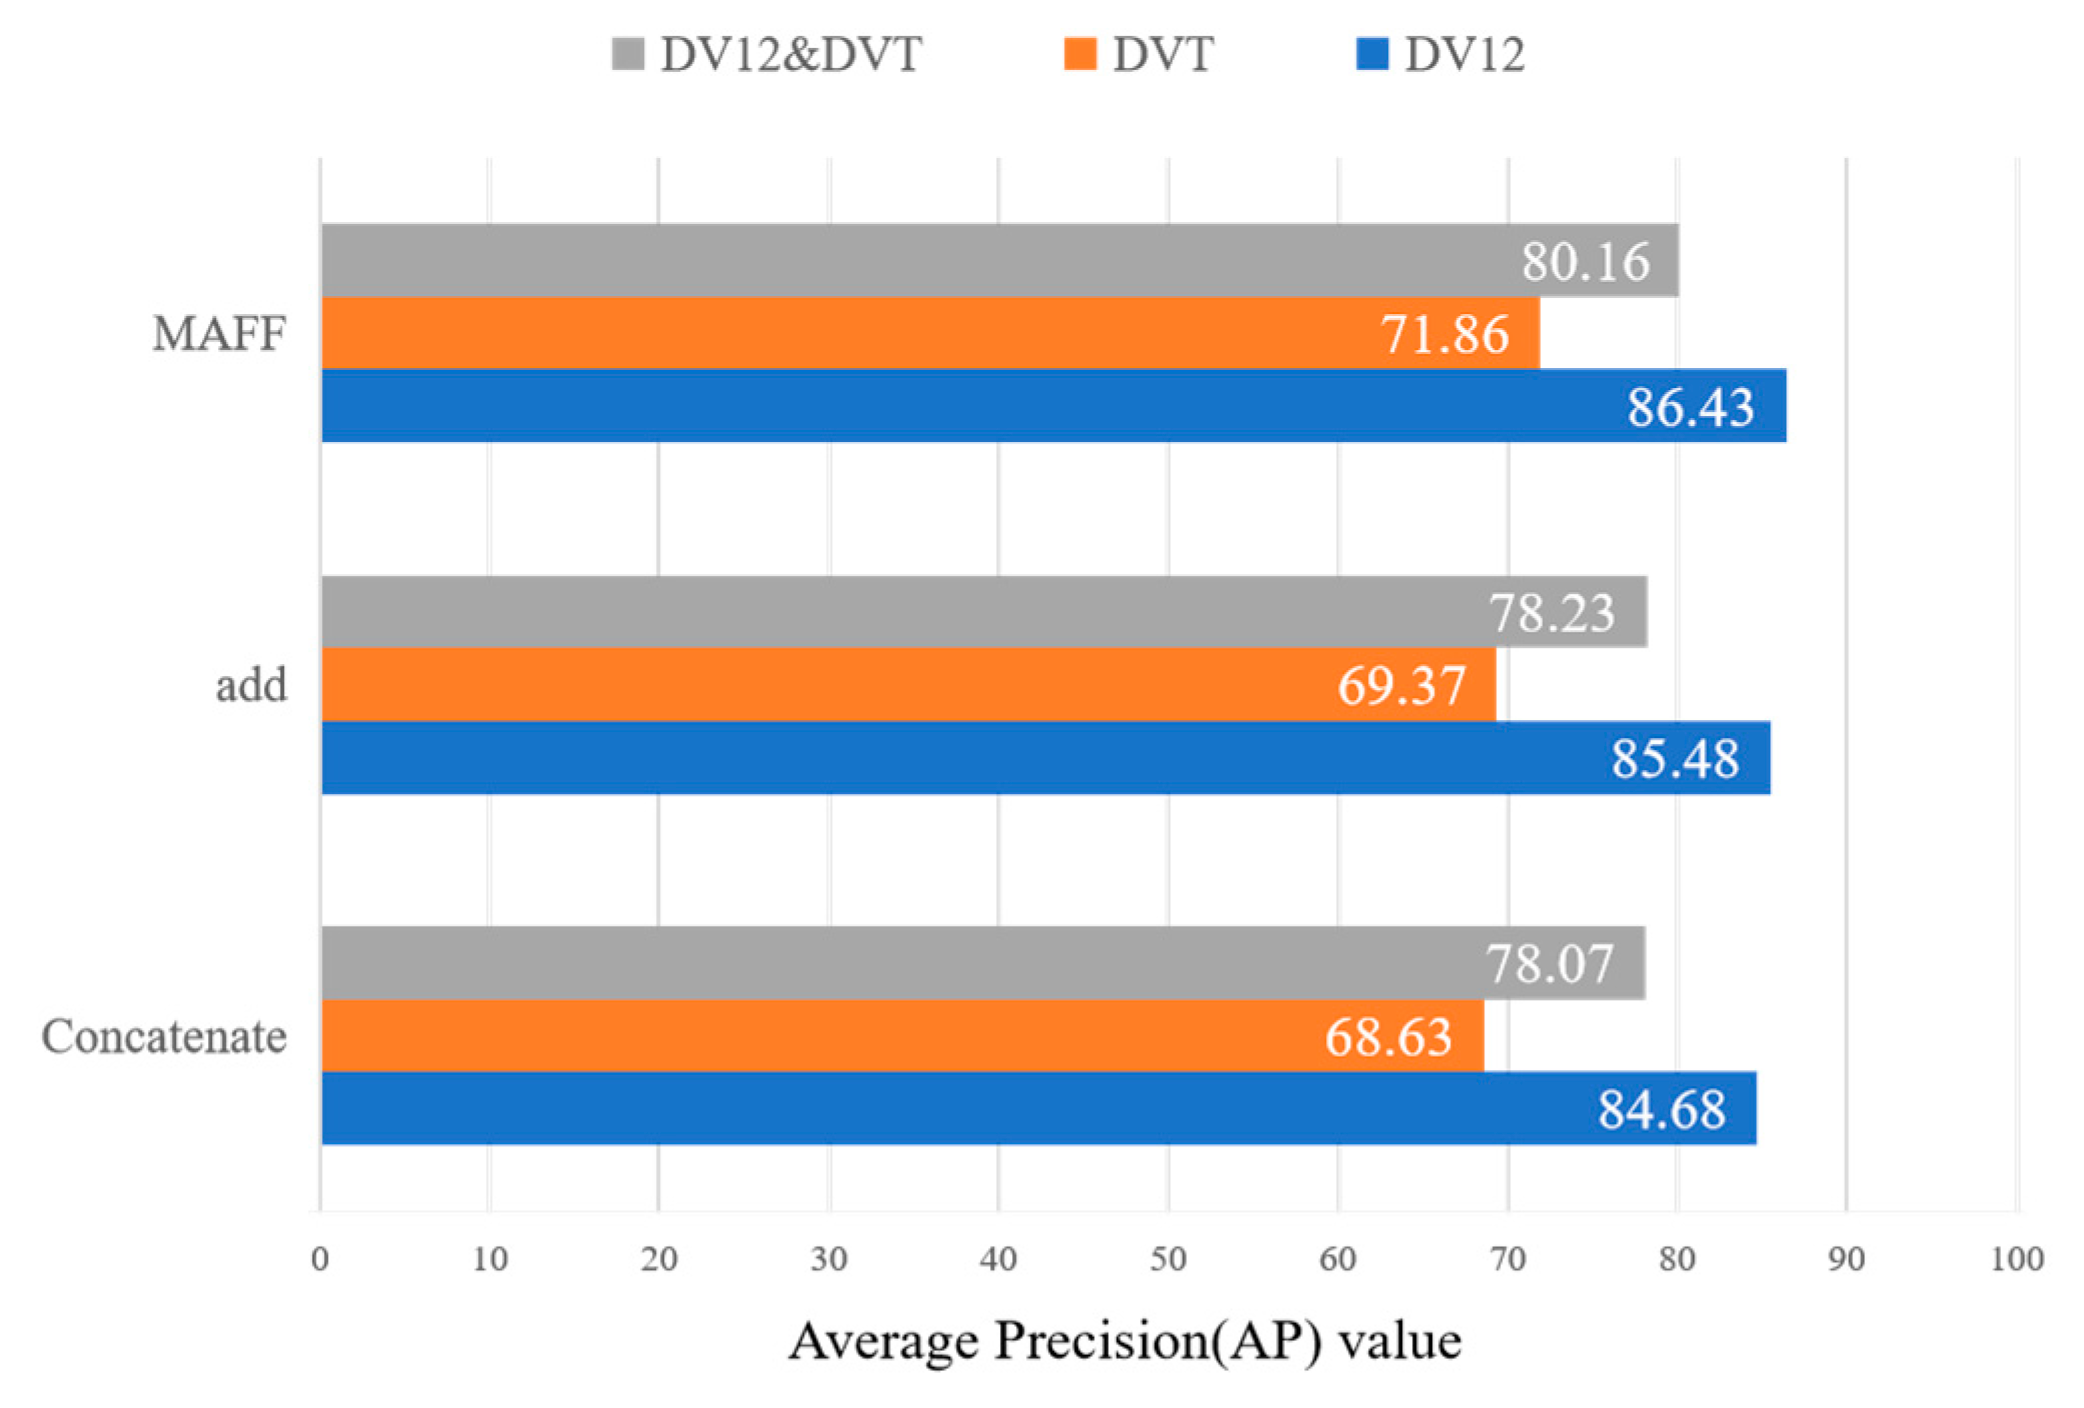
Figure 2, a multi-scale mixed attention mechanism (MSMAM) is developed to strengthen the representation ability of effective features and reduce interference. Finally, fusing the additional contextual information at different scales by simple operations, such as add or concatenation, only provides fixed linear aggregation of feature maps, and often fails to take full advantage of these features [15,
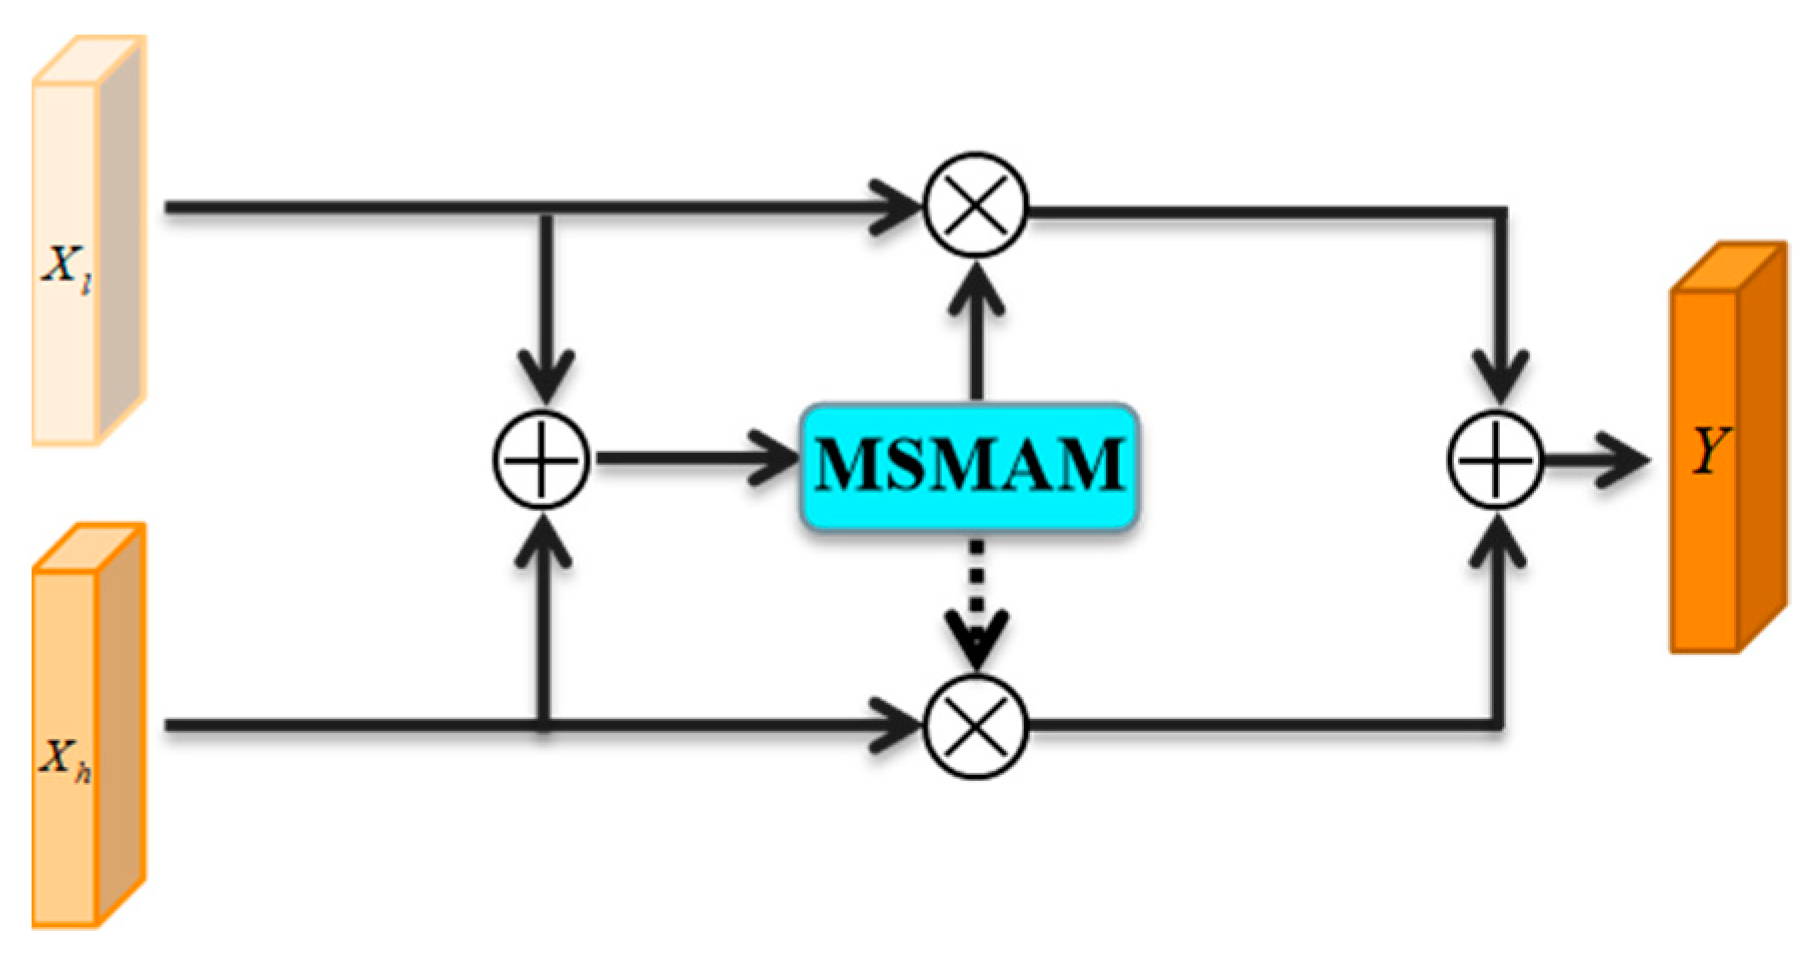
16], so a non-linear fusion method based on MSMAM, mixed attention feature fusion (MAFF) is adopted, to fully fuse effective multi-scale features and mitigate their inconsistency.
In terms of baseline models, the YOLO [17,18,19,20] series is an advanced single-stage object-detection algorithm. Lippi et al. [21] used YOLOv4 to detect pests collected by traps arranged in orchards; Liu et al. [22] improved YOLOv3 based on the idea of feature fusion for the detection of tomato diseases and pests in the natural environment; Fang et al. [
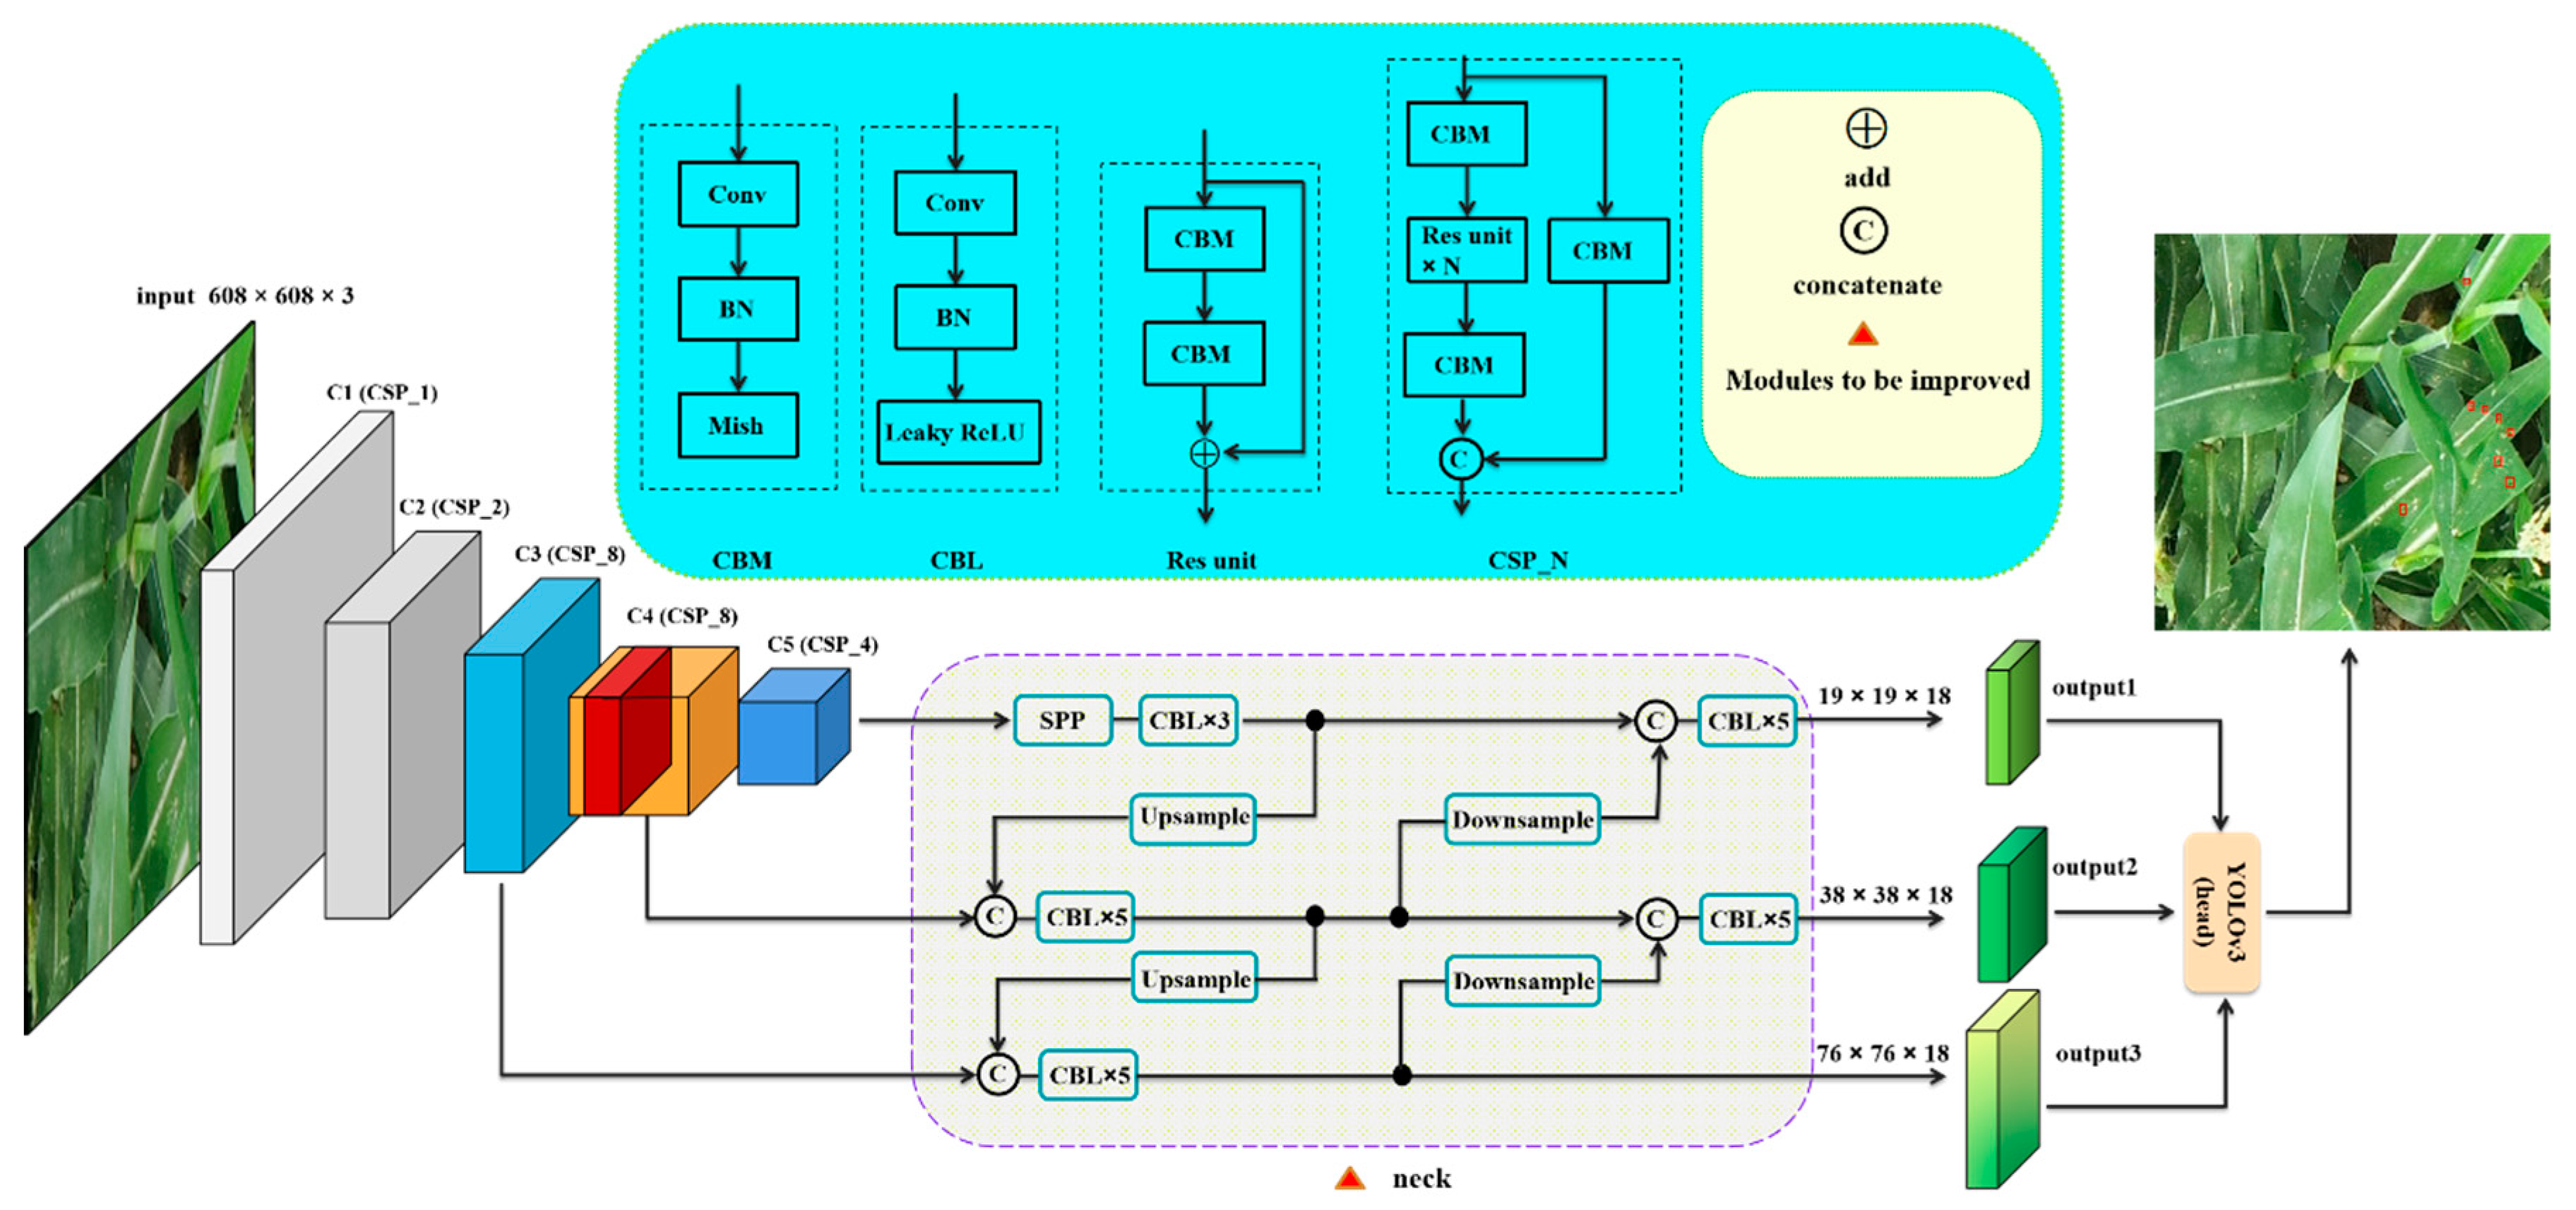
23] proposed an improved YOLOv3 network and improved the detection speed by a pruning operation for fast and accurate detection of ginger images. The above research results demonstrate that the YOLO series of algorithms produce good results in the agricultural field, so we selected YOLOv4 as the baseline model, and our proposed methods were incorporated to improve the original network.
The main contributions of this paper are as follows:
  • A simple yet effective context-priming module is proposed for intensifying pest region feature representation by fusing shallow fine-grained features with deep semantic features as additional contextual information.
  • MSMAM further improves the feature representation of a pest region through spatial dependence of different locations and channel dimensions of different scales. Based on this, MAFF is proposed to alleviate the inconsistencies in the context feature fusion of different scales by learning fusion weights and retaining useful features for fusion, these methods being applied to improve YOLOv4.
  • To comprehensively evaluate the improved model, we conducted extensive experiments on data from a variety of corn growth cycles. The experimental results show that our approach achieves better performance and robustness. It can provide a technical reference for future pest monitoring projects in precision agriculture.

2. Materials and Methods

The aim objective of this paper is to improve the detection performance of corn-borer pest regions in a complex background, and to obtain a unified model with better detection performance in different corn growth cycles to meet the requirements of early control of corn pests in precision agriculture. In this section, we present the material used in the study, and briefly discuss the baseline YOLOv4, followed by our proposed approaches for enhancing detection capability. First, we introduce proposed MSMAM that enables the model to focus on important information. Second, we elaborate on the context-priming module and the proposed MAFF based on MSMAM, for fusing additional contextual information to augment pest region feature representation. Finally, these are combined to improve YOLOv4, named MAF–YOLOv4.

2.1. Dataset

The dataset of the corn-borer pest region used in this study was collected in the demonstration area of an unmanned farm in Bozhou City, Anhui Province, China. The data collection equipment was a DJI spirit 4RTK UAV; Figure 1 illustrates the image collection process for this study. To effectively detect borer pest regions in different corn growth cycles, we used UAV to shoot at five meters in the low air and collect representative data: the vegetative 12th (V12) and vegetative tasseling (VT) stages of the corn. The resolution size of images was 4864 × 3648 and 1424 valid samples were selected. Of these, 502 samples of the V12 stage were named DV12, and 922 samples of the VT stage were named DVT. DV12 and DVT were randomly divided into sets, as follows: training set, validation set, and test set according to the ratio of 8:1:1, respectively. We then used data augmentation to expand DV12 and DVT to 1720 and 3217 images, respectively, and combined them to obtain a total of 4937 samples for model training.
In this paper, we use part of an image (Figure 2) representation from the training set. At the V12 stage, there are many corn leaves and the background is relatively pure, as shown in Figure 2a,b. The main problem is that the size of the pest region is small. Figure 2c–f all belong to the VT stage. The occurrence of pollination, heading and other phenomena during this stage results in a more complex background in the image. Leaves bitten by the corn borer can be broken by a strong wind, forming different features from the common corn-borer pest region, as shown in Figure 2c. Different physiological phenomena in each corn growth cycle have different effects on the detection task; for example, stamens growing after heading may cause occlusion to the target, as shown in Figure 2d. Following this, a large amount of pollen is emitted, as shown in Figure 2e,f, which will overlap the target, and the distribution of some pollen is very similar to the features of the pollen-stained pest region, which will interfere with detection. These complex backgrounds impact greatly on the detection of pest regions belonging to small targets, which is a huge challenge.

2.2. Data Augmentation

There are few samples of corn-borer pest regions in real environments, and different imaging conditions, such as light intensity and angle during data collection, lead to variations in data quality. Data have a substantial impact on deep learning. Several data augmentation methods were applied to expand the diversity and richness of the training samples as follows: rotation, flipping, brightness transform, Gaussian blur processing, resampling and padding. The first four methods (Figure 3b–g) were randomly combined and used for data augmentation for each training sample, while the corresponding annotation files were transformed. The samples of DV12 were expanded from 401 to 1604, and the samples of DVT were expanded from 737 to 2948. In the latter two methods (Figure 3h–j), 116 and 269 samples were selected from the DVT and DV12 for padding and resampling, respectively. The final training data contain 4937 images.

2.2.1. Data Augmentation: Image Rotation and Flipping

Rotation and flipping are common data augmentation techniques used in deep learning to effectively extend data samples and improve model detection performance [24]. In this study, the original images were rotated by 90°, 180°, 270° and flipping.

2.2.2. Data Augmentation: Image Brightness and Gaussian Blur Processing

Different angles and intensities of sunlight exposure and crop-induced shadows may occur during data collection in natural environments, so the image-brightness transform technique was used to perform data augmentation on training samples. A randomly selected scale factor from 0.5 to 1.5 was multiplied by the original image RGB, causing the image brightness to change (the brightness remains constant when the factor equals 1). In addition to lighting conditions, the detection performance of the neural network is also affected by the blurring of the images due to different imaging conditions, so we blurred the training samples using Gaussian blur processing, where the standard deviation of the Gaussian kernel was randomly sampled from the interval (0.0, 3.0). These methods simulated images of pest regions under various lighting and imaging conditions, strengthening the robustness of the model.

2.2.3. Data Augmentation: Resampling and Padding

To further enrich the training samples, some of the images were chosen for padding or resampling. In the target detection, different imaging conditions, such as shooting angle and camera distance, usually result in different target scales. For larger targets, as shown in Figure 3h, we padded their edges, expanded the image to 1.5 times the original size, and then resized back to the original size. During image preprocessing, we found that some pest regions had few features, such as Figure 3i,j—only a single row of white dots developed when the corn borer began to consume the leaves. There are few samples containing such features in the original data, so we used resampling to enrich the number of target features. The padding and resampling expanded the number of training samples and the diversity of the samples was further enhanced, which had a positive effect on detection performance.

2.3. YOLOv4

YOLOv4 was formed by the continuous optimization of YOLO series algorithms. Compared with two-stage detection algorithms, such as Faster R-CNN [25], the detection speed is greatly improved since no proposal regions are required. YOLOv4 consists of three parts: backbone, neck, and head, as shown in Figure 4. The backbone is CSPDarknet53 [20], which is composed as follows: small residual blocks are formed by stacking CBM modules (convolutional layer, BN layer, Mish activation function layer), and then stacking small residual blocks to form five large residual blocks (Resblock) (C1, C2, C3, C4, C5), which extracts the deep features of input. The neck consists of SPP [26] and PAN; the former is similar to SPP in YOLOv3, which expands the receptive field of network. The latter draws on the idea of PANet [27] on the basis of FPN, improves information utilization, and better integrates the three feature maps’ (C3, C4, C5) output by the backbone. By altering the neck structure, as shown in Figure 5, the detection accuracy was improved without much increase in computational cost. The head is inherited from the YOLOv3 head.

2.4. Multi-Scale Mixed Attention Mechanism

When viewing a picture, human beings pay attention to its more critical information and skip the irrelevant parts. The deep learning-based attention mechanism is designed to mimic the human visual attention process. Hu et al. [28] proposed for the first time the channel attention mechanism, Squeeze-and-Excitation Networks (SENet), in the process of convolution network operation, through learning weights and giving different weights to different features that achieve the purpose of better feature selection. Inspired by the operation of Non-local means, Wang et al. [29] proposed Non-local Neural Networks (NLNN), which directly captures long-range dependencies by computing the interaction between any two locations to obtain an enlarged receptive field. Fu et al. [30] proposed Dual Attention Network (DANet); this model establishes semantic correlations in spatial and channel dimensions through different attention mechanisms to obtain better feature representation. Recently, scholars considered the scale problem in the attention mechanism and combined the feature contexts of multiple scales in the attention module to achieve a multi-scale attention mechanism [16]. For example, the pyramid attention mechanism extracts different scale feature contexts inside the attention module, which effectively enhances the significance representation [31].
The above attention mechanisms achieved good results in various detection tasks; however, there are challenges in this study, such as small targets, complex background, and scale change. This means that capturing long distance contexts is more effective for detecting pest regions with a global distribution, but that multi-scale attention is unable to extract sufficient context due to the limitations of convolution operations. We, therefore, combined position attention block (PAB) and multi-scale channel attention block (MS-CAB) to form a multi-scale mixed attention mechanism (MSMAM), as shown in Figure 6. PAB obtains more sufficient long-distance context by calculating the spatial dependencies of any two positions in the feature map, while MS-CAB comprises global attention and local attention composition to aggregate different scale feature contexts along a channel dimension.
Given an intermediate feature map X R C × H × W as input where the feature map size is H × W and the channel dimension is C, X derives X and X sequentially through PAB and MS-CAB, and the shape remains unchanged. The main process can be summarized as:
X = X Q ( X )
X = X C A ( X )
where denotes Broadcast addition, denotes element-wise multiplication. Q , C A represent PAB and MS-CAB, respectively.

2.4.1. Position Attention Block

When an image is used as input in a neural network, the receptive field of the feature map obtained after several convolutions gradually becomes larger, and any position in the feature map usually contains some surrounding information. However, convolution is a local operation and captures limited information; also, multiple overlays cannot capture features at all locations, especially those far away. For example, in Figure 2f, the pest regions in the two locations have similar features; it is hard to capture the relationship between the two only through convolution, due to the distance. Thus, we applied PAB to calculate the spatial dependence of any two locations in the feature map and obtained the weight determined by regional similarity, as shown in Figure 7. The overall process can be summarized as:
q i , j = σ ( I ( x i , j ) T M ( x k , l ) ) N ( x k , l )
In short, the position attention is computed as:
Q ( X ) = σ ( I ( X ) T M ( X ) ) N ( X )
Q ( X ) = σ ( ( W I X ) T W M X ) N ( X )
Q ( X ) = σ ( X T W I T W M X ) N ( X )
where ( i , j ) represents the coordinates to compute the dependencies between the current position and other positions, q is the output signal, ( k , j ) are the coordinates of any possible position in the feature map, σ represents sigmoid function, I ( x i , j ) = W I x i , j , M ( x k , l ) = W M x k , l , and N ( x k , l ) = W N x k , l . I ( x i , j ) , M ( x k , l ) , N ( x k , l ) are the outputs of the corresponding convolutional layer, respectively. W I ,   W M , W N R C r 1 × C r 1 are the corresponding convolutional layer parameters, respectively.

2.4.2. Multi-Scale Channel Attention Block

Based on the idea of the multi-scale attention mechanism mentioned in 2.4, MS-CAB was designed for aggregating feature contexts at different scales via 1 × 1 convolution in the attention module, and it extracts context along the channel dimension and controls the scale variation by varying spatial pooling size. The structure consists of two branches, a global branch and a local branch, implementing via global average pooling and 1 × 1 convolution, respectively, as shown in Figure 8. The two scales are aggregated to obtain a feature context, which aids the network detect locally distributed small pest regions. Global context G ( X ) R C × 1 × 1 and local context L ( X ) R C × H × W can be expressed, respectively, as follows:
Global:
G ( X ) = B N ( C 2 ( ( L R ( B N ( C 1 ( g ( X ) ) ) ) ) ) )
Local:
L ( X ) = B N ( C 2 ( L R ( B N ( C 1 ( X ) ) ) ) )
Combining the output of G ( X ) and L ( X ) , the output of C A ( X ) is obtained as follows:
C A ( X ) = σ ( G ( X ) L ( X ) )
where C 1 and C 2 represent convolution operations with the convolution kernel parameters of C r 2 × C × 1 × 1 and C × C r 2 × 1 × 1 , respectively. LR is the Leaky ReLu activation function, g represents global average pooling.
The neck of YOLOv4 was modified by embedding MSMAM, to obtain a new network, MA–YOLOv4, as shown in Figure 5.

2.5. Fusing Context by MAFF

Due to the small size, low resolution, and limited information contained in the corn-borer pest region, we provided additional context features to augment the feature representation of the pest region. We fused high layer, more abstract, and stronger semantic information with low layer containing more detailed location information, and extracted the pest region feature connected with the multi-scale context features. YOLOv4 adopts the idea of hierarchical prediction to generate three feature maps of different sizes, as shown in Figure 4. The order of map sizes from small to large is C5, C4, C3. C3 is relatively large and includes more small-target information. We considered using C3 as the target feature map and fused extra context features to intensify it. The additional context features to be fused came from the shallow layer C2 (CSP_2) and the deep layer C4 (CSP_1). However, we directly provided different layers of contextual information to augment the small target features, but this also brought much invalid information. Thus, MSMAM was used to reduce unnecessary information in the feature maps. The shapes of these two feature maps were inconsistent so we downsampled C2 (CSP_2) and upsampled C4 (CSP_1), respectively, so that both were the same size as C3. First, multi-scale features from different layers were fused; the features were then refined by convolution to remove redundant information, thereby preventing the target features from being overwhelmed by the additional features, and finally fused with the target features. Figure 9 shows how we connected contextual information.
For feature fusion, common methods, such as addition or concatenation, are often unable to fully integrate multi-scale features. Recently, several improved feature fusion methods were proposed, such as ASFF [15], BiFPN [32], and NAS-FPN [33]; these tend to fuse features from different layers by constructing complex paths or methods. We applied MAFF with a simpler structure; this uses MSMAM as the kernel to select effective fusion features by calculating the fusion weights of different scale feature maps, alleviate semantic inconsistency, and scale inconsistency caused by multi-scale feature fusion in pest region detection, as shown in Figure 10. The computing process of the output Y R C × H × W of MAFF can be summarized as:
Y = M S M A M ( X l X h ) X l + ( 1 M S M A M ( X l X h ) ) X h
where X l R C × H × W is the low layer feature map, X h R C × H × W is the high layer feature map, the value range of M S M A M ( X l X h ) and 1 M S M A M ( X l X h ) are between (0, 1), which are the fusion weights.

3. Results and Discussion

In this section, we verify and analyze the method proposed in this paper through different combined comparative experiments on different growth cycle data; the experimental datasets are DV12, DVT, and DV12&DVT—a combination of the former two. The specific experimental environment is shown in Table 1.
Due to limited GPU resources, we set the batch-size to eight and the initial learning rate to 0.001, which gradually decays according to the initial settings. Parameters, such as momentum and weight decay, refer to the initial parameters in YOLOv4; the number of training iterations was 50,000. For the sample size, 608 × 608 resolution which is more difficult to detect was selected for experiments to verify the effect of the model on small pest region detection.
To accurately evaluate the detection performance of a model, the following evaluation metrics are usually adopted in object detection: precision, recall, F1-score, and average precision (AP); accordingly, we used these to evaluate the performance of our proposed model. The specific calculation method was as follows:
P r e c i s i o n = T P T P + F P
R e c a l l = T P T P + F N  
F1-score = 2 × P r e c i s i o n × R e c a l l P r e c i s i o n + R e c a l l  
A P = 0 1 P r e c i s i o n × r e c a l l   d r
where TP is true positive samples, FP is false positive samples, TN is the true negative samples, FN is false negative samples, and AP is the area under the PR curve. The precision rate and recall rate obtain different values due to different I o U thresholds; we set the threshold to 0.5 in this paper. In the evaluation index, the AP or F1-score is usually used to comprehensively evaluate the detection performance of an algorithm. In this paper, we considered AP as the reference metric in order to evaluate model performance more comprehensively and fairly.
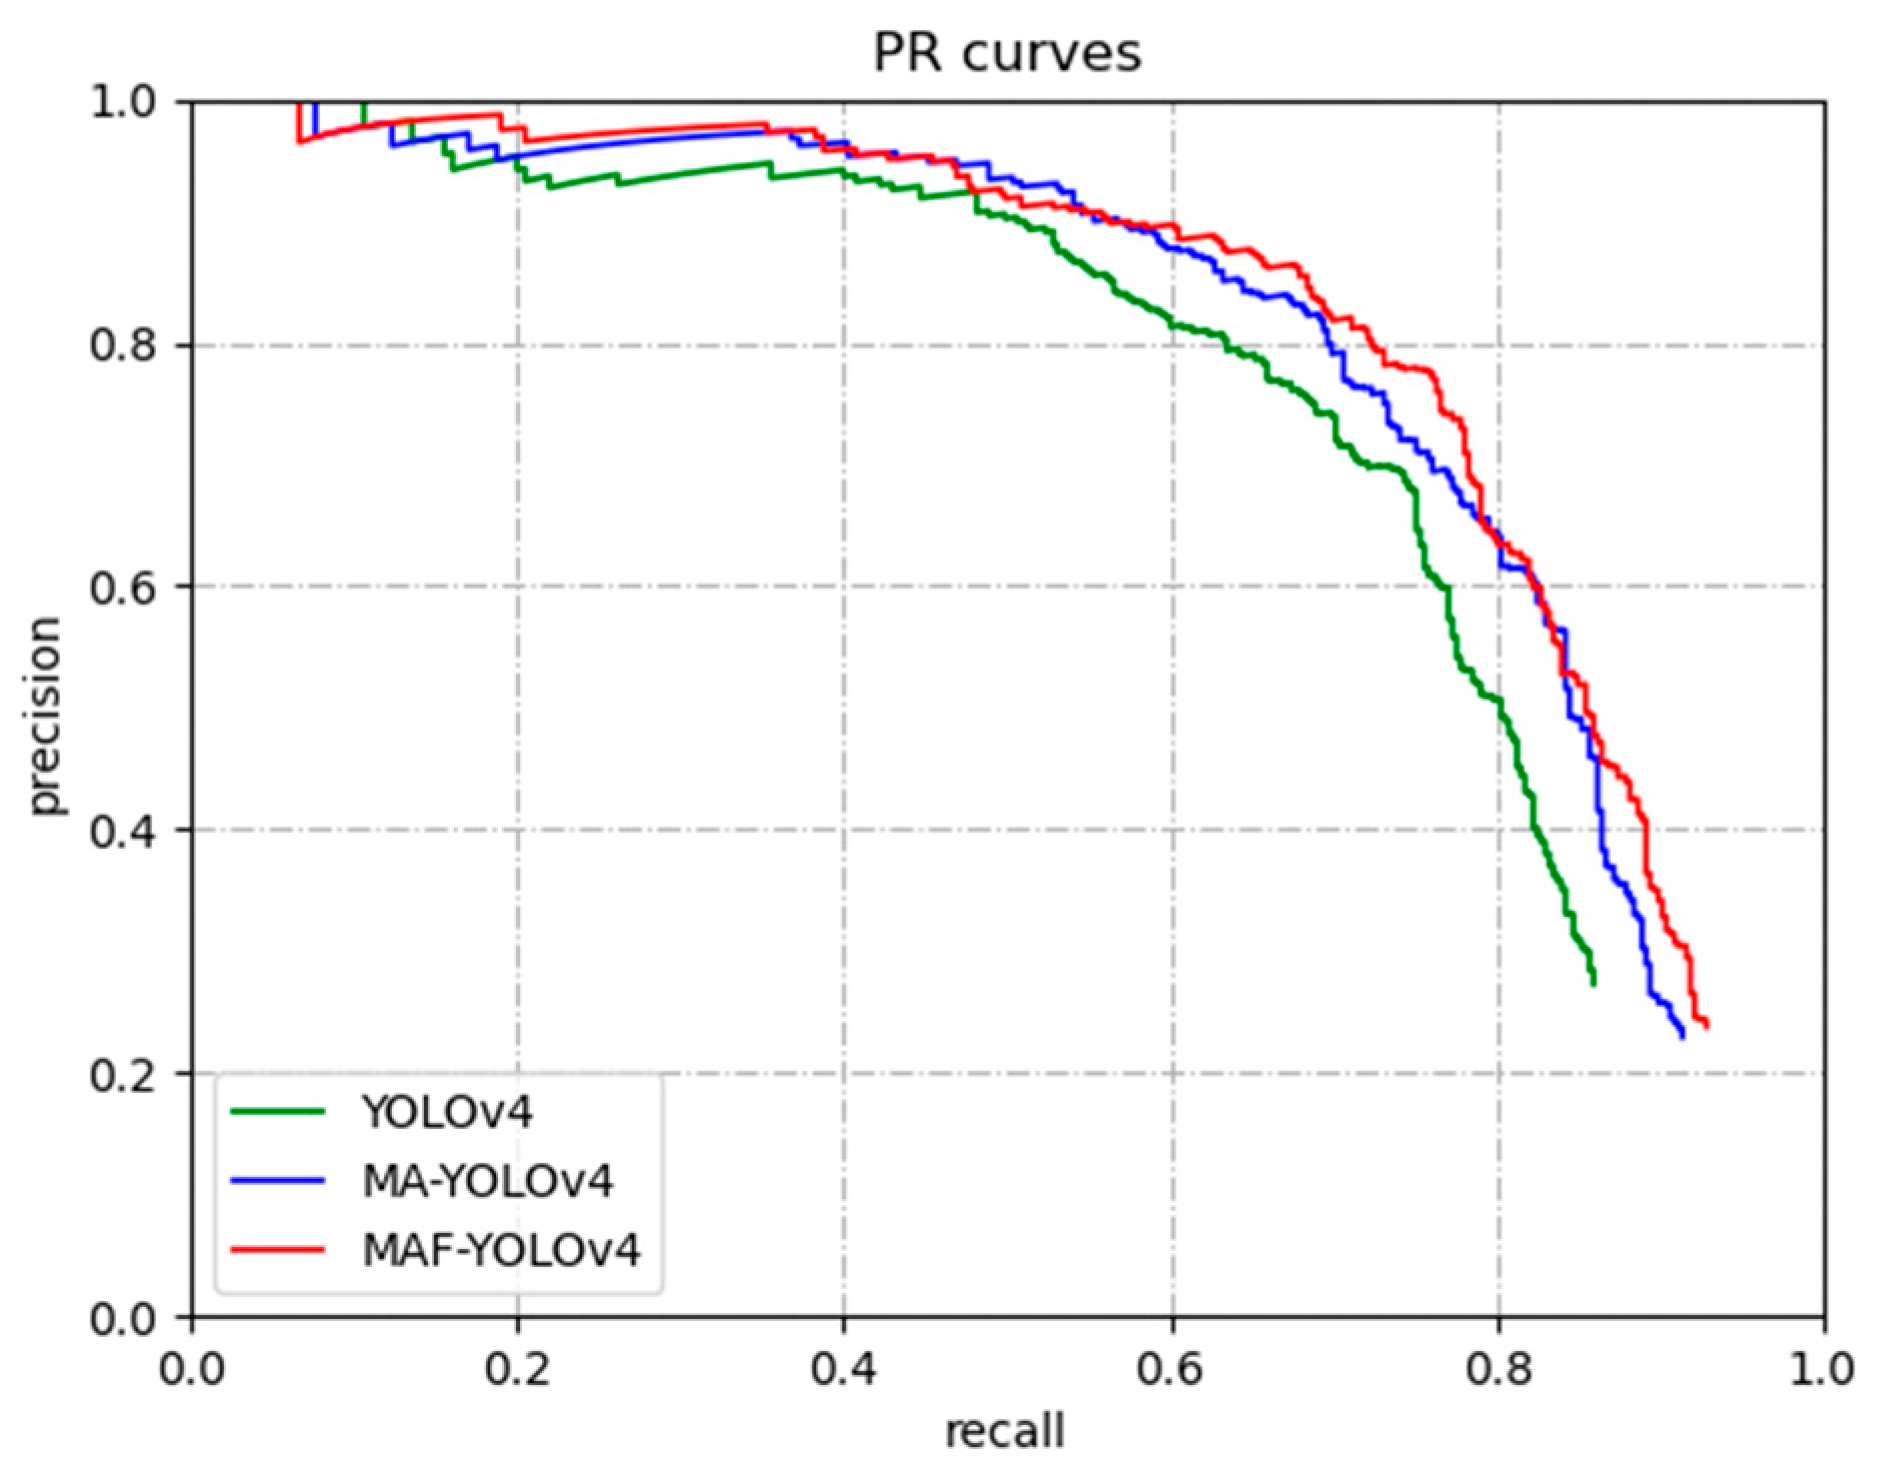
The PR curves for YOLOv4, MA–YOLOv4 and MAF–YOLOv4 are shown in Figure 11. The area under the PR curve represents the AP. It can be seen from Figure 11 that the area of MAF–YOLOv4 is the largest, which represents the improved model with better performance.

3.1. Performance Comparison of the Improved Model

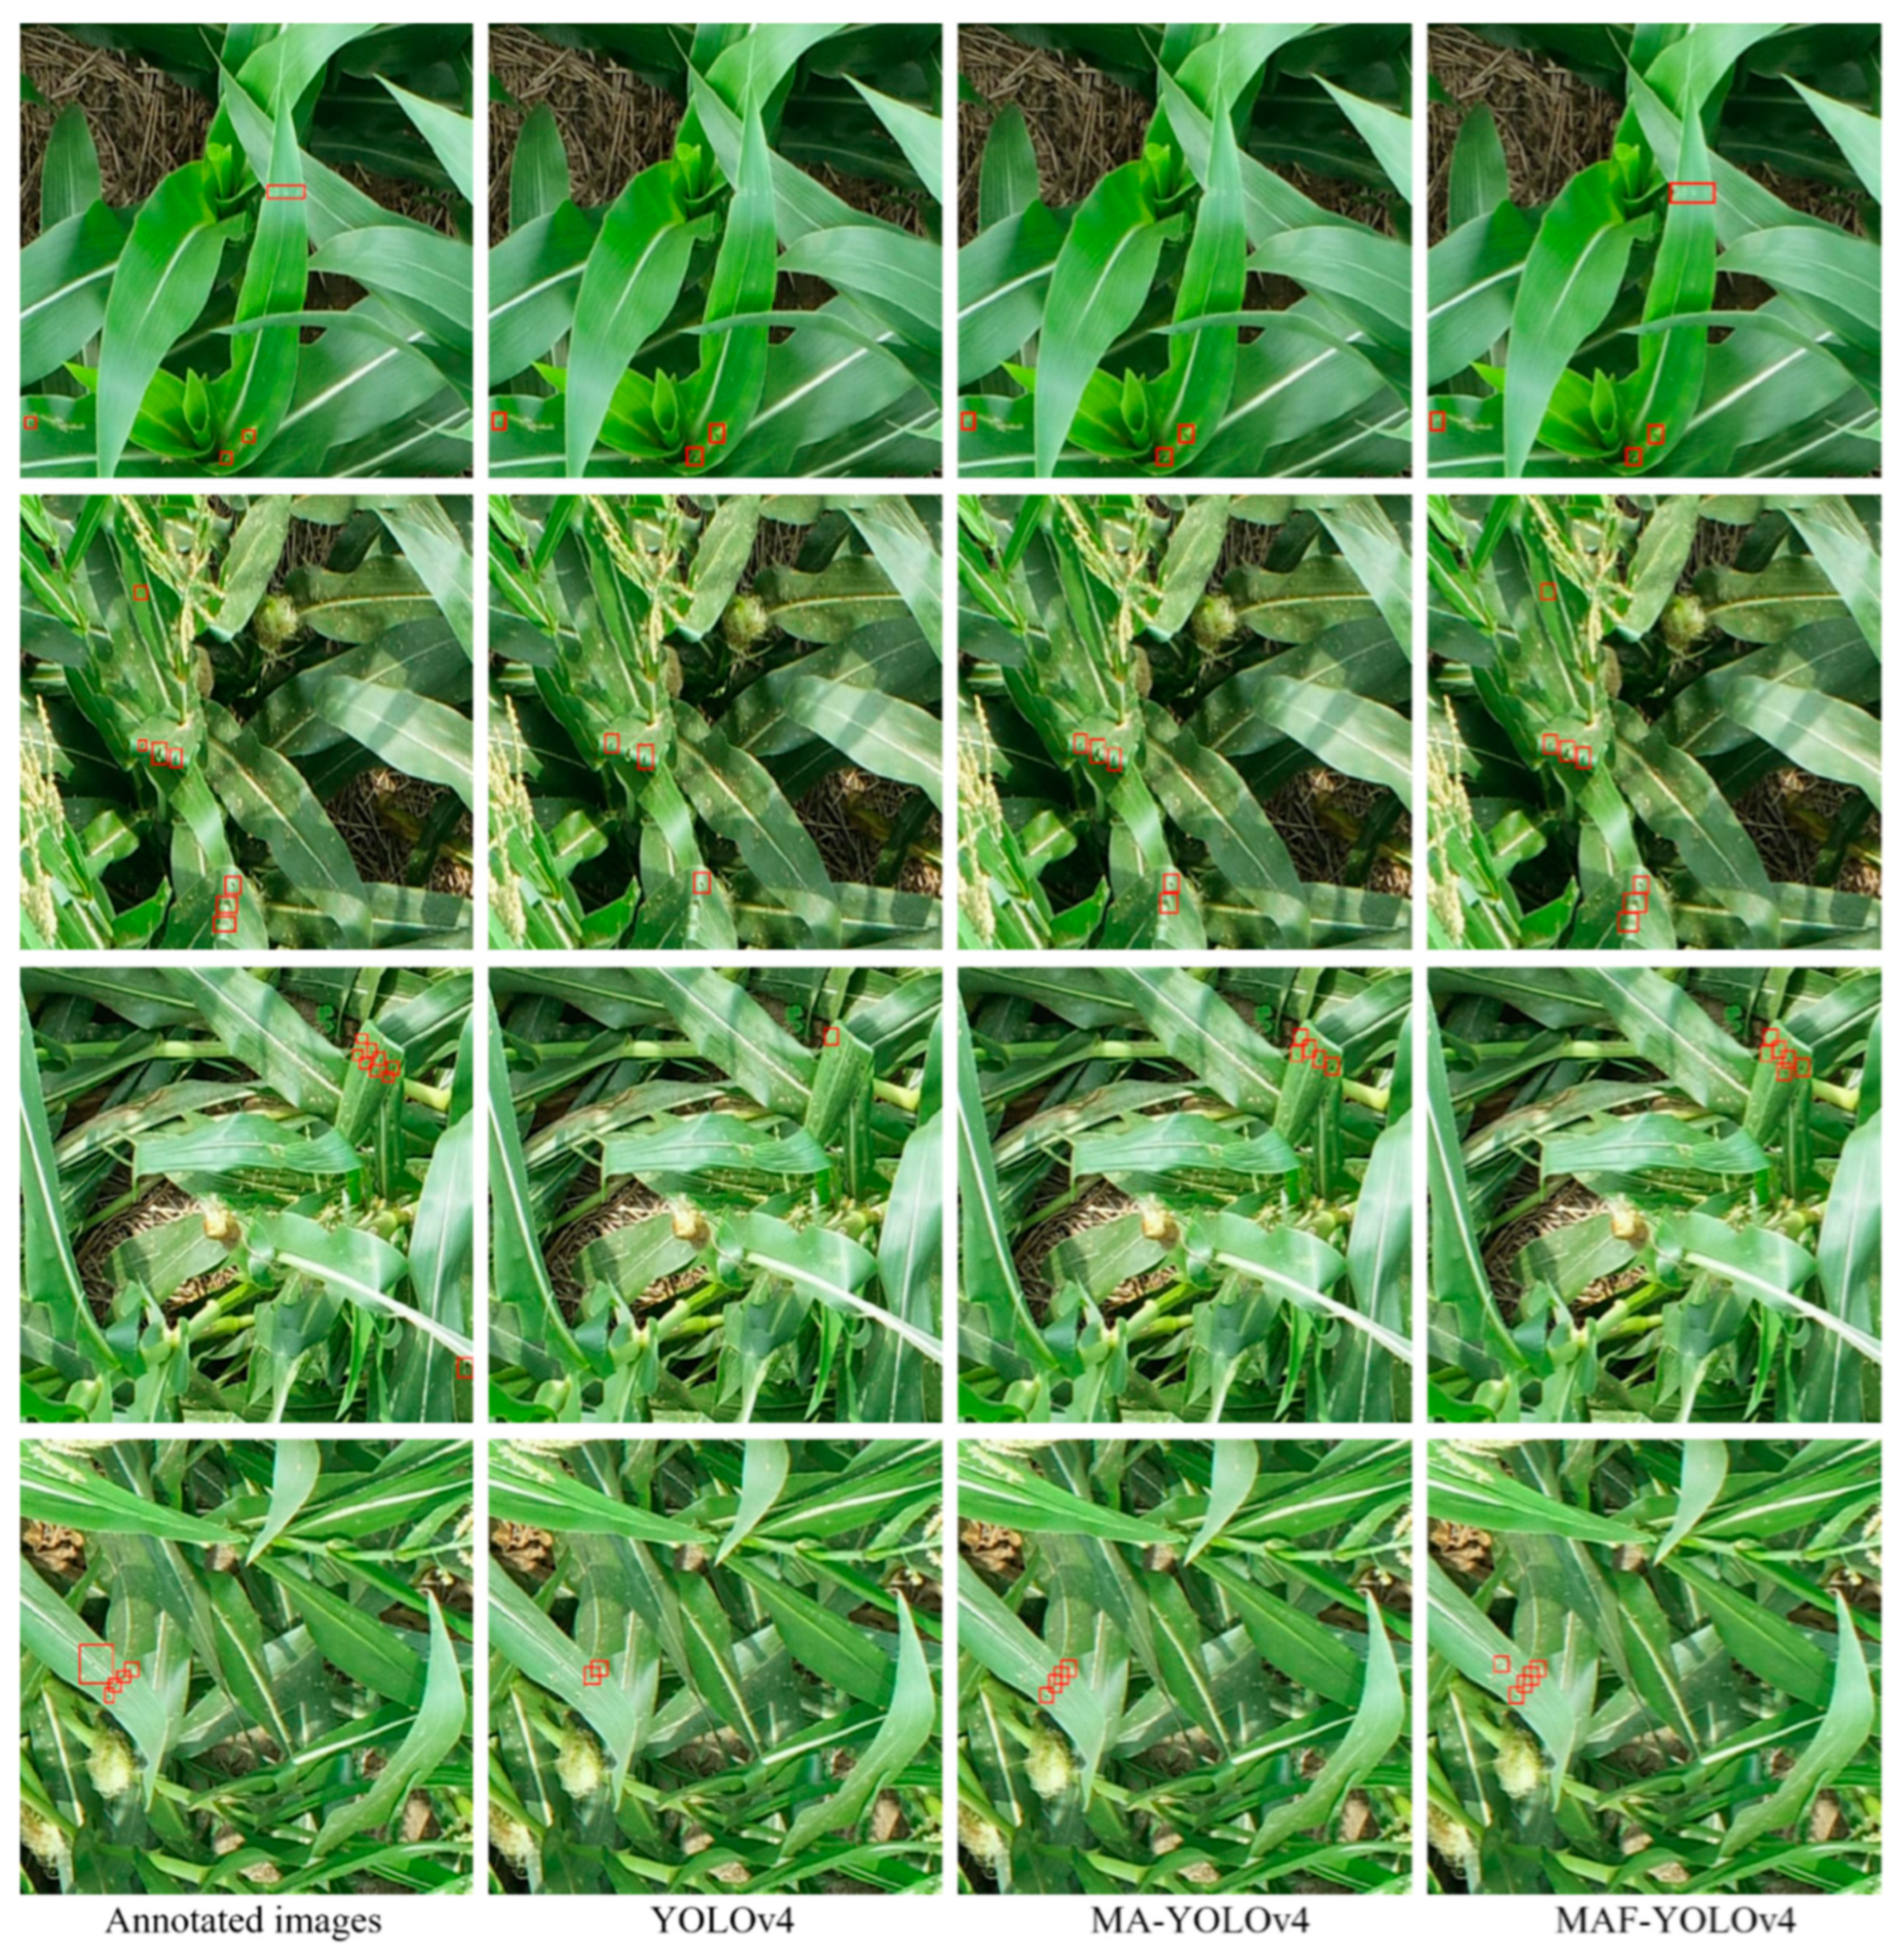
The main defect of YOLOv4 in detection of corn-borer pest regions was the omission of small target pest regions or difficult regions, as mentioned in Section 2.1; the examination results are shown in Figure 12. The most intuitive performance in the evaluation metric was the low recall rate. The fundamental reason for this phenomenon is the limited information for the small target and interference from complex backgrounds; it was difficult for the original network to obtain sufficient and effective features in this case. To solve this problem, we proposed MSMAM and contextual information to improve YOLOv4, and obtained MA–YOLOv4 and MAF–YOLOv4. The performance of different models was verified on DV12&DVT; to assess, comprehensively, the performance of the improved models, the state-of-the-art detection models currently widely applied in agriculture were chosen for comparison experiments. These included the one-stage algorithms, SSD, YOLOv3, and YOLOv4; the two-stage algorithms, Faster-rcnn, Cascade-rcnn [34], and Dynamic-rcnn [35]. The algorithms were run in the same experimental environment, the parameters being consistent with the original models. The quantitative comparison results are reported in Table 2. It can be seen that the improved models significantly improved the performance of pest region detection. Moreover, for the main shortcoming, the lower recall rate, the model with additional contextual information, MAF–YOLOv4 outperformed MA–YOLOv4 by 9.88% with only the attention mechanism, compared with the original model. Compared to the two-stage algorithm, the recall is only lower than Dynamic-rcnn with the ResNet50 backbone. The detection speed (FPS), computational complexity (GFLOPS), and average precision (AP) of each model were analyzed in parallel: our model showed a significant advantage in all aspects compared with the two-stage algorithms. Compared with the one-stage algorithm, MA–YOLOv4 demonstrated an increase of 0.55 GFLOPS over YOLOv4, with a slight decrease in detection speed, but an improvement of 5.53% in AP over YOLOv4, achieving a balance of speed, computational complexity, and performance; thus the proposed model has a better overall performance.

Influence of Different Growth Cycle Data

Data from different corn growth cycles have different backgrounds and pose different challenges. To analyze the influence of these data on model performance, models were first trained with DV12&DVT; these were then used to detect different cycles of the test set (DV12_test, DVT_test). Next, the models were trained with DV12 and DVT, separately; these were then used to detect the same cycle of the test set. Table 3 presents the experimental results: it can be seen that different growth cycle data have a strong influence on the model detection. The main challenge arises from the effect of the natural environment and the various physiological phenomena of corn, leading to low accuracy in detecting DVT; DV12 has a minimal effect on improving the detection accuracy of DVT. For MAF–YOLOv4, it performs better in both the DV12_test with a relatively pure background and the DVT_test with a complex background and more interference, whether trained uniformly or separately.

3.2. Visualization

In this paper, a number of test samples was selected as input to visualize the detection results and feature activation. The former is shown in Figure 12; it can be seen that the improved model can accurately detect more complex pest regions in different corn growth cycles. The latter adopted the feature visualization method, Class Activation Mapping (CAM) [
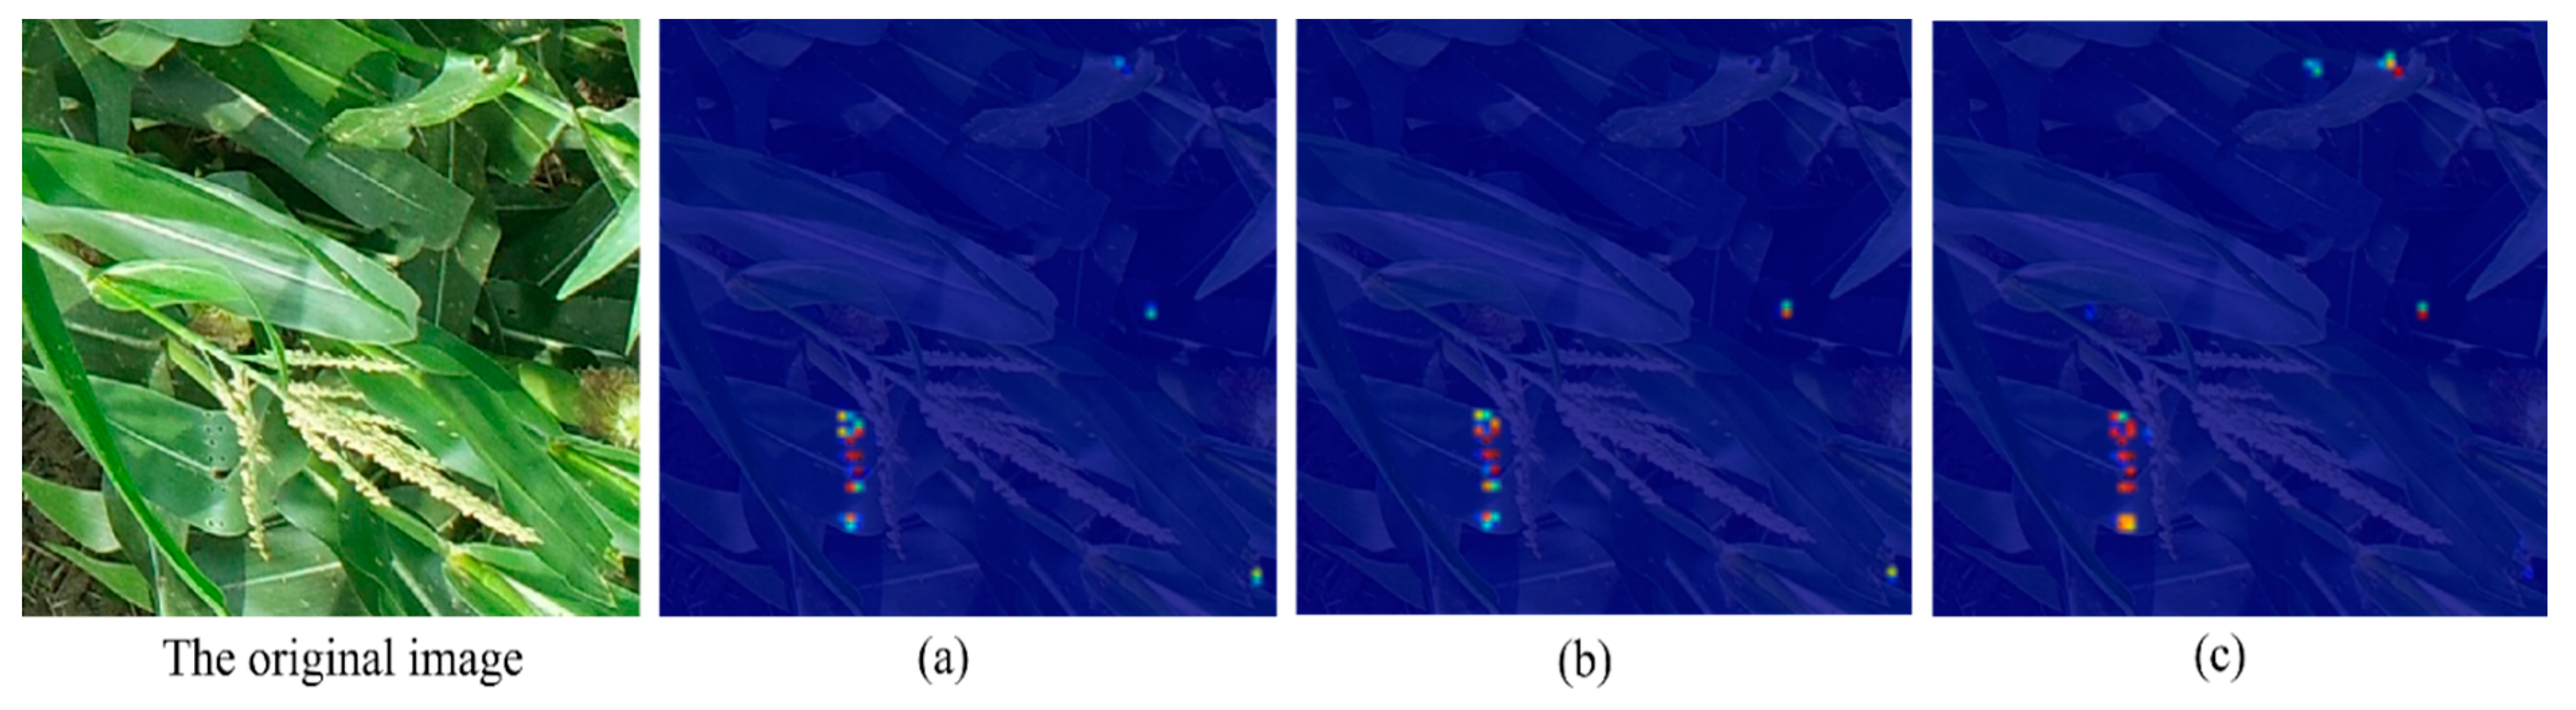
36], to improve model interpretability and qualitative analysis. The importance of different regions of input image is determined through CAM, which is displayed in the form of a heat map. Owing to the working mechanism of the baseline model, CAM was introduced into output3 and the results are shown in Figure 13. From the heat maps, we observe that the improved model covers target regions more comprehensively than does the original model. Furthermore, in the same mask areas, such as the dense pest region in Figure 13, they are more highlighted in the MAF–YOLOv4 CAM, which means that the network is more sensitive to such features and can extract more effective features from them. Thus, with the two visual analysis methods, for the pest region detection task, adopting the attention mechanism to refine the features, and introducing additional contextual information to enhance the pest region features using the nonlinear feature fusion method, can make the model better aggregate effective information and improve detection performance.

3.3. Influence of Attention Mechanism on Detection Performance

To ensure the integrity of comparative experiments, we considered the effectiveness and optimal combination of the various components of MSMAM. First, the effects of PAB and MS-CAB on the overall model performance were verified under the same experimental conditions for different growth cycle data; the results are shown in 
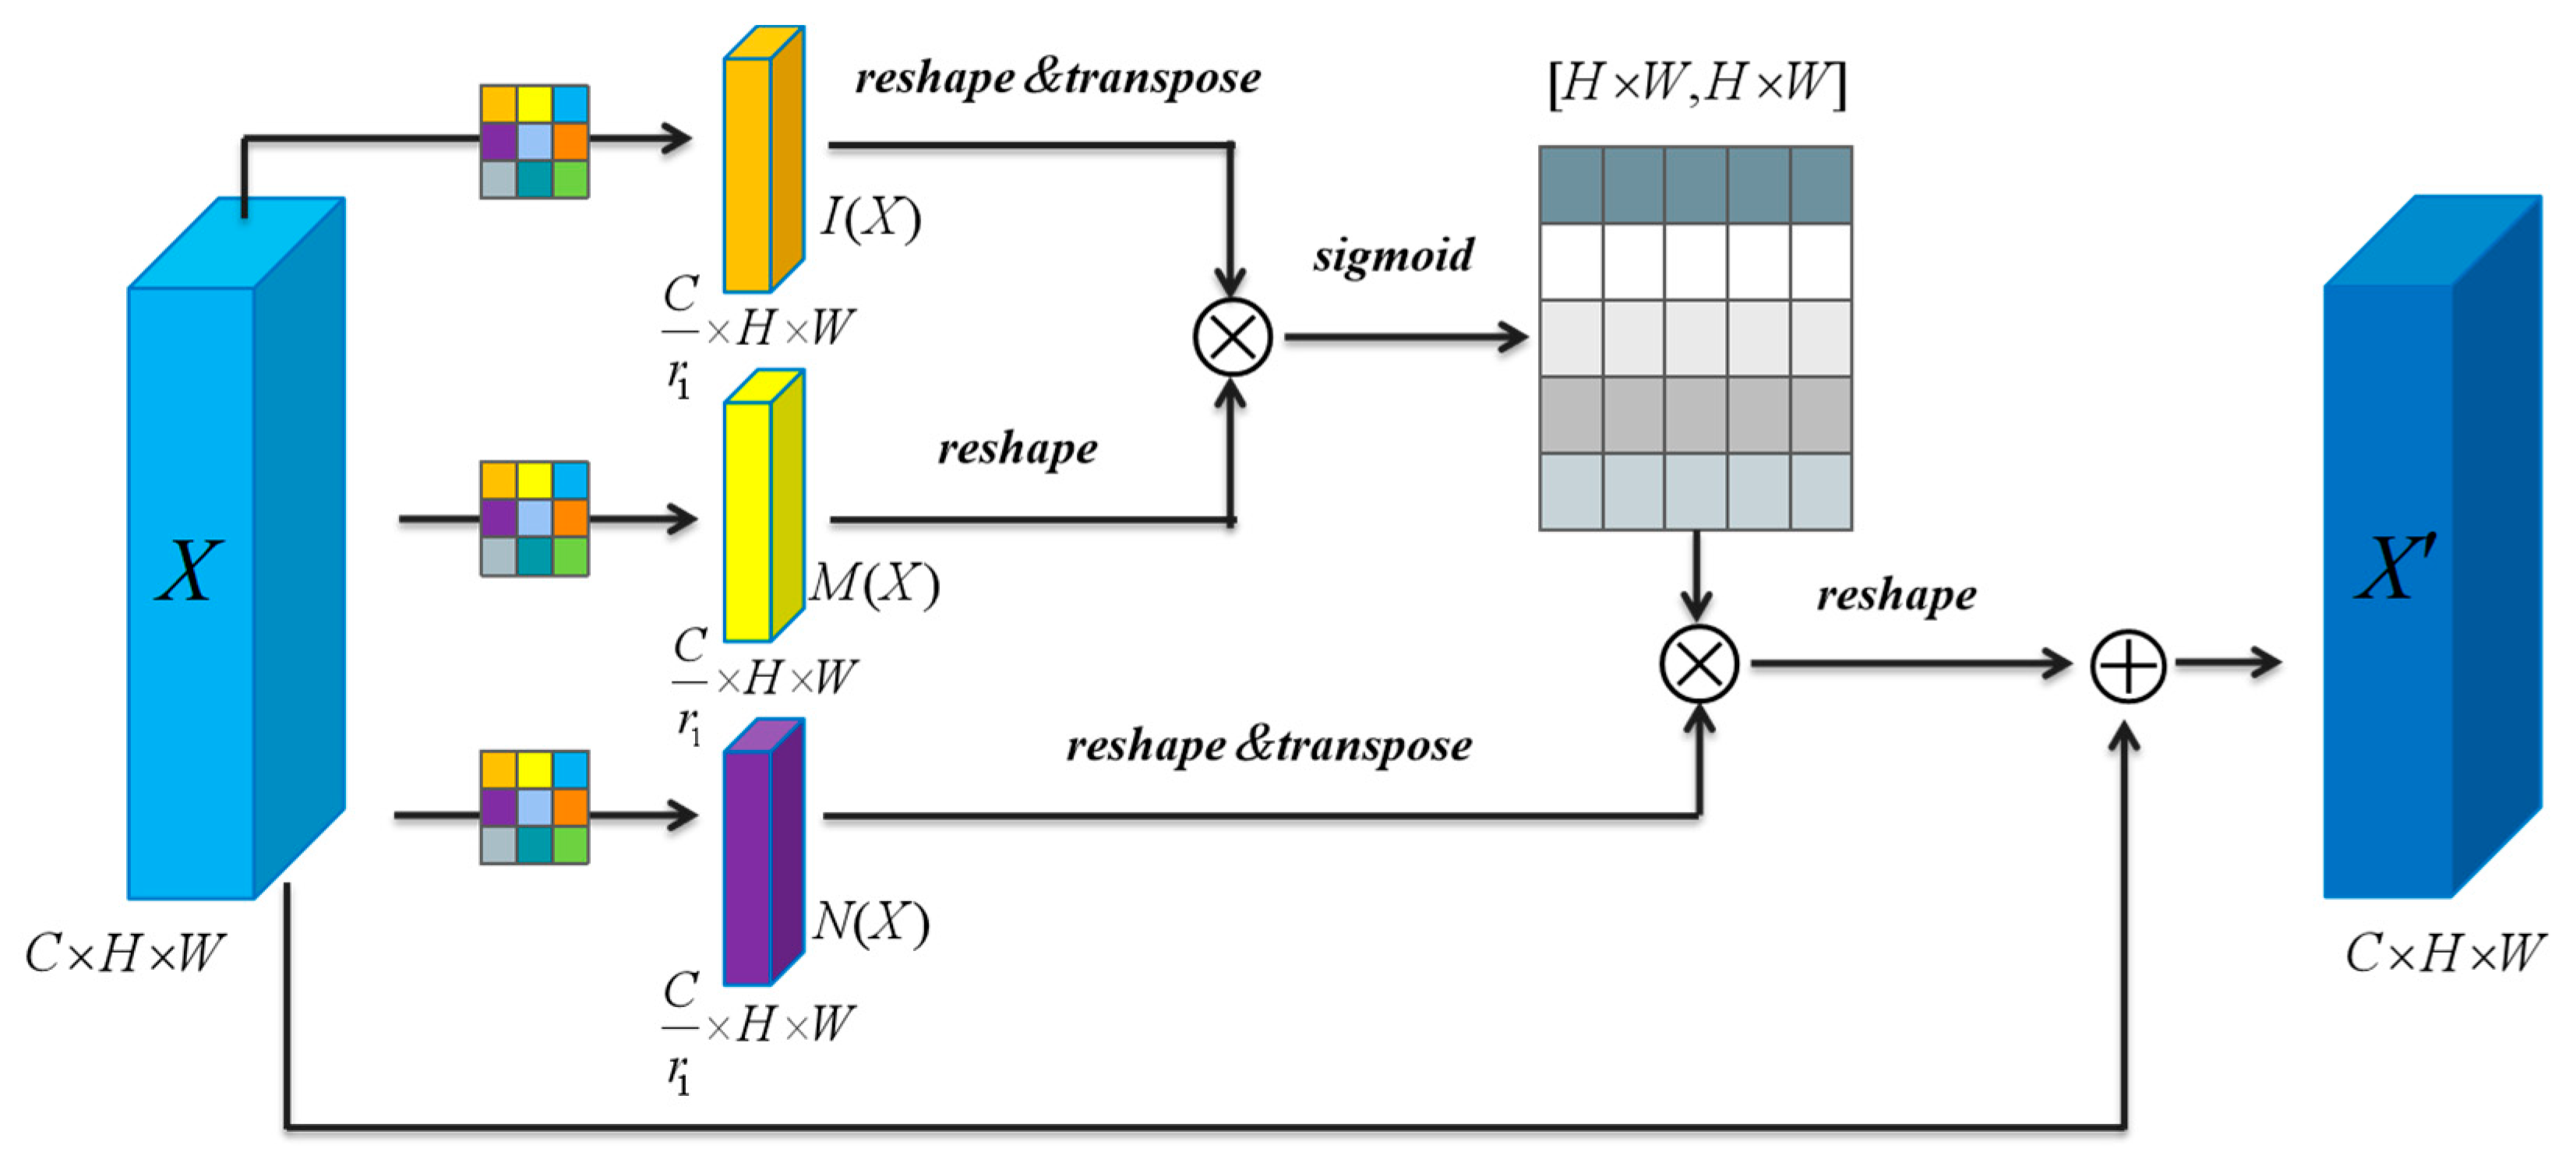
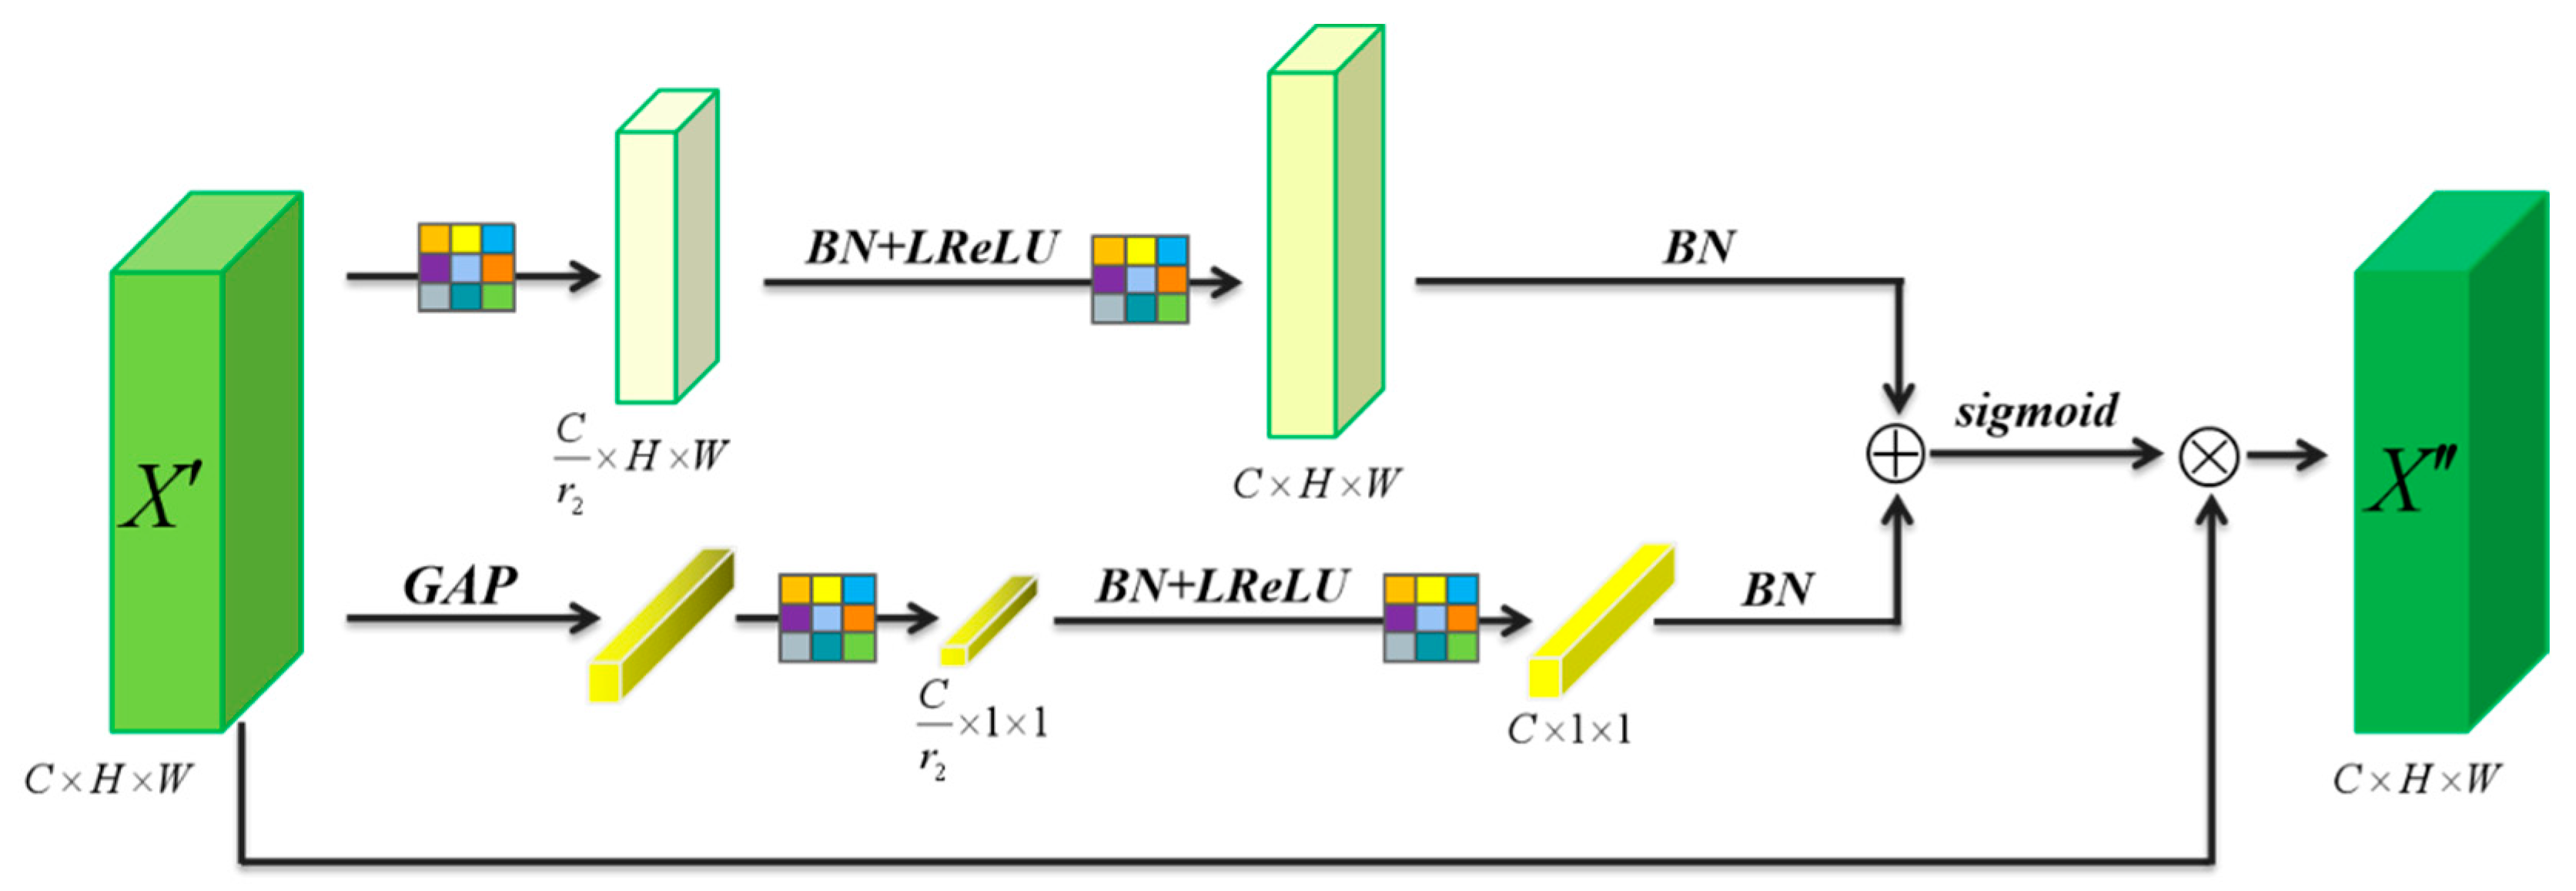
Table 4. Both make beneficial contributions to the model for each growth cycle data. Due to different learned emphases, MS-CAB, which aggregates information at different scales along channel dimension through different branches, outperforms PAB, which captures long-distance information by computing arbitrary-position responses, the former focusing more on ‘what’ and the latter on ‘where’.
Second, to make MSMAM work more effectively, we explored the channel reduction rates 1 r 1 and 1 r 2 mentioned in Section 3.2, and which affect the number of parameters and the feature extraction capacity of MSMAM. We set 1 r 1 and 1 r 2 to 2, 4, 8, and 16, respectively, to determine the optimal channel reduction rate. The experimental results are shown in Table 5 and take into account the computational costs. The 1 r 1 and 1 r 2 were set to 4 and 16, respectively, for better robustness and performance.
Finally, we considered the critical factor affecting performance in MSMAM and how to combine different components to better capture information. There were three main arrangements, sequential PAB+MS-CAB, sequential MS-CAB+PAB, and a parallel combination of the two, PAB&MS-CAB. Different blocks performed different functions, so various arrangements had different effects on overall performance. Table 6 summarizes the impact of different arrangements, with sequential PAB+MS-CAB having the best performance. By analyzing the functions of the two modules and results, we found that although PAB can capture long-distance information, due to the complexity of data and inability of PAB to refine the captured features, there may be more redundant contexts that overwhelm truly effective features. While MS-CAB is limited by locality of convolution, it captures context features through global and local branches to refine features more effectively. Therefore, sequential PAB+MS-CAB can generate finer features.

3.4. Influence of Attention Mechanism in Context Priming Module

MAF–YOLOv4 is an improved version of YOLOv4 that integrates the MSMAM with the context-priming module. MSMAM optimizes the feature map before additional multi-scale contextual features are fused, reducing invalid information and preventing additional information from overwhelming the target features. To analyze the performance influence of MSMAM on MAF–YOLOv4, the model with and without the integrated attention mechanism were compared in different growth cycle data. Table 7 presents the experimental results, and combined with the results in Table 3, it can be seen that MSMAM is essential in the context-priming module. MAF–YOLOv4 without the attention mechanism still outperforms the other models on DV12 because DV12 has less noise interference. On DVT, MAF–YOLOv4 without the attention mechanism performs worse than MA–YOLOv4 due to its inability to reduce noise and unnecessary information. Although the integration of MSMAM increases the computational cost, it is able to effectively improve the detection accuracy of DVT with complex backgrounds.

3.5. Influence of Feature-Fusion Modules on Detection Performance

In the context-priming module, when fusing multi-scale features associated with pest regions, MAFF was utilized as the feature-fusion method, providing a more refined fusion of effective features at different scales. To analyze and verify the effectiveness of MAFF in MAF–YOLOv4, we compared the two commonly used linear fusion methods (add and concatenate) with MAFF on different growth cycle data. Experimental results are shown in Figure 14, and combined with the results in Table 3, it can be seen that the context-priming module using the linear fusion method outperforms MA–YOLOv4, YOLOv4 on DV12. It is weaker than MA–YOLOv4 on DVT because of its insufficient fusion ability, which may bring redundant information to the target feature map. Moreover, MAFF with MSMAM as the kernel, which selectively fuses multi-scale features by calculating fusion weights, performed better on each growth cycle data, because it is difficult for linear fusion methods to make full use of contextual information and mitigate the semantic gaps brought by different scale features during fusion.

3.6. Generalizability and Robustness of the Improved Model in Different Growth Cycle Data

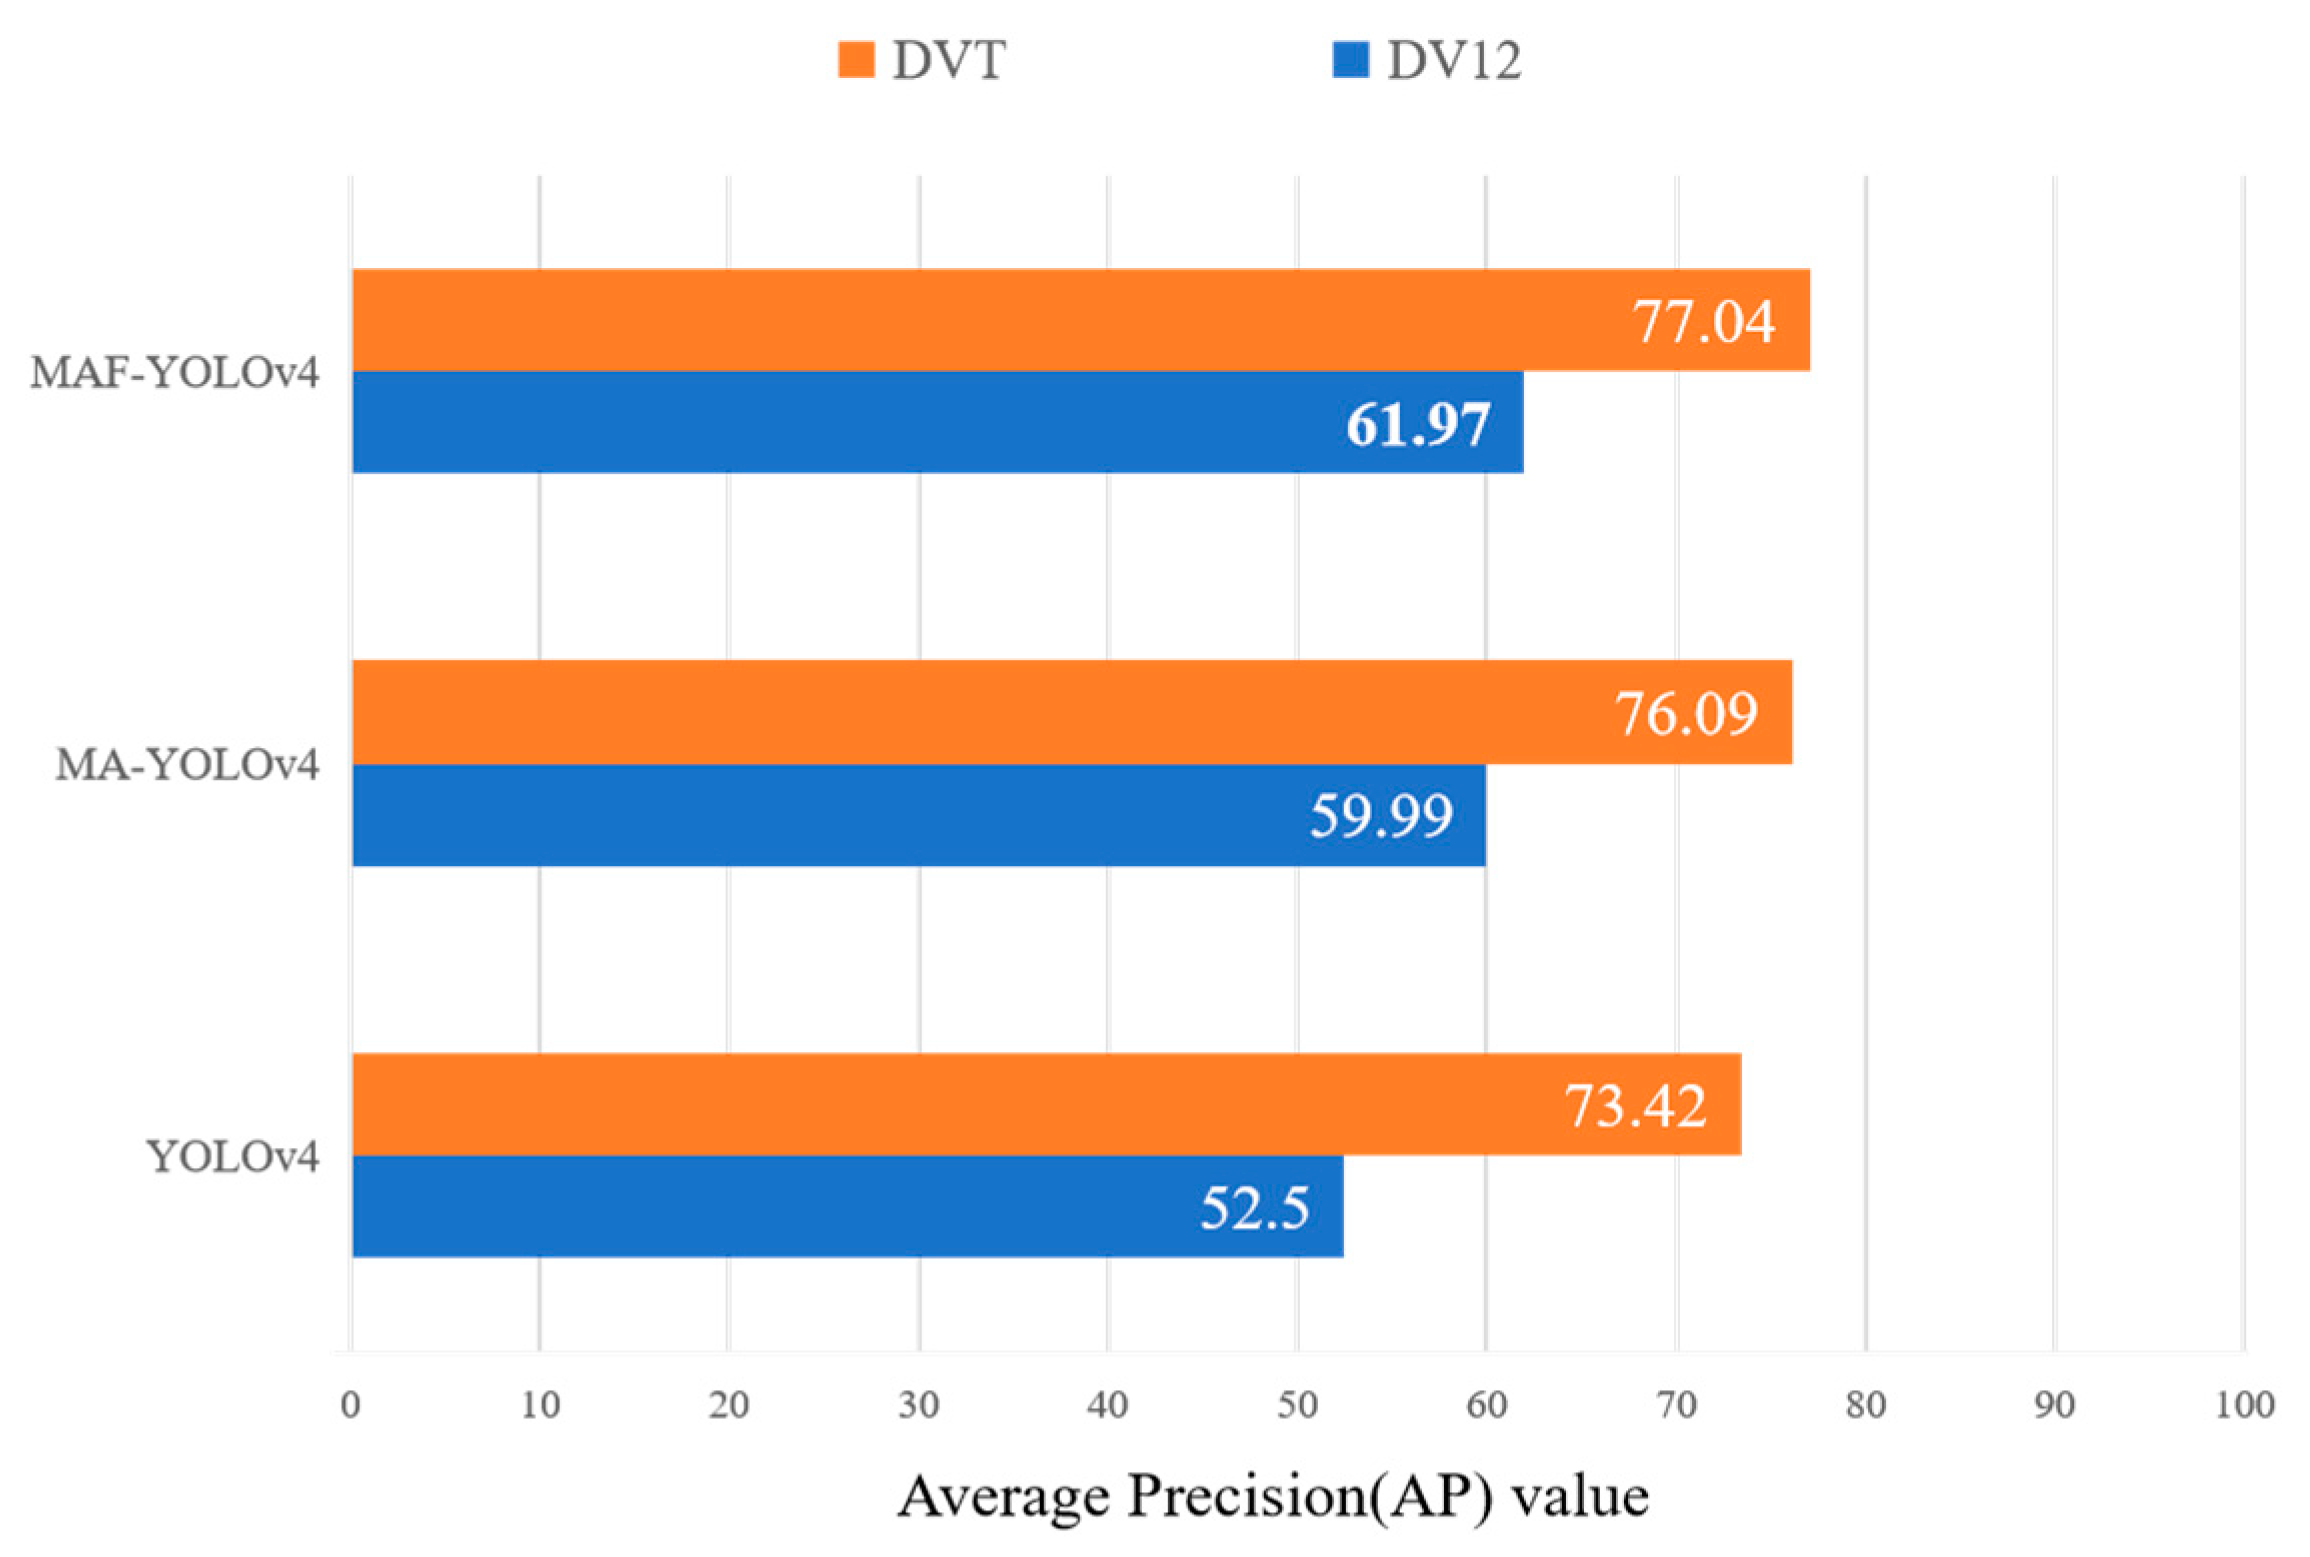
Although the backgrounds and detection difficulties of data on pest regions that are in different corn growth cycles are different, they have similar features. To verify the generalizability and robustness of the improved model for different growth cycle data, we conducted cross-tests using DV12 and DVT, with the model trained by DV12 for detecting DVT_test and the model trained by DVT for detecting DV12_test. Figure 15 presents the results, and combined with the results of MAF–YOLOv4 in Table 3, it can be seen that it has better generalizability and robustness compared with YOLOv4 in different corn growth cycle data because of its stronger feature-extraction capability. After training with DV12, it still performed well on the DVT_test, with a 9.47% improvement in AP compared with YOLOv4 under the same conditions. Combined with the above experiments, it illustrates the practical significance of the improved model, which is able to obtain a unified model for detecting pest regions in corn with different growth cycles and backgrounds.

4. Conclusions

To overcome the difficulty of detecting pest regions with complex backgrounds in different corn growth cycles, in this paper, we propose strengthening target contextual information and using MSMAM to improve YOLOv4. First, a simple-structured context-priming module was proposed, which strengthens the pest region contextual information by introducing additional multi-scale features. Second, MSMAM based on PAB and MS-CAB was designed to extract effective features for the network. Finally, MAFF was proposed based on MSMAM, which learns the fusion weights of pest region features and fuses valid information from additional contextual features of different scales and alleviating their semantic gaps. Experiments showed that the improved model outperforms YOLOv4. We demonstrated effectiveness of the proposed method through multiple sets of comparative experiments and visualization analysis, exploring it in depth to reveal its impact on detection performance. The generalizability and robustness were illustrated by the performance of the improved model on different growth cycle datasets. The proposed algorithm is advanced and effective for detecting pest regions in real environments; it will provide a technical support for the automation of pest monitoring in precision agriculture.

Author Contributions

Methodology, W.Z.; software, W.Z.; validation, H.P. and J.S.; formal analysis, W.Z.; writing—original draft preparation, W.Z.; writing—review and editing, W.Z., H.H., Y.S. and P.Y.; investigation, W.Z. and H.P.; supervision, H.H. and Y.S.; funding acquisition, H.H. All authors have read and agreed to the published version of the manuscript.

Funding

This research was funded by the National Key Research and Development Program of China (grant number 2021YFD200060102), the Strategic Priority Research Program of the Chinese Academy of Sciences (Grant XDA28120400).

Institutional Review Board Statement

Not applicable.

Informed Consent Statement

Not applicable.

Data Availability Statement

Not applicable.

Conflicts of Interest

The authors declare no conflict of interest.

References

  1. Erenstein, O.; Chamberlin, J.; Sonder, K. Estimating the global number and distribution of maize and wheat farms. Glob. Food Secur. 2021, 30, 100558. [Google Scholar] [CrossRef]
  2. Li, X.; Pan, J.; Xie, F.; Zeng, J.; Li, Q.; Huang, X.; Liu, D.; Wang, X. Fast and accurate green pepper detection in complex backgrounds via an improved Yolov4-tiny model. Comput. Electron. Agric. 2021, 191, 106503. [Google Scholar] [CrossRef]
  3. Qin, Y.; Wu, Y.; Wang, Q.; Yu, S. Method for pests detecting in stored grain based on spectral residual saliency edge detection. Grain Oil Sci. Technol. 2019, 2, 33–38. [Google Scholar] [CrossRef]
  4. Camargo, A.; Smith, J. Image pattern classification for the identification of disease causing agents in plants. Comput. Electron. Agric. 2009, 66, 121–125. [Google Scholar] [CrossRef]
  5. Ding, W.; Taylor, G. Automatic moth detection from trap images for pest management. Comput. Electron. Agric. 2016, 123, 17–28. [Google Scholar] [CrossRef] [Green Version]
  6. Huang, R.; Yao, T.; Zhan, C.; Zhang, G.; Zheng, Y. A Motor-Driven and Computer Vision-Based Intelligent E-Trap for Monitoring Citrus Flies. Agriculture 2021, 11, 460. [Google Scholar] [CrossRef]
  7. Wang, R.; Jiao, L.; Xie, C.; Chen, P.; Du, J.; Li, R. S-RPN: Sampling-balanced region proposal network for small crop pest detection. Comput. Electron. Agric. 2021, 187, 106290. [Google Scholar] [CrossRef]
  8. Li, R.; Jia, X.; Hu, M.; Zhou, M.; Li, D.; Liu, W.; Wang, R.; Zhang, J.; Xie, C.; Liu, L.; et al. An effective data augmentation strategy for CNN-based pest localization and recognition in the field. IEEE Access 2019, 7, 160274–160283. [Google Scholar] [CrossRef]
  9. Dai, Q.; Cheng, X.; Qiao, Y.; Zhang, Y. Agricultural pest super-resolution and identification with attention enhanced residual and dense fusion generative and adversarial network. IEEE Access 2020, 8, 81943–81959. [Google Scholar] [CrossRef]
  10. Lim, J.-S.; Astrid, M.; Yoon, H.-J.; Lee, S.-I. Small object detection using context and attention. In Proceedings of the 2021 International Conference on Artificial Intelligence in Information and Communication (ICAIIC), Jeju Island, Korea, 13–16 April 2021. [Google Scholar] [CrossRef]
  11. Liu, W.; Anguelov, D.; Erhan, D.; Szegedy, C.; Reed, S.; Fu, C.Y.; Berg, A.C. SSD: Single Shot Multibox Detector. European Conference on Computer Vision; Springer: Cham, Switzerland, 2016. [Google Scholar] [CrossRef] [Green Version]
  12. Wang, F.; Wang, R.; Xie, C.; Yang, P.; Liu, L. Fusing multi-scale context-aware information representation for automatic in-field pest detection and recognition. Comput. Electron. Agric. 2020, 169, 105222. [Google Scholar] [CrossRef]
  13. Xu, H.; Jiang, C.; Liang, X.; Lin, L.; Li, Z. Reasoning-RCNN: Unifying adaptive global reasoning into large-scale object detection. In Proceedings of the IEEE/CVF Conference on Computer Vision and Pattern Recognition, Long Beach, CA, USA, 16–20 June 2019. [Google Scholar] [CrossRef]
  14. Ilyas, T.; Khan, A.; Umraiz, M.; Jeong, Y.; Kim, H. Multi-Scale Context Aggregation for Strawberry Fruit Recognition and Disease Phenotyping. IEEE Access 2021, 9, 124491–124504. [Google Scholar] [CrossRef]
  15. Liu, S.; Di, H.; Yunhong, W. Learning spatial fusion for single-shot object detection. arXiv 2019, arXiv:1911.09516. [Google Scholar]
  16. Dai, Y.; Gieseke, F.; Oehmcke, S.; Wu, Y.; Barnard, K. Attentional feature fusion. In Proceedings of the IEEE/CVF Winter Conference on Applications of Computer Vision, Virtual, 5–9 January 2021. [Google Scholar] [CrossRef]
  17. Redmon, J.; Divvala, S.; Girshick, R.; Farhadi, A. You only look once: Unified, real-time object detection. In Proceedings of the IEEE Conference on Computer Vision and Pattern Recognition, Las Vegas, NV, USA, 26 June–1 July 2016; pp. 779–788. [Google Scholar] [CrossRef] [Green Version]
  18. Redmon, J.; Farhadi, A. YOLO9000: Better, faster, stronger. In Proceedings of the IEEE Conference on Computer Vision and Pattern Recognition, Honolulu, HI, USA, 21–26 July 2017. [Google Scholar]
  19. Redmon, J.; Farhadi, A. Yolov3: An incremental improvement. arXiv 2018, arXiv:1804.02767. [Google Scholar]
  20. Bochkovskiy, A.; Wang, C.-Y.; Liao, H.-J.M. Yolov4: Optimal speed and accuracy of object detection. arXiv 2020, arXiv:2004.10934. [Google Scholar]
  21. Lippi, M.; Bonucci, N.; Carpio, R.F.; Contarini, M.; Speranza, S.; Gasparri, A. A yolo-based pest detection system for precision agriculture. In Proceedings of the 2021 29th Mediterranean Conference on Control and Automation (MED), Puglia, Italy, 22–25 June 2021. [Google Scholar] [CrossRef]
  22. Liu, J.; Wang, X. Tomato diseases and pests detection based on improved Yolo V3 convolutional neural network. Front. Plant Sci. 2020, 11, 898. [Google Scholar] [CrossRef] [PubMed]
  23. Fang, L.; Wu, Y.; Li, Y.; Guo, H.; Zhang, H.; Wang, X.; Xi, R.; Hou, J. Using Channel and Network Layer Pruning Based on Deep Learning for Real-Time Detection of Ginger Images. Agriculture 2021, 11, 1190. [Google Scholar] [CrossRef]
  24. Tian, Y.; Yang, G.; Wang, Z.; Wang, H.; Li, E.; Liang, Z. Apple detection during different growth stages in orchards using the improved YOLO-V3 model. Comput. Electron. Agric. 2019, 157, 417–426. [Google Scholar] [CrossRef]
  25. Ren, S.; He, K.; Girshick, R.; Sun, J. Faster R-CNN: Towards Real-Time Object Detection with Region Proposal Networks. Trans. Pattern Anal. Mach. Intell. 2017, 39, 1137–1149. [Google Scholar] [CrossRef] [PubMed] [Green Version]
  26. He, K.; Zhang, X.; Ren, S.; Sun, J. Spatial pyramid pooling in deep convolutional networks for visual recognition. IEEE Trans. Pattern Anal. Mach. Intell. 2015, 37, 1904–1916. [Google Scholar] [CrossRef] [PubMed] [Green Version]
  27. Liu, S.; Qi, L.; Qin, H.; Shi, J.; Jia, J. Path aggregation network for instance segmentation. In Proceedings of the IEEE/CVF Conference on Computer Vision and Pattern Recognition (CVPR), Salt Lake City, UT, USA, 18–23 June 2018. [Google Scholar] [CrossRef] [Green Version]
  28. Hu, J.; Shen, L.; Sun, G. Squeeze-and-excitation networks. In Proceedings of the IEEE Conference on Computer Vision and Pattern Recognition, Salt Lake City, UT, USA, 18–22 June 2018. [Google Scholar] [CrossRef] [Green Version]
  29. Wang, X.; Girshick, R.; Gupta, A.; He, K. Non-local neural networks. In Proceedings of the IEEE Conference on Computer Vision and Pattern Recognition, Salt Lake City, UT, USA, 18–22 June 2018. [Google Scholar]
  30. Fu, J.; Liu, J.; Tian, H.; Li, Y.; Bao, Y.; Fang, Z.; Lu, H. Dual attention network for scene segmentation. In Proceedings of the IEEE/CVF Conference on Computer Vision and Pattern Recognition, Long Beach, CA, USA, 16–20 June 2019. [Google Scholar] [CrossRef] [Green Version]
  31. Wang, W.; Zhao, S.; Shen, J.; Hoi, S.C.H.; Borji, A. Salient object detection with pyramid attention and salient edges. In Proceedings of the IEEE/CVF Conference on Computer Vision and Pattern Recognition, Long Beach, CA, USA, 16–20 June 2019. [Google Scholar] [CrossRef]
  32. Tan, M.; Pang, R.; Le, Q.V. EfficientDet: Scalable and efficient object detection. In Proceedings of the IEEE/CVF Conference on Computer Vision and Pattern Recognition, Seattle, WA, USA, 13–19 June 2020. [Google Scholar] [CrossRef]
  33. Ghiasi, G.; Lin, T.-Y.; Le, Q.V. Nas-fpn: Learning scalable feature pyramid architecture for object detection. In Proceedings of the IEEE/CVF Conference on Computer Vision and Pattern Recognition, Long Beach, CA, USA, 16–20 June 2019. [Google Scholar] [CrossRef] [Green Version]
  34. Cai, Z.; Vasconcelos, N. Cascade r-cnn: Delving into high quality object detection. In Proceedings of the IEEE Conference on Computer Vision and Pattern Recognition, Salt Lake City, UT, USA, 18–22 June 2018. [Google Scholar] [CrossRef] [Green Version]
  35. Zhang, H.; Chang, H.; Ma, B.; Wang, N.; Chen, X. Dynamic R-CNN: Towards high quality object detection via dynamic training. In European Conference on Computer Vision; Springer: Cham, Switzerland, 2020. [Google Scholar] [CrossRef]
  36. Zhou, B.; Khosla, A.; Lapedriza, A.; Oliva, A.; Torralba, A. Learning deep features for discriminative localization. In Proceedings of the IEEE Conference on Computer Vision and Pattern Recognition, Las Vegas, NV, USA, 26 June–1 July 2016. [Google Scholar] [CrossRef] [Green Version]
Figure 1. Schematic diagram of the overall technical route of the automatic assessment algorithm for the damage degree of the pest regions.
Agriculture 12 01104 g001
Figure 2. Example pictures showing detection difficulties; (a,b) The characteristics of pest regions of corn in V12 stage; (cf) The characteristics of pest regions of corn in VT stage.
Agriculture 12 01104 g002
Figure 3. Image preprocessing: (a) original image of (bg), (b) 90° clockwise rotation, (c) 180° clockwise rotation, (d) 270° clockwise rotation, (e) flipping, (f) brightness transform, (g) Gaussian blur processing, (h) padding, (i,j) resampling sample examples.
Agriculture 12 01104 g003
Figure 4. Structure diagram of YOLOv4 model; the red cube represents C4(CSP_1), which is the intermediate feature map output by the first small residual block in the C4 layer.
Agriculture 12 01104 g004
Figure 5. Improvement of the feature map.
Agriculture 12 01104 g005
Figure 6. Schematic diagram of MSMAM. GAP represents the global average pooling, and BN represents the Batch Normalization.
Agriculture 12 01104 g006
Figure 7. PAB structure diagram. 1 r 1 is the channel reduction rate, which can be assigned as 1 2 , 1 8 , 1 16 .
Agriculture 12 01104 g007
Figure 8. PAB structure diagram. 1 r 1 is the channel reduction rate, which can be assigned as 1 2 , 1 4 , 1 8 , 1 16 .
Agriculture 12 01104 g008
Figure 9. Schematic diagram of the context-priming module.
Agriculture 12 01104 g009
Figure 10. MAFF structure.
Agriculture 12 01104 g010
Figure 11. PR curve for detection models.
Agriculture 12 01104 g011
Figure 12. Annotated images and detection results; The first row belongs to DV12, the rest belong to DVT.
Agriculture 12 01104 g012
Figure 13. CAM visualization results; (ac) are heat maps for YOLOv4, MA–YOLOv4, MAF–YOLOv4, respectively.
Agriculture 12 01104 g013
Figure 14. The detection results of different feature-fusion methods in different growth cycle data (AP, unit: %).
Agriculture 12 01104 g014
Figure 15. Ddetection results of DV12 and DVT cross-tests (AP, unit: %).
Agriculture 12 01104 g015
Table 1. Experimental environment.
ConfigurationParameter
CPUIntel Xeon Gold 5220
GPUNVIDIA Tesla V100
Operating systemUbuntu 18.04
Accelerated environmentCUDA10.2 CUDNN7.6.5
Table 2. Experimental results; score_threshold = 0.5; IoU = 0.5; GFLOPS indicates Giga Floating-point Operations Per Second; FPS indicates Frames Per Second.
ModelsBackbonePrecision (%)Recall (%)AP (%)GFLOPSFPS
Faster-rcnnResNet5053.8360.757.283.4916
Cascade-rcnnResNet5059.6364.260.8111.39
Dynamic-rcnnResNet5040.6070.464.083.4914
SSDVGG1693.336.9159.50123.3851
YOLOv3Darknet5381.5656.7969.9369.9844
YOLOv4CSPDarknet5381.5460.0072.9663.8241
MA–YOLOv4CSPDarknet5383.8566.6778.4964.3739
MAF–YOLOv4CSPDarknet5381.7969.8880.1674.934
Table 3. APs of different models in different growth cycle data (unit: %); DV12&DVT, DV12, and DVT are the selected training sets.
Different Growth Cycles DataDV12DVTDV12&DVT
DV12_testDVT_testDV12_testDVT_test
YOLOv480.2265.7882.1564.40
MA–YOLOv484.170.2686.7970.55
MAF–YOLOv486.4371.8688.1772.31
Table 4. Influence of different attention modules on the overall model performance in different growth cycle data (AP, unit: %).
Attention ModulesDV12DVTDV12&DVT
YOLOv480.2265.7872.96
With PAB82.6567.1476.47
With MS-CAB83.1568.4377.09
Table 5. Influence of attention channel size on detection results (AP; unit: %). r = 2, 4, 8, 16, representing the values of r 1 and r 2 .
Channel Proportionsr = 2r = 4r = 8r = 16
With PAB75.8876.4775.7375.27
With MS-CAB76.4475.0675.1377.09
Table 6. Influence of attention combination on detection results.
Different CombinationsPAB+MS-CABMS-CAB+PABPAB&MS-CAB
AP (%)78.4976.4177.57
Table 7. Influence of attention mechanism in context-priming module on detection results.
ModelsNo AttentionWith Attention
DV12DVTDV12&DVTDV12DVTDV12&DVT
AP (%)84.9568.2777.6086.4371.8680.16
Publisher’s Note: MDPI stays neutral with regard to jurisdictional claims in published maps and institutional affiliations.

