Article

Spatial and Temporal Changes in Crop Species Production Diversity in Mexico (1980–2020)

by
Matthew C. LaFevor
Department of Geography, The University of Alabama, Tuscaloosa, AL 35487, USA
Agriculture 2022, 12(7), 985; https://doi.org/10.3390/agriculture12070985
Submission received: 13 June 2022 / Revised: 5 July 2022 / Accepted: 6 July 2022 / Published: 8 July 2022
(This article belongs to the Section Crop Production)

Abstract

:
Crop species diversity is a key component of agroecosystem resilience, food system stability, ecosystem services production, and sustainable development. Despite its importance, quantitative understanding of crop species diversity is often lacking. This study assesses changes in crop species production diversity in Mexico from 1980 to 2020 at state, regional, and national levels. Measures of crop species richness and effective diversity (alpha, beta, gamma) were derived from government production data on 304 species, each stratified into rainfed and irrigated components. Time series of these components reveal three main findings: (1) diversity generally increased during the study period, especially among fruits, vegetables, spices and herbs, and ornamental crops; (2) the diversity of irrigated crops was about two times higher than the diversity of rainfed crops, despite comprising a small fraction of the total cultivated area; and (3) the diversity of irrigated crops increased dramatically after implementation of the North American Free Trade Agreement (NAFTA) in 1994—though most increases occurred in dry northern regions where production depended on unsustainable irrigation. In sum, findings show that while crop diversity can contribute to numerous forms of sustainability, not all diversification processes derive from agroecologically-based, sustainable forms of intensification. In Mexico, crop species diversification was associated with a post-1994 boom in produce exports to the United States and the unsustainable use of scarce water resources at home. Such context-specific understanding is crucial for determining whether crop diversification, in all its forms, ultimately leads to sustainable outcomes.

1. Introduction

Crop species diversity is an important component of agroecosystem resilience, food system stability, and the production of ecosystem services [1,2,3,4]. Conserving crop diversity is a goal of agri-environmental policies around the world, with diversity targets specified in the United Nations Sustainable Development goals and the directives of other international organizations [5,6,7]. Despite the importance of conserving global crop diversity, considerable uncertainty exists about the timing and extent of diversification patterns and processes at national and subnational levels [8]. This uncertainty has impeded conservation efforts, leaving policymakers without the means to assess what remains of crop diversity today and how to manage it in the future [9]. A fuller understanding of crop diversity patterns and the drivers and impacts of diversification processes is needed.
Agricultural intensification is generally recognized as a driver of the erosion of crop genetic (landrace) diversity, a significant threat to global food security and biodiversity [10]. At the genetic level, the continuing erosion of crop diversity has received significant research attention, though fewer studies explore diversification at higher taxonomic levels where patterns are less certain. At the species level, for example, firm evidence of the global erosion of crop diversity has been elusive [9,11,12]. One study finds crop species diversity increased through much of the 20th century, peaking in the 1980s and leveling off in the early 1990s [13]—though the onset and duration of this pattern varied across regions, suggesting the influence of distinct policy, socioeconomic, and environmental factors [12,14,15,16]. To understand these factors, context-based assessment of trends in crop species diversity at regional and national levels is critical. Ultimately, identifying these trends is key to understanding the drivers of crop diversification processes at the species level and, ultimately, how this diversification influences socio-environmental outcomes [17,18,19].
Mexico is a ‘mega-diverse’ country and a Vavilov center of crop origin that has made important contributions to global food production, though the country also experienced significant agricultural changes over the last century [20,21,22]. Mexico was an early adopter of Green Revolution technologies and intensification strategies beginning in the mid-twentieth century [23,24]. Today, agriculture in Mexico is characterized by a heterogenous array of crop types, levels of intensification, and production systems [25]. Within this complexity, research on crop diversity has tended to focus on the identification and conservation of maize genetic (landrace) diversity. The focus is well justified. Mexico is the world’s primary reservoir of in situ maize genetic diversity, and its conservation is critical on many levels—from ensuring global food security to supporting the lifeways of many indigenous communities [26,27,28]. Beyond the focus on maize diversity, however, the current trends and patterns of total crop species diversity in Mexico are poorly understood. This baseline understanding is critical for assessing how the agricultural changes of the 20th century have impacted agrodiversity and ecosystems.
Agriculture in Mexico experienced dramatic structural changes after the implementation of the North American Free Trade Agreement (NAFTA) in 1994. Among these, the lifting of trade barriers sparked a boom in crop production in northern regions. However, recent research has shown that this production was dependent on the intensification of irrigation systems and the export of ‘virtual water’ in the form of crop exports to the United States [29]. Agricultural water use in northern regions became increasingly unsustainable during the late 20th century, which led to the growing recognition of the need for reforms in agricultural water use [30,31,32,33]. While the impacts of NAFTA-led changes in agriculture and irrigation continue to be explored, little is known about how these changes have impacted total crop species diversity.
To address these knowledge gaps, this paper seeks to answer three questions:
  • Q1: Has crop species production diversity in Mexico increased or decreased over the last several decades (1980–2020)?
  • Q2: Have these changes differed among rainfed and irrigated crops?
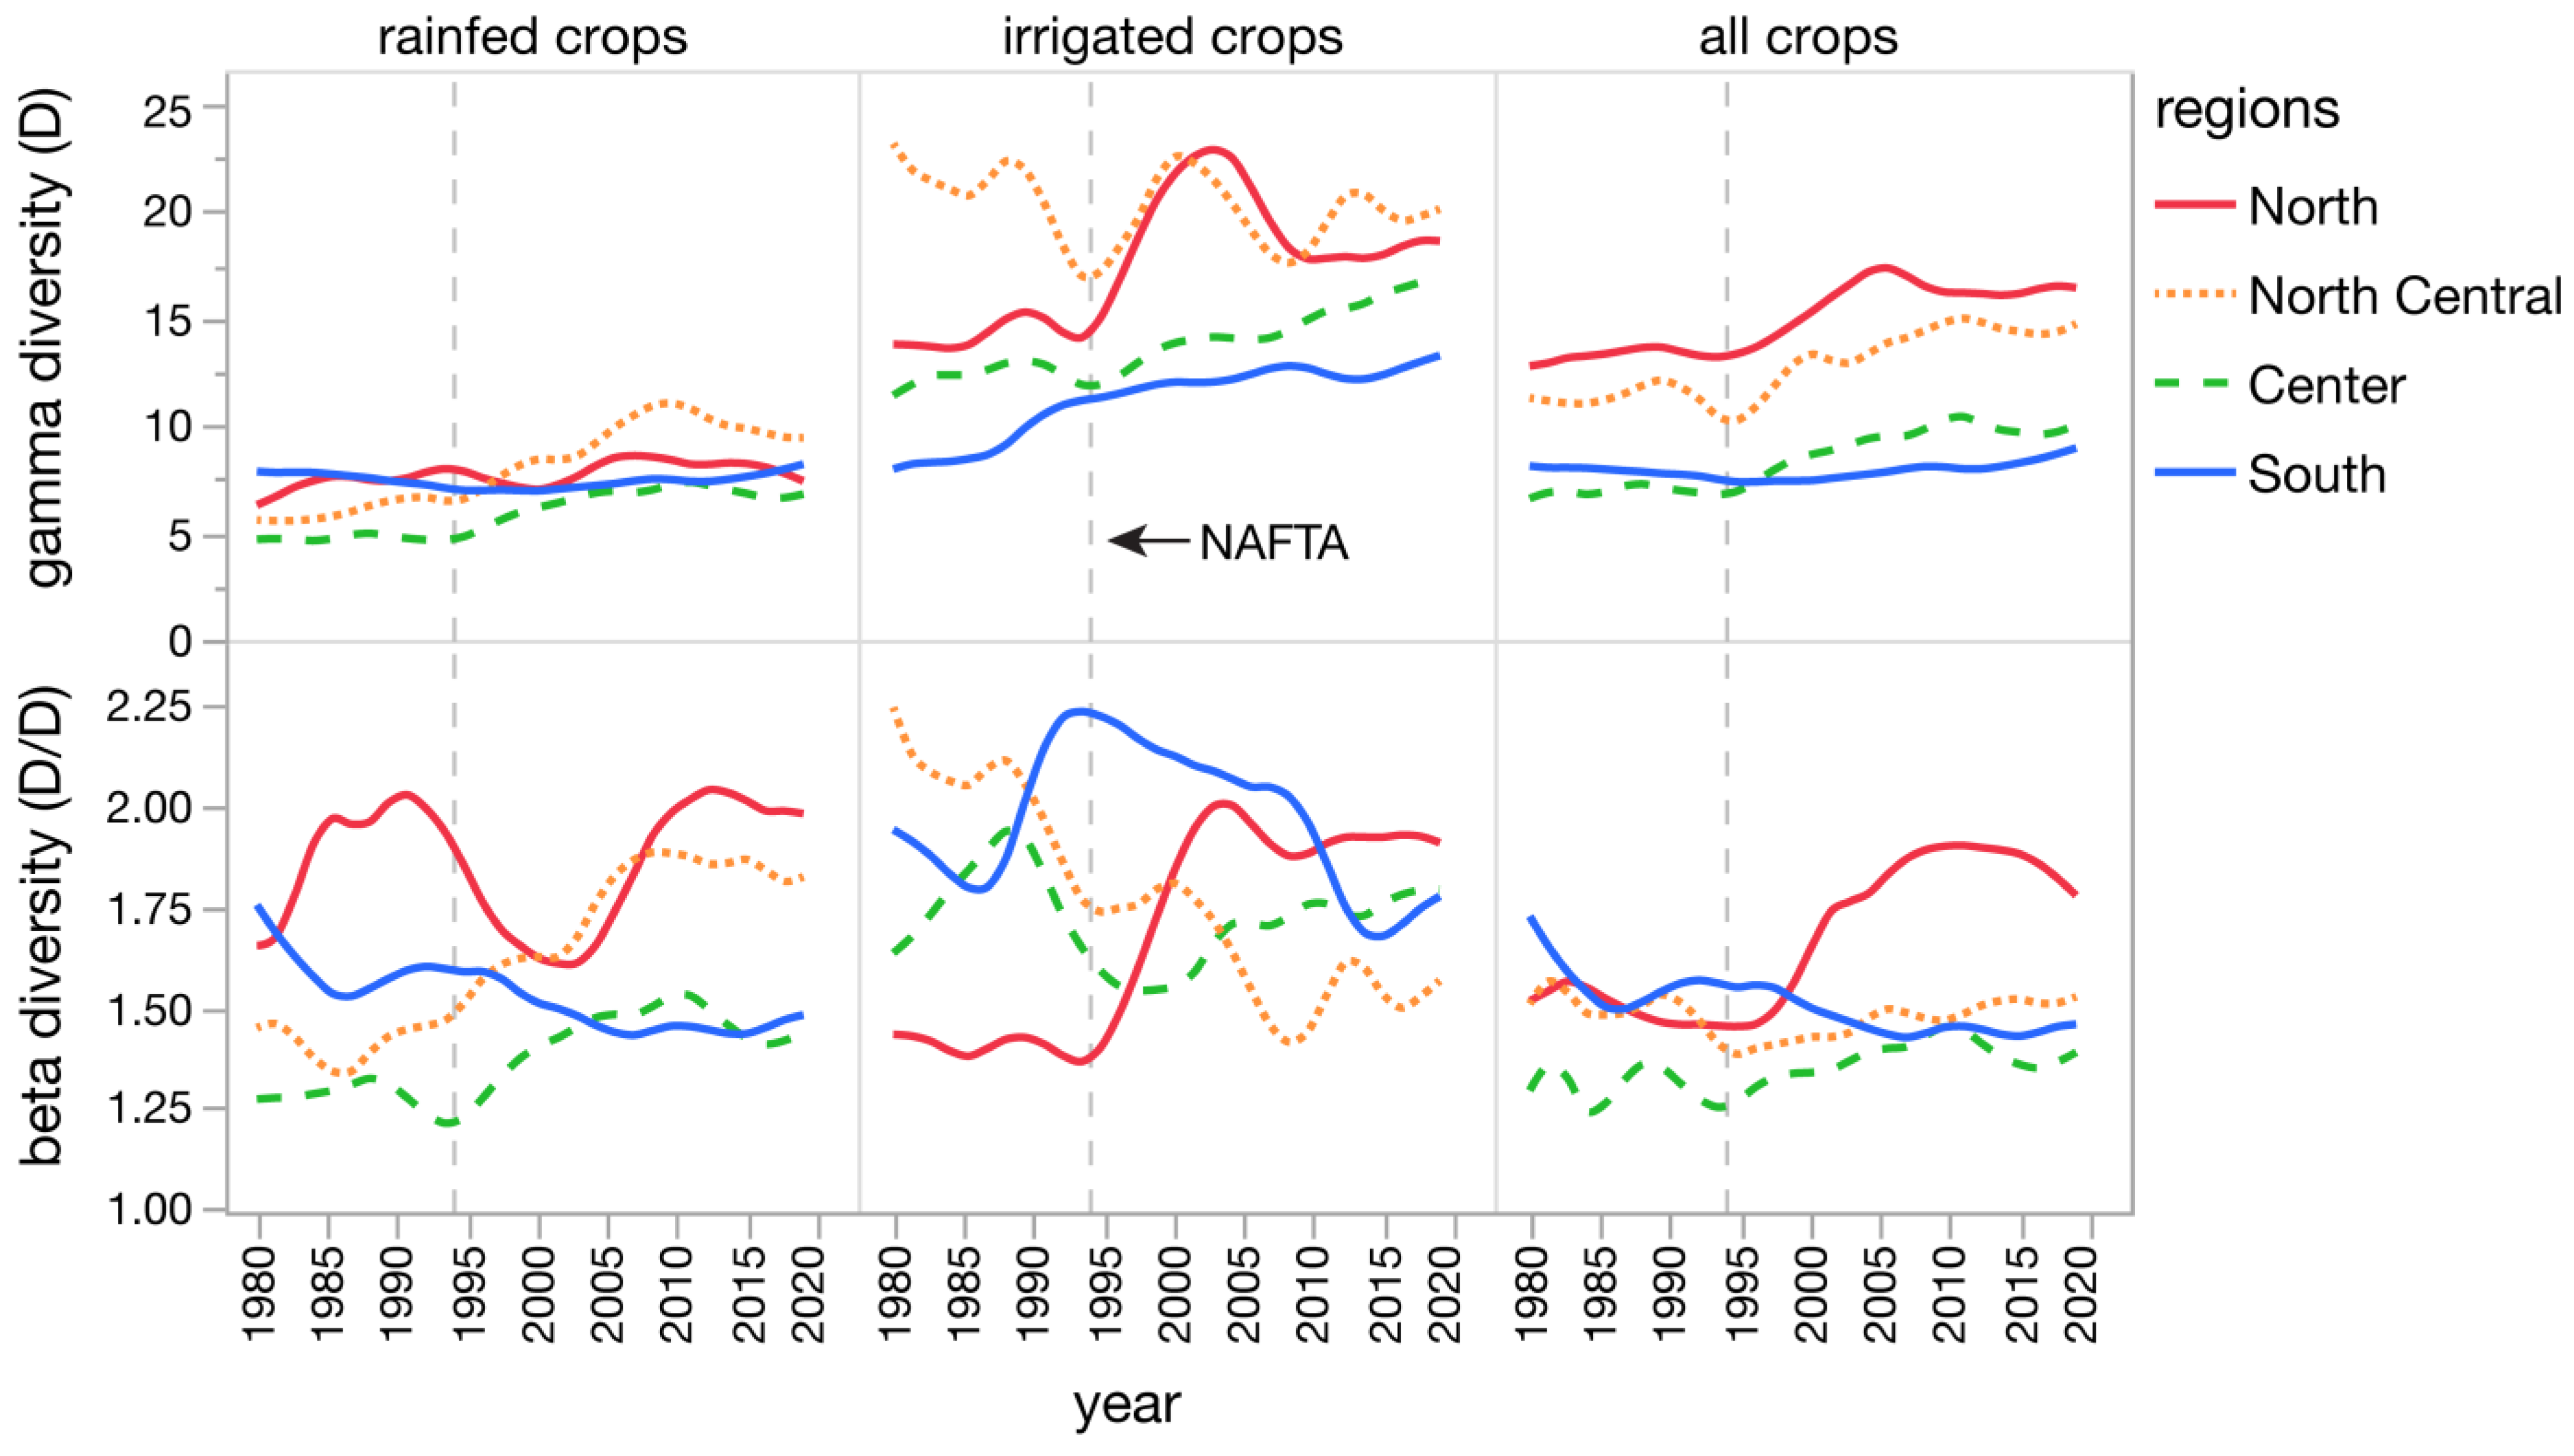
  • Q3: How has NAFTA (1994–2020) influenced trends in crop species diversity?
To answer these questions, yearly crop production data were used to calculate crop species richness (number of species) and effective diversity (alpha, beta, gamma) at state, regional, and national levels from 1980 to 2020. Data were obtained from publicly available government sources on the harvested areas (ha yr−1) of 304 crop species cultivated on rainfed and irrigated lands. Time series plots and heat maps of crop diversity measures were used to illustrate spatial and temporal changes during the study period. Findings were discussed in the contexts of agri-environmental policy and water resource management in Mexico and broader relationships between crop diversity and sustainability.

2. Materials and Methods

2.1. Data Sources

Crop production data were obtained from the Agri-food and Fisheries Service (SIAP) of Mexico’s Secretary of Agriculture and Rural Development [34]. Data included the total yearly rainfed and irrigated cropland areas (ha yr−1) of 304 crop species produced in each of Mexico’s 31 states and the Federal District (hereafter, “states”) from 1980 to 2020. Crop species were stratified into 14 groups based on cross-referencing with SIAP catalogs and the Food and Agriculture Organization of the United Nations classification [35,36]. For each crop group and year, the cultivated areas (total and % of total) of rainfed and irrigated crops were calculated and expressed as time series. The dataset for 2020, which marked the final year of NAFTA and the onset of the COVID pandemic, was substantially reduced and inconsistent compared to previous years. It was unclear if this reflected pandemic-related data collection issues or actual changes in production. Therefore, the year 2020 was omitted from further analysis.

2.2. Diversity Measures

Crop species diversity was calculated in two ways. First, the number of species per area was calculated and expressed as a measure of crop richness diversity. Second, both richness and evenness diversity components were measured and expressed as the exponent of the Shannon diversity index. This is commonly interpreted as a measure of the effective number of crop species cultivated per equal area [18,37,38,39,40]:
D = e H ,
H = i = 0 n p i ln p i ,
where D is effective crop species diversity, H is the Shannon diversity index, p is the proportion of cultivated area for crop species i, and n is the total number of crop species. Spatial variations in D for each year were calculated following:
β = γ / α ,
where γ expresses yearly gamma diversity, α expresses yearly alpha diversity, and β expresses yearly beta diversity. Gamma diversity represents the total D of larger areas (i.e., the nation and region). Alpha diversity represents the mean D of smaller areas (i.e., the states). Beta diversity is the ratio of gamma and alpha diversities, which is a measure of dissimilarity in D among states.
In other words, gamma diversity expresses the total species diversity at national or regional levels, and alpha and beta diversities express crop species compositions within (alpha) and among (beta) the states. For example, if all state-level (alpha) D were equal, all regional- and national-level D would be equal, and therefore, beta diversity would equal 1. However, when alpha diversity among states differs, beta diversity values are greater than 1 and express a degree of dissimilarity in D among the states, either within a region or the nation. Together, these three measures of spatial diversity are commonly used in ecology, conservation biology, and agricultural studies to illustrate patterns and trends in spatial diversity [8,13,37,41].
In this study, gamma-, alpha-, and beta-diversity calculations were made for: (1) rainfed cropped areas, (2) irrigated cropped areas, and together, (3) all cropped areas. Changes in species richness and effective diversity throughout the study period were illustrated at the state, regional, and national levels. Regional grouping of states followed the widely used Bank of Mexico classification, which divides the country into four main regions: North, North Central, Center, and South [42,43]. All analyses and illustrations were completed in JMP Pro 15.2.1. (SAS Institute, Cary, NC, USA).

3. Results

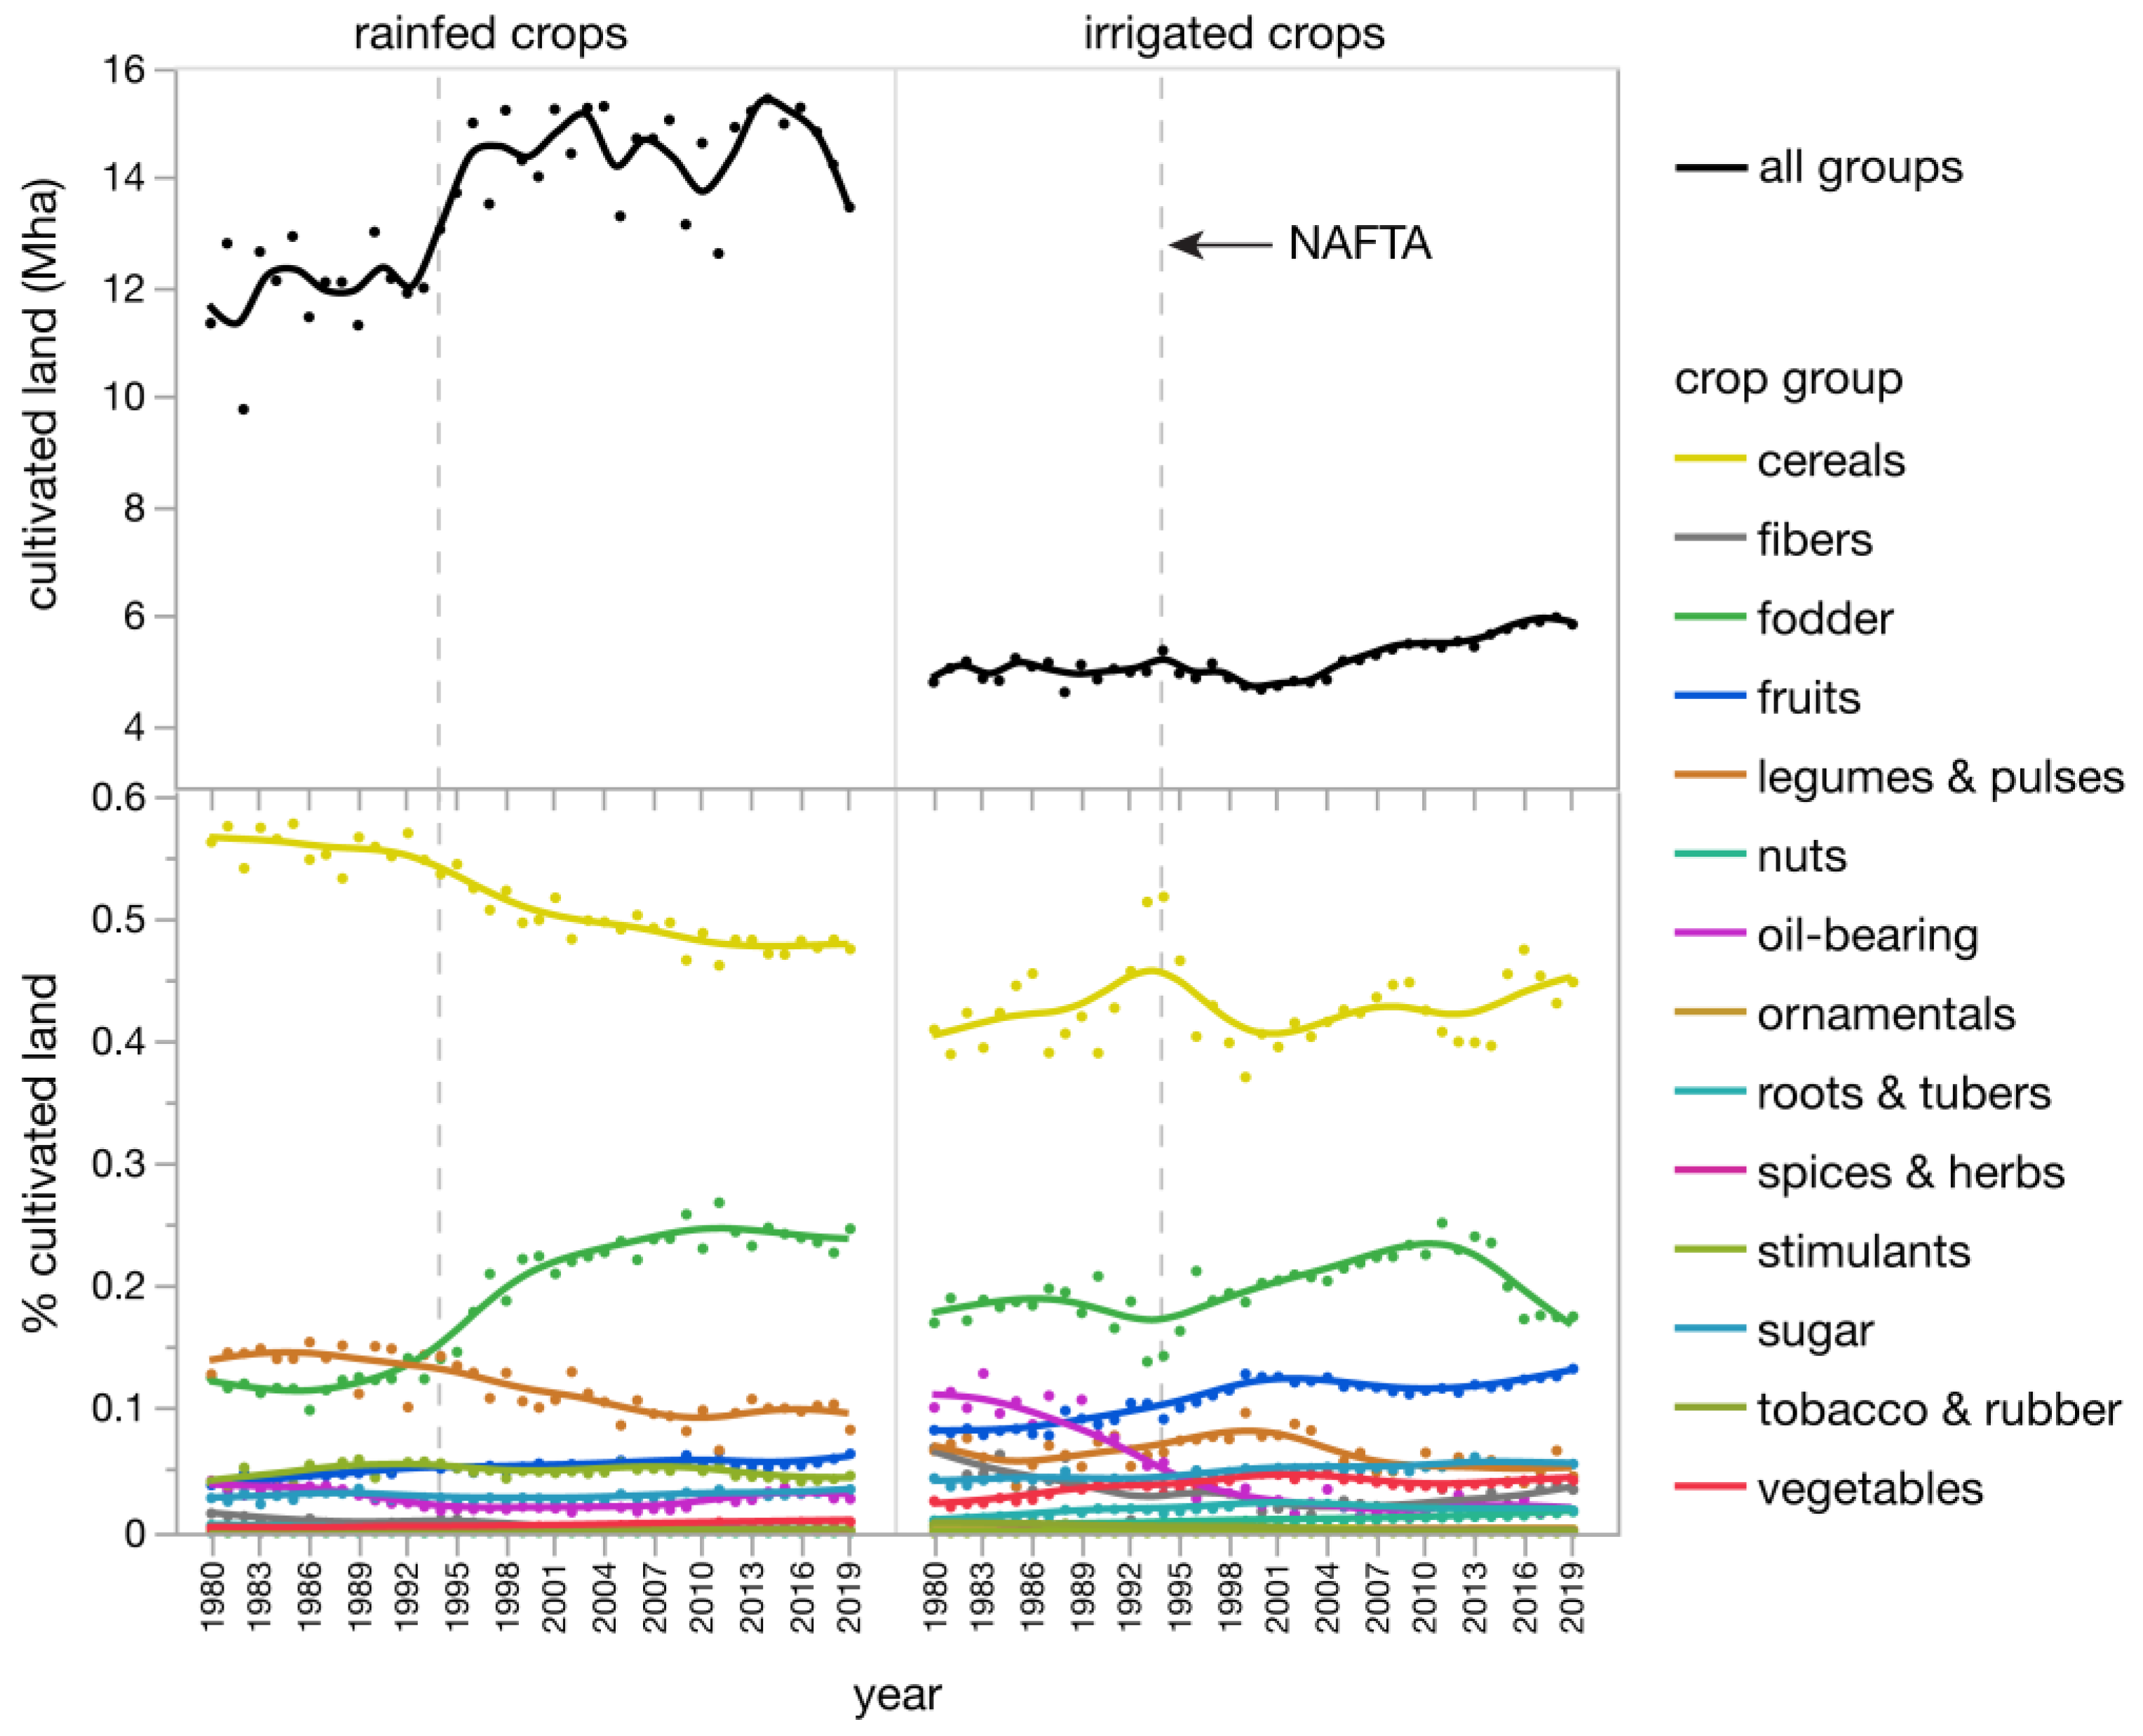
3.1. Changes in Rainfed and Irrigated Crop Species

Overall, the total cultivated area in Mexico increased during the study period, especially after 1994 (Figure 1). For rainfed crops, the total cultivated area increased by about 15% after 1994, from 13 to as high as 15 million hectares (Mha). For irrigated crops, the total cultivated area increased at a slightly higher rate (20%), though the total area under irrigation was smaller (from 5 to 6 Mha). Cereals (mostly maize) comprised the largest share of rainfed croplands, though the share decreased steadily from 56% in 1980 to 46% by 2019. Fodder crops comprised the second-largest share of rainfed croplands, which steadily increased from 12% in 1980 to 24% by 2019.
Cereals also comprised the largest share of irrigated croplands, which increased from 40% in 1980 to about 53% in 1994, before falling to 36% by 2000 and finally recovering to between 42% and 48% from 2000 to 2019. Fodder crops also comprised the second-largest share of irrigated croplands, rising from 15% in 1994 to 25% by 2010 before dropping again to 15% by 2019. The share of irrigated croplands producing fruits increased by about 44% from 1980 to 2019. Importantly, fruit crops comprised the largest and most consistent percent increases in irrigated cropland area during the study period.

3.2. National-Level Changes in Crop Species Diversity

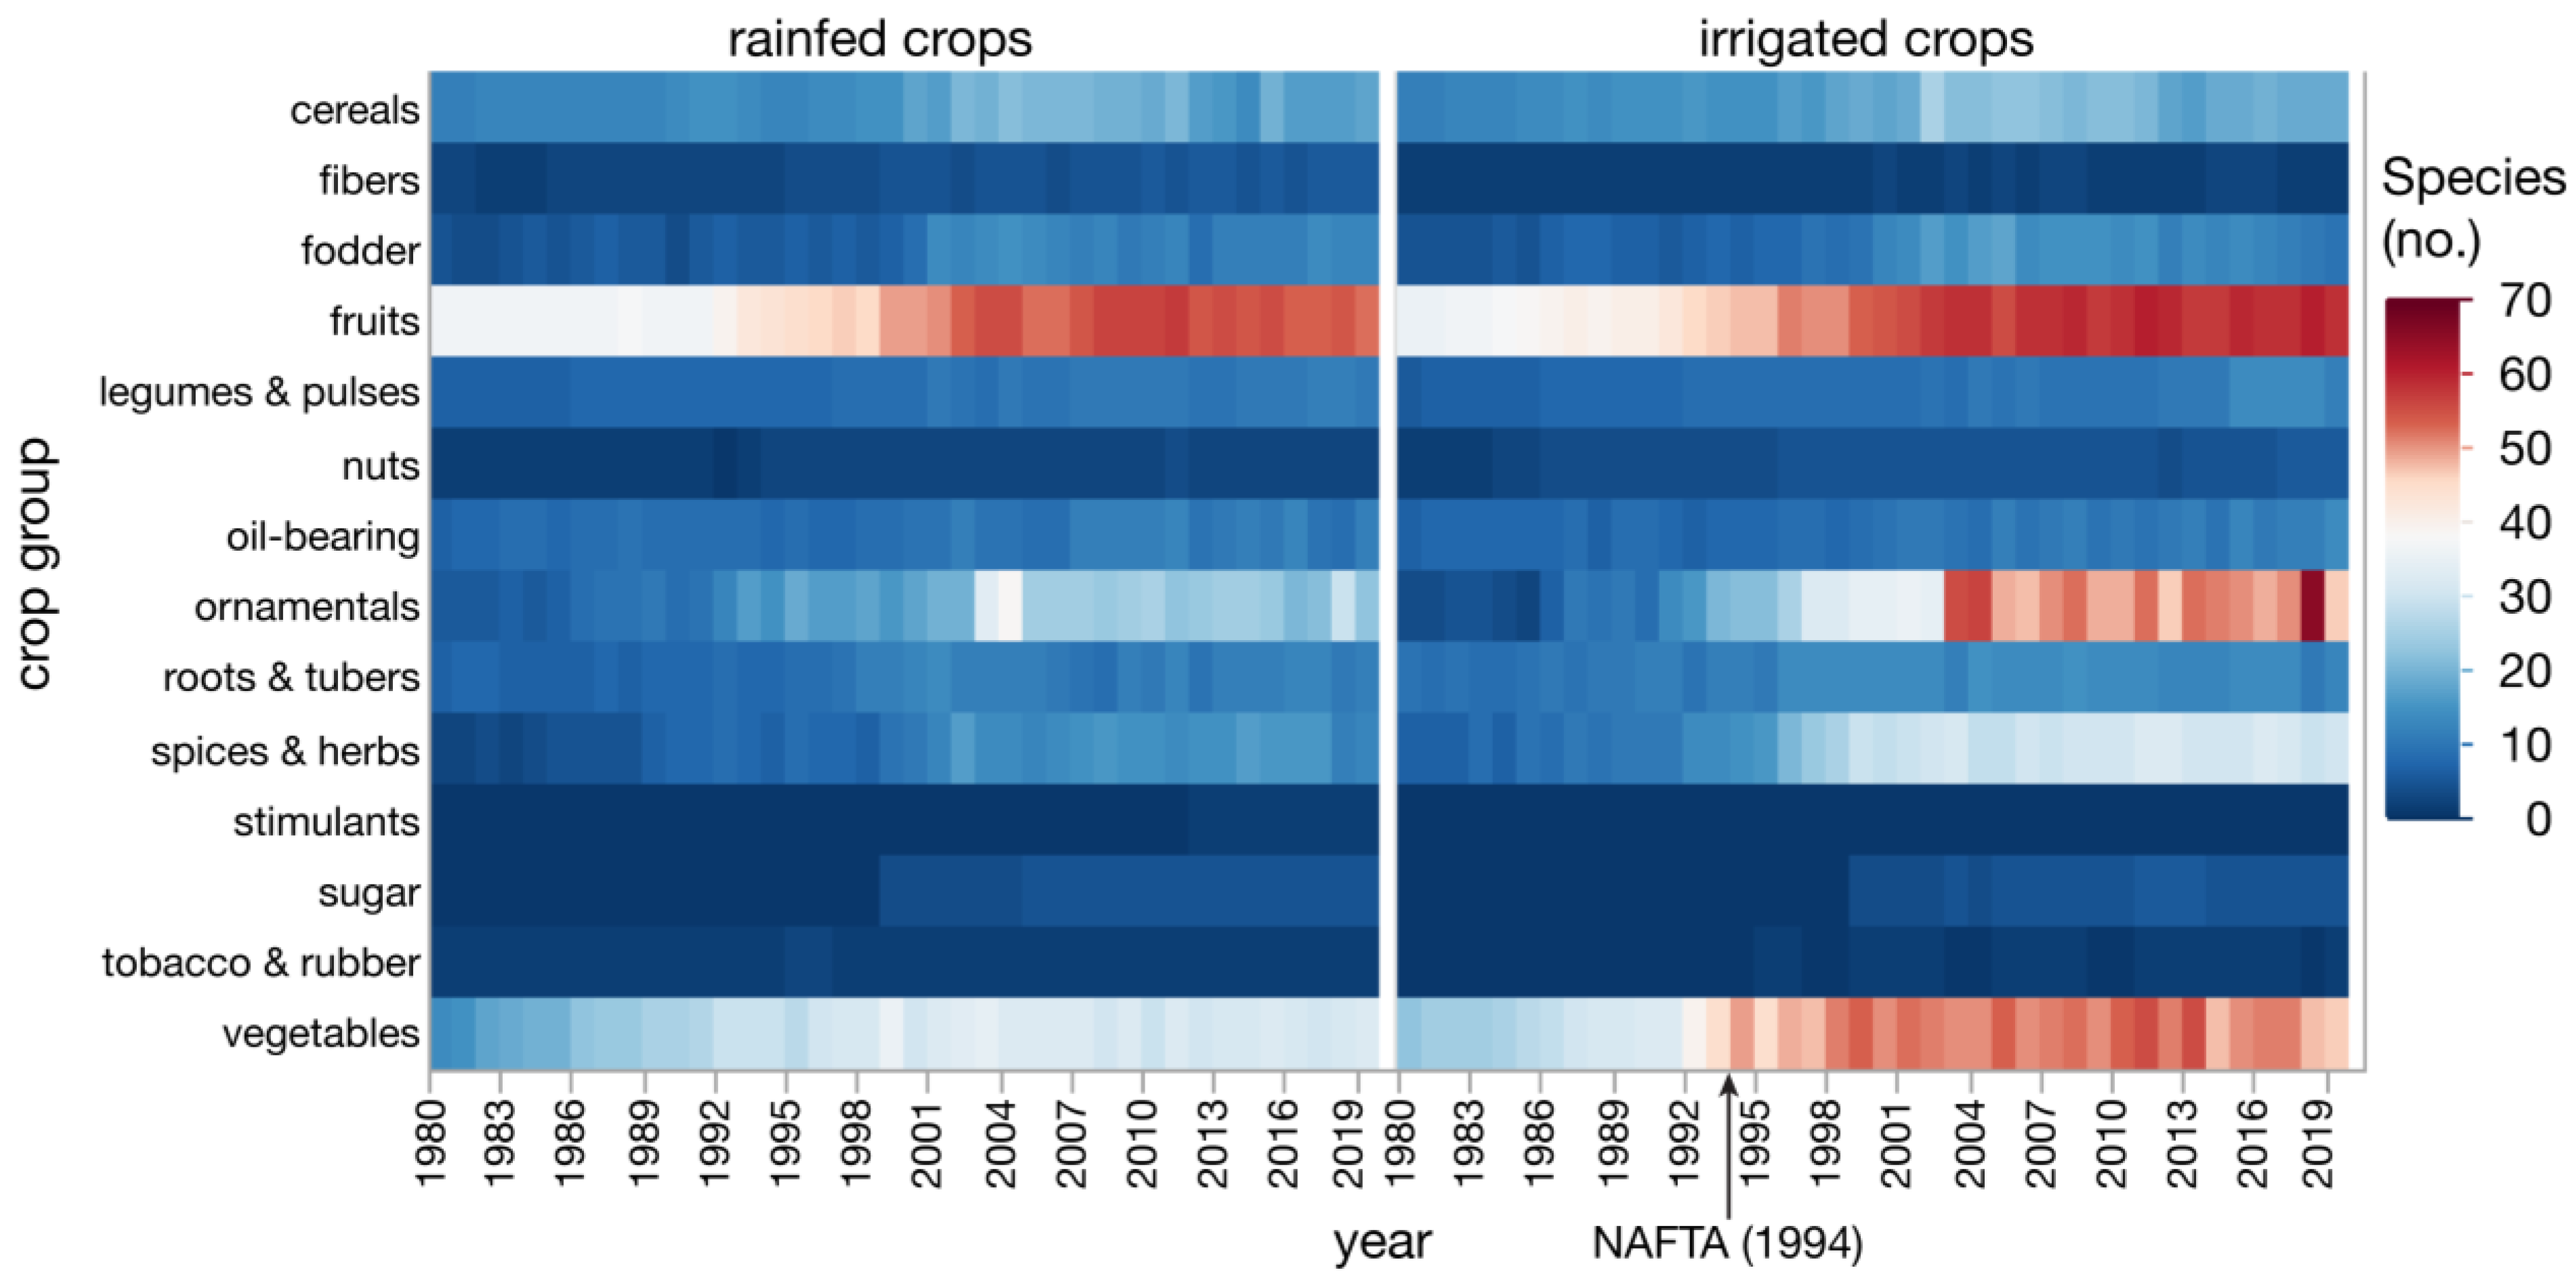
3.2.1. Crop Species Richness (National)

Crop species richness (number of species) generally increased after 1994, especially among fruits, ornamentals, spices and herbs, and vegetables (Figure 2). Among rainfed crops, 33–36 fruit species were cultivated before 1994 and 42–55 species after 1994. The richness of rainfed ornamentals, spices and herbs, and vegetables also increased after 1994, though these increases were smaller, seldom exceeding 35 species in any group.
The species richness of irrigated crops also increased after 1994 and was generally larger than for rainfed crops. A prime example was ornamental species, which differed sharply among rainfed and irrigated croplands before and after 1994. Before 1994, slightly more rainfed ornamental species were cultivated than irrigated ornamental species (both fewer than 12 species), but after 1994, the number of irrigated ornamental species increased to more than 58 species, while rainfed ornamental species increased to only 28–32 species. Increases after 1994 in spices and herbs followed a similar pattern, whereby increases were far greater on irrigated croplands than on rainfed croplands. The number of fruit and vegetable species cultivated also increased dramatically after 1994, though differences were greater for irrigated vegetables than for irrigated fruits, which also showed strong diversification after 1994 in rainfed croplands.
Overall, the post-1994 period saw dramatic increases in species richness among fruits, ornamentals, species and herbs, and vegetables—though increases for most crops were far greater on irrigated lands than on rainfed lands.

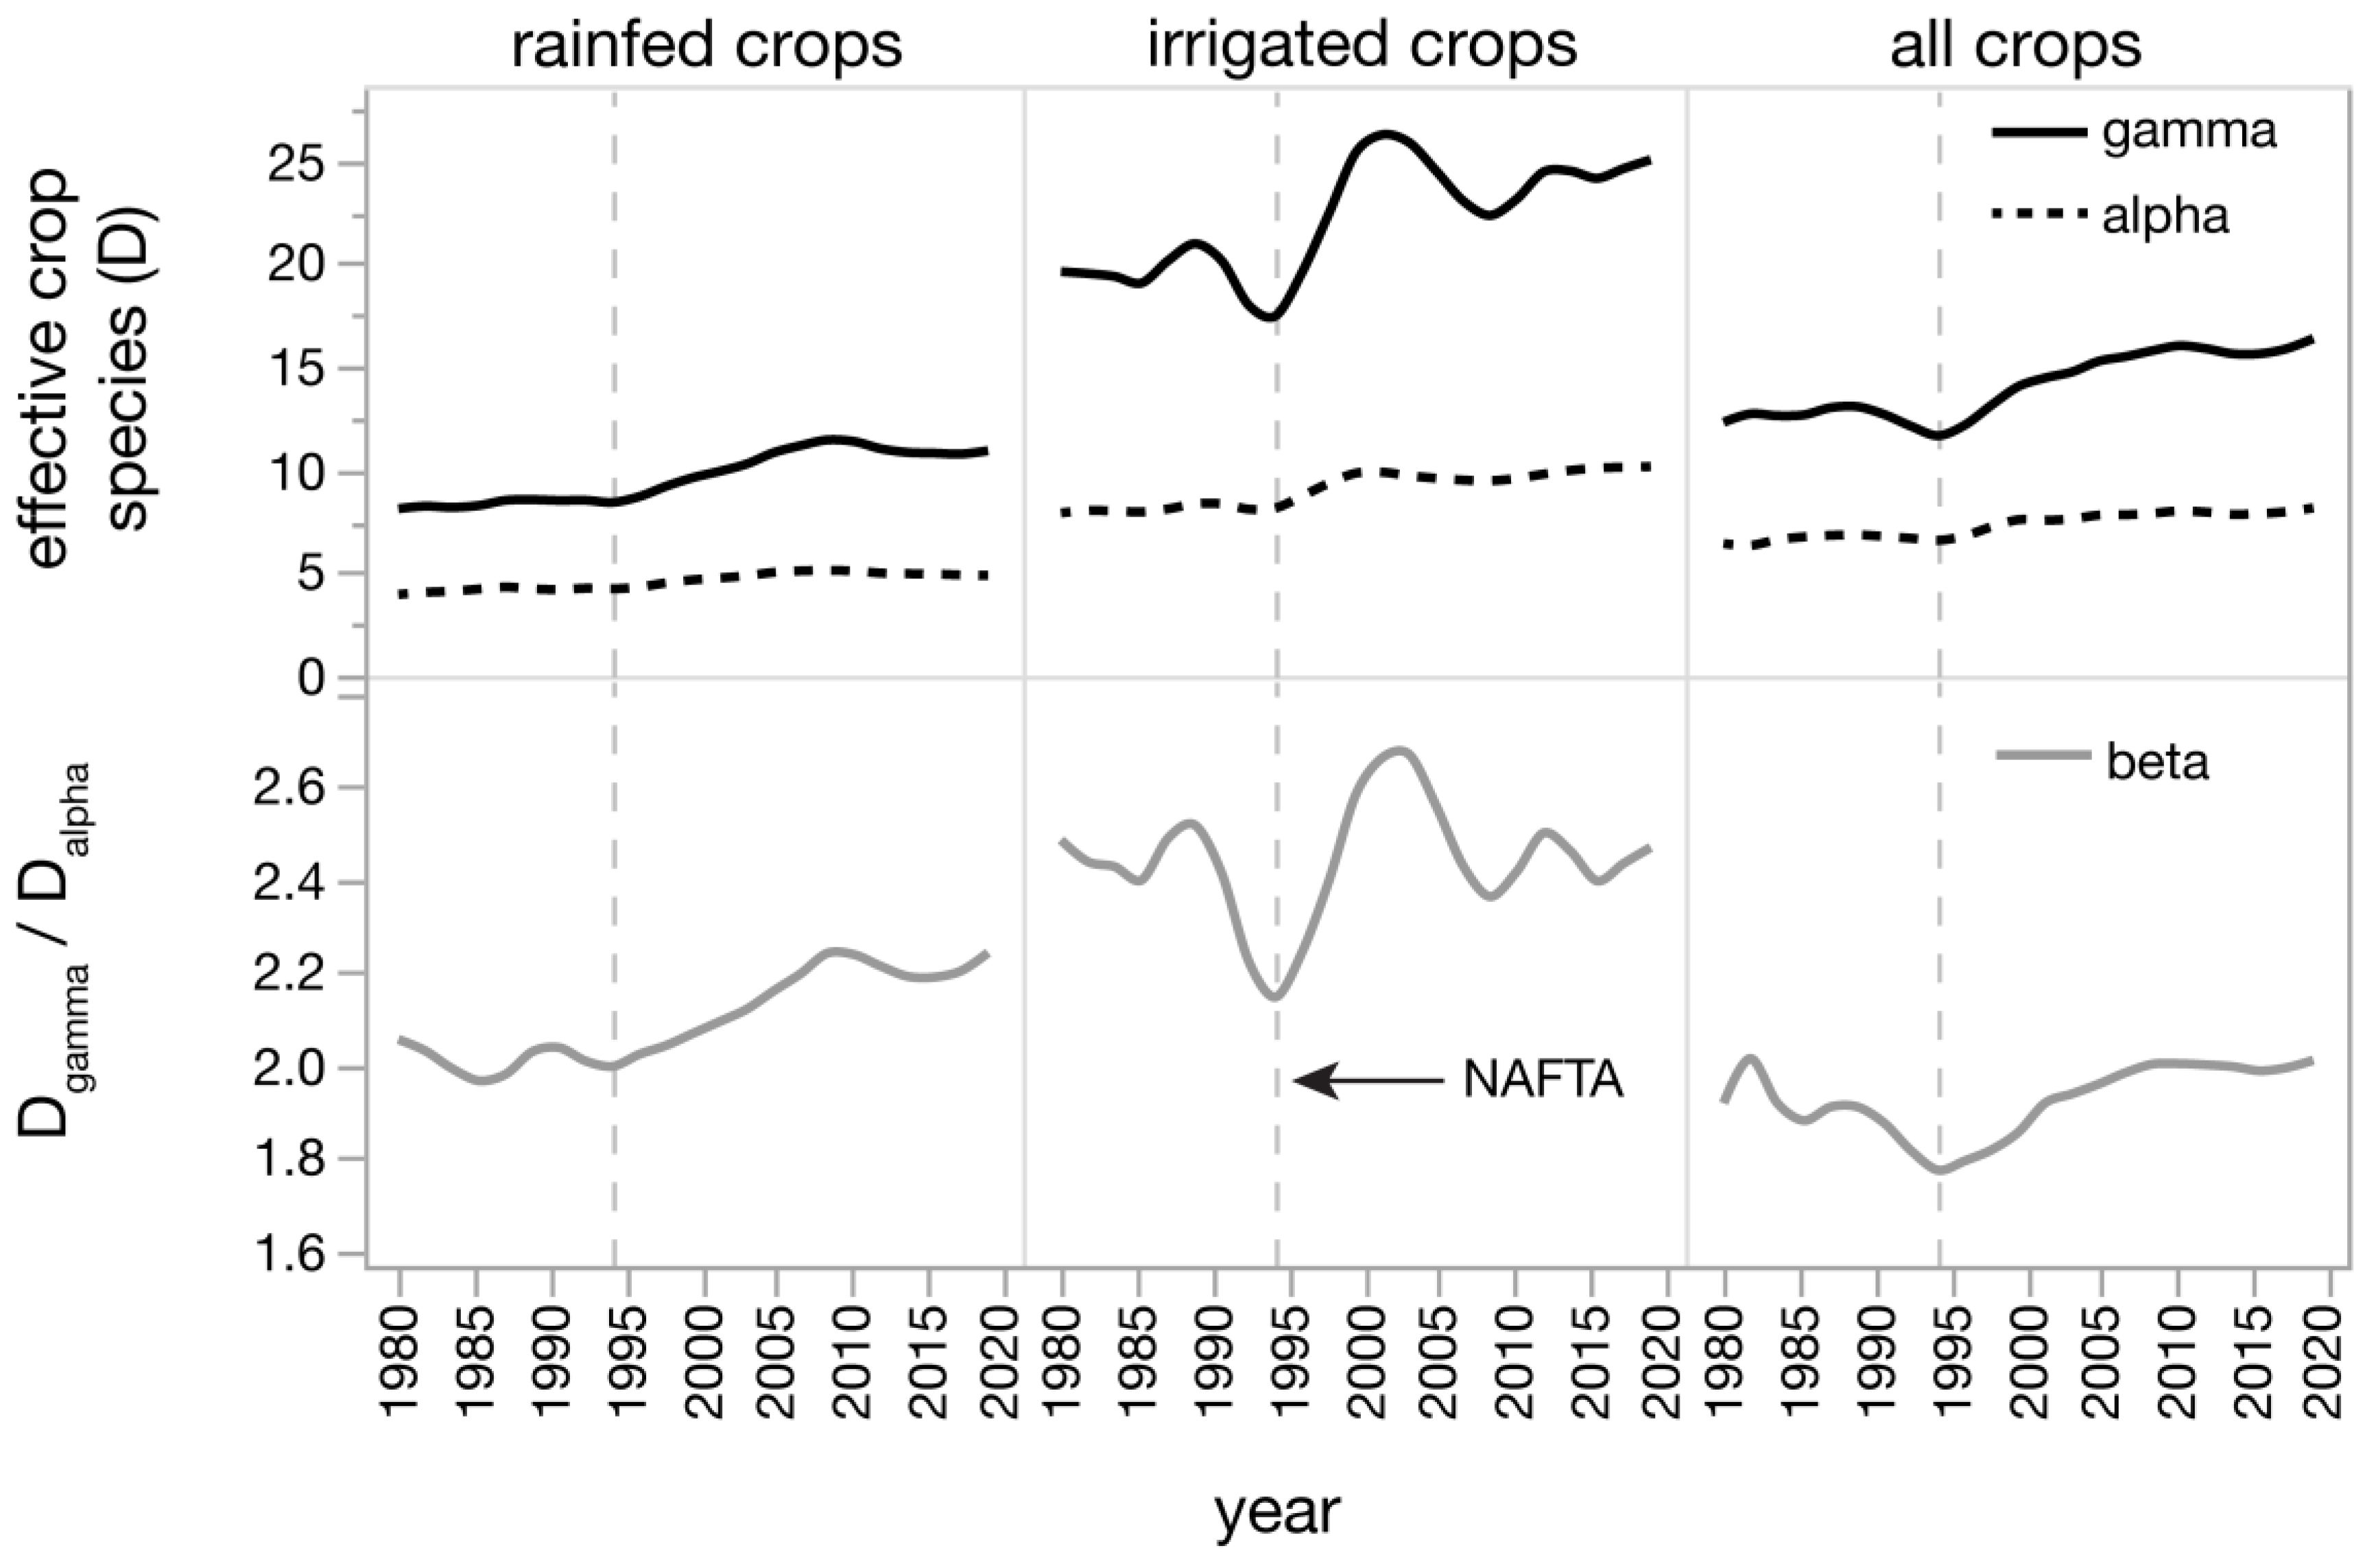
3.2.2. Crop Effective Diversity (National)

At the national level (gamma), the total effective crop species diversity (D) of irrigated crops was about twice that of rainfed crops (Figure 3), though the gamma diversity of all crops (both rainfed and irrigated) increased after 1994. After 1994, the gamma diversity of rainfed crops increased by about 71%, from 7 to 12 effective species, while the gamma diversity of irrigated crops increased by about 69%, from 16 to 27 effective species. Nationally, the gamma diversity of irrigated crops decreased to its lowest level (D = 17) in 1994 before spiking to its highest level (D = 26) in the following decade. After an adjustment period, the gamma diversity of irrigated crops steadily increased by ~5% through 2019. Together, the gamma diversity of all crops decreased slightly leading to 1994, but after 1994 increased by ~36% through 2019. Alpha diversity (mean state-level D) increased only slightly after 1994, which served to widen the gap between alpha and gamma diversities. For both rainfed and irrigated crops, alpha diversity was about 50% of gamma diversity before 1994 but only about 40% of gamma diversity after 1994.
The widening gap between gamma and alpha diversities after 1994 is reflected by corresponding increases in beta diversity. The beta diversity of rainfed crops, while significantly lower than for irrigated crops, steadily increased after 1994. Through most of the study period, however, the beta diversity of irrigated crops remained significantly higher than for rainfed crops, and changes in beta diversity tended to be larger and more frequent for irrigated crops than for rainfed crops. Interestingly, the beta diversity of irrigated crops declined sharply in the years leading to 1994, when it reached its lowest recorded level (2.2), but then spiked after 1994 to its highest recorded level (2.7). After 2003, however, the beta diversity of irrigated crops fell and began to stabilize near pre-1987 levels. Among all crops, the trend in national-level beta diversity is clear—beta diversity declined steadily before reaching its lowest point (1.8) in 1994. It then increased steadily after 1994 and matched its highest level (2.2) by 2019.

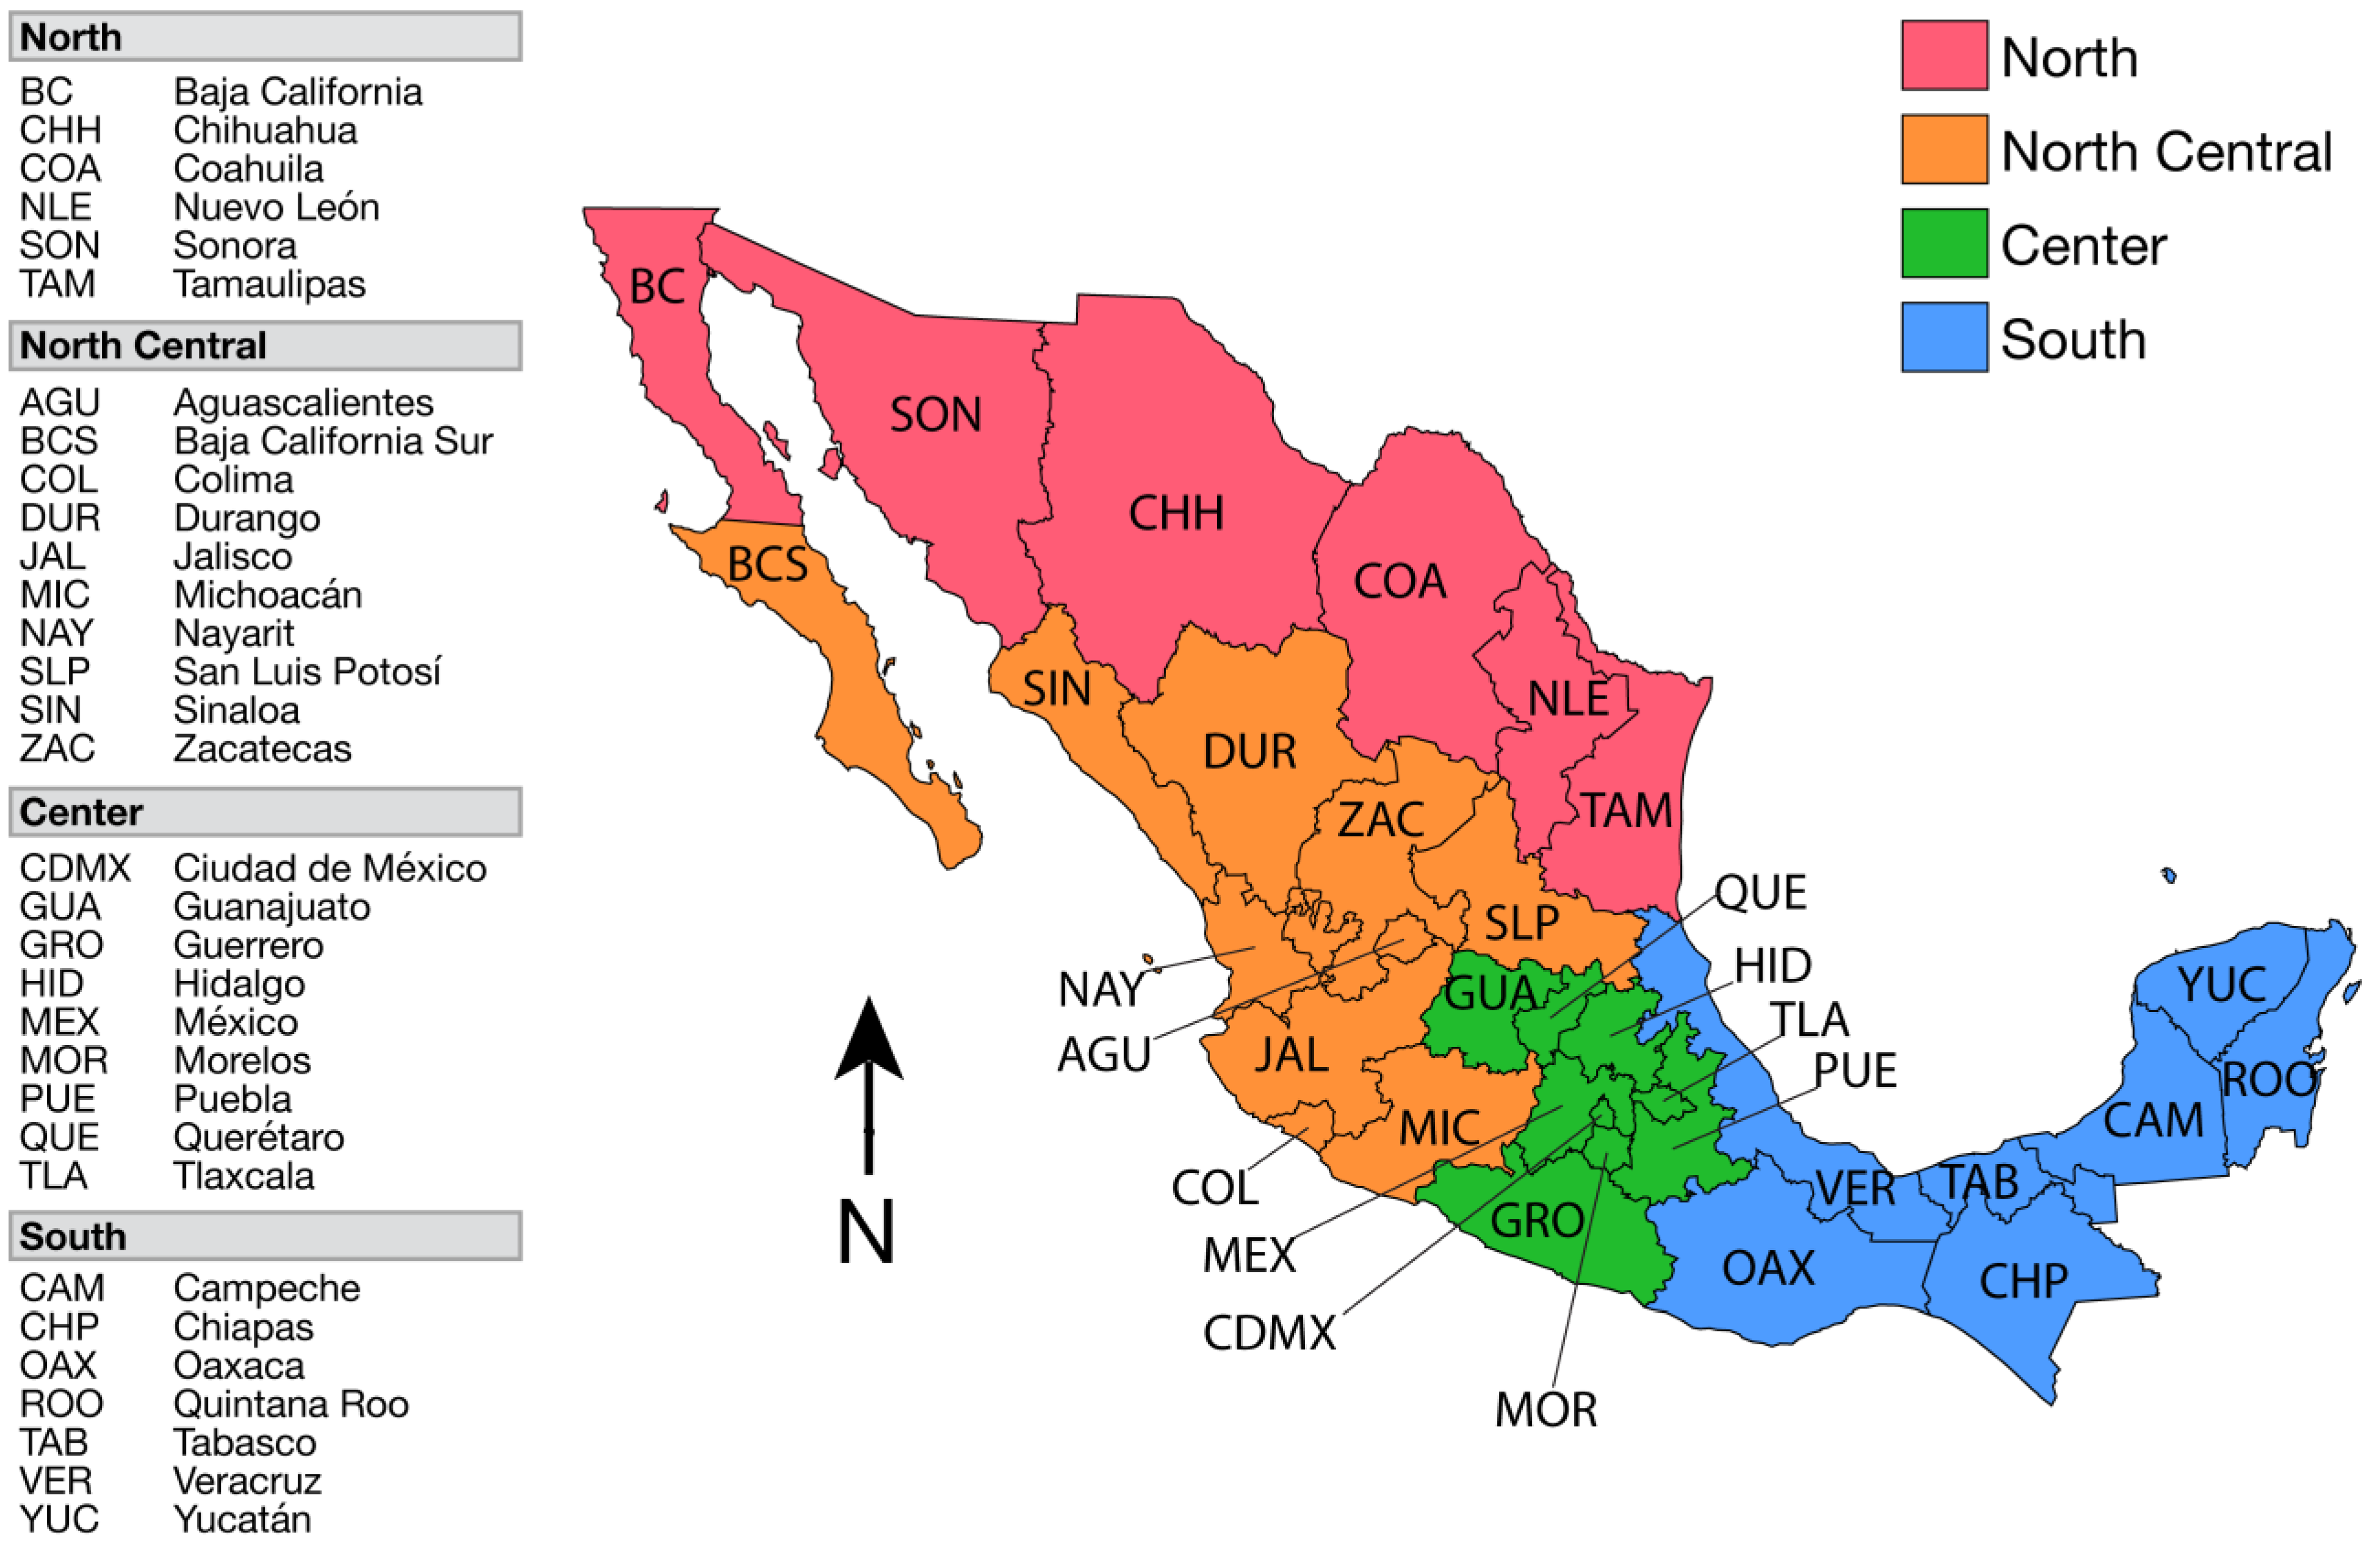
3.3. Regional-Level Changes in Crop Species Diversity

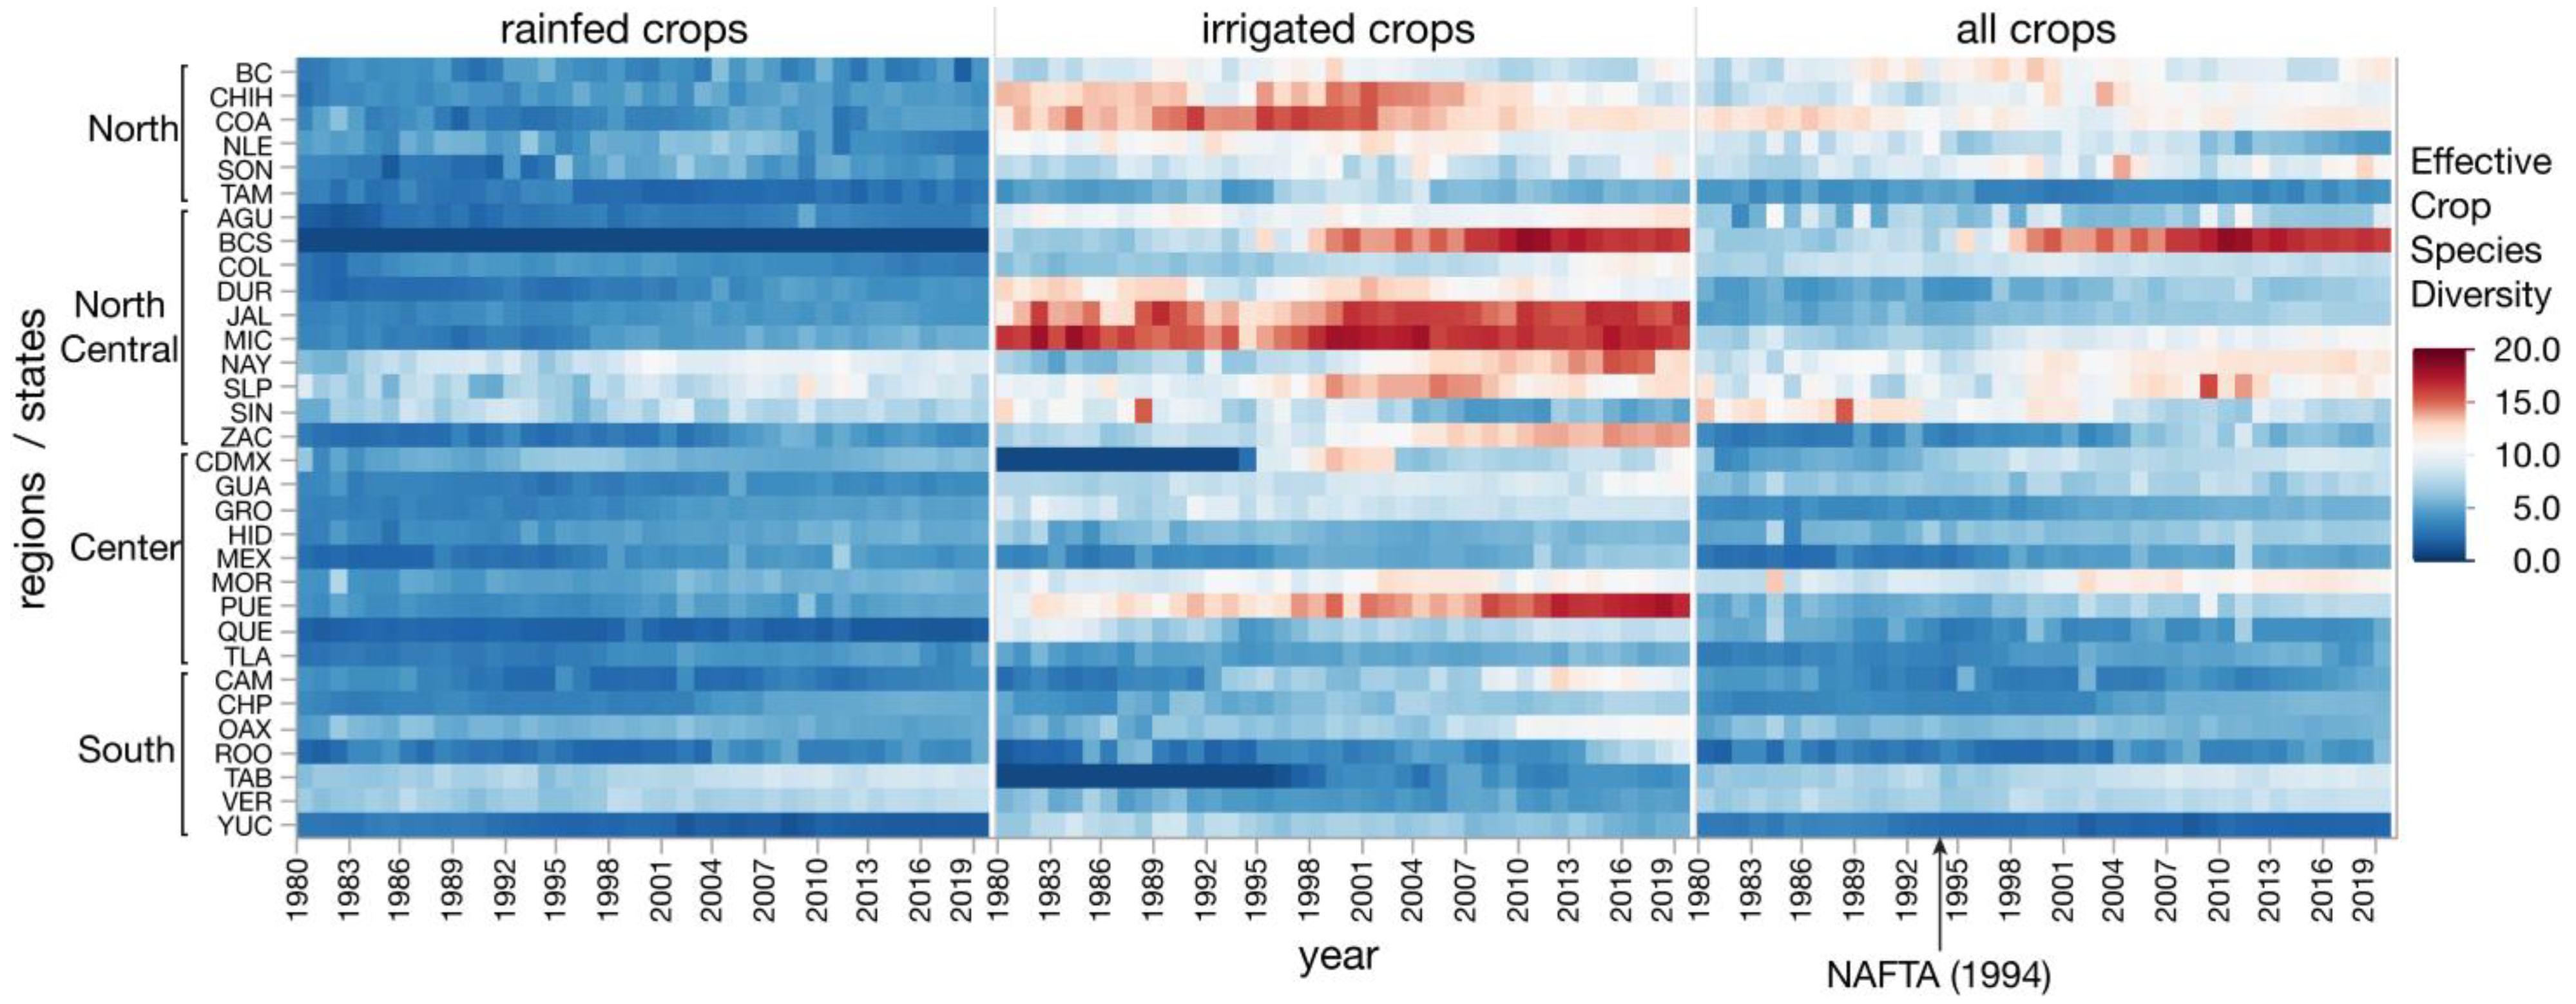
3.3.1. Crop Effective Diversity (State and Regional)

Figure 4 and Figure 5 show that among all crops (rainfed and irrigated), state- and regional-level D tended to be highest in the North and North Central regions. This pattern also held for irrigated crops, except for those in the Central state of Puebla, which were also highly diverse. For rainfed crops, patterns of state- and regional-level D were less distinct, changing little during the study period. Nevertheless, rainfed D was highest in the North Central states of Nayarit, San Luis Potosí, and Sinaloa and in the Southern states of Tabasco and Veracruz (D = 10–12). Rainfed D was lowest (D < 4) in Baja California Sur (North Central), Queretaro (Center), and Yucatán (South) states.
For irrigated crops, state-level D was highest in Chihuahua and Coahuila (North), Baja California Sur, Jalisco, and Michoacán (North Central), and in Puebla (Center)—where in most cases, D > 14. The largest increases in state-level D after 1994 were observed among irrigated crops in Baja California Sur, where D increased from 8 in 1994 to more than 15 by 2019. Large increases in irrigated-crop D after 1994 were also observed in the North Central states of Nayarit, San Luis Potosí, Sinaloa, and Zacatecas.
Among all crops, D was highest in Baja California Sur. Here, the post-1994 increase in D closely resembled the increase in this state among irrigated crops alone. In other states, the D of all crops in the North and North Central regions generally increased after 1994, but the pre- and post-1994 contrasts were not as apparent as in the state of Baja California Sur.

3.3.2. Regional Gamma Diversity

Temporal and spatial patterns of change in D are further illustrated in Figure 6. After 1994, rainfed gamma D (total rainfed D per region) changed little in the North and South regions but increased by 40% (5 to 7) in the Center region and by 43% (7 to 10) in the North Central region, where it was highest.
Overall, however, regional gamma D was significantly higher for irrigated crops than for rainfed crops. The differences between rainfed and irrigated gamma D were the smallest in the South region, though these increased during the study period. Interestingly, in the South, gamma D was the same for both rainfed and irrigated crops (7.5) in 1980. By 2019, however, while gamma D had remained the same for rainfed crops (7.5), it had almost doubled for irrigated crops (13). In the other three regions, irrigated gamma D dropped immediately before 1994 but then increased dramatically after 1994. In the North region, for example, irrigated gamma D increased from 13 to 17–22 from 1994 to 2019, while in the Center region, it increased from 11 to 16 (increases of about 54% and 46%, respectively). Overall, gamma D for irrigated crops was highest in the North and North Central regions. When all crops were measured together, gamma D remained highest in the North and North Central regions.

3.3.3. Regional Beta Diversity

Regional beta D varied widely during the study period. For rainfed crops, regional beta D after 1994 was highest in the North and North Central regions and lowest in the Central and South regions. In the North, rainfed beta D rose before 1990, dropped sharply from 1990 to 2003, and then rose again from 2004 to 2019 to the highest level among regions. In the North Central region, rainfed beta D rose steadily from 1986 to 2007 and was the second highest among regions by 2019. In the Center region, rainfed beta D rose after 1994 to reach about the same level as in the South region. In the South, however, rainfed beta D dropped steadily throughout the study period, from the highest among all the regions in 1980 to the second lowest by 2019. Overall, post-1994 changes in regional beta D show greater differentiation (turnover) among states in the North and North Central regions than among states in the Center and South regions, where measures of D among states were more alike.
Among irrigated crops, the most notable changes in beta D were in the North region, which measured lowest among all regions before 1994, but then dramatically increased after 1994 to the highest level among regions. In sharp contrast, beta D dropped sharply among irrigated crops in the North Central and South regions from the two highest among regions in 1994 to the two lowest by 2019. Interestingly, the beta D of all crops remained largely flat throughout the study period—except in the North, where it rose sharply after 1994 and remained significantly higher than in other regions. In sum, the gamma and beta diversities of crops in the North and North Central regions were higher than in the Center and South regions. Among irrigated crops only, gamma D also was highest in the North and North Central regions, though state-level D in the North region showed greater heterogeneity (higher beta D) than in the North Central region.

4. Discussion

4.1. Increased Temporal and Spatial Diversity of Crop Species (Q1)

We found that effective crop species diversity generally increased at state, regional, and national levels during the study period. Regional- and national-level diversities (gamma) increased dramatically, while mean state-level diversity (alpha) increased modestly. Diversity increases were larger in the North and North Central regions than in the Center and South regions. The differences in species composition among states (beta) also tended to be highest in the North, especially after 1994 and among irrigated fruits, ornamentals, spices and herbs, and vegetable crops.
These findings contribute to a growing body of research highlighting that while the genetic diversity of crop landraces and wild relatives continues to erode, crop species diversity patterns differ widely [9,13]. Previous research finds that crop species diversification appears to have peaked during the 1980s and then leveled off beginning in the 1990s, though the magnitude and timing of these trends depended strongly on regional- and national-level factors [13,18,44,45]. This study shows that crop species production diversity in Mexico continued to increase well after the 1990s at state, regional, and national levels. Though correlational, findings suggest that diversification trends were strongly related to the effects of regional trade and the intensification of irrigation.

4.2. Crop Species Diversity Dependent on Unsustainable Irrigation (Q2)

This study found that the species diversity of irrigated crops was about twice as high as the species diversity of rainfed crops at the national level. This was also true at the regional level, though sharp distinctions emerged among regions. Irrigated diversity was highest in the North and North Central regions, where large-scale hydraulic infrastructure and intensive irrigation resulted in some of the highest crop productivity in Mexico [46].
This finding provides insight into the effects of intensification on crop diversification, a topic that merits greater research attention. While studies show that the intensification of inputs generally leads to the homogenization of landscapes and reductions in agrobiodiversity [10], the partial effects of different inputs on diversity are poorly understood. In the case of irrigation, a key component of intensification, studies show that increases in irrigation can lead to both crop diversification (greater diversity) and specialization (less diversity). When leading to diversification, farmers use irrigation to expand the range of crops that can be grown, which often includes more value-added or nutritionally diverse crops [47,48]. When leading to specialization, farmers instead use irrigation to enhance the productivity of a few, usually water-intensive species [49,50]. Ultimately, farmer decisions over how to employ irrigation to diversify or specialize derive from perceptions of the opportunities and constraints of socioeconomic, environmental, and other factors [51,52]. These decision-making processes are difficult to measure and assess over large spatial scales due, in part, to data limitations and the heterogeneity of agricultural landscapes. The net results of these decisions, however, can be observed in the aggregate [14,45]. In Mexico, a recent national-level study found that irrigation was a strong positive predictor of crop species richness and evenness of diversity across the country [53]. The study controlled for a range of socioeconomic and environmental factors, but due to data limitations, examined only one year (2007). The current study examined longer-term patterns, with findings again suggesting a positive relationship between irrigation and crop species diversification.
Importantly, however, a growing body of research also finds that irrigation practices in Mexico are unsustainable. Over several decades a water crisis has developed in which agricultural water withdrawals, which comprise ~76% of all withdrawals nationally, have far exceeded recharge, especially in northern regions where water insecurity has become severe [32,33]. As such, the irrigation-led boom in crop productivity and diversity came at great costs to freshwater resources [29]. Policymakers and water managers should carefully consider these factors in any sustainability assessment or tradeoff analysis involving agricultural water management and agrobiodiversity in Mexico.

4.3. Crop Species Diversification after NAFTA (Q3)

This study found that crop species diversity increased dramatically after the implementation of NAFTA in 1994. Before 1994, national-level diversity was largely flat or decreasing, with the gamma and beta diversities of irrigated crops reaching the lowest recorded levels. However, immediately after 1994, species diversity spiked to its highest recorded levels, adjusted, and then continued an upward trajectory through 2019. Regionally, the largest post-1994 increases in species diversity were observed in the North and North Central regions, while the lowest increases were in the Central and South regions.
These findings are consistent with existing studies on the contrasting regional effects of NAFTA on agriculture in Mexico. Studies generally show that NAFTA negatively impacted small-scale maize producers in southern regions who, after 1994, were forced to compete with cheap maize imports from heavily subsidized producers in the United States [54,55]. NAFTA also drove an increase in maize imports from the United States, which, among other issues, drove concern over the introduction of maize cultivars (GMOs) to maize landrace diversity [56]. However, in contrast to these negative impacts, large producers in northern regions largely benefitted from NAFTA and the lifting of export restrictions to the United States [57]. After 1994, northern producers experienced a boom in the export-led production of non-maize crops to the United States to meet its growing demand for fruit and vegetable crops [29,58]. This production boom was largely made possible by the intensification and expansion of unsustainable irrigation practices [29].
Taken together, the effects of NAFTA and the intensification of irrigation systems led to an increase in crop species production diversity in Mexico, especially in northern regions. However, these factors also raise important questions about the significance and sustainability of crop species diversification in this context.

4.4. Limitations and Future Research

While crop diversification is generally associated with sustainable outcomes, the findings of this study raise several reasons to examine this assumption more closely. Though beyond the scope of this study, five areas for future inquiry into this assumption are listed below.
First, a better understanding of crop species’ functional diversity is needed. Understanding functional diversity is key to assessing the effects of diversification on non-crop biodiversity and ecosystem services. However, there are many factors that potentially confound the relationship between crop diversity and its effects on ecosystem services. For example, while crop diversity generally enhances pollinator activity [53,59,60], it is unclear how different forms of protected agriculture (e.g., greenhouses) potentially impede pollinator activity. Mexico is a world leader in protected agriculture; much of it is found in the northern irrigated regions with high production diversity identified in this study [61]. More generally, it remains unclear how crop functional diversity is impacted by the combined or interaction effects of agricultural inputs and, ultimately, how these effects impact ecosystems [3,17]. Therefore, assessing the effects of functional crop diversity on ecosystem services is key to linking the diversification processes identified in this study with sustainable outcomes.
Second, a better understanding of the role of irrigation in crop diversification is needed. The strong positive association between unsustainable irrigation and crop diversity identified in this study raises concerns over the sustainability of existing agrodiversity in Mexico. Climate projections show that current agricultural water use in northern regions will likely become even less sustainable [30,33]. Therefore, additional research into the potential tradeoffs between current forms of intensification, water resources management, and crop diversity in Mexico is needed [62]. Ultimately, any benefits of crop diversity to agroecosystem resilience, food system security, or ecosystem services must be weighed against the continued depletion of freshwater reserves in northern regions.
Third, additional research into the effects of crop production diversity on food and nutritional security in Mexico is needed. Several studies link crop production diversity with dietary diversity and nutritional security through either increases in subsistence consumption or income generation [63,64,65]. In Mexico, it is unclear if the dramatic increase in export-led species production diversity after 1994 improved dietary diversity or nutritional security domestically. Research into this question could hold special significance for southern Mexico—a region where few of the benefits of NAFTA have been felt [54] and where food insecurity remains high [66,67].
Fourth, a better understanding of crop beta diversity and its significance is needed. Crop beta diversity is often interpreted as a positive indicator of food system stability and resilience and as a hedge against climatic risks, pest outbreaks, and market shocks [13]. In this sense, greater heterogeneity of diversity measures among smaller units promotes production and yield stability at larger levels [68,69] and protects against synchronized crop failure [70]. Following this interpretation, the increase in beta diversity among irrigated croplands in the North would serve as a positive indicator of the above. However, other interpretations of crop beta diversity have been made [8], which are in line with a general lack of consensus on how to interpret beta diversity in ecological and non-crop biodiversity conservation studies [39,71,72,73]. In sum, additional research is needed to assess relationships between the crop beta diversity measures identified in this study and the above outcomes. Findings could provide important insight into the stability and security of food systems between Mexico and the United States.
Finally, better understanding of farm-level crop species diversity across Mexico is needed. While this paper focused on crop species diversity over large temporal and spatial scales, future research into the drivers of yearly changes at smaller scales is crucial; measures of crop diversity can simultaneously increase and decrease depending on taxonomic level, the spatial scale of analysis, levels of data aggregation, and measurement techniques [9]. Therefore, the state-, regional-, and national-level findings of this study do not necessarily reflect individual, farm-level diversification patterns or processes in Mexico (also see LaFevor and Pitts, 2022).

5. Conclusions

This study has three significant findings that contribute to broader understandings of global crop diversification patterns and trends. First, crop species production diversity in Mexico generally increased from 1980 to 2019 at state, regional, and national levels. Second, diversity was highest among irrigated croplands in the North and North Central regions, though irrigated crop diversity tended to be higher than rainfed crop diversity in all regions. Third, crop diversity increased dramatically after implementation of the North American Free Trade Agreement in 1994, especially among fruits, spices and herbs, ornamentals, and vegetable species. Importantly, however, crop diversification followed a boom in produce exports to the United States that was associated with unsustainable irrigation practices.
While crop diversification is typically associated with contributing to sustainable outcomes—enhancing agroecosystem resilience, food system security, and ecosystem services—this study cautions that such associations are highly context-dependent. Ultimately, better understanding of the drivers and impacts of crop species functional diversity at different temporal and spatial scales is needed to assess contributions to sustainability.

Funding

This research received no external funding.

Institutional Review Board Statement

Not applicable.

Informed Consent Statement

Not applicable.

Data Availability Statement

All data used in this study are publicly available.

Acknowledgments

Sandra Nashif provided helpful comments on a draft of this paper.

Conflicts of Interest

The author declares no conflict of interest.

References

  1. JJones, S.K.; Sánchez, A.C.; Juventia, S.D.; Estrada-Carmona, N. A Global Database of Diversified Farming Effects on Biodiversity and Yield. Sci. Data 2021, 8, 212. [Google Scholar] [CrossRef] [PubMed]
  2. Stefan, L.; Hartmann, M.; Engbersen, N.; Six, J.; Schöb, C. Positive Effects of Crop Diversity on Productivity Driven by Changes in Soil Microbial Composition. Front. Microbiol. 2021, 12, 808. [Google Scholar] [CrossRef] [PubMed]
  3. dos Santos, D.; Joner, F.; Shipley, B.; Teleginski, M.; Lucas, R.R.; Siddique, I. Crop Functional Diversity Drives Multiple Ecosystem Functions during Early Agroforestry Succession. J. Appl. Ecol. 2021, 58, 1718–1727. [Google Scholar] [CrossRef]
  4. Renard, D.; Tilman, D. National Food Production Stabilized by Crop Diversity. Nature 2019, 571, 257–260. [Google Scholar] [CrossRef] [PubMed]
  5. Louhichi, K.; Ciaian, P.; Espinosa, M.; Colen, L.; Perni, A.; Paloma, S.G. Does the Crop Diversification Measure Impact EU Farmers’ Decisions? An Assessment Using an Individual Farm Model for CAP Analysis (IFM-CAP). Land Use Policy 2017, 66, 250–264. [Google Scholar] [CrossRef]
  6. Fenzi, M.; Bonneuil, C. From “Genetic Resources” to “Ecosystems Services”: A Century of Science and Global Policies for Crop Diversity Conservation. Cult. Agric. Food Environ. 2016, 38, 72–83. [Google Scholar] [CrossRef]
  7. United Nations. United Nations Sustainable Development Goals 2015; United Nations: New York, NY, USA, 2015. [Google Scholar]
  8. Aguiar, S.; Texeira, M.; Garibaldi, L.A.; Jobbágy, E.G. Global Changes in Crop Diversity: Trade Rather than Production Enriches Supply. Glob. Food Secur. 2020, 26, 100385. [Google Scholar] [CrossRef]
  9. Khoury, C.K.; Brush, S.; Costich, D.E.; Curry, H.A.; de Haan, S.; Engels, J.M.M.; Guarino, L.; Hoban, S.; Mercer, K.L.; Miller, A.J.; et al. Crop Genetic Erosion: Understanding and Responding to Loss of Crop Diversity. New Phytol. 2022, 233, 84–118. [Google Scholar] [CrossRef]
  10. Hufnagel, J.; Reckling, M.; Ewert, F. Diverse Approaches to Crop Diversification in Agricultural Research. A Review. Agron. Sustain. Dev. 2020, 40, 14. [Google Scholar] [CrossRef]
  11. Khoury, C.K.; Bjorkman, A.D.; Dempewolf, H.; Ramirez-Villegas, J.; Guarino, L.; Jarvis, A.; Rieseberg, L.H.; Struik, P.C. Increasing Homogeneity in Global Food Supplies and the Implications for Food Security. Proc. Natl. Acad. Sci. USA 2014, 111, 4001–4006. [Google Scholar] [CrossRef] [Green Version]
  12. Hammer, K.; Khoshbakht, K. Towards a ‘Red List’ for Crop Plant Species. Genet. Resour. Crop Evol. 2005, 52, 249–265. [Google Scholar] [CrossRef]
  13. Martin, A.R.; Cadotte, M.W.; Isaac, M.E.; Milla, R.; Vile, D.; Violle, C. Regional and Global Shifts in Crop Diversity through the Anthropocene. PLoS ONE 2019, 14, e0209788. [Google Scholar] [CrossRef] [PubMed] [Green Version]
  14. Goslee, S.C. Drivers of Agricultural Diversity in the Contiguous United States. Front. Sustain. Food Syst. 2020, 4, 75. [Google Scholar] [CrossRef]
  15. Smith, J.C.; Ghosh, A.; Hijmans, R.J. Agricultural Intensification Was Associated with Crop Diversification in India (1947–2014). PLoS ONE 2019, 14, e0225555. [Google Scholar] [CrossRef] [PubMed] [Green Version]
  16. Van de Wouw, M.; Kik, C.; van Hintum, T.; van Treuren, R.; Visser, B. Genetic Erosion in Crops: Concept, Research Results and Challenges. Plant Genet. Res. 2010, 8, 1–15. [Google Scholar] [CrossRef] [Green Version]
  17. Beillouin, D.; Ben-Ari, T.; Malézieux, E.; Seufert, V.; Makowski, D. Positive but Variable Effects of Crop Diversification on Biodiversity and Ecosystem Services. Glob. Chang. Biol. 2021, 27, 4697–4710. [Google Scholar] [CrossRef]
  18. Aguilar, J.; Gramig, G.G.; Hendrickson, J.R.; Archer, D.W.; Forcella, F.; Liebig, M.A. Crop Species Diversity Changes in the United States: 1978–2012. PLoS ONE 2015, 10, e0136580. [Google Scholar] [CrossRef]
  19. Jackson, L.E.; Pascual, U.; Hodgkin, T. Utilizing and Conserving Agrobiodiversity in Agricultural Landscapes. Agric. Ecosyst. Environ. 2007, 121, 196–210. [Google Scholar] [CrossRef]
  20. Mendoza-Ponce, A.V.; Corona-Núñez, R.O.; Kraxner, F.; Estrada, F. Spatial Prioritization for Biodiversity Conservation in a Megadiverse Country. Anthropocene 2020, 32, 100267. [Google Scholar] [CrossRef]
  21. Llorente-Bousquets, J.; Ocegueda, S. Estado del conocimiento de la biota, en capital natural de México: Conocimiento actual de la biodiversidad. In Capital Natural de México; Conabio: Mexico City, Mexico, 2008; Volume 1, pp. 283–322. [Google Scholar]
  22. Vavilov, N.I.; Vavylov, M.I.; Vavílov, N.Í.; Dorofeev, V.F. Origin and Geography of Cultivated Plants; Cambridge University Press: Cambridge, UK, 1992; ISBN 978-0-521-40427-3. [Google Scholar]
  23. Harwood, J. ‘Whatever Happened to the Mexican Green Revolution?’. Agroecol. Sustain. Food Syst. 2020, 44, 1243–1252. [Google Scholar] [CrossRef]
  24. Mastretta-Yanes, A.; Acevedo Gasman, F.; Burgeff, C.; Cano Ramírez, M.; Piñero, D.; Sarukhán, J. An Initiative for the Study and Use of Genetic Diversity of Domesticated Plants and Their Wild Relatives. Front. Plant Sci. 2018, 9, 209. [Google Scholar] [CrossRef] [PubMed] [Green Version]
  25. LaFevor, M.C.; Ponette-González, A.G.; Larson, R.; Mungai, L.M. Spatial Targeting of Agricultural Support Measures: Indicator-Based Assessment of Coverages and Leakages. Land 2021, 10, 740. [Google Scholar] [CrossRef]
  26. Guzzon, F.; Arandia Rios, L.W.; Caviedes Cepeda, G.M.; Céspedes Polo, M.; Chavez Cabrera, A.; Muriel Figueroa, J.; Medina Hoyos, A.E.; Jara Calvo, T.W.; Molnar, T.L.; Narro León, L.A.; et al. Conservation and Use of Latin American Maize Diversity: Pillar of Nutrition Security and Cultural Heritage of Humanity. Agronomy 2021, 11, 172. [Google Scholar] [CrossRef]
  27. Fenzi, M.; Rogé, P.; Cruz-Estrada, A.; Tuxill, J.; Jarvis, D. Community Seed Network in an Era of Climate Change: Dynamics of Maize Diversity in Yucatán, Mexico. Agric Hum Values 2021, 39, 339–356. [Google Scholar] [CrossRef]
  28. Orozco-Ramírez, Q.; Perales, H.; Hijmans, R.J. Geographical Distribution and Diversity of Maize (Zea Mays L. Subsp. Mays) Races in Mexico. Genet. Resour. Crop Evol. 2017, 64, 855–865. [Google Scholar] [CrossRef]
  29. Hartman, S.; Chiarelli, D.D.; Rulli, M.C.; D’Odorico, P. A Growing Produce Bubble: United States Produce Tied to Mexico’s Unsustainable Agricultural Water Use. Environ. Res. Lett. 2021, 16, 105008. [Google Scholar] [CrossRef]
  30. Arreguín-Cortés, F.I.; López-Pérez, M.; Cervantes-Jaimes, C.E. Los retos del agua en México/Water challenges in Mexico. Tecnol. Cienc. Agua 2020, 11, 341–371. [Google Scholar] [CrossRef]
  31. DOF. Programa Nacional Hidrico, 2020–2024; Diario Oficial de la Federación (DOF): Mexico City, Mexico, 2020. [Google Scholar]
  32. Arreguín-Cortes, F.I.A.; Villanueva, N.H.G.; Casillas, A.G.; Gonzalez, J.A.G. Reforms in the Administration of Irrigation Systems: Mexican Experiences. Irrig. Drain. 2019, 68, 6–19. [Google Scholar] [CrossRef]
  33. CONAGUA. Estadísticas de Agua en México, Edición 2018; Comisión Nacional de Agua: Mexico City, Mexico, 2018. [Google Scholar]
  34. SIAP. Anuario Estadístico de La Producción Agrícola. Available online: https://nube.siap.gob.mx/cierreagricola/ (accessed on 8 May 2022).
  35. SIAP Catálogos | AGRICULTURA. Available online: http://www.agricultura.gob.mx/siap/catalogos (accessed on 8 May 2022).
  36. FAO. World Programme for the Census of Agriculture 2020; FAO Statistical Development Series; Food and Agriculture Organization of the United Nations: Rome, Italy, 2015; Volume 1, ISBN 978-92-5-108865-4. [Google Scholar]
  37. Merlos, F.A.; Hijmans, R.J. The Scale Dependency of Spatial Crop Species Diversity and Its Relation to Temporal Diversity. Proc. Natl. Acad. Sci. USA 2020, 117, 26176–26182. [Google Scholar] [CrossRef]
  38. Alon, M.; Sternberg, M. Effects of Extreme Drought on Primary Production, Species Composition and Species Diversity of a Mediterranean Annual Plant Community. J. Veg. Sci. 2019, 30, 1045–1061. [Google Scholar] [CrossRef]
  39. Tuomisto, H. A Diversity of Beta Diversities: Straightening up a Concept Gone Awry. Part 1. Defining Beta Diversity as a Function of Alpha and Gamma Diversity. Ecography 2010, 33, 2–22. [Google Scholar] [CrossRef]
  40. Jost, L. Entropy and Diversity. Oikos 2006, 113, 363–375. [Google Scholar] [CrossRef]
  41. Whittaker, R.H. Evolution and Measurement of Species Diversity. TAXON 1972, 21, 213–251. [Google Scholar] [CrossRef] [Green Version]
  42. BOM. Reporte Sobre las Economías Regionales: Octubre–Diciembre 2021; Banco de México: Mexico City, Mexico, 2022; p. 70. [Google Scholar]
  43. Rogers, J.; Singh, A. Mexico’s Productivity Puzzle: What the State Economies Can Tell Us. Moody’s Anal. 2017, 25, 1–18. [Google Scholar]
  44. Mariani, R.O.; Cadotte, M.W.; Isaac, M.E.; Vile, D.; Violle, C.; Martin, A.R. National-Scale Changes in Crop Diversity through the Anthropocene. Sci. Rep. 2021, 11, 20361. [Google Scholar] [CrossRef] [PubMed]
  45. Lazíková, J.; Bandlerová, A.; Rumanovská, Ľ.; Takáč, I.; Lazíková, Z. Crop Diversity and Common Agricultural Policy—The Case of Slovakia. Sustainability 2019, 11, 1416. [Google Scholar] [CrossRef] [Green Version]
  46. LaFevor, M.C.; Magliocca, N.R. Farmland Size, Chemical Fertilizers, and Irrigation Management Effects on Maize and Wheat Yield in Mexico. J. Land Use Sci. 2020, 15, 532–546. [Google Scholar] [CrossRef]
  47. Feliciano, D. A Review on the Contribution of Crop Diversification to Sustainable Development Goal 1 “No Poverty” in Different World Regions. Sustain. Dev. 2019, 27, 795–808. [Google Scholar] [CrossRef] [Green Version]
  48. Aheibam, M.; Singh, R.; Feroze, S.M.; Singh, N.U.; Singh, R.J.; Singh, A.K. Identifying the Determinants and Extent of Crop Diversification at Household Level: An Evidence from Ukhrul District, Manipur. Econ. Aff. 2017, 62, 89. [Google Scholar] [CrossRef]
  49. Liu, Z.; Tang, G.; Zhou, Y.; Sun, J.; Wu, W.; Yang, P. Why Can China Maintain a High Crop Diversity? A Spatial-Temporal Dynamic Analysis. Prog. Phys. Geogr. Earth Environ. 2021, 46, 030913332110558. [Google Scholar] [CrossRef]
  50. Headey, D.D.; Hoddinott, J. Agriculture, Nutrition and the Green Revolution in Bangladesh. Agric. Syst. 2016, 149, 122–131. [Google Scholar] [CrossRef]
  51. Weigel, R.; Koellner, T.; Poppenborg, P.; Bogner, C. Crop Diversity and Stability of Revenue on Farms in Central Europe: An Analysis of Big Data from a Comprehensive Agricultural Census in Bavaria. PLoS ONE 2018, 13, e0207454. [Google Scholar] [CrossRef] [PubMed]
  52. Mesfin, W.; Fufa, B.; Haji, J. Pattern, Trend and Determinants of Crop Diversification: Empirical Evidence from Smallholders in Eastern Ethiopia. J. Econ. Sustain. Dev. 2011, 2, 78–89. [Google Scholar]
  53. LaFevor, M.C.; Pitts, A.K. Irrigation Increases Crop Species Diversity in Low-Diversity Farm Regions of Mexico. Agriculture 2022, 12, 911. [Google Scholar] [CrossRef]
  54. Bowness, J. Perspectivas Locales~NAFTA in Southern Mexico: An Economic Godsend or Curse? Carlet. Rev. Int. Aff. 2018, 5, 1–18. [Google Scholar] [CrossRef]
  55. Browning, A. Corn, Tomatoes, and a Dead Dog. Mex. Stud. Estud. Mex. 2013, 29, 85–119. [Google Scholar] [CrossRef]
  56. Keleman, A. Institutional Support and in Situ Conservation in Mexico: Biases against Small-Scale Maize Farmers in Post-NAFTA Agricultural Policy. Agric. Hum. Values 2010, 27, 13–28. [Google Scholar] [CrossRef] [Green Version]
  57. Baylis, K.; Garduño-Rivera, R.; Piras, G. The Distributional Effects of NAFTA in Mexico: Evidence from a Panel of Municipalities. Reg. Sci. Urban Econ. 2012, 42, 286–302. [Google Scholar] [CrossRef] [Green Version]
  58. Zahniser, S. U.S.–Mexico Agricultural Trade during the NAFTA Era; Giannini Foundation: Sacramento, CA, USA, 2006. [Google Scholar]
  59. Aguilera, G.; Roslin, T.; Miller, K.; Tamburini, G.; Birkhofer, K.; Caballero-Lopez, B.; Lindström, S.A.-M.; Öckinger, E.; Rundlöf, M.; Rusch, A.; et al. Crop Diversity Benefits Carabid and Pollinator Communities in Landscapes with Semi-Natural Habitats. J. Appl. Ecol. 2020, 57, 2170–2179. [Google Scholar] [CrossRef]
  60. Aizen, M.A.; Aguiar, S.; Biesmeijer, J.C.; Garibaldi, L.A.; Inouye, D.W.; Jung, C.; Martins, D.J.; Medel, R.; Morales, C.L.; Ngo, H.; et al. Global Agricultural Productivity Is Threatened by Increasing Pollinator Dependence without a Parallel Increase in Crop Diversification. Glob. Chang. Biol. 2019, 25, 3516–3527. [Google Scholar] [CrossRef] [Green Version]
  61. Perilla, G.A.; Mas, J.-F. High-Resolution Mapping of Protected Agriculture in Mexico, through Remote Sensing Data Cloud Geoprocessing. Eur. J. Remote Sens. 2019, 52, 532–541. [Google Scholar] [CrossRef] [Green Version]
  62. LaFevor, M.C.; Frake, A.N.; Couturier, S. Targeting Irrigation Expansion to Address Sustainable Development Objectives: A Regional Farm Typology Approach. Water 2021, 13, 2393. [Google Scholar] [CrossRef]
  63. Gupta, S.; Sunder, N.; Pingali, P.L. Market Access, Production Diversity, and Diet Diversity: Evidence from India. Food Nutr. Bull. 2020, 41, 167–185. [Google Scholar] [CrossRef] [PubMed]
  64. Mango, N.; Makate, C.; Mapemba, L.; Sopo, M. The Role of Crop Diversification in Improving Household Food Security in Central Malawi. Agric. Food Secur. 2018, 7, 7. [Google Scholar] [CrossRef]
  65. Remans, R.; Wood, S.A.; Saha, N.; Anderman, T.L.; DeFries, R.S. Measuring Nutritional Diversity of National Food Supplies. Glob. Food Secur. 2014, 3, 174–182. [Google Scholar] [CrossRef]
  66. Galeana-Pizaña, J.M.; Couturier, S.; Figueroa, D.; Jiménez, A.D. Is Rural Food Security Primarily Associated with Smallholder Agriculture or with Commercial Agriculture? An Approach to the Case of Mexico Using Structural Equation Modeling. Agric. Syst. 2021, 190, 103091. [Google Scholar] [CrossRef]
  67. Baca, A.S. The Food Consumption Pattern of the Free Market: The Mexican Experience Under NAFTA. Agrar. S. J. Political Econ. 2019, 8, 258–286. [Google Scholar] [CrossRef]
  68. Egli, L.; Mehrabi, Z.; Seppelt, R. More Farms, Less Specialized Landscapes, and Higher Crop Diversity Stabilize Food Supplies. Environ. Res. Lett. 2021, 16, 055015. [Google Scholar] [CrossRef]
  69. Gaudin, A.C.M.; Tolhurst, T.N.; Ker, A.P.; Janovicek, K.; Tortora, C.; Martin, R.C.; Deen, W. Increasing Crop Diversity Mitigates Weather Variations and Improves Yield Stability. PLoS ONE 2015, 10, e0113261. [Google Scholar] [CrossRef] [Green Version]
  70. Mehrabi, Z.; Ramankutty, N. Synchronized Failure of Global Crop Production. Nat. Ecol. Evol. 2019, 3, 780–786. [Google Scholar] [CrossRef] [Green Version]
  71. Cao, K.; Mi, X.; Zhang, L.; Ren, H.; Yu, M.; Chen, J.; Zhang, J.; Ma, K. Examining Residual Spatial Correlation in Variation Partitioning of Beta Diversity in a Subtropical Forest. J. Plant Ecol. 2019, 12, 636–644. [Google Scholar] [CrossRef]
  72. Socolar, J.B.; Gilroy, J.J.; Kunin, W.E.; Edwards, D.P. How Should Beta-Diversity Inform Biodiversity Conservation? Trends Ecol. Evol. 2016, 31, 67–80. [Google Scholar] [CrossRef] [PubMed] [Green Version]
  73. Barton, P.S.; Cunningham, S.A.; Manning, A.D.; Gibb, H.; Lindenmayer, D.B.; Didham, R.K. The Spatial Scaling of Beta Diversity: Spatial Scaling of Beta Diversity. Glob. Ecol. Biogeogr. 2013, 22, 639–647. [Google Scholar] [CrossRef] [Green Version]
Figure 1. Rainfed and irrigated cropland areas in Mexico for each crop group from 1980 to 2019. Smoother line fit with cubic spline (λ = 0.05). Dashed line marks implementation of the North American Free Trade Agreement (NAFTA) in 1994.
Agriculture 12 00985 g001
Figure 2. Number of rainfed and irrigated crop species (richness) for each crop group from 1980 to 2019. The arrow marks implementation of the North American Free Trade Agreement (NAFTA) in 1994.
Agriculture 12 00985 g002
Figure 3. Changes in effective gamma, alpha, and beta diversity (D) in Mexico during the study period. Gamma diversity expresses total national-level D; alpha diversity expresses mean state-level D; beta diversity expresses dissimilarity in D among states.
Agriculture 12 00985 g003
Figure 4. Heat chart of changes in effective crop species diversity (D) from 1980 to 2019 by states and regions of Mexico, stratified by rainfed, irrigated, and all crops.
Agriculture 12 00985 g004
Figure 5. States and regions of Mexico.
Agriculture 12 00985 g005
Figure 6. Changes in regional-level effective crop species diversity (D) among rainfed crops, irrigated crops, and all crops. Here, gamma diversity expresses total D in each region (North, North Central, Center, South), and beta diversity expresses dissimilarity in D among the states in each region. The dashed line marks implementation of the North American Free Trade Agreement (NAFTA) in 1994.
Agriculture 12 00985 g006
Publisher’s Note: MDPI stays neutral with regard to jurisdictional claims in published maps and institutional affiliations.

