Article

Friability of Maize Shoot (Zea mays L.) in Relation to Cell Wall Composition and Physical Properties

1
UR1268 BIA, INRAE, 44316 Nantes, France
2
Limagrain Europe SAS, 36360 Saint-Beauzire, France
3
IATE, University of Montpellier, INRAE, L’institut Agro, Pl. Pierre Viala, 34060 Montpellier, France
*
Author to whom correspondence should be addressed.
Agriculture 2022, 12(7), 951; https://doi.org/10.3390/agriculture12070951
Submission received: 3 June 2022 / Revised: 20 June 2022 / Accepted: 24 June 2022 / Published: 30 June 2022
(This article belongs to the Section Seed Science and Technology)

Abstract

:
Maize (Zea mays L.) is widely cultivated worldwide for food, feed, and fuel uses. Maize forage has become a valuable feed material, and there is much interest in characterizing its friability, as friability may shape feed value through its effect on ingestibility. The objective of this study was to characterize the friability of maize forage based on its milling behavior within a collection of inbred lines of maize. We proposed two friability indexes—Particle Size Reduction (PSR) and Energy Index—and evaluated their ability to discriminate 24 inbred maize lines differing in digestibility. Both the PSR Index and Energy Index effectively highlighted the variability in friability, which could vary by a factor of two regardless of index. These two friability indexes are based on two different milling technologies and therefore on different mechanical stresses inside the mills that could both inform on friability, but on different scales. In order to interpret the observed differences, we characterized the biomass at different scales, from phenotypic observation of the shoot to physical properties of the chopped maize, down to cell wall amount and composition. The friability assessed through these two indexes was mainly inter-correlated: the lower the milling energy, the more friable the fine particles produced. However, we also identified slight differences between the indexes that could be interpreted in relation to structural scale: while the Energy Index primarily informed friability at the cellular scale, the PSR Index also informed friability at the cell wall scale. This study provided key insight into the friability of maize forage and its relation to physical and fiber properties.

1. Introduction

Maize (Zea mays L.) is one of the most widely cultivated and economically important crops in the world based on biomass yields. The grain is used for human food and animal feed while the stem and leaves are used as feedstocks for biofuel or biogas. When used as animal feed, the whole plant is ensilaged [1,2] and forms the bulk of the diet given to dairy cows over the winter period. Its success is due to, among other things, the fact that it is easy to grow and store and delivers a high energy content that livestock can readily ingest, thus conferring it a high feed value [3,4]. Currently, the forage quality of most maize hybrids is still stagnant or lower than in the 1970s–80s as most breeding programs have focused on increasing grain yield and agronomic attributes (such as stalk lodging resistance) [4,5,6,7,8].
The feed value of a forage is a function of three factors: digestibility, ingestibility, and palatability. Today’s animal husbandry systems rarely give livestock a choice of forages, so the palatability factor has been far less studied. Ingestibility is defined as the quantity of forage voluntarily ingested in the absence of choice. Digestibility is defined as the fraction of feed assimilated by the animal. Research has invested much effort into improving digestibility by forage selection [4,5,6,9,10], but most nutrition scientists consider ingestibility more limiting than digestibility for ruminant performance [11]. Variation in feed intake is thought to account for 70% of the variation in animal production response, while digestibility is thought to account for only 20% [12].
Ingestibility is primarily a function of the animal (e.g., its age, breed, teeth, and health status) but it also depends on the characteristics of the forage. The amount of forage ingested is limited by rumen size and residence time in the rumen, where the feed particles remain until they reach a size of 1 to 4 mm depending on species (cattle versus sheep) [13,14,15]. Residence time in the rumen depends on the time required for the food particles to degrade and pass from the rumen into the digestive tract [16,17]. Ingestibility is also related to the forage’s resistance to breakage and depends on the amount of chewing during intake and rumination [4]. It is therefore governed both by the action of microorganisms (and thus related to the forage digestibility) and by mechanical action in the rumen. One way to increase the ingestibility of a forage is to decrease the volume of the feed (i.e., by increasing its bulk density), which will increase the amount of feed ingested before reaching satiety [18]. Ingestibility is, by definition, measured in vivo by measuring voluntary intake, but research has attempted to find predictors or in vitro measurements that would facilitate breeding programs. Specific attention was paid to the number of fibers determined by their differential solubility in solvents according to the van Soest sequential procedure, providing the amounts of Neutral Detergent Fiber (NDF) and Acid Detergent Fiber (ADF). A lower amount of NDF in a forage was shown to correlate with a higher voluntary intake and used to predict voluntary intake in laboratory forage-testing systems [19]. However, selective plant breeding to reduce NDF concentration has a negative impact on field performance (yield) [5,20,21]. A forage with a faster particle-size breakdown in the rumen would increase rumen particle removal, thereby reducing the time required to drain the rumen [18]. This idea led to efforts to characterize forages in terms of friability, which describes how readily a solid substance will break into smaller pieces under duress or contact. This trait, determined on a large range of forages, was found to correlate to voluntary intake by ruminants [22,23,24].
Different methods of measuring this forage trait have been proposed, using either mechanical tests or more mimetic approaches based on particle size-reduction studies. However, mechanical tests, such as those carried out on maize, make it difficult to consider the heterogeneity of the forage, and often only one organ (stem or leaf) is selected for testing [25,26]. Consequently, more global approaches using artificial mouth development [22] or milling behavior were preferred [23,27]. Friability was evaluated through two main approaches. The first approach measured the size of particles obtained under a constant mechanical strain [22,27], leading to the definition of a Particle Size Reduction Index, where friability is related to the ability to produce fine particles. The second approach was based on measurement of the energy necessary to grind a unit of weight of forage [23], where friability is high when milling energy is low.
Previous literature has discovered differences in forage friability within a multi-forage sample when using each index separately. For example, switchgrass is difficult to mill while corn stover is easy to mill [28,29]. The differences in organ structure and the presence of specific tissue inside the stem (maize stem contains pith whereas switchgrass does not) were thought to be important factors [29]. Differences in friability were observed according to plant maturity [23] but also according to plant–organ proportion, often only leaves were analyzed, because leaves have higher nutritional value than stems [30,31]. Chundawat et al. (2007) suggested that the leaves shred into the smallest particles during milling [32]. Forage composition, particularly cell wall amount (calculated based on NDF concentration), was shown to limit friability [28,33]. Studies have primarily focused on plant cell wall composition, as the cell wall is the key structural support shaping the mechanical properties of plants, particularly in stems. Aside from forage characteristics, particle size obtained after milling and milling energy are known to be dependent upon the milling technologies used [34]. The interactions between the predominant mode of mechanical stress inside the grinder, comminution ratio, and plant structure must all be considered to properly measure friability [35].
The objective of this study was to estimate the friability of a collection of inbred lines of forage maize based on their milling behavior. Based on the studies previously described and considering the influence of milling technologies and procedures, two friability indexes were selected and compared with respect to their ability to differentiate inbred maize lines. Specific attention was paid to each experimental procedure (milling mode, comminution ratio, and input particle size distribution) in relation to the different scales of plant structure to properly interpret the friability indexes. The inbred maize lines were selected based on their digestibility, which is considered a marker of variability in biomass at different scales. The inbred maize lines were then characterized from organ down to cell-wall scale by measuring phenotypic trait and organ proportion, bulk density and input granulometry, amount of cell wall, and cell wall composition (based on fiber analyses) (Figure 1).

2. Materials and Methods

2.1. Plant Material

Twenty-four inbred lines of maize were selected to cover a large gradient of digestibility. The inbred lines were grown in Arras (France) in 2018 and 2019. At silage stage, all the ears were separated from the plant and discarded. Stem length, diameter of the internode under the ear, and stem proportion were measured on 10 maize plants of each inbred line specifically harvested for this purpose. The remaining plants were harvested, chopped with a forage harvester to yield heterogeneous-sized plant pieces (most measuring about 2–3 cm but a few of them measuring more than 10 cm), and dried at 70 °C for 72 h. In total, around 1–3 kg of dry matter was recovered for each line. Plant dry matter content was around 29%, attesting to the harvest at silage stage [36].

2.2. Chemical Analysis and Digestibility Estimates

Chopped maize samples were first milled with a knife mill using a 1 mm screen selector. Neutral Detergent Fiber (NDF), Acid Detergent Fiber (ADF) and Acid Detergent Lignin (ADL) were determined according to the Van Soest method [37]. Dry matter digestibility (dCellDM) was obtained by the method of Aufrère and Michalet-Doreau [38]. Digestibility of the NDF (dNDF) was measured after 48 h in rumen juice and ratioed to the NDF determined by the Van Soest method. NDF is interpreted as amount of cell walls, ADF as amount of cellulose and lignin, and ADL as proportion of lignins. The amount of hemicellulose in the cell walls was calculated as:
(NDF(% dm) − ADF(% dm))/NDF(% dm)
Amount of cellulose in the cell walls was calculated as:
(ADF(% dm) − ADL(% dm))/NDF(% dm)
All these measurements were done in simple.

2.3. Bulk Density

The bulk density of the chopped maize was measured by weighing a known volume of sample as proposed by Mani et al. [29]. The beaker used was sized to hold a large amount of sample in order to capture the widely heterogeneous samples, including large pieces of plant fragments. The sample was overfilled into the beaker, gently levelled off with a plastic ruler, and weighed. The bulk density was defined as weight per unit of volume. Each measurement was repeated five times for the same sample, and the average relative standard deviation was 4% (maximum 9%).

2.4. Color and Particle Size Analysis of Chopped Maize at Macroscopic Scale

Because of the heterogeneity of the samples that featured large pieces of leaf and stem of different sizes and with different colors, the chopped maize samples were characterized by macrovision [39]. To quantify the size heterogeneity of the samples, the particle size distribution of bulk samples was measured by gray level mathematical morphology [7,8,40]. We also measured a color indicator on chopped samples to establish a relationship with the stem/leaf proportion. We posited that the color provides information on organ proportion, i.e., a greener chopped sample signals a leafier inbred line.

2.4.1. Sampling and Image Acquisition

A sampling plan was arranged to account for the heterogeneity of the samples. Chopped maize shoots from each inbred line were first divided between four trays using a Quartermaster particle separator (Global Gilson, Lewis Center, OH, USA). Four images per tray were acquired in a smaller tray built specifically to present these samples, resulting in 16 images for each inbred line. Images were acquired using a INRAE-designed macrovision system prototype called the LightBox (UR BIA, Nantes, France) to illuminate samples with diffuse light in a reproducible way [39]. This prototype is composed of a 37.5 cm-diameter, 40 cm-long half-cylinder whose walls are made of white matt expanded PVC granules to diffuse the light. The lighting is obtained by LED ribbons (3014–180 LED strip of 8.6 lm/led) placed on the base on each side of the box. The sample is placed in the center via a drawer that closes the box. The box is open at the top to position a camera. The tri-CCD camera (HV-F202GV, Hitachi Kokusai Electric Inc., distributed by Alliance Vision, France) and lens are placed on a stand (Kaiser Fototechnik GmbH & Co. KG, Buchen, Germany). The size of the color image is 1600 × 1200 pixels, and gray level intensities in each RGB canal are coded in 256 gray levels. The field of view was set to 112.9 × 150.5 mm2, resulting in a pixel size of 94 µm in the image.

2.4.2. Particle Size Analysis by Gray Level Mathematical Morphology

Particle size distribution was obtained by gray level granulometry analysis of the images as described in Devaux et al. (2008) and Devaux and Legland (2014) [39,40]. The analysis consists of applying a transformation of the image through a mask of known geometry, called a structuring element, with a reference pixel. The size and shape of structuring element are chosen according to the characteristics of the image. The structuring element is moved in the image so that the reference pixel passes through all positions in the image. Among the basic transformations, opening and closing have the effect of eliminating bright and dark objects that are smaller than the structuring element while preserving the size of larger objects. Opening and closing can be compared to sieving the objects in the image.
A size distribution is obtained by applying transformations (opening or closing) of increasing size and summing the gray levels after each operation. After an opening, the sum of gray levels decreases, and this decrease depends on the number of objects removed. A granulometric curve is graphed to plot the percentage decrease in the sum of gray levels as a function of the size of the openings.
We used the red channel of the RGB images as it showed greatest intensity for all the particles. Particles appeared as bright objects in the images. Openings were applied to the objects that appeared brighter than their outline. Particle size analysis was performed first with a horizontal structuring element and was followed by a second particle size analysis with a vertical structuring element. The results of the two analyses were compiled to measure all the objects, whatever their orientation. Size of the structuring elements varied from two pixels (188 µm) to 755 pixels (70,970 µm). The granulometric curves were converted into logarithmic scale to better highlight the occurrence of small and large objects in the images. A mean particle size was computed from the granulometric curves, as described by Devaux and Legland [40], and called gray level mean size. Principal component analysis was run on the entire set of granulometric curves (see Section 2.7).

2.4.3. Color Analysis

To explore hue variations, RGB images were converted to HSV (hue, saturation, value) using the Matlab function rgb2hsv. Hue values were coded from 0 to 1 and correspond to the position of the color on a color wheel. As hue increased from 0 to 1, the color changed from red to orange, yellow, green, cyan, blue, magenta, and back to red.
Variations in hue were examined by computing histograms with a step value of 0.0039, which represents the number of pixels observed for each hue value. The size of the images being the same, the number of pixels was equal in each image, which allowed us to compare the histograms. Principal component analysis was run on the entire set of histograms (see Section 2.7).

2.5. Energy Index

Friability was assessed by measuring the Energy Index, as portrayed in Figure 1. The moisture content of all the chopped maize samples was controlled before milling. Moisture content was determined by gravimetric measurement at 105 °C over 24 h then standardized to 6–7% by drying at 60 °C for 30 min if necessary. Then 200 g of chopped maize shoot was ground in a knife mill (model SM100, Retsch, Eragny sur Oise, France) equipped with a 1 mm screen selector operated at a rotor speed of 1500 rpm. The knife mill was fed at a constant rate of about 1.2 kg.h−1 using a vibrating dosing device (VL111, Sinex, St Yrieix sur Charente, France). Milling energy was deduced from the electric power consumed during milling, and measured according to time with a wattmeter (model PAC20200, Siemens). No-load power was measured before and after milling the sample for 5 min. No-load power served as a baseline from which the increase of energy due to milling could be measured. The specific milling energy (SME) was then deduced via the following equation:
S M E = 1 m t 0 t e P P 0 b · d t
where SME is specific milling energy (kJ.kg−1), P is electric power (W), P0b is no-load power measured before milling (W), t0 is milling start time (s), te is milling end time (s), and m is sample weight (kg).
In some experiments, we observed an increase in no-load power of between 8 and 39%, which may be explained by clogging of the chamber and/or an increase in mill temperature. When the increase was higher than 8%, the specific energy was corrected by subtracting half of the energy related to this change from baseline.
The particle size distribution of milled maize shoots was obtained by sieving 25 g of ground maize sample for 5 min by rotary motion on a sieving column (Rotex, Villeneuve la Garenne, France) equipped with five sieves (0.8 mm, 0.56 mm, 0.45 mm, 0.315 mm, and 0.25 mm mesh-size sieves). The particle size distribution was deduced from the relative weight recovered on each sieve, which was measured two or three times. As proposed by Moiceanu et al. [41], we calculated a mean diameter, dm, using the following equation:
d m = Σ i p i l i 100 mm
where pi (%) is percent mass of ground material recovered on each sieve i, and li (mm) is average size of material collected on each sieve (with 0.8 for the biggest mesh-size sieve).
For each inbred maize line, the measurement of the Energy Index was repeated at least three times if there was a sufficient quantity of sample to do so.

2.6. Particle Size Reduction Index

Particle Size Reduction index was obtained after milling in an oscillatory ball mill (model MM400, Retsch, Eragny sur Oise France), as follows: About 200 g of chopped maize sample was pre-milled in a knife mill (model SM100, Retsch, Eragny sur Oise France) equipped with a 2-mm screen selector operated at a rotor speed of 1500 rpm (Figure 1). The relative weight of particles below 200 µm in this pre-milled sample was obtained by sieving. From this pre-milled sample, 1.8 g was subsampled, oven-dried at 60 °C to dry overnight, then ground using the oscillatory ball mill (model MM400, Retsch, Eragny sur Oise, France) for 30 s at a frequency of 20 Hz. The mill used two steel balls that weighed 13.8 g each and a third steel ball that weighed 32.5 g.
The milled samples were pushed through a 200-µm sieve by hand using a brush until only the largest particles were visible on the sieve. The particles were collected and weighed. The Particle Size Reduction index was defined as the difference between the initial amount of particles < 200 µm and the amount of particles < 200 µm obtained after ball milling. This measurement was repeated four times.

2.7. Data Analysis

Principal component analysis was performed on the color and particle size data within the MATLAB 2020a environment (Mathworks, Natick, MA, USA) using the statistics and machine learning toolbox. Hue histograms and granulometric curves were averaged for the four images acquired per sample (except on two samples, for which only two trays were obtained). Both data matrices were centered. Variance analysis was applied using the anovan function of Matlab 2020a (The MathWorks, Natick, MA, USA).
Correlations between variables and tests of significance were performed with XLSTAT (Addinsoft, 2016.1.1, Paris, France).

3. Results

3.1. Multi-Scale Characterization of the Inbred Maize Lines

The maize samples were purpose-selected to show variability in digestibility, which is a common key trait for forage selection [6] and may be related to friability [33]. The dry matter digestibility (dCellDM) of the 24 inbred lines of maize ranged from 48.0% to 60.8% of dry matter, in agreement with the literature (Table S1) [42]. This variability was assumed to stem from compositional or structural variability at different scales [43,44], which we investigated here for this maize collection.
The shoots were first characterized by stem-to-leaf ratio and stem diameter. Proportion of fresh stem ranged from 22.9% to 77.6%, with a mean value of 57.5% (Table S2). Stem diameter values indicated variability from 11 mm to 19 mm (Table S2), as also observed by Zhang et al. [45]. The shoots show variability in both stem morphology and stem-to-leaf ratio.

3.1.1. Characterization of Chopped Maize at Cell-Wall Scale

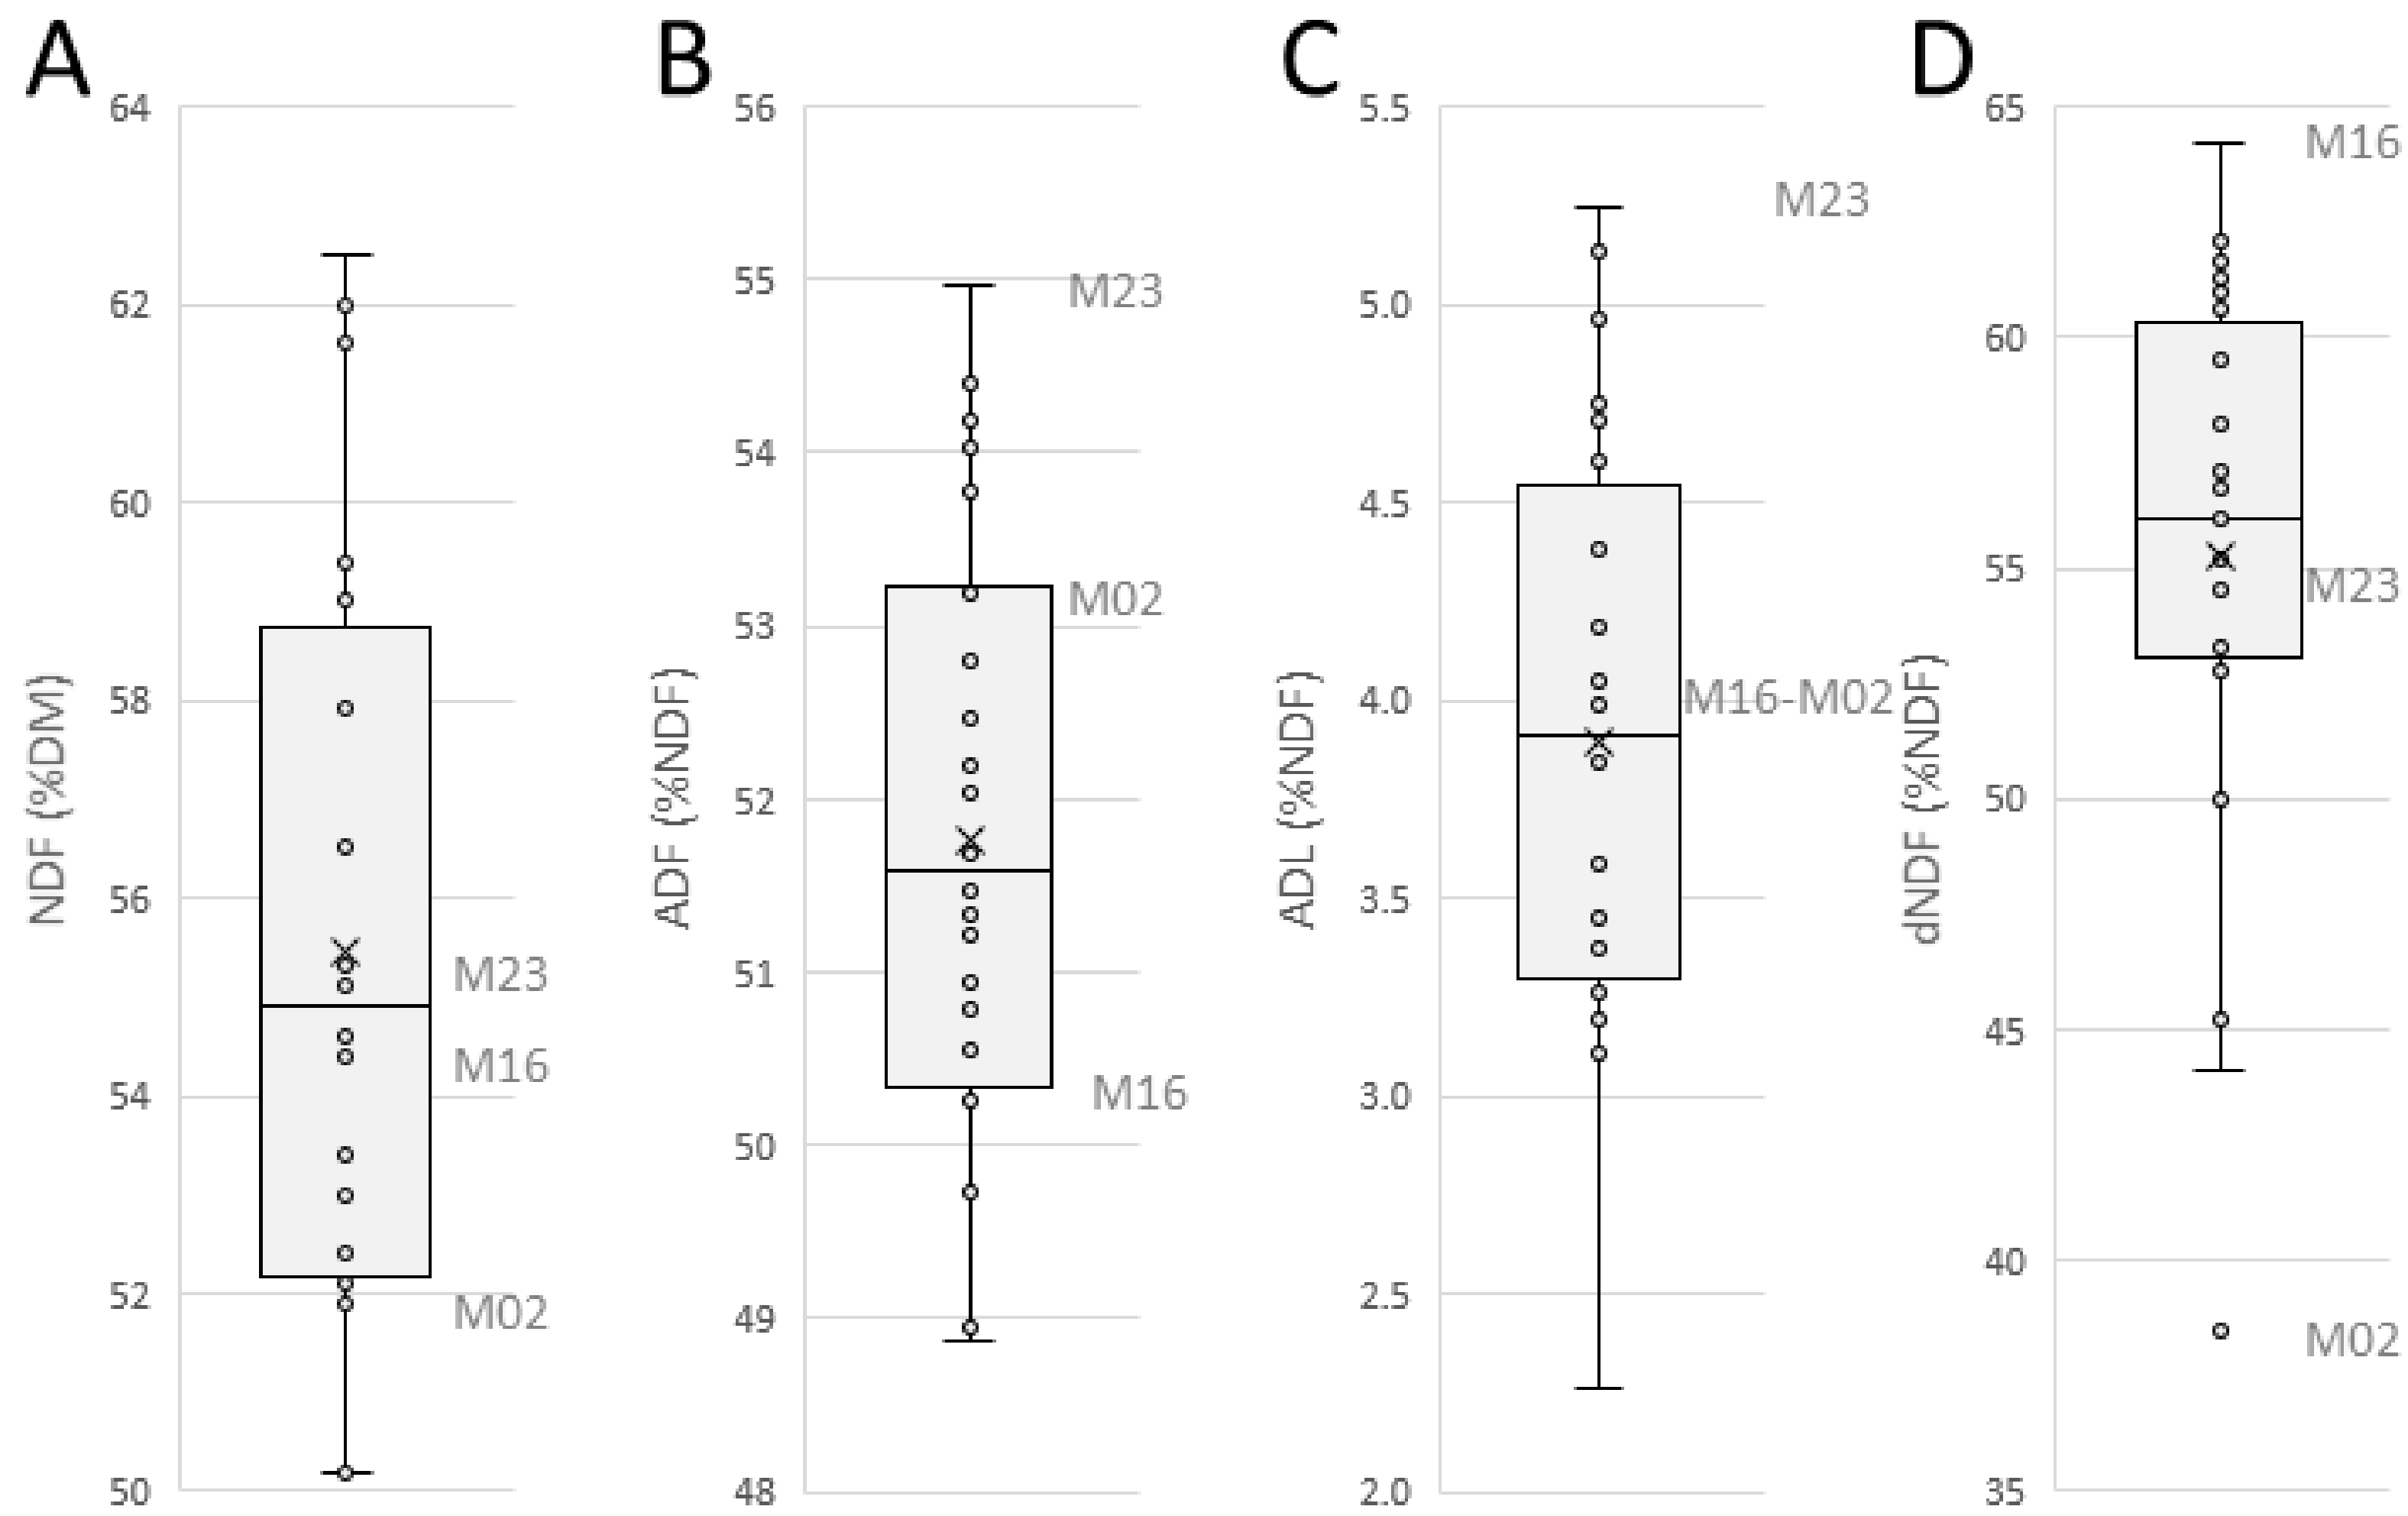
Shoots were analyzed for their amount of cell walls and cell-wall composition based on fiber analyses, performed using the Van Soest method [37]. Amounts of ADF and ADL were expressed according to the amount of NDF, which is interpreted as the amount of cell walls. The collection of samples demonstrated significant variations in NDF (50.2–62.5% of DM), ADF (48.9–55.0% of NDF), and ADL (2.3–5.2% of NDF) contents (Figure 2, Supplementary Table S1). These values were in the range reported for three populations of maize stover or whole-plant maize silage by Wolf et al. [46] and in the upper end but not at the extreme of the range reported for maize silage by Khan et al. [47]. We tested for a relationship between stem-to-leaf ratio and cell-wall composition, as a higher lignin content could indicate a higher proportion of stems in the sample, as stems are more lignin-dense than leaves [48], but no strong correlation was found.
Digestibility of the cell walls was estimated using the dNDF parameter and ranged from 38.5% to 64.2% NDF, in agreement with the variability reported in the literature [6]. No clear relationships were found between dNDF and amount and composition of NDF (Supplementary Table S1). M02, which was the least digestible line, was in the upper average for ADF content and in the midrange for lignin content (ADL) expressed as percentage of NDF. M16, which had a high dNDF value, was in the lower average for ADF content and had the same ADL content as M02. Finally, M23, which was in midrange for digestibility, showed very high ADF and lignin contents. This lack of correlation between NDF digestibility and NDF composition suggested that digestibility involved other factors. ADL, for example, excludes several phenolic compounds [49]. Although the samples were all ground following the same procedure, the final particle size may differ somewhat between the samples, which could influence digestibility.

3.1.2. Physical Properties of Chopped Maize at Macroscopic Scale

Inbred lines of maize chopped with a forage harvester had a particle size of around 2–3 cm, but included some larger pieces, and are called “chopped” samples in what follows. These coarse materials were characterized to quantify and evaluate particle size and color, in addition to bulk density, which was expected to vary according to the number of larger pieces in the samples. Bulk density varied from 55.7 to 89.2 kg.m−3 with a mean of 71.0 kg.m−3, in agreement with Sokhansanj et al. [50] on straw and corn stover (Supplementary Table S2).
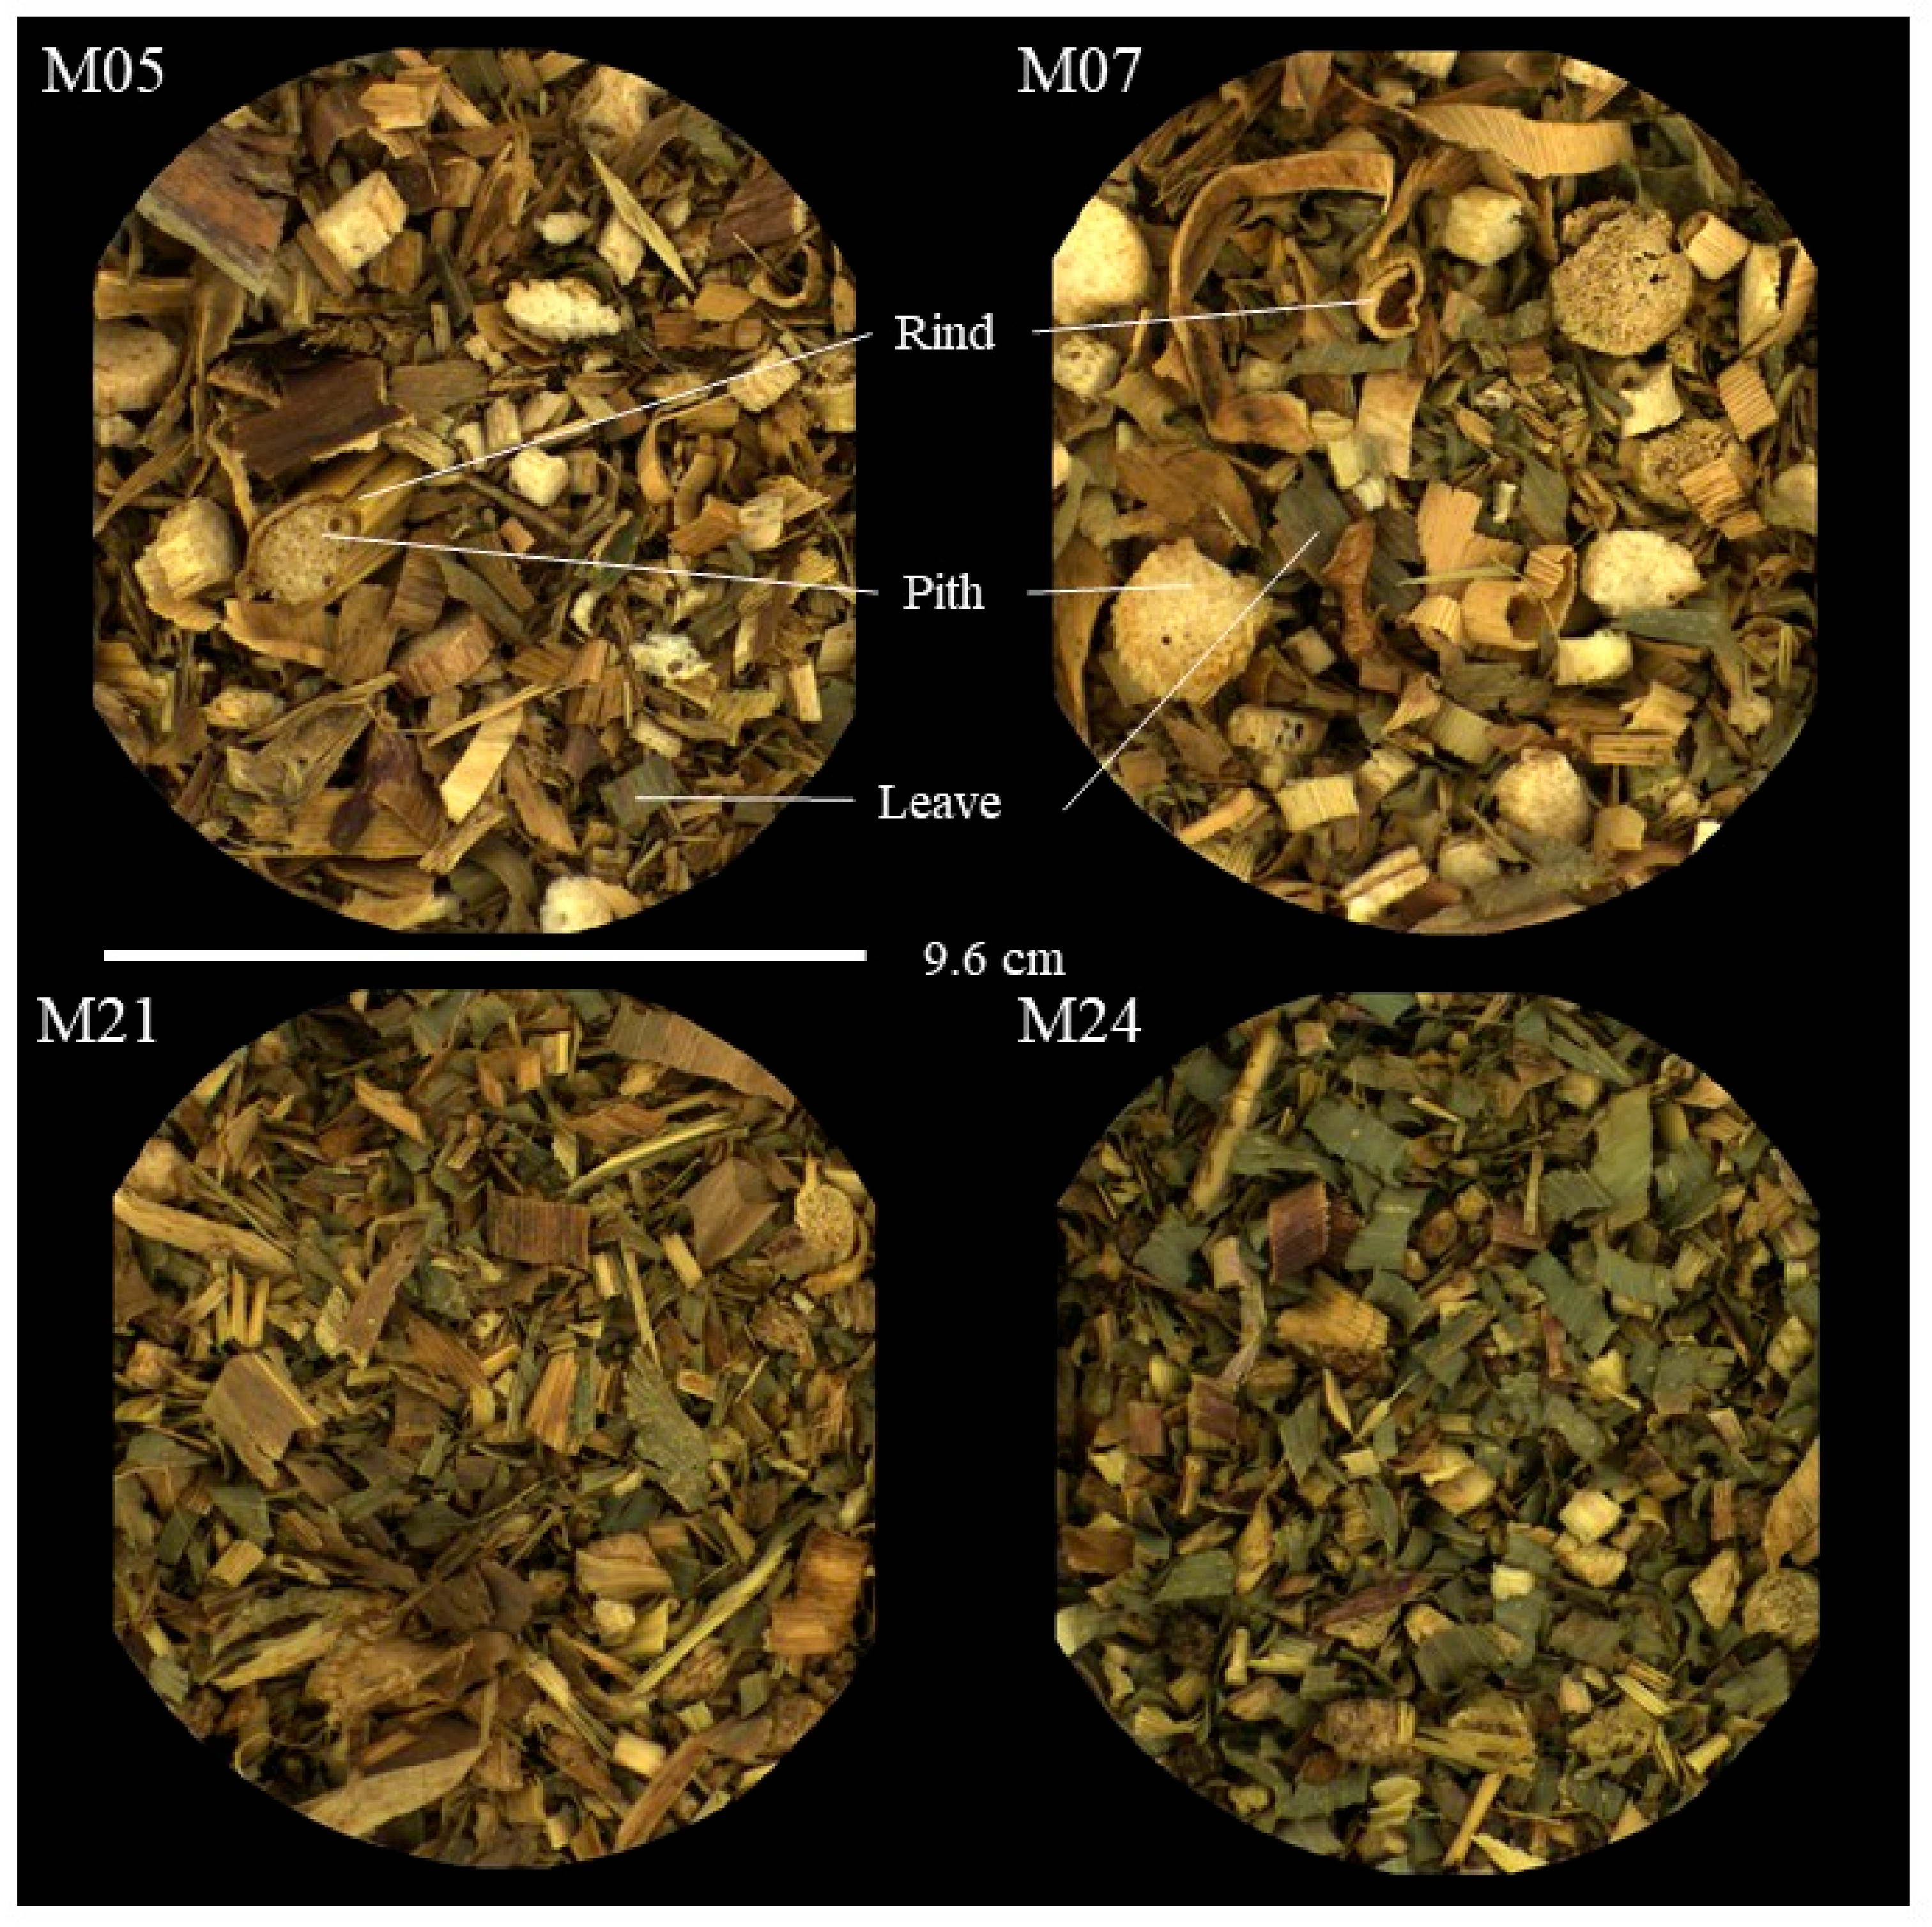
Particle size and color of the chopped maize samples were measured using image analysis. Figure 3 provides examples of the images obtained for four different samples to illustrate the most extreme cases. Coarse particles coming from the stems and leaves were easily identifiable (Figure 3), and the two main anatomical parts of the stem were also clearly distinguished. The round whitish particles were attributed to the pith, with pieces as large as 2 cm as observed in M07 (Figure 3) or smaller particles of around 0.8 cm as observed in M24 (Figure 3). The brownish/green elongated particles were attributed to the rind (Figure 3). Rind was still attached to the pith, like in M05, or else totally dissociated. Rind particles were thicker than leaf particles and had visible stripes. Leaf particles were sometimes found to wrap around themselves but less so than rind pieces, and they appeared to be cut into ‘flakes and sometimes torn near the vascular bundles, which did not give them a well-defined shape. Leaf pieces were mostly greener than stem pieces, but some leaves were yellowish depending on the genetics of the sample [4]. The fact that our samples had all reached a very similar level of maturity made it possible to assess these differences with respect to genetics and growth conditions.
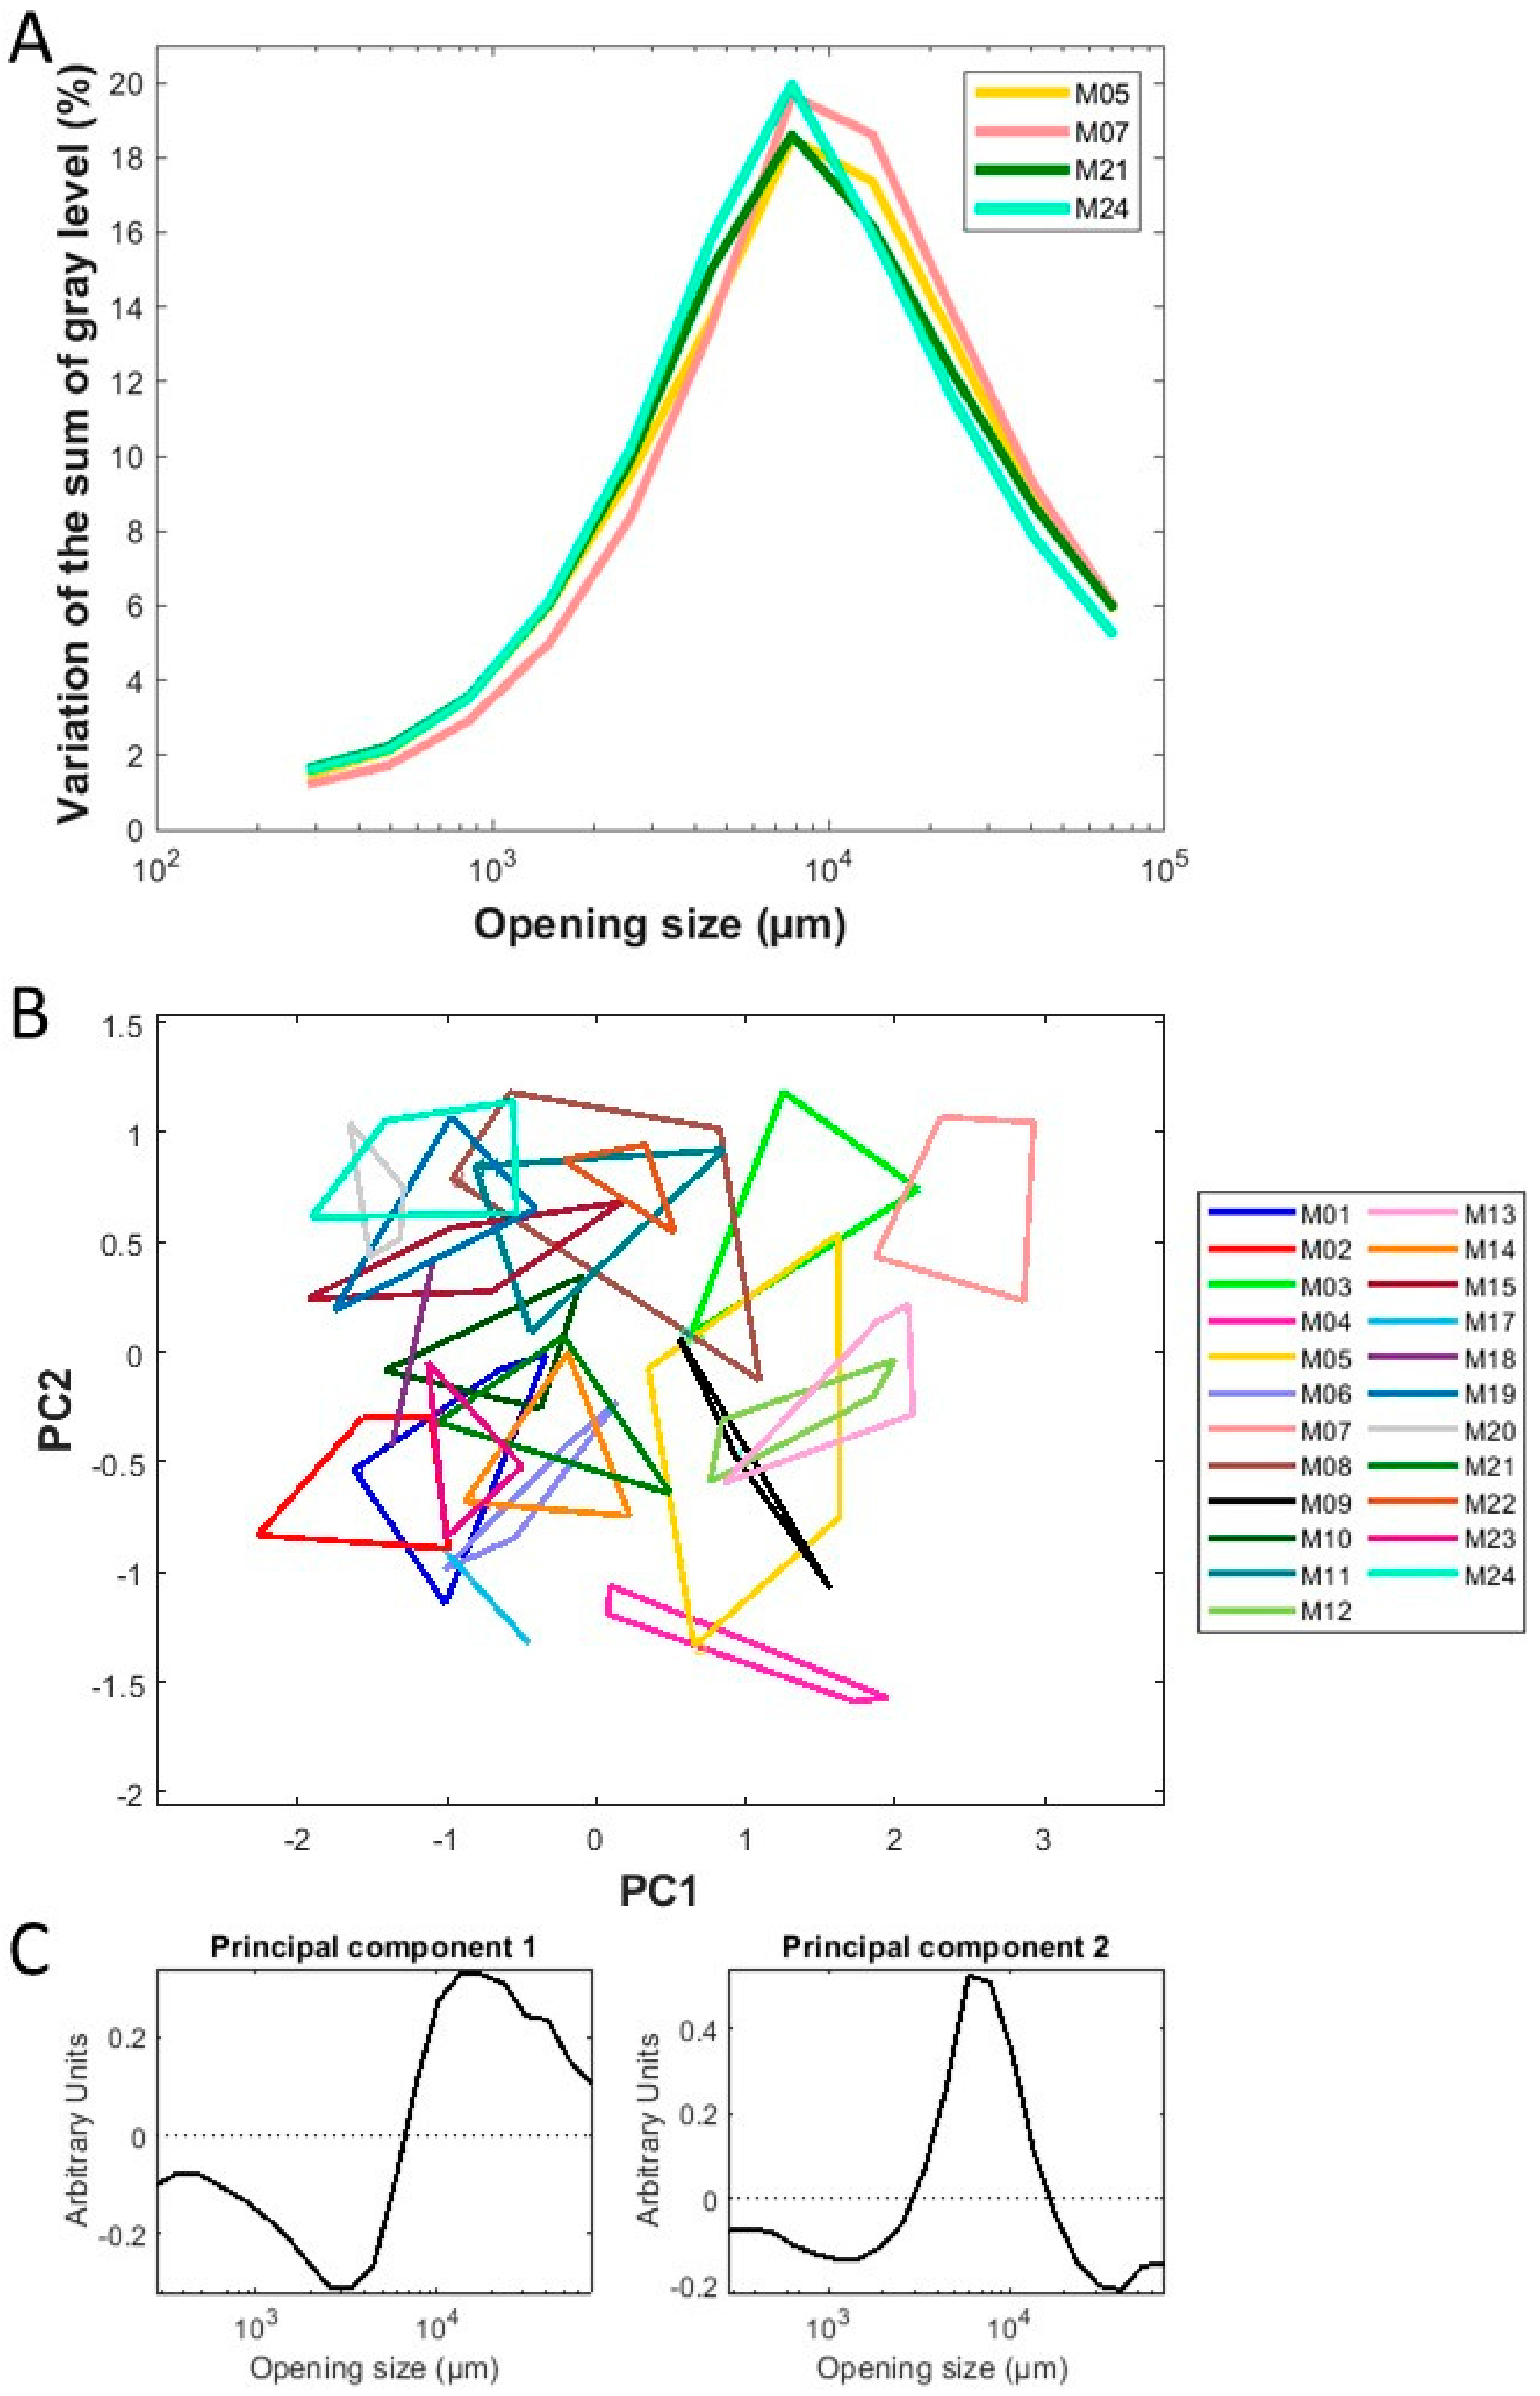
The particle size distribution of the chopped samples was assessed by calculating the mean granulometric curves from the 16 optical images obtained for each sample. Figure 4 illustrates the curves obtained for the examples of four inbred lines presented in Figure 3. In the granulometric curves (Figure 4A), the mode value provides the predominant particle size and the spread reflects the heterogeneity of in-sample particle size. The mode for the four samples was similar at about 0.8 cm, but the extremes of the particle size distribution indicated differences. M07 and M05 had a higher relative amount of large particles (0.8–4 cm), whereas M21 and M24 had a higher relative amount of small particles (0.3–0.8 cm), in agreement with the visual observation (Figure 3). The spreads indicated that M21 and M24 were more heterogeneous and M07 and M05 were more homogeneous. For the entire collection, although the spread of the distribution was different, the mode was about 0.8 cm in all cases. Thus, this indicator taken alone was unable to discriminate the samples.
To gain an overview of the particle size distribution of the 24 maize samples, principal component analysis was performed on the granulometric curves (Figure 4B,C). The first two principal components accounted for 60 and 21% of the total variance, respectively. Component 1 opposed images featuring the largest particles (0.8 cm to 7 cm) to the image with the smallest particles (<0.8 cm). Component 2 distinguished images with heterogeneous particle sizes (negative values) from images with more homogeneous particle sizes (positive values) (Figure 4C). Considering the similarity map (Figure 4B), the variability within each maize sample was lower than the overall variability observed within the data collection. Variance analysis applied to the principal components found that highly significant differences were observed between the samples for the two components (p < 0.01) (data not displayed). Samples were differentiated based on their number of particles larger than 8 mm; component 1 distinguished sample M07, which contained large particles from samples M02, M18, M19, M20, and M24, which had the smallest particles. Component 2 distinguished samples M03, M07, M20, and M24, which were the more homogeneous samples from sample M04, which was more heterogeneous.
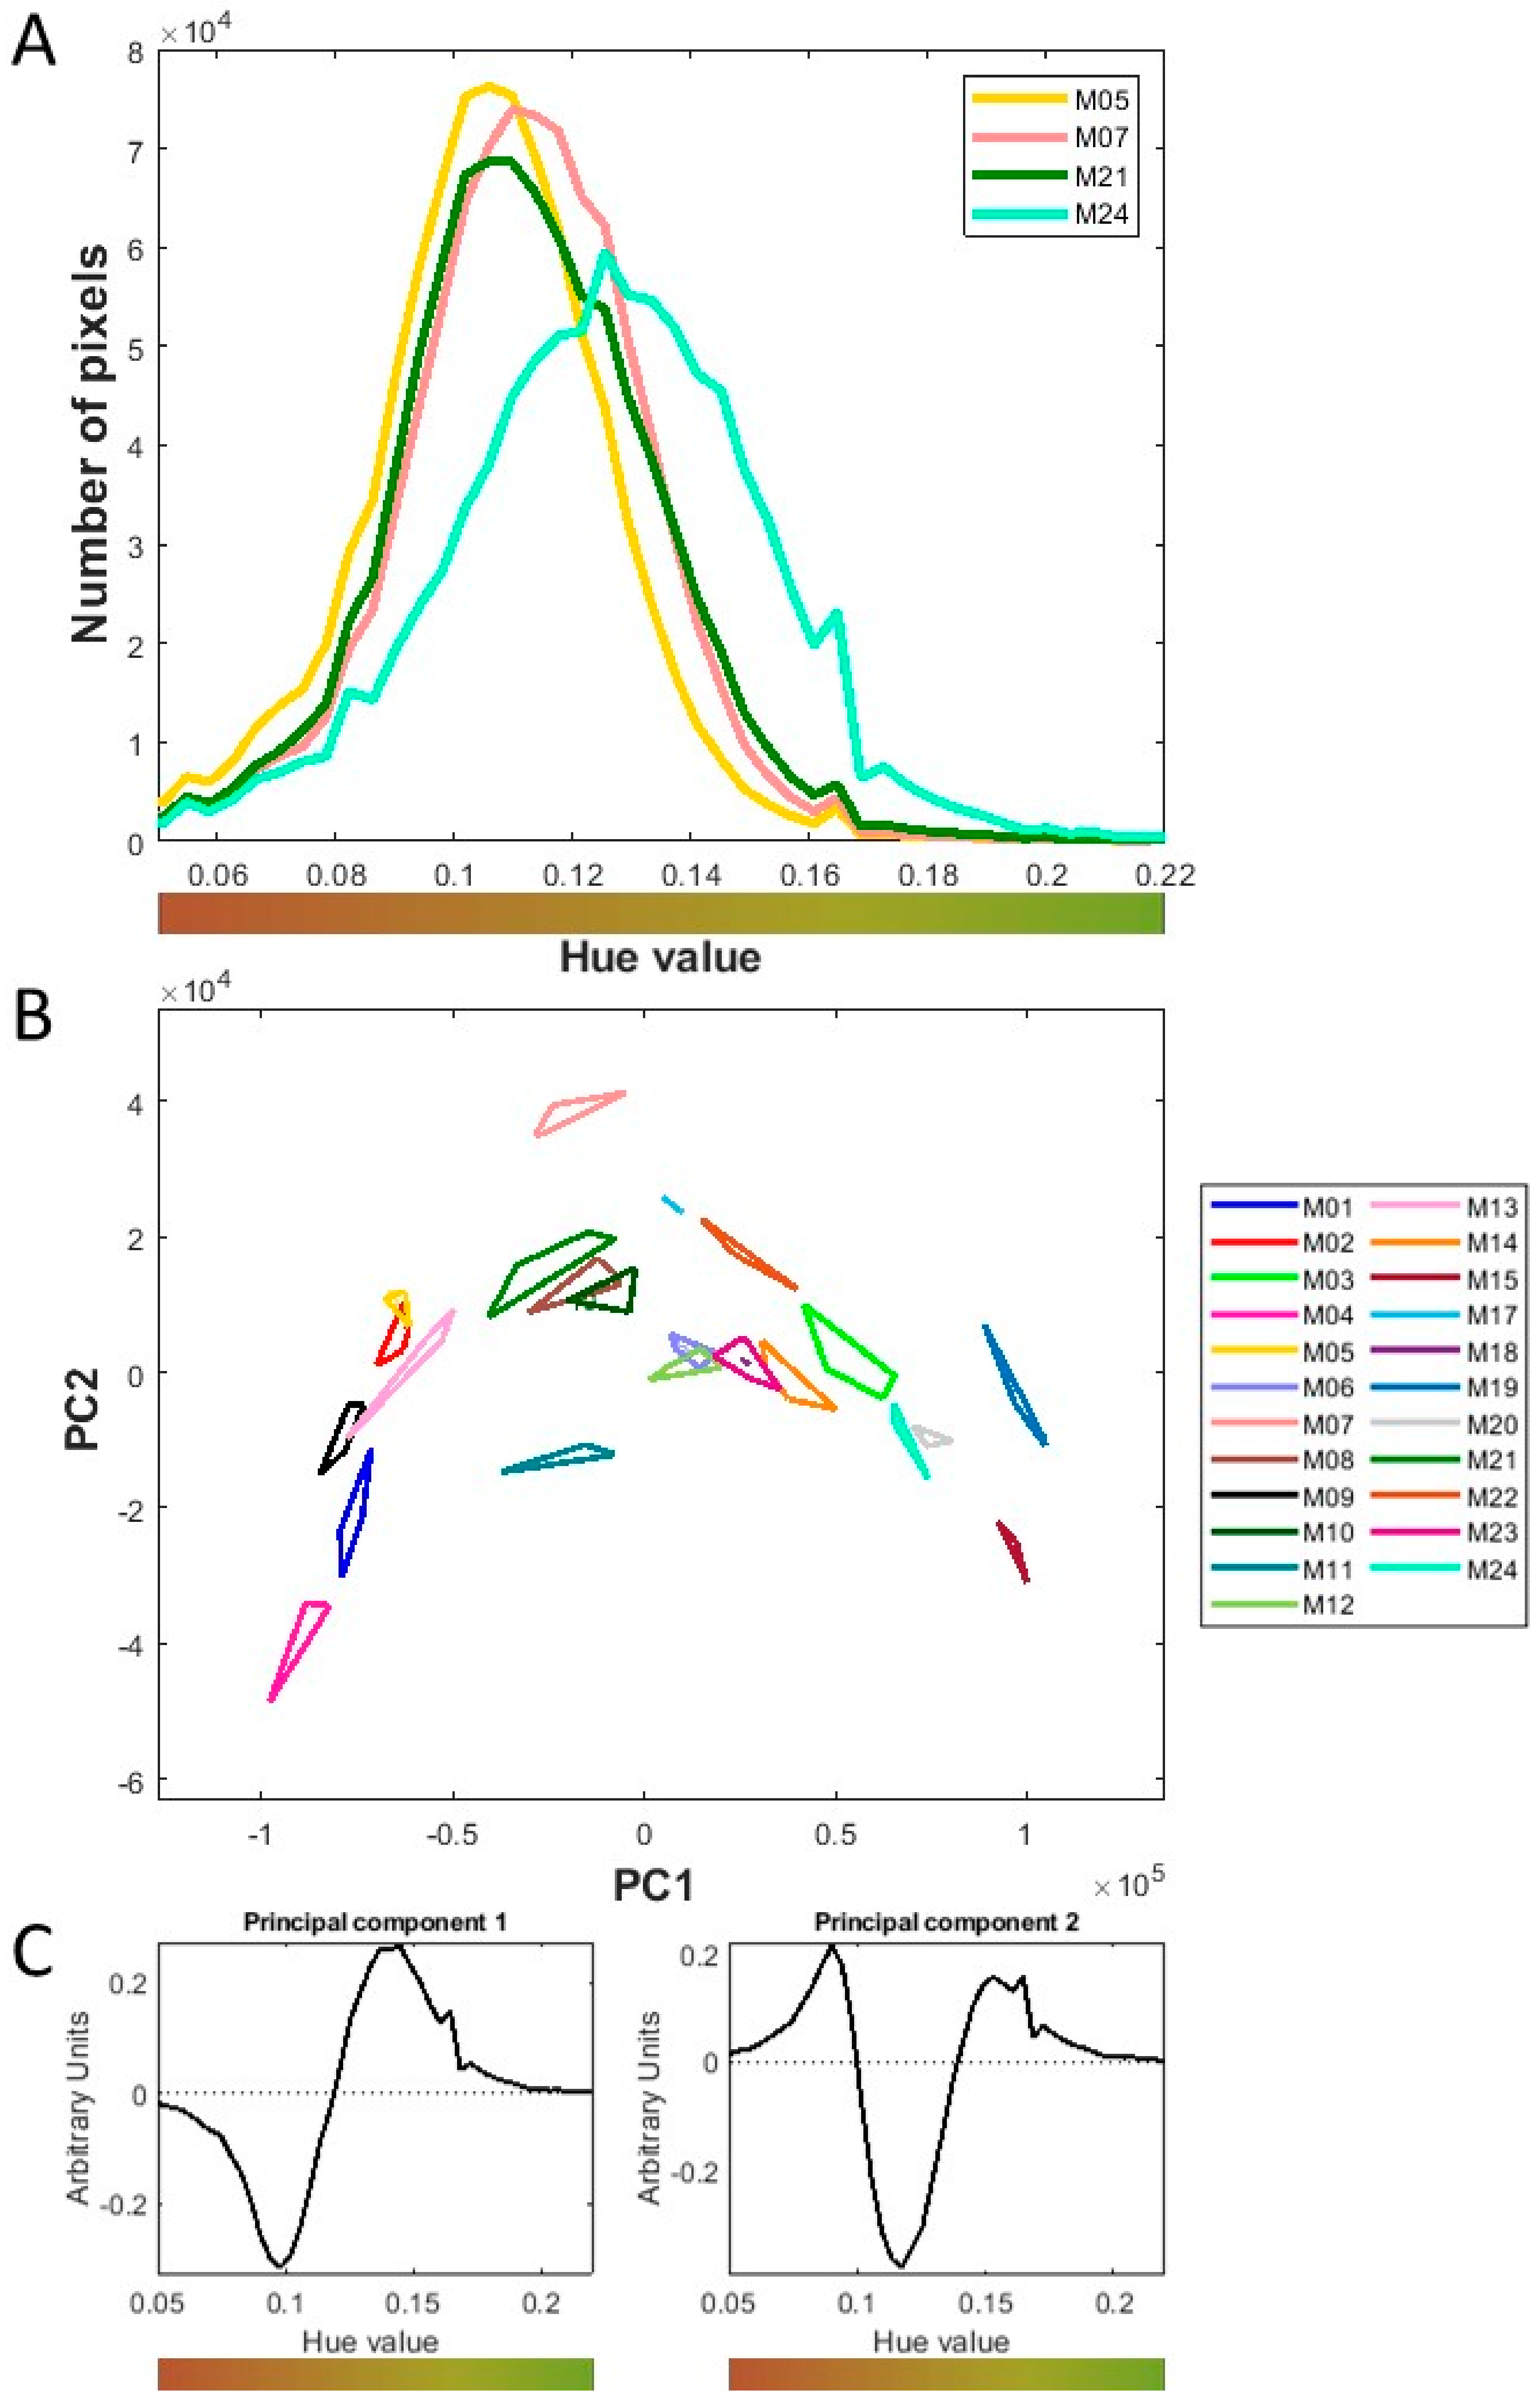
The images indicate clear differences in color, in particular with more green in the presence of more leaves (Figure 3). Further analyses were performed to explore this color variation. Color was assessed by analyzing the histograms of the hue values. Stem-to-leaf ratio may be a factor explaining friability, and hue may be a method of measuring it. Regardless of the samples analyzed, hue values were distributed from 0 to 0.22, corresponding to bright red to bright green color. Figure 5A provides the hue histograms corresponding to the same four samples as used in Figure 3. M24 was very different from the others, with many pixels at 0.125 giving a more yellow hue. M05 and M21 had a similar hue of around 0.106 and were the reddest, while M07 had a hue value of around 0.109. The spread of the histograms was interpreted as an indication of the color homogeneity. While M05 and M07 were homogeneous in color, M21 and particularly all M24 were more heterogeneous. M24 was very different from the others and contained not only yellow particles but also far more green particles than the others, which had more red-orange particles. To highlight the differences in color between the samples, principal component analysis was performed on the hue histograms. The first two components accounted for 89 and 8% of the total variance, respectively. Figure 5 indicates the similarity maps of components 1 and 2 (Figure 5B) according to inbred lines and the corresponding loadings (Figure 5C). The first component differentiated images with red-orange particles from images with yellow-green particles. The second component differentiated images with only orange particles from images with red and yellow-green particles. Like for particle size, variance analysis was applied to the principal components and found a highly significant effect of inbred line (data not displayed). The first component opposed M19 and M15, which were composed of yellow-green particles, to M04 composed of red-orange particles. The second component, M04, which was heterogeneous in color, contrasted with M07, which had a very homogeneous orange color. We found a significant negative correlation (r = −0.71) between the first component of the hue and proportion of fresh stem. This indicates that the fresh stem-to-leaf ratio can be related to a surface color of the dry sample. Inbred lines with many leaves at harvest tended to have greener particles in the chopped and dried sample.
In summary, chopped samples varied in particle size distribution and in particle color. Significant differences between each inbred line of maize were discovered. M15 could be described as a yellow-green sample with a homogeneous particle size, whereas M04 was more red-orange with a more heterogeneous particle size. With respect to the proportion of stem material, M04, M02, and M09 had a high proportion of fresh stem and a large percentage of red-orange particles, in contrast to M15, which had a low proportion of fresh stem and a large percentage of green particles, which fits with the correlation observed between the first component of hue and proportion of fresh stem.
In conclusion, this forage maize collection demonstrating significant variability in dry matter digestibility also demonstrated variability in both the physical structure of the chopped particles and in the stem-to-leaf ratio. The forage maize samples appeared to be physically very heterogeneous materials, both intra-sample and inter-sample. These variabilities in physical properties are expected to induce variability in friability, as the proportion of organs is already known to influence friability [51].

3.2. Definition of Two Friability Indices

The objective of this study was to characterize the friability of a collection of a single forage type (inbred lines of maize) and to interpret possible differences in this trait based on biomass attributes. Given the high initial heterogeneity of the feedstock, specific attention was paid to this parameter in order to be able to reveal differences between samples expected to be small. The experimental procedures used to measure Particle Size Reduction (PSR) index and Energy Index were adapted and standardized accordingly (Figure 1).

3.2.1. PSR Index Measurement

Friability can be defined as the ability to produce fine particles with similar energy input during milling. Here we propose to assess forage friability using a Particle Size Reduction index (PSR Index) obtained after a common standardized milling procedure. This PSR Index is an adaptation of the index proposed by Casler [27]. A batch-grinding device (ball mill) was used to keep the milling energy input constant, but with fewer balls and a smaller milling volume. Three steel balls were used to generate multiple comminution forces (attrition, shear, and impact) compared to the use of a single ball that mainly generates impact [52]. Moisture content of the maize was standardized between samples to smooth its possible effect on post-milled particle size [29].
As we started with only 1.8 g of each of these highly heterogeneous (see Figure 3 and Figure 4) maize forage materials, we first pre-milled the chopped samples with a 2-mm screen selector to ensure that the samples analyzed were representative and relevant-for-purpose. PSR Index was thus obtained not by directly milling chopped maize but by milling a powder that had a mean diameter ranging from 418 to 540 µm. In order to consider any resulting effect of this preliminary step on the amount of fine particles (<200 µm), the PSR Index was corrected based on the initial amount of fine particles. The relative standard deviation obtained for 4 measurements was about 5% and considered acceptable.

3.2.2. Energy Index Measurement

Forage friability can also be defined as its ease of particle size breakdown, which can be assessed via milling energy. Specific milling energy is defined as “the energy that can be assumed to reach the biomass” [53] and corresponds to the total energy minus no-load power. This specific milling energy was discovered to be more specific than total milling energy for lignocellulosic biomasses (wheat straw, switchgrass, and corn stover; [53]) and was therefore employed for this study on maize. Chenost et al. [23] devised this approach to characterize a wide range of forages via their fibrousness index, which corresponds to the specific milling energy required to grind a unit of weight of forage. In order to apply this approach to a single type of forage (inbred lines of maize) and evaluate its discriminant power, we were careful to standardize all the factors that could affect milling energy [29,34,53,54].
As observed by Chenost [23], the repeatability of the index of fibrousness based on energy measurements was low: the average intra-sample relative standard deviation from this collection was 18%, with values ranging from 4 to 38%. Increasing the number of replicates per sample had no effect on this value [28]. Higher repeatability (RSD < 10%) was obtained by Mani et al. [29] in experiments with various biomasses and moisture contents and a different selector screen size, but using a hammer mill. Milling technology could partly explain these patterns, as Miao et al. found a lower repeatability in milling energy measurement using a knife mill than a hammer mill [34].
Based on the Von Rettinger’s law [55,56], the energy required for milling a solid is directly correlated to the increase in surface area during milling, and therefore to the comminution ratio, defined as the difference in particle size before and after milling. To highlight biological differences between maize forages, the surface area created by milling per unit of weight must be similar between the different samples. In this study, we determined the Energy Index using a continuous conventional knife mill adapted to chopped maize and equipped with a 1 mm screen selector that standardizes the output size. As the difference in particle size was high before and after the milling step (comminution ratio of about 18), we assumed that particle size distribution after milling could be used as an indicator of the surface area created during milling. Based on sieving, the mean diameter of particles obtained after knife milling through a 1 mm screen was measured and varied from 434 µm to 503 µm (Supplementary Table S2). This supports the fact that the overall particle sizes of the 24 maize samples were less than 1 mm and in the same order of magnitude, making it possible to run a direct comparison of their specific milling energies.
To overcome a possible artificial variability in specific milling energy measurements induced by milling parameters and raw material properties, we were careful to limit variability from factors known to impact milling energy [54]. Screen selector and rotor speed were kept constant. Given the high impact of feed rate on the specific energy used to mill corn stover in a knife mill [53], manual feed-in (as done by Chenost or Mani et al. [23,29] was avoided. As the feed rate used here was low for the mill capacity (about 1.2 kg.h−1), we opted for a vibrating dosing device. Feed rate tended to be constant throughout the milling process and similar between samples, although the roughness and low flowability of the chopped maize makes it hard to keep feed rate perfectly constant. Moreover, as the moisture content of the biomass has a strong influence on milling energy [34,53], moisture content of all the maize samples was set to 6–7%.
The fact that we standardized most of the milling parameters should have limited their eventual impact on the repeatability of the specific milling energy values. The relative standard deviation of the particle size obtained after milling was around 3% maximum (Supplementary Table S2) and could not explain the high relative standard deviation obtained on the specific milling energy measurements. We thus assumed that the low repeatability arose from sample heterogeneity leading to non-representative sampling. Manual sampling of the initial 200 g weight was done carefully, but this 200 g weight may be not enough to be representative given the large intra-sample heterogeneity. Large pieces of leaves and/or stems were visible in the chopped samples, as observed in Figure 3. The heterogeneity of the chopped samples was also highlighted by grayscale particle size analysis (Figure 4), particularly in the second principal component value. However, we discovered no significant correlation (r = −0.02) between the second principal component value and the relative standard deviation of the energy measurements. In order to validate our hypothesis, a preliminary coarse milling step (knife milling using a 10 mm screen selector) was added to the protocol to homogenize the particle size and facilitate the sampling and mill feed-in of the selected inbred lines (Figure 1). This was done on four selected inbred lines characterized by a low repeatability (relative standard deviation of 25% or even 38%) and a specific milling energy ranging from 105 to 161 kJ.kg−1 was selected (Table 1). Specific milling energy measurements were performed via the same procedure used for the Energy Index measurement, and the relative standard deviations obtained from the three replicates were compared. The relative standard deviation of the energy measurements decreased to values lower than 8% when the maize samples were pre-milled (Table 1), thus confirming our hypothesis. However, for one sample (M04), which required the highest milling energy, the energy measurement was still not repeatable (relative standard deviation still equal to 25%). In this case, the particle size obtained after knife milling with a 1-mm selector was also less repeatable between each replicate compared to the three other samples. The low repeatability is therefore not explained solely by the heterogeneity of the initial sample (of the chopped maize), and the energy value could also have influence.
Adding a pre-milling step could thus be a good alternative to improve the repeatability of the specific milling energy measurements. However, as this step reduces the comminution ratio, it also reduces the milling energy in the standardized milling procedure (1 mm knife mill), making the measurement more difficult and possibly less discriminant. An optimization could be proposed to overcome these difficulties while keeping maize fragmentation at a large mm-plus scale to be comparable to the particle size measured at the output of the rumen (<4 mm).

3.3. Maize Forage Friability

3.3.1. PSR Index

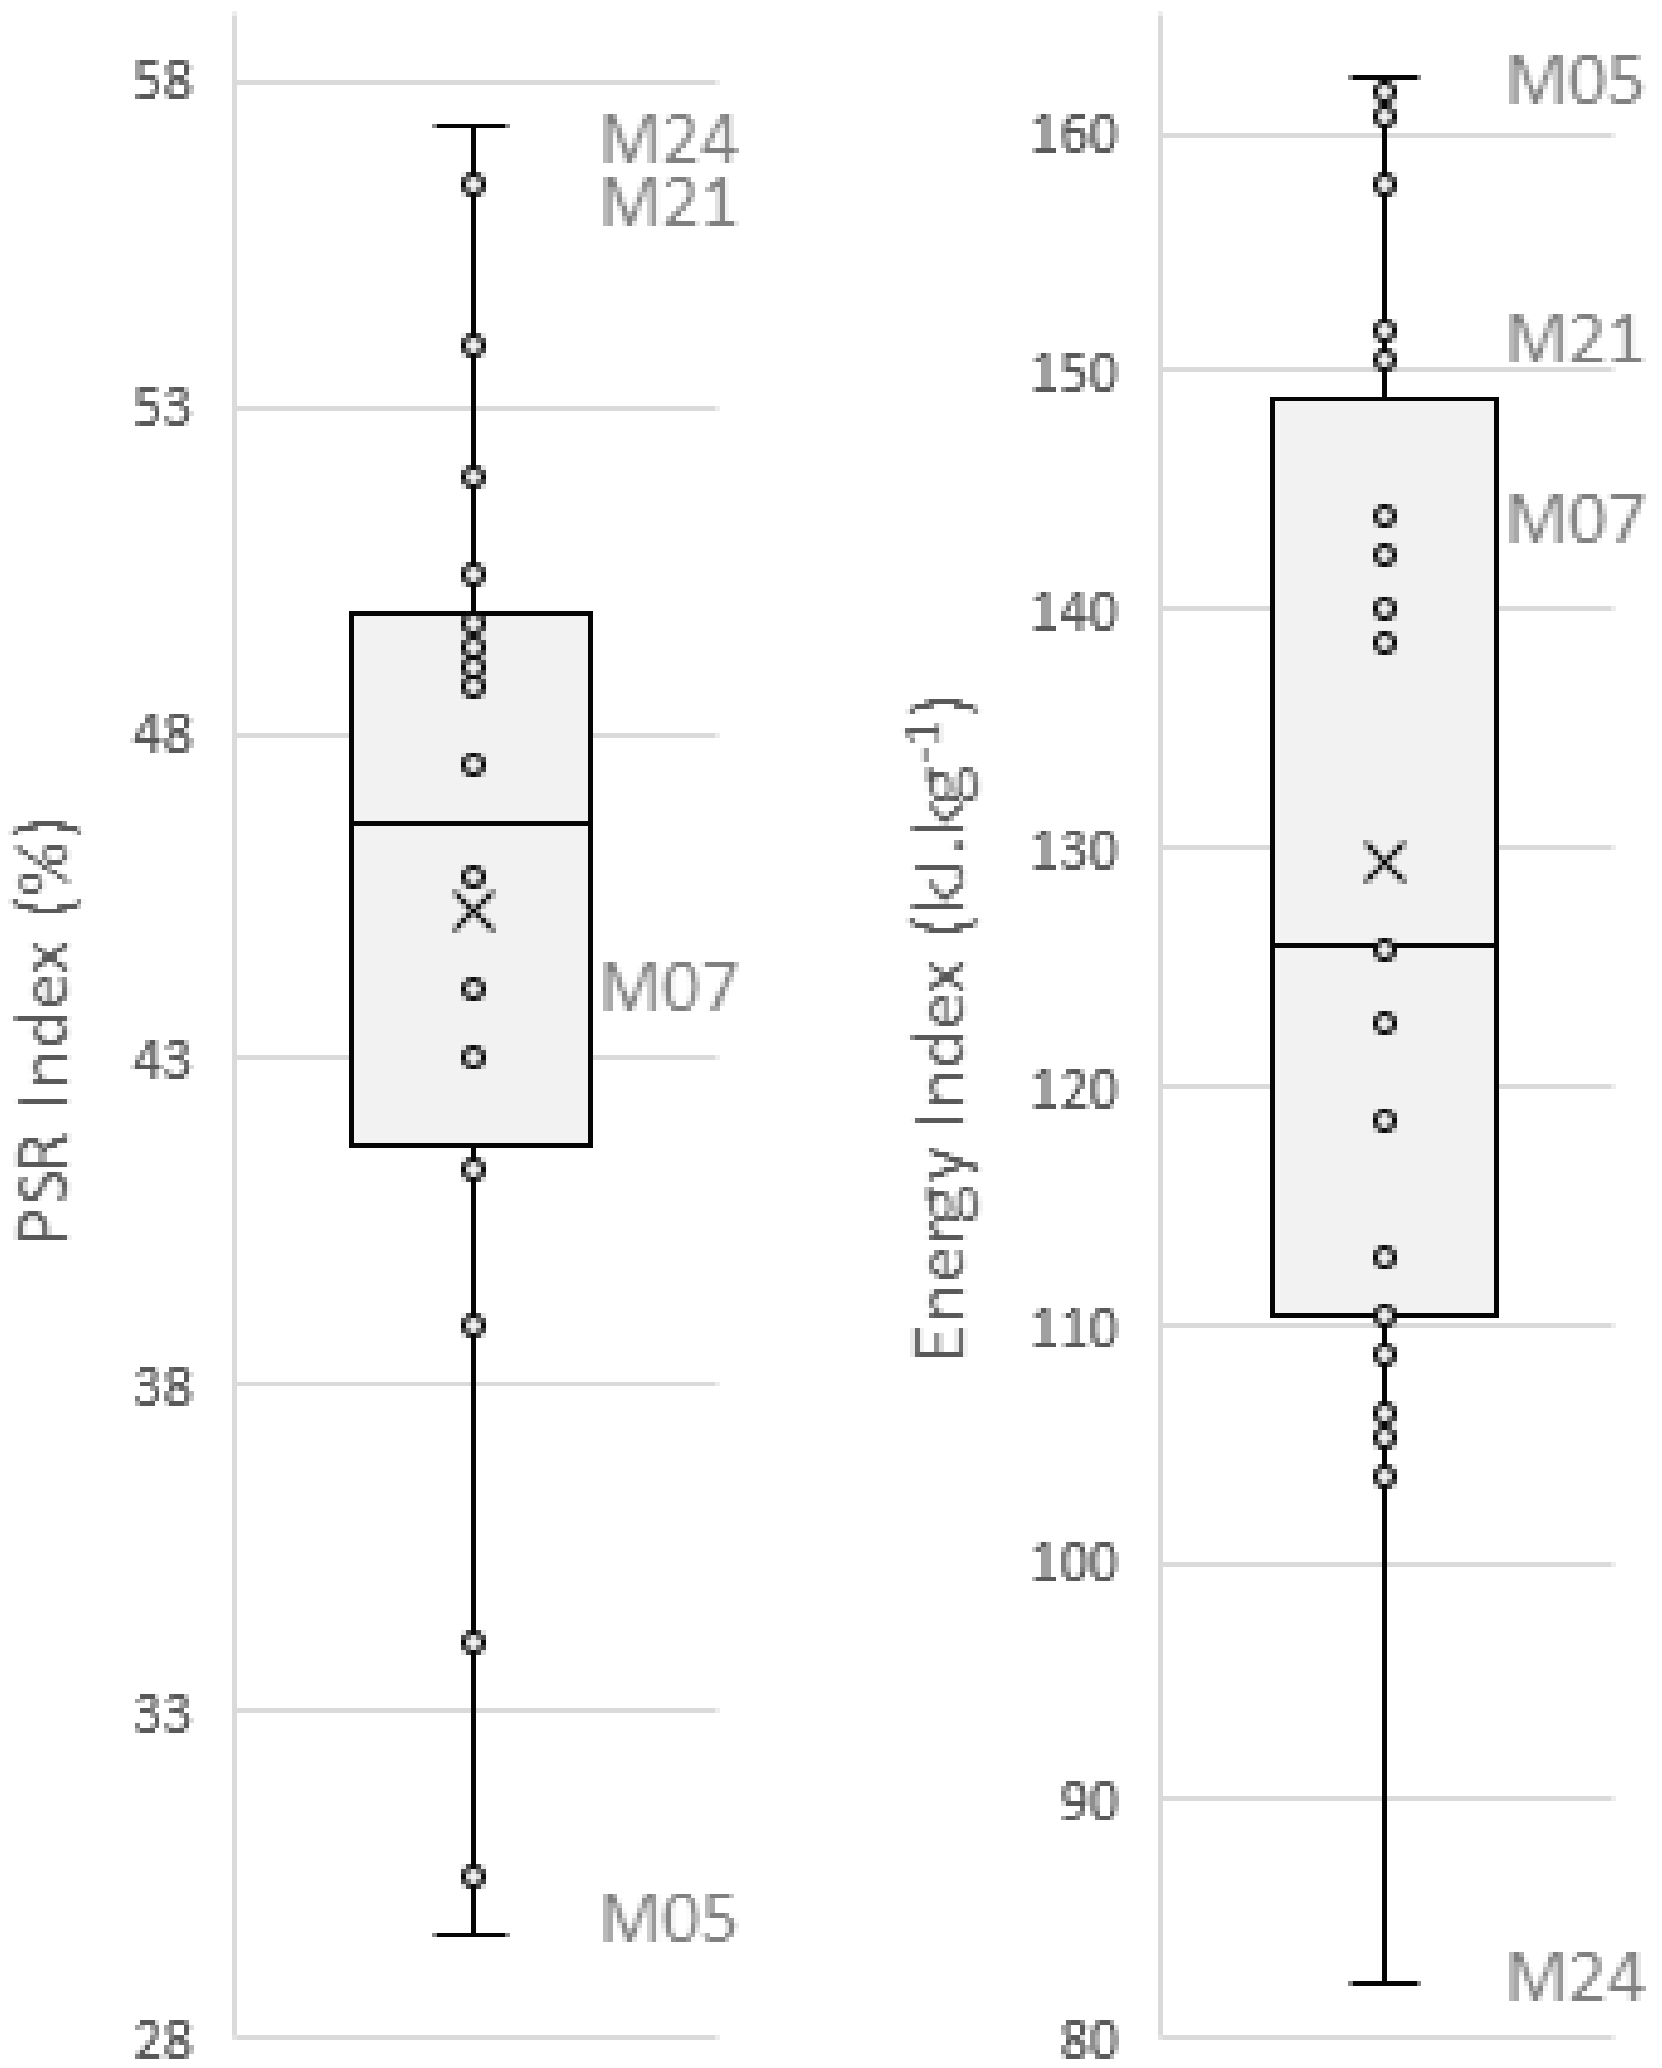
In the collection of samples from twenty-four inbred lines of maize, the PSR index varied from 29.6% to 57.3% with an average value of 45.3% (Figure 6, Supplementary Table S2). The PSR Index values were consistent with those determined by Casler et al. [33] on four smooth bromegrass populations: about 30% for a low PSR index and 37% for high PSR index. We identified maize samples that presented different PSR indexes: M05 had the lowest PSR index (29.6%) and could be described as a “low-friable” sample, whereas M21 and M24 had the highest PSR index values (57.3 and 56.4%, respectively) and could be described as “highly-friable” samples. M07 was right in the middle, with a PSR index of 44.3%. There were significant differences between samples, and no groups were identified as the samples showed continuous variability (Figure 6). The PSR index thus proved a relevant metric for highlighting differences in friability between inbred lines of maize.

3.3.2. Energy Index

In this sample collection, the Energy Index varied from 82.3 kJ.kg−1 to 162.3 kJ.kg−1 with a mean value of 129.1 kJ.kg−1 and a relative standard deviation between maize samples of 17% (Figure 6, Supplementary Table S2). These values were of the same order of magnitude as those reported on corn stover under similar milling conditions [29,57,58], but slightly higher than those obtained for knife-milled corn stover by Himmel et al., i.e., 14 kWh.t−1 (50.4 kJ.kg−1), and Cadoche and Lopez, i.e., 20.0 kWh.t−1 (72 kJ.kg−1) [57,58]. Both studies used a lower comminution ratio (6.5 and 7, respectively, versus 18 here), which could be part of the explanation. Mani et al. [29] also reported a lower specific milling energy (14 kWh.t−1, i.e., 50.4 kJ.kg−1) using a roughly equivalent comminution ratio (14) but another milling technology (hammer mill) which has been demonstrated to be more energy-efficient than knife milling [34,59]. Closer investigation of each sample found significant inter-sample differences (Table S2): M05 had the highest Energy Index values (162.3 ± 23.1 kJ.kg−1) and could again be described as a “low-friable” sample along with M21 (151.7 ± 37.6 kJ.kg−1), whereas M24 had a value of 82.3 ± 32.5 kJ.kg−1 and could again be described as a “highly-friable” sample. M07 was again not far from the middle, at 144.0 ± 12.5 kJ.kg−1. Like for the PSR Index, there was a continuous variability in Energy Index between samples (Figure 6), and like PSR index, this Energy Index was able to highlight differences in friability between inbred lines of maize.

4. Discussion

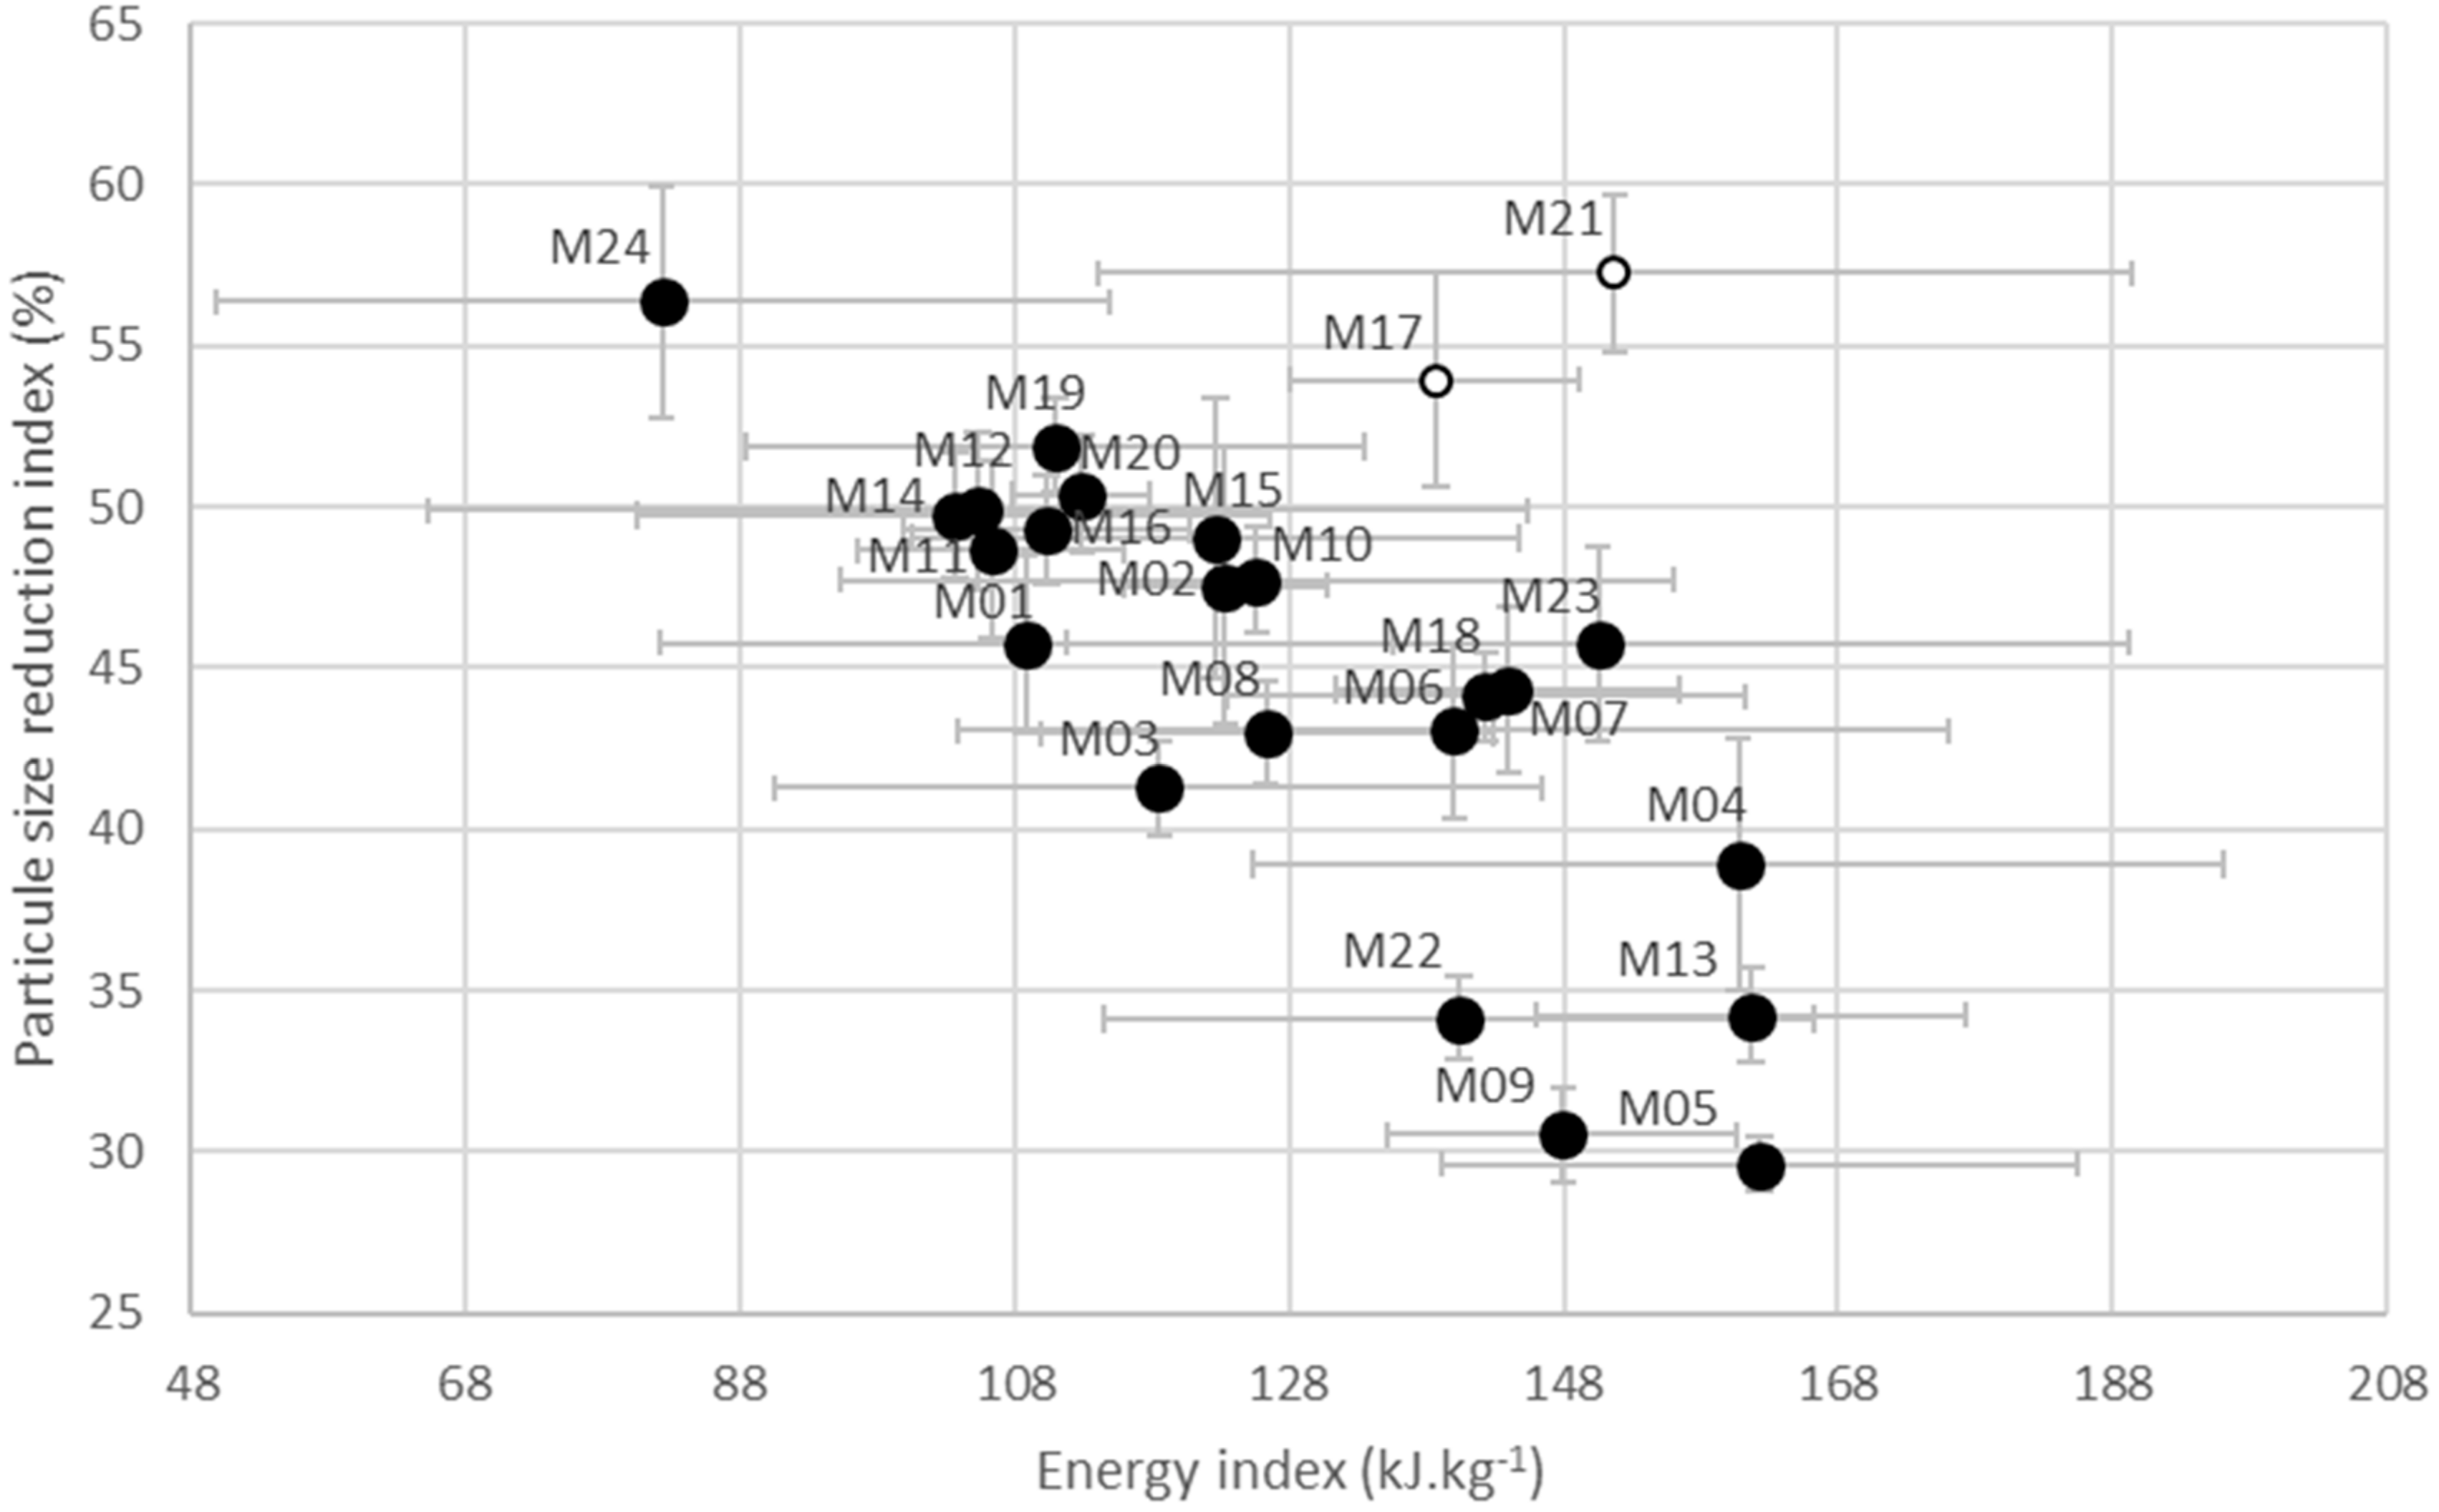
This study proposed two friability indexes, both based on a characterization of the milling behavior of inbred lines of maize forage. The PSR index gives increasing values with increasing friability, while the Energy Index values are negatively correlated with friability. Therefore, if these friability indexes reflect the same mechanical behavior, then we would expect to find a negative correlation between them for each maize sample. The correlation coefficient obtained across the maize collection studied here was −0.635 (Figure 7). Although a general trend emerged, two samples (M21 and M17) indicated a completely different pattern by having both a high PSR index and a high Energy Index.
These two indexes were based on two different milling technologies and thus different mechanical stresses inside the mills. The PSR index was obtained using a ball mill in which the main force is still impact or compression, even though we used three balls here to broaden the types of forces imparted. This milling technology creates very fine particles and is known to modify the assembly of cell wall polymers under long milling durations (e.g., cellulose crystallinity) [60,61]. The Energy Index was based on knife milling which works mainly by shearing and produces particles in the millimeter range [61]. Given the heterogeneous structure of the lignocellulosic biomass at each size scale (from tissues to cell walls), the coarse, intermediate, fine, and ultrafine milling processes solicited different plant structures: intermediate milling primarily acts on the plant tissues whereas fine milling primarily acts on the cell walls [35]. Therefore, the ball mill would reveal the friability of the biomass at cell-wall scale, which could be related to cell wall composition, whereas the knife mill would reveal a friability that is more related to cellular arrangement at tissue scale [35,61]. Similarly, on a study on a hammer mill, Mani et al. [29] explained the lower milling energy of corn stover compared to cereal straw by the presence of the pith, which is an alveolar “spongy” tissue. To confirm this hypothesis on the interpretations of the friability indexes, we ran analyses to correlate the two friability indexes and maize characteristics obtained at organ, particle, and cell wall scales (Table 2).
First, we focused on the largest scale by looking at the physical powder bed property (bulk density) or particle properties of the chopped maize. In general, the Energy Index was far better correlated to these properties than the PSR Index. This could be explained by the fact that the energy measurements are based on direct milling of the chopped maize without any pre-milling step, unlike in the PSR index procedure. Energy Index was negatively correlated to bulk density and spread of particle size distribution (PC2 values of granulometric curves), but no significant effect of overall particle size emerged. In this study, samples with a high bulk density and a narrow particle size distribution would require less milling energy. This could be explained by a better filling of the milling chamber and thus a decrease in milling time inducing an overall decrease in specific milling energy. Surprisingly, the PSR index was negatively correlated to overall particle size of the chopped maize (PC1 value calculated from the granulometric curve), meaning that samples showing the highest PSR Index had the lowest median particle size in chopped maize. This might indicate that the result of milling with the forage harvester was already informative in terms of sample friability (as measured by the PSR Index).
There are numerous reports of a specific milling behavior for leaves compared to stem: whether a decrease in milling energy with the increasing amount of leaves [51] or a greater amount of fine particles produced [32]. Here we paid specific attention to the relationship of both friability indexes with proportion of stems. Two parameters were analyzed: proportion of stem determined by weight, or color properties which were shown to be related to proportion of stem. The results obtained differed depending on the parameter studied: we found no relationship with percentage of stem by weight for both friability indexes, whereas there was a correlation with overall hue (which was more significant for the Energy Index). This parameter suggests that the Energy Index was lower with a higher amount of leaves and could be more sensitive to organ proportion than the PSR index, even if the relationship was unclear.
We can assume that even for the Energy Index, the friability assessment by the milling behavior is more related to cellular organization than a particular type of organ. Both the friability indexes were correlated with percentage of NDF that could be interpreted as the amount of cell-wall material per unit of weight. This would be related to the cellular structure. For example, samples with smaller cells would be expected to yield a higher percentage of NDF than samples with larger cells.
For cell-wall composition, the amount of hemicellulose and cellulose in the NDF were deduced from the Van Soest dietary fiber analyses (Supplementary Table S1). PSR index was significantly correlated with these two compositional attributes (p < 0.01) whereas Energy Index was less significantly correlated (p < 0.05) (Table 2). Increasing maize friability (estimated by PSR index) was associated with increasing hemicellulose content and decreasing cellulose content. A higher content of cellulose has often been associated with greater higher mechanical strength of biomass [62] or a greater energy requirement during size reduction [61]. We discovered no relationship between the friability indexes and amount of ADL, but this could be explained by the low sensitivity of the measurement on such low initial amounts. As the digestibility of the cell walls is a key trait for maize forage, we also investigated the correlation of this trait with friability indexes. However, there was no relationship with either of the friability indexes, probably because such complex properties are influenced by numerous factors [10].
Therefore, each of these friability indexes applied to maize samples describe friability at different structural scales. Both were sensitive to cellular arrangements at the tissue scale in the plant, and PSR index also highlighted friability at the cell-wall scale, which was related to cell-well composition. Looking at the friability of the 24 inbred lines of maize forages, the two scales were globally convergent, although some samples (such as M17 and M21) followed a divergent pattern of behavior. The cellular arrangement of these samples resulted in low friability whereas their cell-wall composition (rich in hemicellulose) tended to increase their friability. Further analysis of the organization of their maize stem would be valuable to support this finding.

5. Conclusions

This study assessed the friability of a collection of 24 inbred lines of forage maize based on their milling behavior. Two friability indexes were proposed: one based on the specific energy required to mill a unit of weight of forage (Energy Index), and the other based on proportion of fine particles produced at constant milling energy (PSR index). The experimental procedures were designed to factor out the heterogeneity of the chopped samples when measuring the PSR index, which made the index repeatable and easy to handle. The experimental procedures employed for the Energy Index used the raw material, which has the advantage of better reflecting what is fed to livestock but is also more difficult to handle and standardize. From a livestock farmer perspective, the PSR index seems to be better adapted to high-throughput screening of inbred lines, as the measurement is fast and requires little verification and handling compared to the Energy Index.
Friability within this 24-line collection was found to vary by a factor of two with both friability indexes. Both friability indexes were sensitive to the cellular arrangement at tissue scale, which was evaluated via content of cell wall. In addition, the PSR index was also sensitive to cell-wall-scale factors and highlighted compositional variability between samples. Friability was negatively correlated with cellulose content but positively correlated with hemicellulose content. The involvement of lignin has not been particularly emphasized. A more detailed analysis of all the phenolic compounds that are known to play a key role in the properties of grass cell walls (hydroxycinnamic acids, lignin amount, and structure) should be carried out to conclude on their potential role. More focused studies based on less heterogeneous materials might be valuable to explain the effect of chemical composition. For both friability indexes the same ranking of the samples was not always obtained, and some samples behave differently according to the indexes. Additional information was obtained but the exact interpretation needs to be confirmed by more precise analysis at the tissue level (especially in isolated stem which could explain much of the variability in friability observed in maize shoot). Tissue organization and cell-wall composition at tissue level would be hugely informative and could be characterized by histological analysis [63,64,65].

Supplementary Materials

The following supporting information can be downloaded at: https://www.mdpi.com/article/10.3390/agriculture12070951/s1, Supplementary Materials Table S1—Fibre characteristics of the 24 maize inbred lines, determined with Van Soest method (NDF, ADF, ADL, dNDF) and Aufrère method (dCellDM). Supplementary Materials Table S2—Physical characterization and friability indices of the 24 maize inbred lines.

Author Contributions

Conceptualization, M.B., M.-F.D., C.M.-L., F.G. and C.B.; methodology, M.B., M.-F.D., C.M.-L. and C.B.; validation, M.B., M.-F.D., A.R. and C.B.; formal analysis, M.B., M.-F.D., C.M.-L. and C.B.; investigation, M.B. and A.R.; resources, B.D.; writing—original draft preparation, M.B. and C.B.; writing—review and editing, M.-F.D., C.M.-L., A.R., B.D. and F.G.; supervision, M.-F.D., B.D., F.G. and C.B.; funding acquisition, B.D. and F.G. All authors have read and agreed to the published version of the manuscript.

Funding

This work was supported by INRAE (French National Research Institute for Agriculture, Food and Environment). Marie Berger’s Ph-D work received funding from Limagrain Europe and the French government Ministry for Higher Education, Research and Innovation (CIFRE scheme 2018/1480).

Institutional Review Board Statement

Not applicable.

Informed Consent Statement

Not applicable.

Data Availability Statement

The datasets presented in this article are not readily available because research partly funded by private company. Requests to access the datasets should be directed to C.B.

Acknowledgments

The authors thank E. Samson and G. Maraval for their technical assistance on the milling experiments, and the platform for Processing of PLANt product with Emergent Technologies of the JRU IATE for its support (PLANET, https://doi.org/10.15454/1.5572338990609338E12 2 June 2022). We also thank A. Hurlet for handling the imaging work, and R. Baumont and P. Nozière for their helpful insight and discussions.

Conflicts of Interest

The authors declare no conflict of interest.

References

  1. Amon, T.; Amon, B.; Kryvoruchko, V.; Zollitsch, W.; Mayer, K.; Gruber, L. Biogas production from maize and dairy cattle manure—Influence of biomass composition on the methane yield. Agric. Ecosyst. Environ. 2007, 118, 173–182. [Google Scholar] [CrossRef]
  2. Barrière, Y.; Mechin, V.; Lafarguette, F.; Manicacci, D.; Guillon, F.; Wang, H.; Lauressergues, D.; Pichon, M.; Bosio, M.; Tatout, C. Toward the discovery of maize cell wall genes involved in silage quality and capacity to biofuel production. Maydica 2009, 54, 161–198. [Google Scholar]
  3. Barros-Rios, J.; Santiago, R.; Malvar, R.A.; Jung, H.-J.G. Chemical composition and cell wall polysaccharide degradability of pith and rind tissues from mature maize internodes. Anim. Feed Sci. Technol. 2012, 172, 226–236. [Google Scholar] [CrossRef]
  4. Barriere, Y. Brown-midrib genes in maize and their efficiency in dairy cow feeding. Perspectives for breeding improved silage maize targeting gene modifications in the monolignol and p-hydroxycinnamate pathways. Maydica 2017, 62, 1–19. [Google Scholar]
  5. Casler, M.D.; Vogel, K.P. Accomplishments and impact from breeding for increased forage nutritional value. Crop Sci. 1999, 39, 12–20. [Google Scholar] [CrossRef] [Green Version]
  6. Barrière, Y.; Guillet, C.; Goffner, D.; Pichon, M. Genetic variation and breeding strategies for improved cell wall digestibility in annual forage crops. A review. Anim. Res. 2003, 52, 193–228. [Google Scholar] [CrossRef] [Green Version]
  7. Barriere, Y.; Alber, D.; Dolstra, O.; Lapierre, C.; Motto, M.; Ordas Perez, A.; Van Waes, J.; Vlasminkel, L.; Welcker, C.; Monod, J.P. Past and prospects of forage maize breeding in Europe. I. The grass cell walls as a basis of genetic variation and future improvements in feeding value. Maydica 2005, 50, 259–274. [Google Scholar]
  8. Ertiro, B.T.; Twumasi-Afriyie, S.; Blümmel, M.; Friesen, D.; Negera, D.; Worku, M.; Abakemal, D.; Kitenge, K. Genetic variability of maize stover quality and the potential for genetic improvement of fodder value. Field Crops Res. 2013, 153, 79–85. [Google Scholar] [CrossRef]
  9. Pino, F.; Mitchell, L.K.; Jones, C.M.; Heinrichs, A.J. Comparison of diet digestibility, rumen fermentation, rumen rate of passage, and feed efficiency in dairy heifers fed ad-libitum versus precision diets with low and high quality forages. J. Appl. Anim. Res. 2018, 46, 1296–1306. [Google Scholar] [CrossRef]
  10. Barrière, Y.; Emile, J.-C.; Surault, F. Genetic variation of maize silage ingestibility in dairy cattle. Anim. Res. 2003, 52, 489–500. [Google Scholar] [CrossRef] [Green Version]
  11. Fahey, G., Jr.; Hussein, H. Forty years of forage quality research: Accomplishments and impact from an animal nutrition perspective. Crop Sci. 1999, 39, 4–12. [Google Scholar] [CrossRef]
  12. Crampton, E.W.; Donefer, E.; Lloyd, L.E. A nutritive value index for forages. J. Anim. Sci. 1960, 19, 538–544. [Google Scholar] [CrossRef]
  13. Waghorn, G.C. Changes in rumen digesta of cows during a restricted feeding period when offered fresh red clover, lucerne, or lucerne hay. N. Z. J. Agric. Res. 1986, 29, 233–241. [Google Scholar] [CrossRef] [Green Version]
  14. Waghorn, G.C.; Reid, C.S.W.; Ulyatt, M.J.; John, A. Feed comminution, particle composition and distribution between the four compartments of the stomach in sheep fed chaffed lucerne hay at two feeding frequencies and intake levels. J. Agric. Sci. 1986, 106, 287–296. [Google Scholar] [CrossRef]
  15. Bauchart, D.; Legay-Carmier, F.; Doreau, M. Distribution des bactéries adhérentes en fonction de la taille des particules dans les contenus du rumen et du feuillet chez la vache laitière. Reprod. Nutr. Dev. 1987, 27, 341–342. [Google Scholar] [CrossRef] [Green Version]
  16. Weston, R. Some aspects of constraint to forage consumption by ruminants. Aust. J. Agric. Res. 1996, 47, 175–197. [Google Scholar] [CrossRef]
  17. Wilson, J.; Kennedy, P.M. Plant and animal constraints to voluntary feed intake associated with fibre characteristics and particle breakdown and passage in ruminants. Aust. J. Agric. Res. 1996, 47, 199–225. [Google Scholar] [CrossRef]
  18. Casler, M.D. Agricultural fitness of smooth bromegrass populations selected for divergent particle-size reduction index. Crop Sci. 2008, 48, 1793–1798. [Google Scholar] [CrossRef]
  19. Mertens, D.R. Regulation of Forage Intake; Fahey, G.C., Jr., Ed.; Wiley Online Library: Hoboken, NJ, USA, 1994; pp. 450–493. [Google Scholar] [CrossRef] [Green Version]
  20. Surprenant, J.; Barnes, D.K.; Busch, R.H.; Marten, G.C. Bidirectional selection for neutral detergent fiber and yield in reed canarygrass. Can. J. Plant Sci. 1988, 68, 705–712. [Google Scholar] [CrossRef]
  21. Han, L.; Casler, M.; Grau, C. Responses to divergent selection for fiber concentration at two disease potentials in smooth bromegrass. Crop Sci. 2001, 41, 30–39. [Google Scholar] [CrossRef] [Green Version]
  22. Troelsen, J.E.; Bigsby, F.W. Artificial mastication—A new approach for predicting voluntary forage consumption by ruminants. J. Anim. Sci. 1964, 23, 1139–1142. [Google Scholar] [CrossRef]
  23. Chenost, M. L’indice de fibrosité des foins: Mesure et relations avec la valeur alimentaire. Anim. Res. 1966, 15, 253–257. [Google Scholar] [CrossRef] [Green Version]
  24. Laredo, M.; Minson, D. The voluntary intake, digestibility, and retention time by sheep of leaf and stem fractions of five grasses. Aust. J. Agric. Res. 1973, 24, 875–888. [Google Scholar] [CrossRef]
  25. Prasad, J.; Gupta, C. Mechanical properties of maize stalk as related to harvesting. J. Agric. Eng. Res. 1975, 20, 79–87. [Google Scholar] [CrossRef]
  26. Al-Zube, L.; Sun, W.; Robertson, D.; Cook, D. The elastic modulus for maize stems. Plant Methods 2018, 14, 11. [Google Scholar] [CrossRef]
  27. Casler, M.; Schneider, D.; Combs, D. Development and application of a selection criterion for particle size breakdown of smooth bromegrass leaves. Anim. Feed Sci. Technol. 1996, 61, 57–71. [Google Scholar] [CrossRef]
  28. Chenost, M.; Grenet, E. Fibre Index of Forages: Its Significance and Use for Predicting Feeding Value of Forages; Annales de Zootechnie: Paris, France, 1971. [Google Scholar]
  29. Mani, S.; Tabil, L.G.; Sokhansanj, S. Grinding performance and physical properties of wheat and barley straws, corn stover and switchgrass. Biomass Bioenergy 2004, 27, 339–352. [Google Scholar] [CrossRef]
  30. Cheeke, P.R. Natural Toxicants in Feeds, Forages, and Poisonous Plants; Interstate Publishers, Inc.: Danville, IL, USA, 1998. [Google Scholar]
  31. McDonald, P. Animal Nutrition; Pearson Education India: Bengaluru, India, 2002. [Google Scholar]
  32. Chundawat, S.P.; Venkatesh, B.; Dale, B.E. Effect of particle size based separation of milled corn stover on AFEX pretreatment and enzymatic digestibility. Biotechnol. Bioeng. 2006, 96, 219–231. [Google Scholar] [CrossRef]
  33. Casler, M.; Culvenor, R.; Combs, D. Divergent selection for two laboratory predictors of voluntary intake: Relationships among the predictors and leaf morphology variables. Anim. Feed Sci. Technol. 2000, 84, 107–119. [Google Scholar] [CrossRef]
  34. Miao, Z.; Grift, T.; Hansen, A.; Ting, K. Energy requirement for comminution of biomass in relation to particle physical properties. Ind. Crops Prod. 2011, 33, 504–513. [Google Scholar] [CrossRef]
  35. Mayer-Laigle, C.; Blanc, N.; Rajaonarivony, R.K.; Rouau, X. Comminution of dry lignocellulosic biomass, a review: Part I. from fundamental mechanisms to milling behaviour. Bioengineering 2018, 5, 41. [Google Scholar] [CrossRef] [PubMed] [Green Version]
  36. Méchin, V.; Argillier, O.; Menanteau, V.; Barrière, Y.; Mila, I.; Pollet, B.; Lapierre, C. Relationship of cell wall composition to in vitro cell wall digestibility of maize inbred line stems. J. Sci. Food Agric. 2000, 80, 574–580. [Google Scholar] [CrossRef]
  37. Van Soest, P.J.; Robertson, J.B.; Lewis, B.A. Methods for dietary fiber, neutral detergent fiber, and nonstarch polysaccharides in relation to animal nutrition. J. Dairy Sci. 1991, 74, 3583–3597. [Google Scholar] [CrossRef]
  38. Aufrère, J.; Michalet-Doreau, B. In vivo digestibility and prediction of digestibility of some by-products. In Proceedings of the EEC Seminar, Melle-Gontrode, Belgium, 26–29 September 1983. [Google Scholar]
  39. Devaux, M.-F.; Bouchet, B.; Legland, D.; Guillon, F.; Lahaye, M. Macro-vision and grey level granulometry for quantification of tomato pericarp structure. Postharvest Biol. Technol. 2008, 47, 199–209. [Google Scholar] [CrossRef]
  40. Devaux, M.F.; Legland, D. Grey level granulometry for histological image analysis of plant tissues. In Microscopy; 2014; p. 624. Available online: https://hal.inrae.fr/hal-01195487 (accessed on 2 June 2022).
  41. Dinca, M.; Moiceanu, G.; Paraschiv, G.; Voicu, G.; Negoita, O.; Chitoiu, M.; Tudor, P. Energy consumption at size reduction of lignocellulose biomass for bioenergy. Sustainability 2019, 11, 2477. [Google Scholar] [CrossRef] [Green Version]
  42. Aufrere, J.; Michalet-Doreau, B. Comparison of methods for predicting digestibility of feeds. Anim. Feed Sci. Technol. 1988, 20, 203–218. [Google Scholar] [CrossRef]
  43. Aufrere, J.; Baumont, R.; Delaby, L.; Peccatte, J.R.; Andrieu, J.; Andrieu, J.P.; Dulphy, J.P. Prévision de la digestibilité des fourrages par la méthode pepsine-cellulase. Le point sur les équations proposées. INRAE Prod. Anim. 2007, 20, 129–136. [Google Scholar] [CrossRef]
  44. Baumont, R.; Aufrere, J.; Niderkorn, V.; Andueza, D.; Surault, F.; Peccatte, J.R.; Delaby, L.; Pelletier, P. Specific diversity in forages: Its consequences on the feeding value. Fourrages 2008, 194, 189–206. [Google Scholar]
  45. Zhang, Y.; Legland, D.; Hage, F.E.; Devaux, M.-F.; Guillon, F.; Reymond, M.; Méchin, V. Changes in cell walls lignification, feruloylation and p-coumaroylation throughout maize internode development. PLoS ONE 2019, 14, e0219923. [Google Scholar] [CrossRef] [Green Version]
  46. Wolf, D.P.; Coors, J.G.; Albrecht, K.A.; Undersander, D.J.; Carter, P.R. Forage quality of maize genotypes selected for extreme fiber concentrations. Crop Sci. 1993, 33, 1353–1359. [Google Scholar] [CrossRef] [Green Version]
  47. Khan, N.A.; Yu, P.; Ali, M.; Cone, J.W.; Hendriks, W.H. Nutritive value of maize silage in relation to dairy cow performance and milk quality. J. Sci. Food Agric. 2014, 95, 238–252. [Google Scholar] [CrossRef] [PubMed]
  48. He, Y.; Cone, J.W.; Hendriks, W.H.; Dijkstra, J. Relationships between chemical composition and in vitro gas production parameters of maize leaves and stems. J. Anim. Physiol. Anim. Nutr. 2019, 104, 12–21. [Google Scholar] [CrossRef] [PubMed] [Green Version]
  49. Van Soest, P.J.; Robertson, J.B.; Hall, M.B.; Barry, M.C. Klason lignin is a nutritionally heterogeneous fraction unsuitable for the prediction of forage neutral-detergent fibre digestibility in ruminants. Br. J. Nutr. 2020, 124, 693–700. [Google Scholar] [CrossRef] [PubMed]
  50. Sokhansanj, S.; Turhollow, A.; Cushman, J.; Cundiff, J. Engineering aspects of collecting corn stover for bioenergy. Biomass Bioenergy 2002, 23, 347–355. [Google Scholar] [CrossRef]
  51. Ghorbani, Z.; Masoumi, A.; Hemmat, A. Specific energy consumption for reducing the size of alfalfa chops using a hammer mill. Biosyst. Eng. 2010, 105, 34–40. [Google Scholar] [CrossRef]
  52. Rajaonarivony, K.; Rouau, X.; Lampoh, K.; Delenne, J.-Y.; Mayer-Laigle, C. Fine comminution of pine bark: How does mechanical loading influence particles properties and milling efficiency? Bioengineering 2019, 6, 102. [Google Scholar] [CrossRef] [Green Version]
  53. Bitra, V.S.; Womac, A.R.; Igathinathane, C.; Miu, P.I.; Yang, Y.T.; Smith, D.R.; Chevanan, N.; Sokhansanj, S. Direct measures of mechanical energy for knife mill size reduction of switchgrass, wheat straw, and corn stover. Bioresour. Technol. 2009, 100, 6578–6585. [Google Scholar] [CrossRef]
  54. Yu, M.; Womac, A.R.; Pordesimo, L.O. Review of biomass size reduction technology. In 2003 ASAE Annual Meeting; American Society of Agricultural and Biological Engineers: St. Joseph, MI, USA, 2003. [Google Scholar]
  55. Temmerman, M.; Jensen, P.D.; Von Hébert, J. Rittinger theory adapted to wood chip and pellet milling, in a laboratory scale hammermill. Biomass Bioenergy 2013, 56, 70–81. [Google Scholar] [CrossRef]
  56. von Rittinger, P.R. Taschenbuch der Aufbereitungskunde; Ernst & Korn: Berlin, Germany, 1867. [Google Scholar]
  57. Himmel, M.; Tucker, M.; Baker, J.; Rivard, C.; Oh, K.; Grohmann, K. Comminution of biomass: Hammer and knife mills. In Proceedings of the 7th Symposium on Biotechnology for Fuels and Chemicals, Gatlinburg, Tennessee, 14–17 May 1985. [Google Scholar]
  58. Cadoche, L.; López, G.D. Assessment of size reduction as a preliminary step in the production of ethanol from lignocellulosic wastes. Biol. Wastes 1989, 30, 153–157. [Google Scholar] [CrossRef]
  59. Mayer-Laigle, C.; Rajaonarivony, R.K.; Blanc, N.; Rouau, X. Comminution of dry lignocellulosic biomass: Part II. Technologies, improvement of milling performances, and security issues. Bioengineering 2018, 5, 50. [Google Scholar] [CrossRef] [PubMed] [Green Version]
  60. Kratky, L.; Jirout, T. Biomass size reduction machines for enhancing biogas production. Chem. Eng. Technol. 2011, 34, 391–399. [Google Scholar] [CrossRef]
  61. Oyedeji, O.; Gitman, P.; Qu, J.; Webb, E. Understanding the impact of lignocellulosic biomass variability on the size reduction process: A review. ACS Sustain. Chem. Eng. 2020, 8, 2327–2343. [Google Scholar] [CrossRef]
  62. Pickering, K.L.; Aruan Efendy, M.G.; Le, T.M. A review of recent developments in natural fibre composites and their mechanical performance. Compos. Part A Appl. Sci. Manuf. 2016, 83, 98–112. [Google Scholar] [CrossRef] [Green Version]
  63. Berger, M.; Devaux, M.-F.; Legland, D.; Barron, C.; Delord, B.; Guillon, F. Darkfield and fluorescence macrovision of a series of large images to assess anatomical and chemical tissue variability in whole cross-sections of maize stems. Front. Plant Sci. 2021, 12, 792981. [Google Scholar] [CrossRef]
  64. Legland, D.; El-Hage, F.; Méchin, V.; Reymond, M. Histological quantification of maize stem sections from FASGA-stained images. Plant Methods 2017, 13, 84. [Google Scholar] [CrossRef] [Green Version]
  65. Zhang, Y.; Wang, J.; Du, J.; Zhao, Y.; Lu, X.; Wen, W.; Gu, S.; Fan, J.; Wang, C.; Wu, S.; et al. Dissecting the phenotypic components and genetic architecture of maize stem vascular bundles using high-throughput phenotypic analysis. Plant Biotechnol. J. 2020, 19, 35–50. [Google Scholar] [CrossRef]
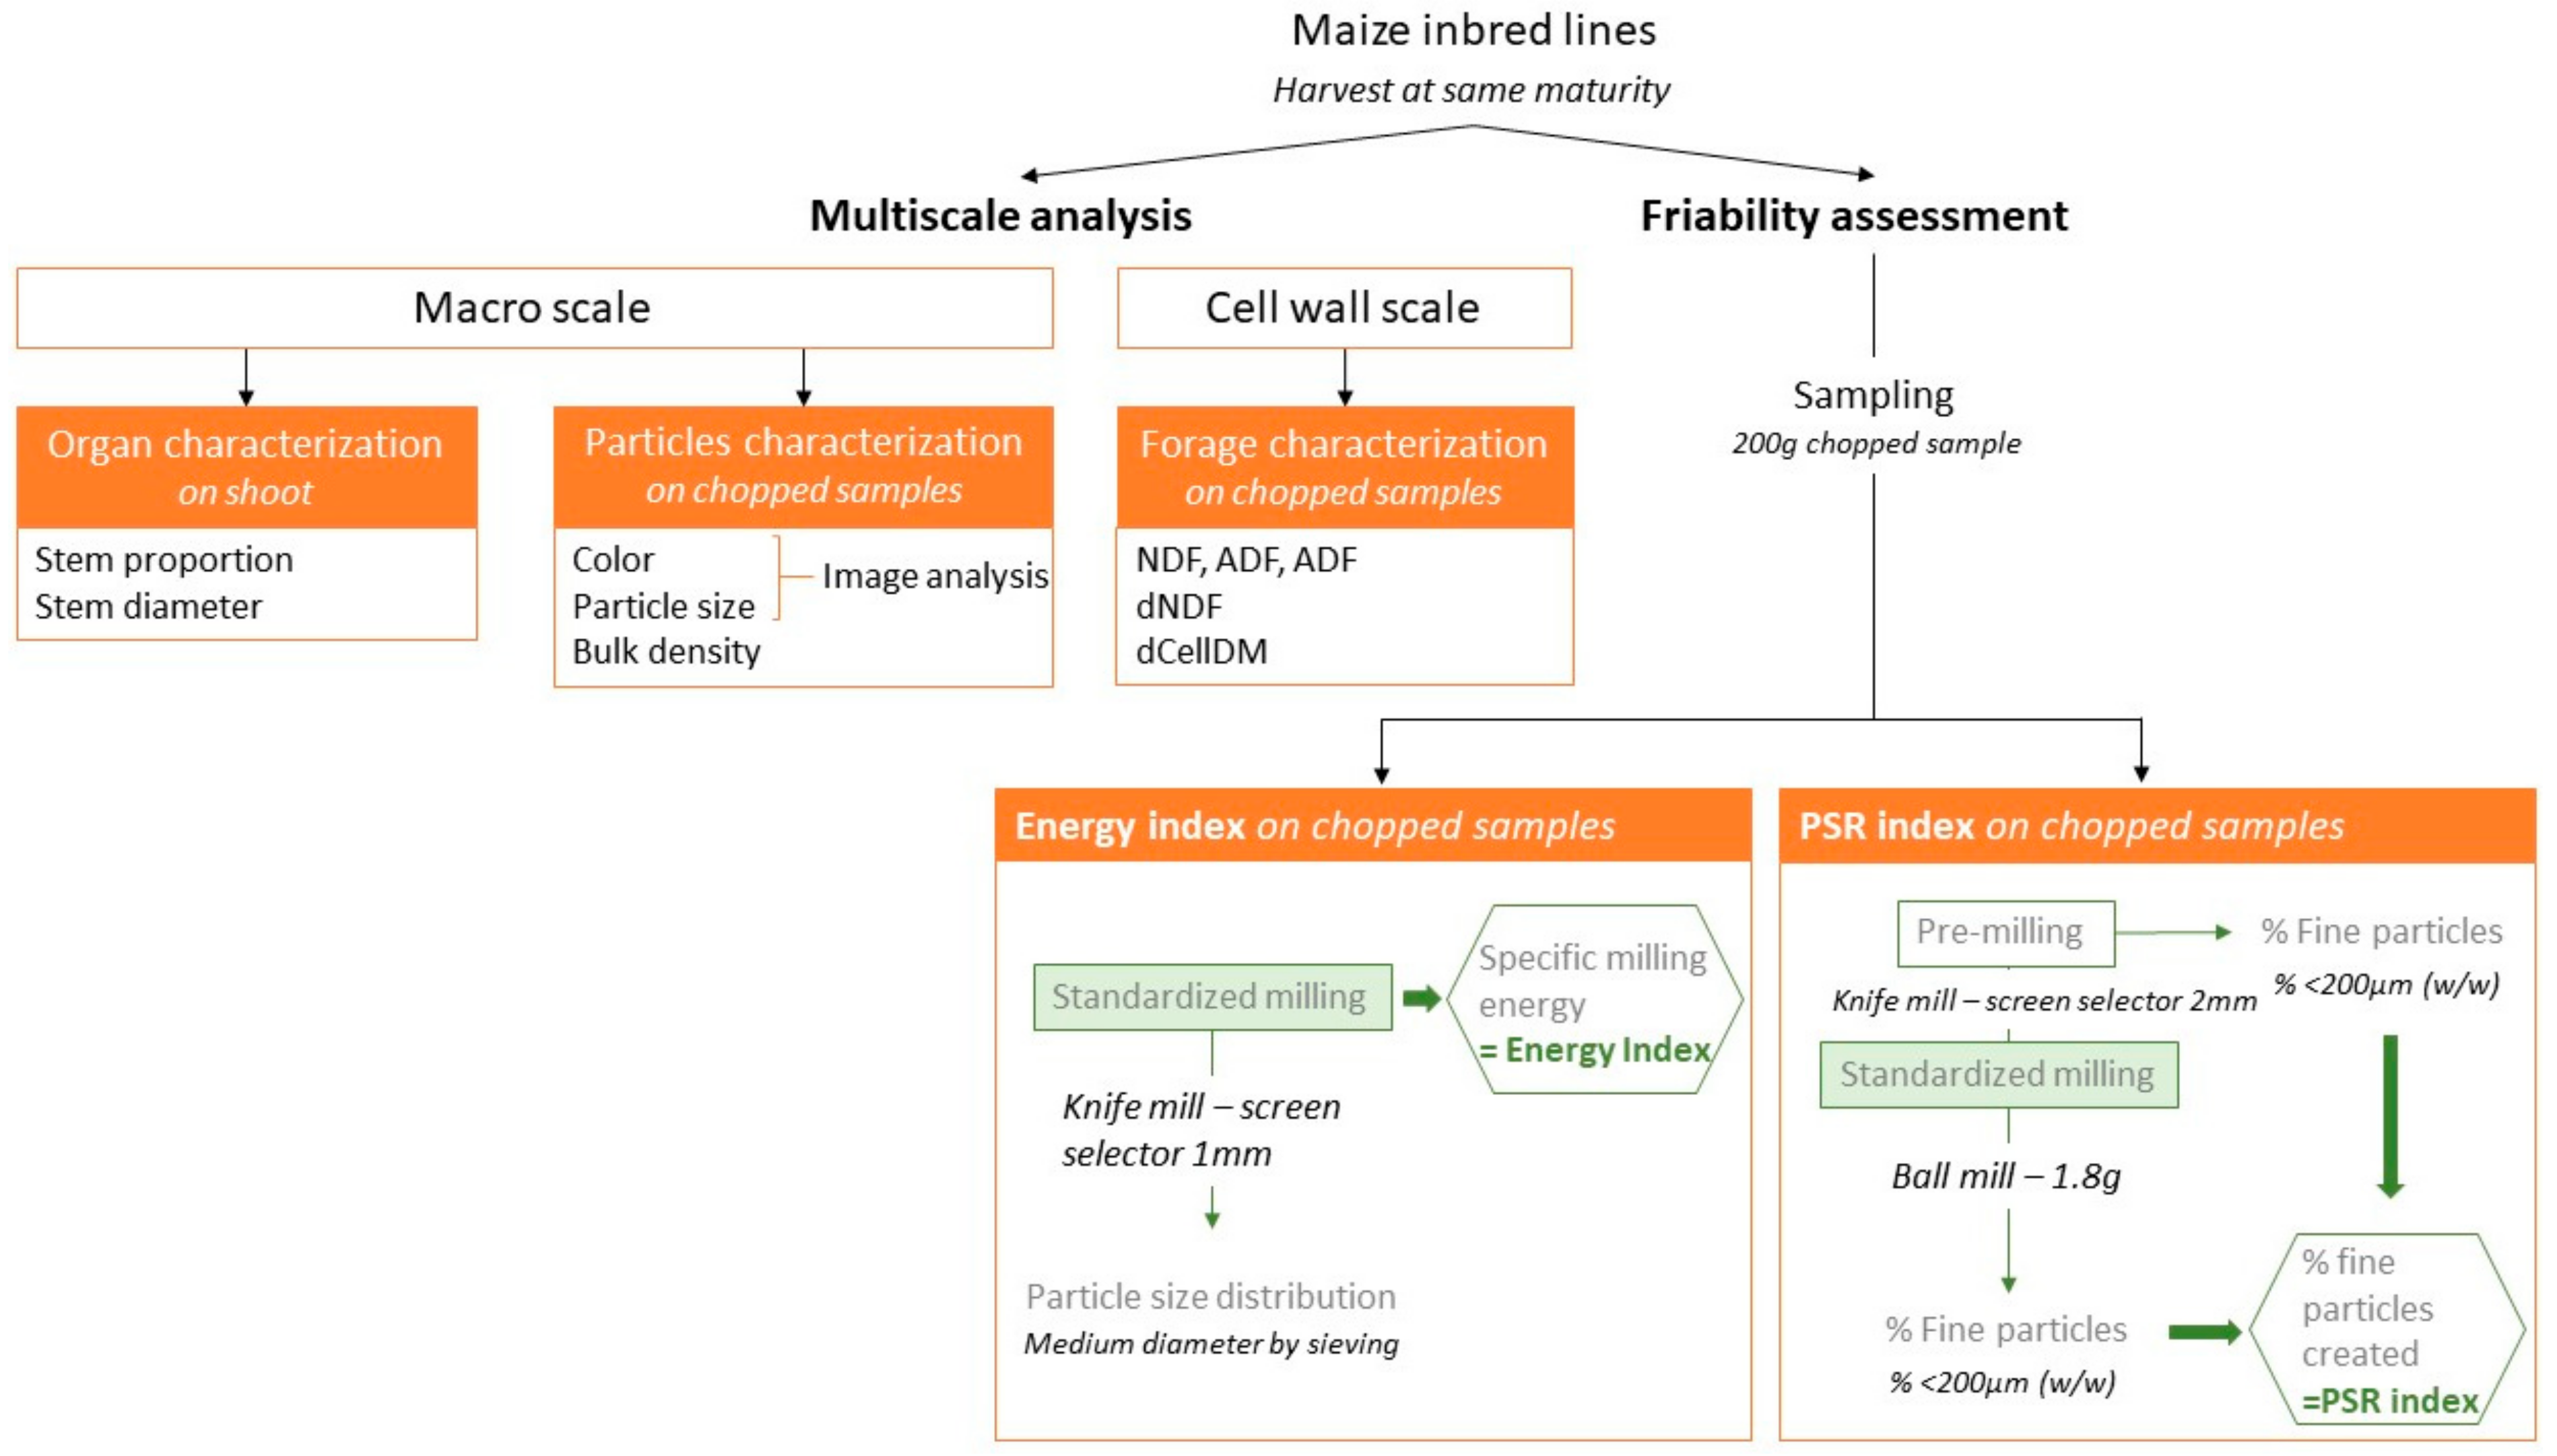
Figure 1. Experimental design with a focus on the friability assessment procedures.
Agriculture 12 00951 g001
Figure 2. Fiber characteristics of 24 maize inbred lines of maize. (A) NDF = Neutral Detergent Fiber (% dm), (B) ADF = Acid Detergent Fiber (%NDF), (C) ADL = Acid Detergent Lignin (% NDF), (D) dNDF = digestibility of the NDF (% NDF).
Agriculture 12 00951 g002
Figure 3. Light-box images chopped samples of four (M05, M07, M21 and M24) of the 24 inbred lines of maize. Field of view: 9.6 × 11.2 cm2.
Agriculture 12 00951 g003
Figure 4. Particle size analysis of the 24 inbred lines of maize (chopped samples). (A) Granulometric curves calculated from optical images of four samples. (B,C) Principal component analysis based on granulometric curves: similarity map (B) and loadings (C) of components 1 and 2 (60 and 21% of total variance, respectively).
Agriculture 12 00951 g004
Figure 5. Color analysis of the 24 inbred lines of maize (chopped samples). (A) Hue histograms calculated from hue satura-tion volume images of four samples. (B,C) Principal component analysis based on hue histograms: similarity map (B) and loadings (C) of components 1 and 2 (89 and 8% of total variance, respectively). The bands below the hue value axes correspond to hue values between 0.05 and 0.22 to give a visual picture of the corresponding color.
Agriculture 12 00951 g005
Figure 6. PSR index values (%) and Energy Index (kJ.kg−1) for 24 lines of inbred maize.
Agriculture 12 00951 g006
Figure 7. Particle Size Reduction index as a function of Energy Index for a collection of 24 maize inbred lines of maize.
Agriculture 12 00951 g007
Table 1. Comparison of the repeatability of milling energy measured on chopped samples and on pre-milled samples for four maize inbred lines of maize (M01, M04, M10 and M12) and the particle size obtained after milling (median diameter).
ChoppedWith Pre-Milling
Milling EnergyMedian
Diameter
Milling EnergyMedian
Diameter
kJ.kg−1RSD (%)RSD (%)kJ.kg−1RSD (%)RSD (%)
M01109253.160.94.30.3
M04161252.877.423.93.8
M10126243.146.15.50.5
M12105381.1548.02.2
RSD: relative standard deviation.
Table 2. Pearson correlation coefficients between friability indexes and the physical properties and composition of 24 inbred lines of maize. Hemicellulose content = (NDF(% dm) − ADF(% dm))/NDF(% dm); Cellulose content = (ADF(% dm) − ADL(% dm))/NDF(% dm). (NDF = Neutral Detergent Fiber, ADF = Acid Detergent Fiber, ADL = Acid Detergent Lignin).
VariablesPSR IndexEnergy Index
Physical propertiesBulk density (kg.m−3)0.291−0.447 *
Stem proportion (% fresh matter)−0.3140.326
Stem diameter (mm)−0.134−0.153
Particle size (granulometry PC1 values)−0.559 **0.428
Particle size heterogeneity
(granulometry PC2 values)
0.110−0.456 *
Particle color (hue PC1 values)0.508 *−0.539 **
Particle color heterogeneity (hue PC2 values)0.0120.224
CompositionNDF (%dm)−0.586 **0.585 **
Hemicellulose (% NDF)0.629 **−0.471 *
Cellulose (% NDF)−0.702 **0.491 *
ADL (% NDF)0.150−0.030
dNDF (%NDF)−0.0490.222
* significantly different from 0 at a p < 0.05, ** significantly different from 0 at p < 0.01.
Publisher’s Note: MDPI stays neutral with regard to jurisdictional claims in published maps and institutional affiliations.