Article

Effects of Water-Saving Irrigation on Direct-Seeding Rice Yield and Greenhouse Gas Emissions in North China

1
Chongqing Academy of Agricultural Sciences, Chongqing 401329, China
2
Agriculture and Rural Sub-Center of Chongqing Ecological Environment Monitoring Center, Chongqing 401329, China
3
Key Laboratory of Crop Physiology & Ecology, Institute of Crop Sciences, Chinese Academy of Agricultural Sciences, Beijing 100081, China
*
Authors to whom correspondence should be addressed.
Agriculture 2022, 12(7), 937; https://doi.org/10.3390/agriculture12070937
Submission received: 24 April 2022 / Revised: 21 June 2022 / Accepted: 24 June 2022 / Published: 28 June 2022
(This article belongs to the Special Issue Innovative Conservation Cropping Systems and Practices)

Abstract

:
Rice cultivation consumes more than half of the planet’s 70% freshwater supply used in agricultural production. Competing water uses and climate change globally are putting more pressure on the limited water resources. Therefore, water-saving irrigation (WSI) is recommended for rice production in water scares areas. The impact of WSI techniques on direct-seeding rice production and greenhouse gas emissions in North China is becoming increasingly important in the era of climate change. Therefore, we conducted a two-year field experiment on directly seeded rice to assess the impact of traditional flooding irrigation (CK) and three water saving irrigation (WSI) methods, including drip irrigation with an irrigation amount of 50 mm (DI1) and 35 mm (DI2) at each watering time and furrow wetting irrigation (FWI), on rice yield and greenhouse emissions. Generally, the WSI techniques decreased the number of rice panicles per m−2, spikelet per panicle, 1000-grain weight and rice yield compared to CK. Rice yield and yield components of (DI1) were significantly higher than (DI2). The adoption of either (DI1) or (FWI) showed insignificant variation in terms of rice yield and its yield components measured except for 1000-grain weight. The water productivity was 88.9, 16.4 and 11.4% higher in the FWI plot than the CK, DI1 and DI2 plots, respectively. The WSI decreased cumulative CH4 emission significantly by 73.0, 84.7 and 64.4% in DI1, DI2 and FWI, respectively, in comparison with CK. The usage of DI2 triggered 1.4 and 2.0-fold more cumulative N2O emission compared to DI1 and FWI, respectively. Area-scaled emission among the water-saving irrigation methods showed no significance. The yield-scaled emission in DI1 and DI2 and FWI were 101, 67.5 and 102%, respectively, significantly lower than CK. The adoption of FWI produced an acceptable rice yield with the lowest yield-scaled emission and highest water productivity among the irrigation practices. Our experiment demonstrates that dry direct-seeding with furrow irrigation can impact triple-wins of sustainable rice yield, high water-use efficiency and low GHG emissions in North China.

1. Introduction

As the most important staple food of the world, rice represents 19% of human calorific intake [1]. Global population is projected by 2050 to reach 9 billion, and a 50% increase in rice production may be needed for the impending demands [2]. Globally, approximately 70% of the planet’s freshwater supply is consumed through agricultural production [3]. In recent times, the sustainability of irrigated rice systems are under threat, owing to agricultural intensification, depleting water reserves and limited water availability across the globe [4]. Rice cultivation, accounting for 40% of the agricultural freshwater usage, worsening climatic conditions, rising population and competing water uses constraints farmers access to adequate and timely supply of water [5]. Therefore, for sustainable rice cultivation, it is essential that water is managed appropriately. China is among the largest rice producers and the second major user of water for irrigation globally [6]. In recent times, large-scale rice production has moved northward [7]. The cultivated area and total production in North China have increased by 101.1% and 143.2%, respectively since 1990, and account for 18.8% and 20.4% of Chinese total rice sown area and production in 2012, respectively. The expected socioeconomic growth, associated water resource demand and consumption through rice production can be reasonably projected to increase exponentially in North China. From the findings of Jiang et al. [8], the continuous adoption of traditional irrigation practices that use huge volumes of water and accounts for over 60% of water use for producing rice across China may not be sustainable in North China, where water shortage is severe. Additionally regional and seasonal water shortages caused by drought and future climate change scenarios will make water shortage more severe in the region and threaten rice production [9,10]. Although globally, the production of rice contributes only 1.5% of the overall anthropogenic greenhouse gas (GHG), this portion is considerably greater in rice-producing nations [11]. A substantial quantity of greenhouse gas (GHG) is released into the environment with current practices of rice production that consume vast amounts of water [5]. Therefore, target to limit global warming to 1.5 °C will be compromised due to insufficient agricultural emission reductions [12]. Accordingly, several water-saving irrigation (WSI) know-hows have been developed and disseminated in China, such as alternate wetting and drying, soil saturated cultivation, drip irrigation, bed-furrow base irrigation and non-flooded mulching cultivation to replace the traditional flood irrigation [13,14]. The choice of these WSI may impact rice growth and greenhouse gas (GHG) emissions. The adoption of WSI can cause a reduction in rice yield [15], maintain or even increase rice yield [16]. Compared with continuous flooding, WSI, which involves one or several drainage methods that minimize CH4 production, demonstrates an important prospect to reduce CH4 emissions [14,17], though it may trigger substantial N2O emissions caused by wet-dry cycles of the soil [18]. In recent times, water-saving irrigation of drip irrigation in combination with plastic film mulch, furrow wetting irrigation and intermittent irrigation has been integrated with dry direct-seeding of rice in North China. Study of the integrated effects of rice planting techniques with water-saving irrigation on the yield of rice and GHG emissions is limited. Therefore, measurement of rice yield and GHG emission could provide additional confirmation to elucidate the integrated impact of dry direct-seeding of rice and WSI measures in North China. Therefore, using a two-year field experiment, three water-saving irrigation methods under the dry direct-seeding system in North China were appraised. Our objectives were to evaluate the effects of the improved planting technique and water management practice on rice yield and yield components—CH4 and N2O emissions.

2. Materials and Methods

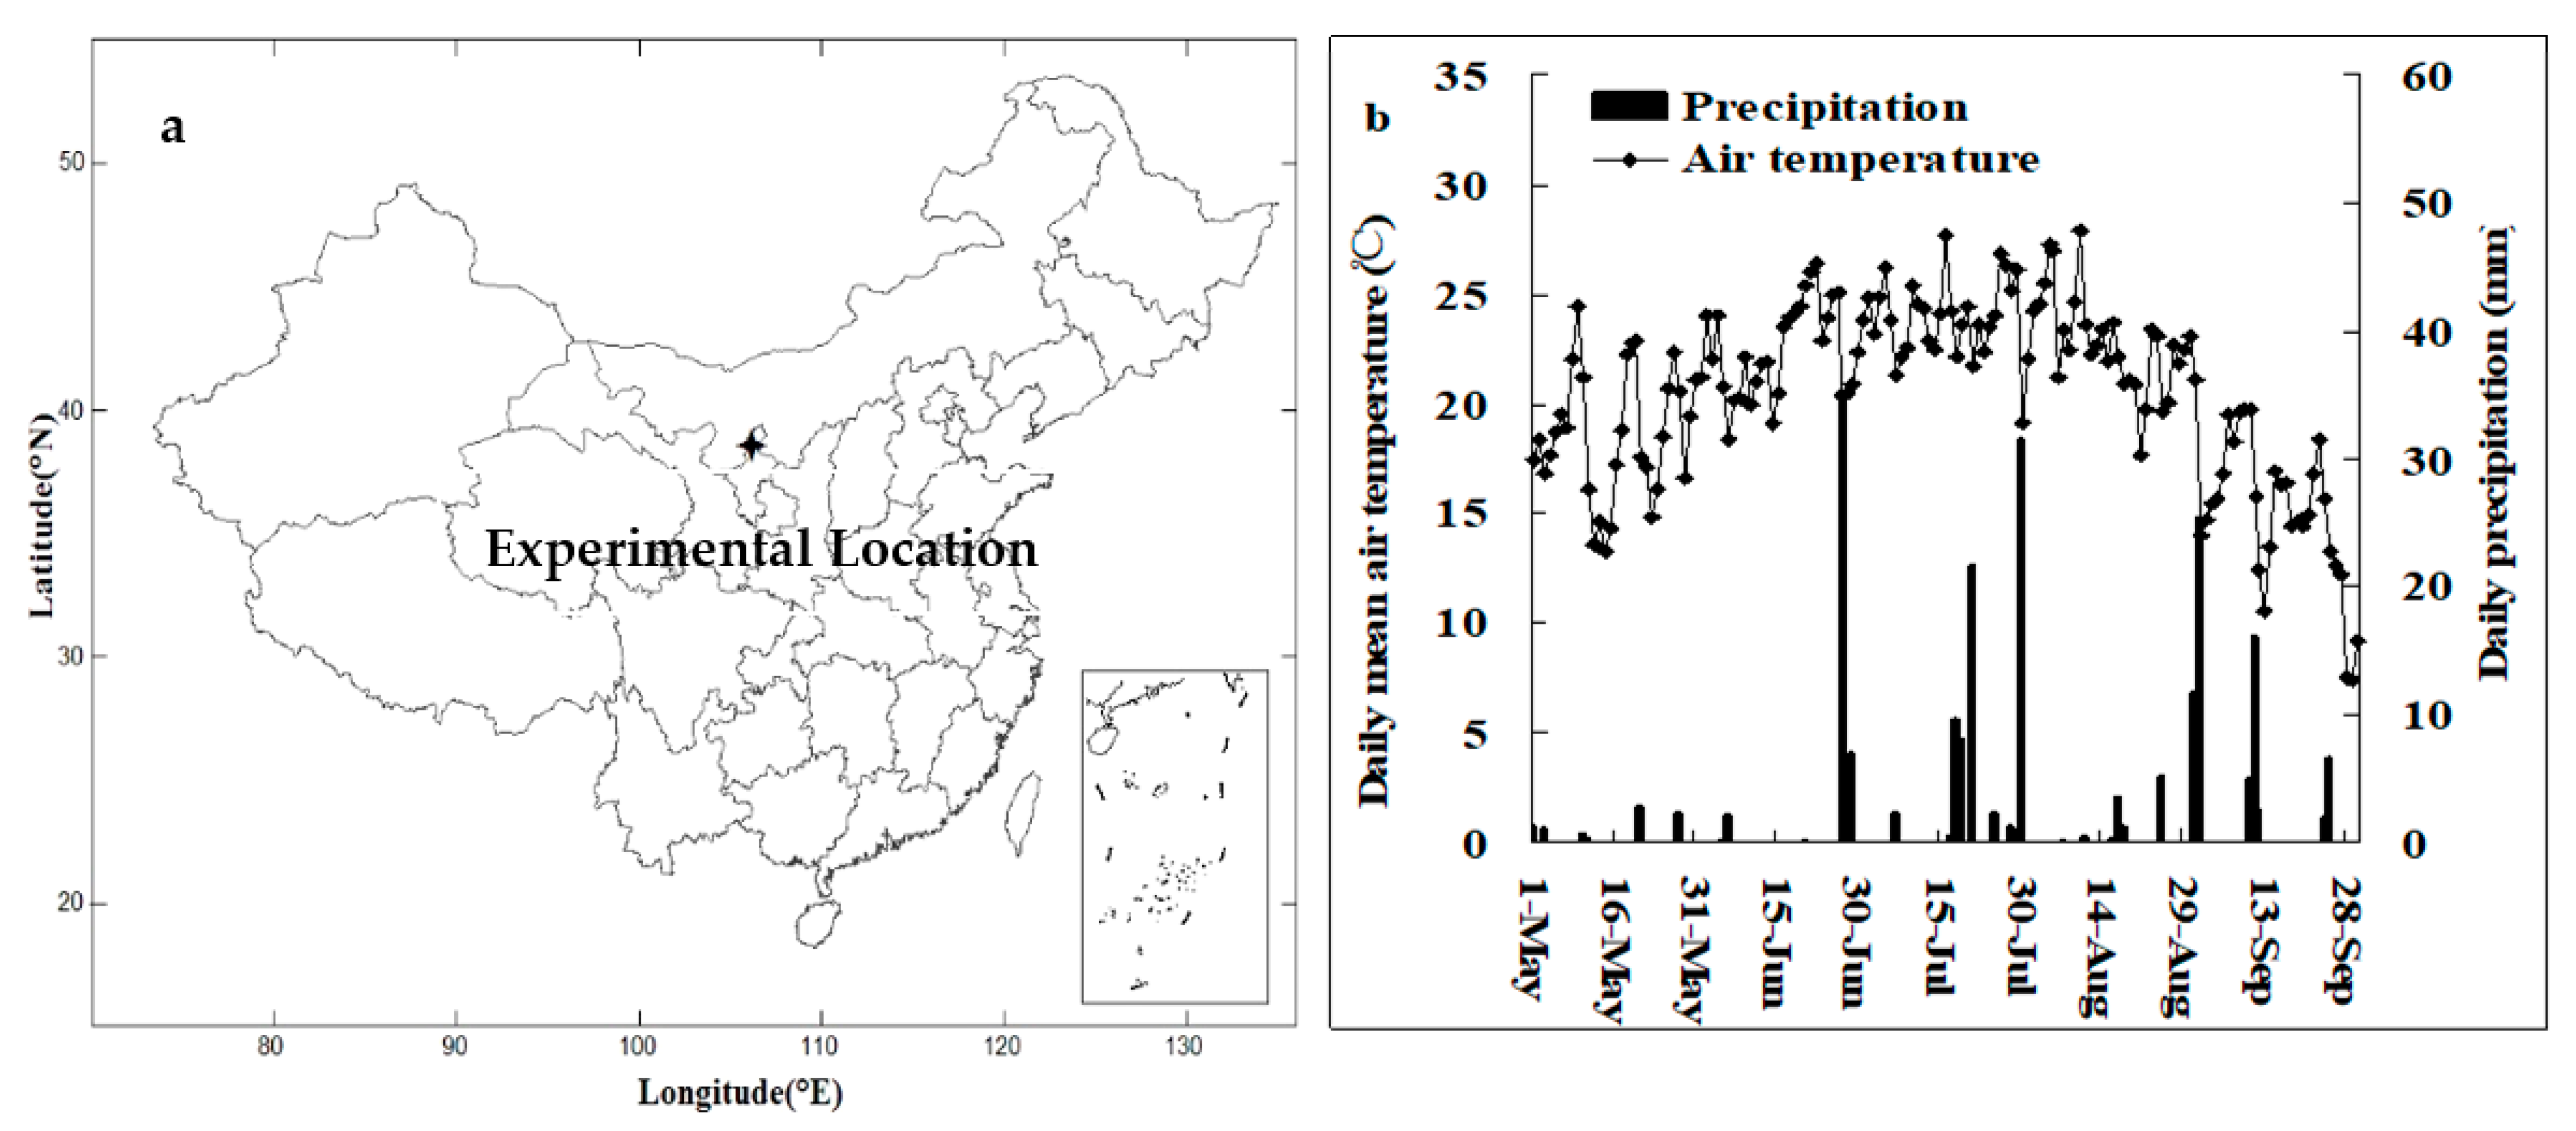
2.1. Experimental Location

The field experimentation was set up in the Yellow River Irrigation Area at the Ling Wu experimental Farm in 2014 and 2015, Yinchuan City (38°12′ N latitude, 106°27′ E longitude), Ningxia Province, China (Figure 1a). The soil type was an irrigating warped soil with the basic chemical properties: organic matter 12.2 g kg1, total salt 1.2 g kg1, total N 0.8 g kg1, available N 57.8 mg kg1, available P 26.5 mg kg1 and available K 141.1 mg kg1. The experimental site is characterized by a temperate arid climate with mean annual temperature and precipitation of 8.5 °C and 200 mm, respectively. The precipitation and air temperatures data obtained from Ling Wu meteorological department during the rice growing seasons in 2015 are shown in Figure 1. Rainfall occurred between June–August and was almost lacking in the course of rice-seed emergence in May. Total rainfall from the seeding stage to maturity stage was 256 mm and 213 mm in 2014 and 2015, respectively. The lowest and the highest daily mean air temperatures were 13.1 °C on 5 May and 27.6 °C on 12 August in 2014, respectively, and 13.3 °C on 14 May and 27.9 °C on 10 August in 2015, respectively. From June until August, air temperature was relatively lower than the optimal temperature required for rice growth.

2.2. Experimental Design

The field experiment was a randomized block design in three replications and consisted of four irrigation treatments, namely: (1) Traditional flood irrigation (CK); (2) Drip irrigation under plastic film mulching with 50 mm irrigation amount at each watering time when the relative soil water content (RSWC) was less than 100% (DI1); (3) Drip irrigation under plastic film mulching with 35 mm irrigation amount at each watering time at the same time of DI1 (DI2) and (4) Furrow wetting irrigation (FWI). The replicate plot sizes of 15 m × 20 m were separated by 30 cm-wide soil ridges covered with plastic film to inhibit water and nutrient exchange between plots.

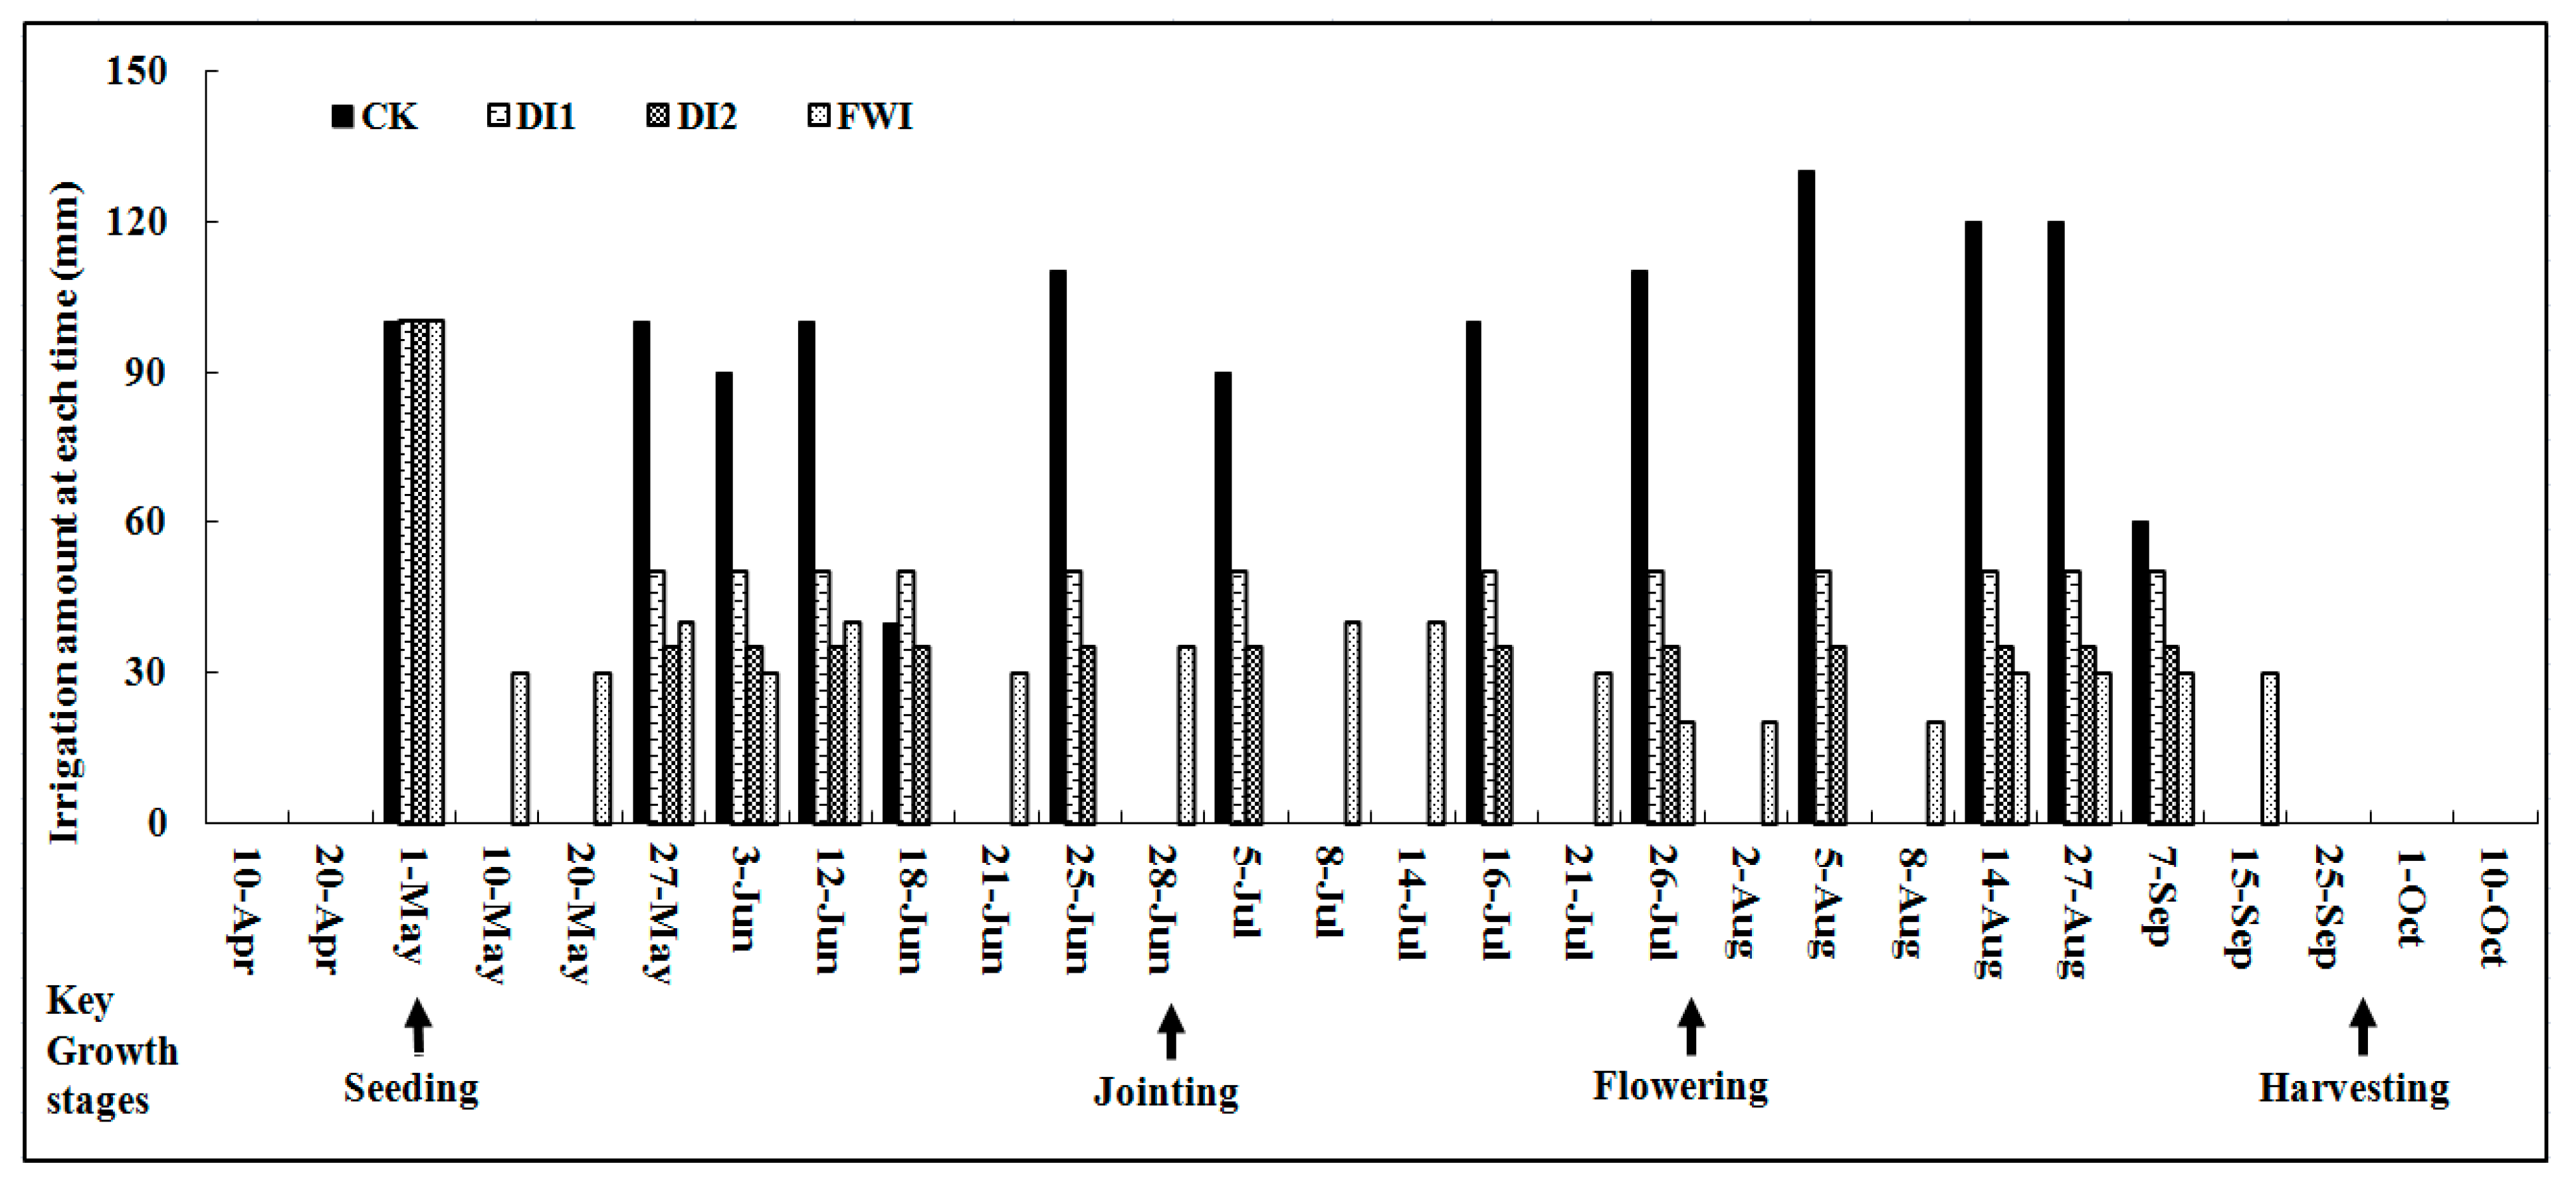
2.3. Water and Crop Management

Land preparation in all the treatments was carried out by ploughing and leveling the soil under dry conditions. The rice variety, Ningjing 31, was directly seeded on 1st May, and harvested between 24–28 September for all the treatments in 2014 and 2015 (Table 1). Based on the local agronomic practices for higher rice yield, similar fertilization rates were adopted for the treatments. The N fertilizer was applied as urea at a rate of 240 kg N ha−1, 40% as basal application before seeding, 30% at the tillering stage and 30% at the panicle initiation stage. Basal phosphorus fertilizer of calcium superphosphate was applied at 112.5 kg ha−1 P2O5, whiles no K fertilizer was added during rice growth (Table 1).
All treatments were flooded with 100 mm of water on 1st May after direct seeding (Figure 2). Subsequently, only the CK followed the traditional continuous flooding. The drip system for DI1 and DI2 consisted of a small pump, a water meter, a control head unit, PVC mainline, polyethylene mains and laterals (Xinjiang Tianye Company, Shihezi, China). DI1 drip irrigated received 50 mm water amount at each irrigating time when the relative soil water content (RSWC) was 0.1 m and below 100%. A similar irrigation schedule was implemented in DI2 except that it received 35 mm of water at each irrigating time. In the furrow wetting irrigation (FWI) treatment, the plots were maintained at moist condition the whole period of rice growth. Each replicate plot of FWI, prior to direct-seeding, was divided into five strips (three meters in width) and separated by furrows (25 cm width and 30 cm in depth). After direct-seeding on the strips, the furrows were filled with water to maintain a constant wet condition on the strips. No obvious water level was retained on the seedling strips during the entire growth period. The water flow of CK and FWI were measured by separated flume flow meter. TDR100 was used to test the RSWC.
Irrigation times for CK, DI1, DI2 and FMI were 13, 13, 13 and 18 days, respectively (Figure 2). The total irrigation amounts were 1270, 700, 520 and 625 mm in the CK, DI1, DI2 and FMI plots, respectively (Table 1). All treatments were subjected to same pesticide and herbicide applications rates according to the local standards for high yields and pest control.

2.4. Greenhouse Gas Sampling

The static closed chamber and gas chromatography methods were adopted to sample and measure CH4 and N2O every 10 days in 2015 [19]. Polyvinyl chloride (PVC) chambers in accordance with the rice height and fitted with a battery-operated fan for thorough gas mixture in the head space were used. Collected gases were analyzed to obtain the concentrations of CH4 and N2O using a gas chromatograph (Agilent 7890A, Santa Clara, CA, USA) mounted with a flame ionization detector (FID) and an electron capture detector (ECD) to detect CH4 and N2O, respectively. The CH4 and N2O fluxes were calculated as:
G = (ΔC/Δt) × (V/A) × α
where G is the gas flux rate (g N2O-N or CH4-C ha−1 d−1), ΔC/Δt designates the increase of gas concentration in the chamber (g L−1 d−1), V is the chamber volume (L), A is area enclosed by the chamber (ha), and α is a conversion coefficient for elemental C (α = 0.749) or N (α = 0.636). The slope of the mixing ratio of four sequential samples was used in the determination of both CH4 and N2O fluxes. Cumulative CH4 and N2O emissions were computed using the formula described by Cai et al. [20].
The area-scaled GHG emission was converted to CO2 equivalent (CO2-eq) as follows:
Area-scaled GHG emission (kg CO2-eq ha−1 yr−1) = 25 × CH4 + 298 × N2O
where, CH4 and N2O represent the seasonal cumulative emissions. Yield-scaled GHG emission was computed by dividing area-scaled emission by yield of rice [21].

2.5. Yield and Yield Components Measurement

A one m2 rice plant at physiological maturity was harvested for yield determination. Grain yield was adjusted to 14% moisture content using the formula:
Yield = GW × (100 − GMC)%/(100 − 14)%
where: GW = Grain weight. GMC = Grain moisture content.
Number of panicles was evaluated by counting the total panicle number per 1 m2 per plot. Spikelet per panicle was evaluated by counting both the filled and unfilled spikelets per 1 m2 randomly taken from each plot. Dry weight of 1000 grains from three replicates samples of filled grains per plot were obtained by drying at 70 °C in the oven for 72 h to constant dry weight.

2.6. Statistical Analyses

The data was analyzed using analysis of one-way variance (SPSS 23.0 for windows) to test the differences among the treatments. The least significant difference (LSD) test was used to compared treatment means (p < 0.05). Microsoft Excel 2003 was used to compute the standard deviation of the means.

3. Results

3.1. Rice Plant Growth and Grain Yield

Differences that were significant at the rice growth stages and biomass production were recorded between irrigation treatments (Table 2). Water-saving irrigation advanced rice heading and maturity stage, resulting in a reduction in the length of the rice growth period. Compared to CK, the primary heading stage was advanced by 2, 1 and 1 day in 2014, and 3, 3 and 2 days in 2015 in the DI1, DI2 and FWI plots, respectively. Consequently, the length of rice growth was shortened by 2, 2 and 1 day(s) in 2014, and 2, 4 and 1 day(s) in 2015 in DI1, DI2 and FWI plots, respectively.
Water-saving irrigation (WSI) practices significantly decreased rice biomass production (Table 2 and Table 3). The lowest aboveground biomass production was found in the DI2 plots. As compared to the CK, the pre-anthesis aboveground biomass production over two study years was 11.1%, 23.2% and 11.6% lower in the DI1, DI2 and FWI plots, respectively while the post-anthesis aboveground biomass production was 23.8%, 44.8% and 16.2% lower in the DI1, DI2 and FWI plots, respectively (Table 2). Consequently, the adoption of water-saving irrigation resulted in a reduction of 15.6%, 30.2 and 13.2% relative to the CK in the DI1, DI2 and FWI plots, respectively (Table 3). Rice yields ranging from 5.9 to 8.7 t ha−1 produced significant differences in the different irrigation treatments (Table 3). The highest yield was found in the CK plot and the lowest existed in the DI2 plot in both years. The choice of DI1, DI2 and FWI produced 10.3%, 32.1% and 8.1% lower rice yield in comparison with CK in 2014, and 11.8%, 34.7% and 10.2% lower in 2015. Non-significant yield differences were noted amid the adoption of CK and FWI in 2014 but were significant in 2015 (Table 3). Water-saving significantly decreased rice panicles per area, with DI2 recording the lowest. The choice of DI1 significantly lowered number of panicles compared to CK. Spikelets per panicle and the 1000-grain weight showed significant variation among the irrigation treatments. Noticeable was the significantly lower spikelets and 1000-grain weight in DI2 plots.

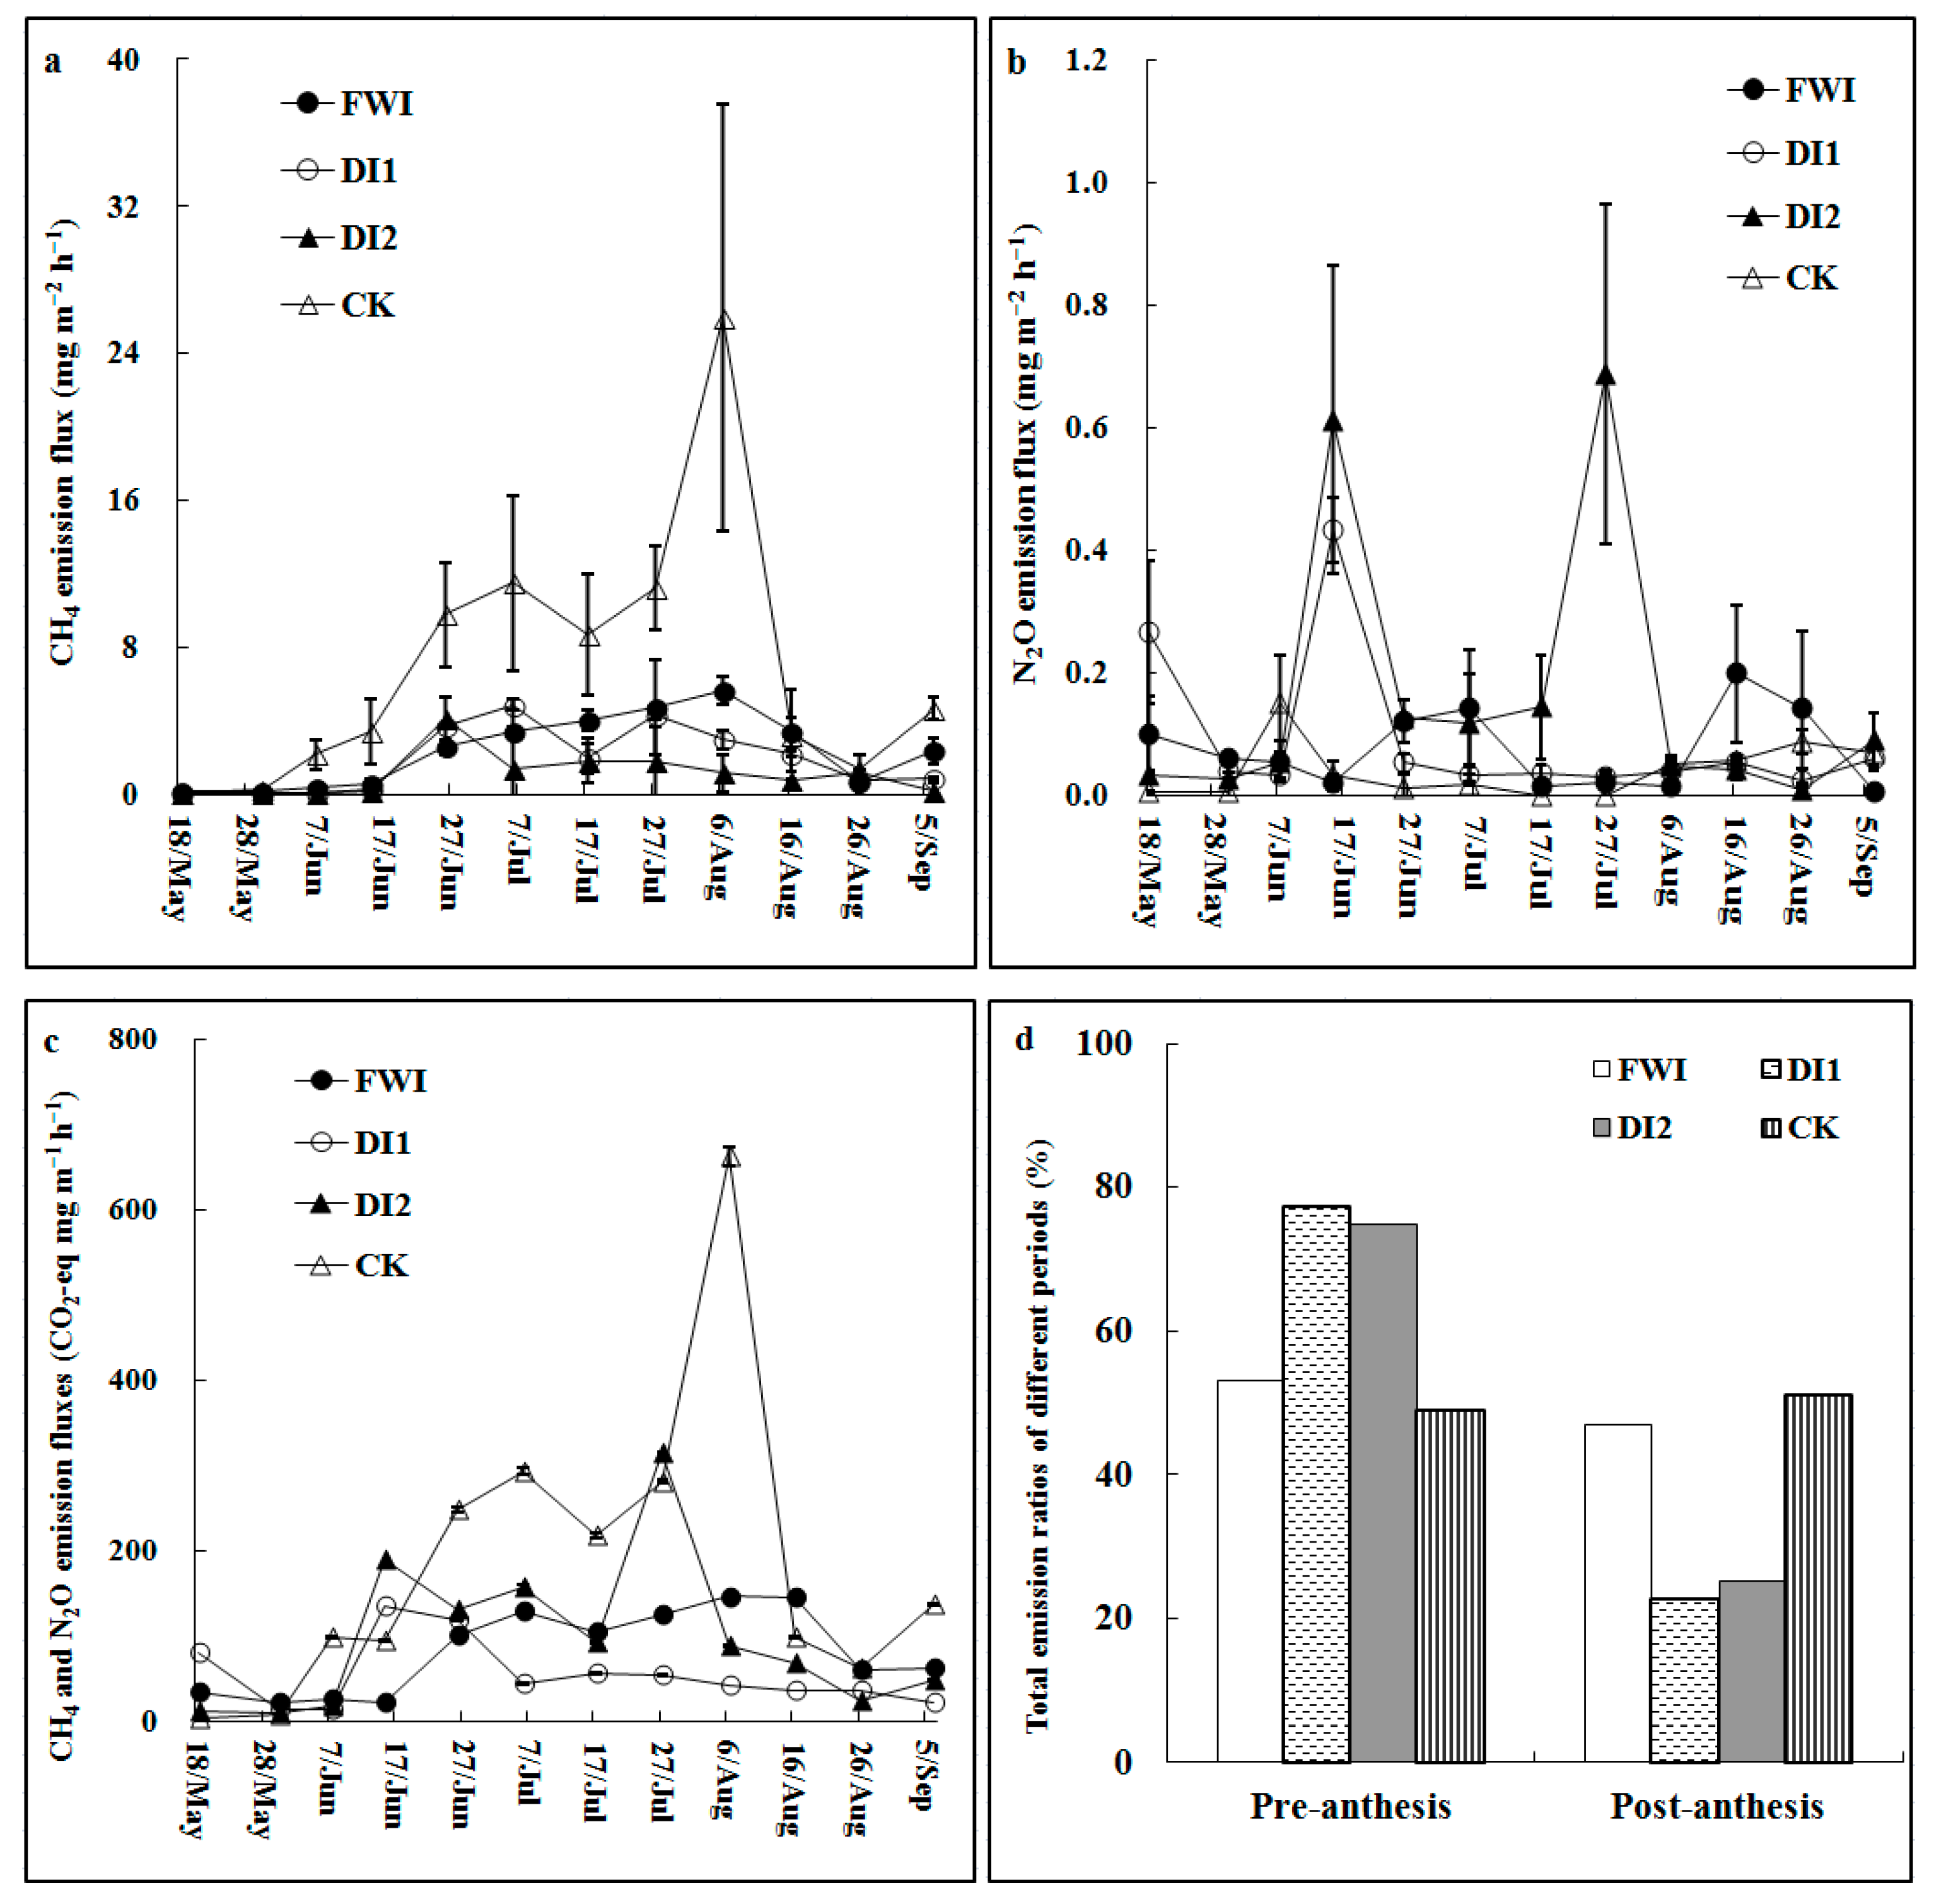
3.2. CH4 and N2O Emission Fluxes and Seasonal Emission Ratios

Similar patterns of CH4 fluxes existed in the irrigation methods (Figure 3a). The maximum emission fluxes occurred during rice heading and flowering stages, and the lowest occurred during the seedling and maturity stages amongst the treatments. The variations of CH4 emission fluxes were similar with the seasonal changes of air temperature (Figure 1b). However, differences of significance in the mean peak CH4 emission fluxes between CK and the other irrigation methods were noted (Figure 3a). No variation of significance in the flux peak existed in the three water-saving methods. The peak mean CH4 emission was noted in the CK plots. The mean flux value was 267, 537 and 191% more in the CK plot compared to those of DI1, DI2 and FWI plots, respectively (p < 0.05). Seasonal variation patterns of N2O fluxes were variable (Figure 3b). The highest flux peaks were noted in the DI1, DI2 treatments while the lowest occurred in the CK plots. The flux in CK was 55.5, 305.1 and 82.5% lower than those in the DI1, DI2 and FWI treatments, respectively. The flux of the total emission at CO2-eq scale was 147, 140 and 126% lower in the DI1, DI2 and FWI treatments compared to the CK plot (Figure 3c). The adoption of DI1 and DI2 recorded higher emission ratios at the pre-anthesis stage compared to FWI and CK (Figure 3d). At the post-anthesis stage a lower emission ratio was noted in DI1 and DI2 in comparison with FWI and CK.

3.3. Water Productivity and Area and Yield-Scaled Emissions

The irrigation methods exhibited significantly different water productivity levels (p < 0.05) (Table 4). The adoption of DI1, DI2 and FWI showed increased water productivity compared to CK. The highest value of water productivity was noted in the FWI plot, whereas the lowest was detected in the CK plot. The water productivity was 88.9, 16.4 and 11.4% higher in the FWI plot than those in the CK, DI1 and DI2 plots, respectively. Using the WSI significantly decreased cumulative emission of CH4 by 73.0, 84.7 and 64.4% in DI1, DI2 and FWI, respectively, compared to CK (Table 4). Also, among the water-saving irrigation, significant differences were noted, with DI2 recording 43.6 and 57.2%, lower cumulative CH4 than DI1 and FWI, respectively. Significantly, cumulative N2O emission was 2.8, 4.1 and 2.0-fold more in DI1, DI2 and FWI than CK. The usage of DI2, triggered a 1.4 and 2.0-fold more cumulative N2O emission compared to DI1 and FWI, respectively. The area-scaled emission in the CK was 129, 141 and 116% higher (p < 0.05) than those in the DI1 and DI2 and FWI plots, respectively. Area-scaled emission amidst the WSI methods recorded no significant variation, though area-scaled emission between WSI and the CK were significantly different. The yield-scaled emission in DI1 and DI2 and FWI were 101.0, 67.5 and 102.0%, respectively, significantly less than CK (p < 0.05). Among the WSI, significant differences in yield-scaled emission were observed, with the lowest yield-scaled emission found in the FWI plot.

4. Discussion

Compared to the traditional continuous flooding, water-saving irrigation (WSI) could increase water productivity [22,23] and maintain or increase rice grain yield [24], although some studies have reported contrary findings [14,25]. The results of this study indicated that the adoption of WSI amplified water-use efficiency but caused a reduction in rice yield (Table 2 and Table 3). A substantial decline in water application may adversely impact rice yield due to sensitivity to non-saturated soil environments [26]. This was very prominent in the drip irrigation with 35 mm irrigation (DI2) arising primarily from limited water for rice biomass and panicle per area development and consequently affecting rice yield (Table 3). This also supports the assertion that irrigation volumes impact WSI [14,24]. Although water-saving irrigation caused rice yield reduction, the drop was significant in DI2 water-saving irrigation methods. He et al. [27] established that yield reduction occurs in extreme water-saving irrigation, owing to inadequate tillers and spikes. The lowest reduction in yield was in FWI, which produced the highest water productivity value (Table 4). This arises due to hastened canopy closure and decreased partial stomatal closure for the period of soil drying cycles, helping to minimize evapotranspiration [28,29], and less percolation of water into the soil [27]. Therefore, the choice of FWI may offer an alternative for maintaining yields while minimizing water consumption. Previous studies show that high ground water mitigates the influence of water-saving irrigation on the growth of rice at the post-anthesis stage [30,31]. In our study, lower groundwater table and precipitation during rice growing season in the two study years could have exacerbated water limitation for rice growth, negatively impacted panicles, spikelet numbers and grain filling, and subsequently significantly reduced the 1000-grain weight (Table 3).
No obvious increases in CH4 emission were recorded at the rice tillering stage (Figure 3a). The non-optimal and relatively lower air temperature of 19.2 °C during rice tillering may have hindered methanogenic activities that stimulate CH4 production during rice growth [32]. The peak flux of CH4 was noticeable at the heading stage for all the treatments, similar to previous works of Chen et al. [13]. Rising daily mean air temperature of more than 25 °C at the rice booting and heading stages, well-developed aerenchyma for CH4 emitting, and increased rice growth that stimulated root-derived exudation for methanogenic activities [15] may explain the peak flux occurring at the heading stage (Figure 3a). Studies show that soil water status affects CH4 formation and emission [17]. In our study, though significant differences were noted in the CH4 emission from the WSI, it did not trigger an exponential increase in CH4 emission in comparison to the CK. Compared to continuous flooding irrigation, WSI irrigation had a superior prospect to decrease CH4 emissions in line with alterations in soil water dynamics [33]. Evidently, a reduction in water use corresponded with a decline in the emission of CH4, especially in DI2. This supports the assertion that WSI shows a significant potential to mitigate CH4 emissions [14]. In comparison with the traditional flooding irrigation, the adoption of WSI substantially triggered N2O emission arising from one or more drainage events and the wet-dry cycles to suppress CH4 production during rice growth [15]. Similar to previous studies [34,35], the adoption of continuous flooding demonstrated higher CH4 emission compared to WSI. The cycle of continuous dry-wet cycles and the smaller amounts of water available in the WSI might have negatively affected CH4 production [36] by inhibiting the formation of soil reductive conditions. A reduction in soil water content via WSI is presumed as a favorable preference for CH4 mitigation. Among the water-saving irrigation practices, the reductions in CH4 emissions in the drip irrigation plots (DI1 and DI2) were significantly higher than that in the furrow wetting irrigation plot (Table 4). This was expounded by the fact that lower soil moisture content, in both DI1 and DI2, stifled the emission of CH4 to a very low-level during rice growth. Our observations support a previous study by Katayanagi et al. [37], who reported a 73% mitigation of CH4 emission via WSI during rice cultivation. Thus, however, these higher reductions in CH4 emissions could not compensate for the higher increases in N2O emissions in the drip irrigation plots. Consequently, the CO2-eq emissions of CH4 and N2O were similar among the three water-saving irrigation methods. Since the reductions in rice yield were higher in the drip irrigation fields compared to that of FWI field, the lowest yield-scaled CO2-eq emission was found in the FWI field.

5. Conclusions

Sustainable water management in direct-seeded rice highlights the importance of adopting water-saving irrigation to reduce GHG emission, increase water productivity and sustain rice yield. In contrast to continuous flooding, WSI caused a decline in CH4 emissions while essentially triggering N2O emission increases. The highest water productivity and rice yield, lower area and yield-scaled emission among the WSI were observed in the adoption of furrow wetting irrigation (FWI). For sustainable direct-seeded rice production under water-saving irrigation in North China, furrow wetting irrigation (FWI) is recommended to sustain rice yield and minimize greenhouse gas emissions.

Author Contributions

Literature search, X.H. and F.D.; figures, X.H. and J.L.; study design, X.H. and J.Z. (Jian Zhang); investigation, X.H. and J.L.; data analysis, D.L. and J.Z. (Jian Zhang); writing—review and editing, X.H., J.Z. (Jian Zhang) and J.Z. (Jun Zhang) All authors have read and agreed to the published version of the manuscript.

Funding

This work was supported by the National Key R&D Program of China (2016YFD0300907).

Institutional Review Board Statement

Not applicable.

Informed Consent Statement

Not applicable.

Data Availability Statement

The data presented in this study are available on request from the authors.

Conflicts of Interest

The authors declare no conflict of interest.

References

  1. Livsey, J.; Katterer, T.; Vico, G.; Lyon, S.W.; Lindborg, R.; Scaini, A.; Da, C.T.; Manzoni, S. Do alternative irrigation strategies for rice cultivation decrease water footprints at the cost of long-term soil health? Environ. Res. Lett. 2019, 14, 074011. [Google Scholar] [CrossRef]
  2. Maraseni, T.N.; Deo, R.C.; Qu, J.; Gentle, P.; Neupane, P.R. An international comparison of rice consumption behaviours and greenhouse gas emissions from rice production. J. Clean. Prod. 2018, 172, 2288–2300. [Google Scholar] [CrossRef]
  3. Campbell, B.M.; Beare, D.J.; Bennett, E.M.; Hall-Spencer, J.M.; Ingram, J.S.I.; Jaramillo, F.; Ortiz, R.; Ramankutty, N.; Sayer, J.A.; Shindell, D. Agriculture production as a major driver of the Earth system exceeding planetary boundaries. Ecol. Soc. 2017, 22, 8. [Google Scholar] [CrossRef]
  4. Liu, J.; Yang, H.; Gosling, S.N.; Kummu, M.; Flörke, M.; Hanasaki, N.; Wada, Y.; Zhang, X.; Zheng, C. Water scarcity assess-ments in the past, present, and future. Earth’s Future 2017, 5, 545–559. [Google Scholar] [CrossRef] [PubMed]
  5. Enriquez, Y.; Yadav, S.; Evangelista, G.K.; Villanueva, D.; Burac, M.A.; Pede, V. Disentangling Challenges to Scaling Alter-nate Wetting and Drying Technology for Rice Cultivation: Distilling Lessons from 20 Years of Experience in the Philip-pines. Front. Sustain. Food Syst. 2021, 5, 675818. [Google Scholar] [CrossRef]
  6. Dalin, C.; Qiu, H.; Hanasaki, N.; Mauzerall, D.L.; Rodriguez-Iturbe, I. Balancing water resource conservation and food security in China. Proc. Natl. Acad. Sci. USA 2015, 112, 4588–4593. [Google Scholar] [CrossRef] [Green Version]
  7. Xu, C.C.; Zhou, X.Y.; Li, F.B.; Fang, F.P. Northward research of Chinese rice production. Issues Agric. Econ. 2013, 7, 5. (In Chinese) [Google Scholar]
  8. Jiang, S.; Wang, J.; Zhao, Y.; Shang, Y.; Gao, X.; Li, H.; Wang, Q.; Zhu, Q. Sustainability of water resources for agriculture considering grain production, trade and consumption in China from 2004 to 2013. J. Clean. Prod. 2017, 149, 1210–1218. [Google Scholar] [CrossRef] [Green Version]
  9. Wang, H.; Bouman, B.A.M.; Zhao, D.; Wang, C.; Moya, P.F. Aerobic rice in northern China: Opportunities and challenges. In Water-Wise Rice Production; Bouman, B.A.M., Hengsdijk, H., Hardy, B., Bindraban, P.S., Tuong, T.P., Ladha, J.K., Eds.; International Rice Research Institute: Los Banos, Philippines, 2022; pp. 143–154. [Google Scholar]
  10. Schewe, J.; Heinke, J.; Gerten, D.; Haddeland, I.; Arnell, N.W.; Clark, D.B.; Dankers, R.; Eisner, S.; Fekete, B.M.; Colón-González, F.J.; et al. Multimodel assessment of water scarcity under climate change. Proc. Natl. Acad. Sci. USA 2014, 111, 3245–3250. [Google Scholar] [CrossRef] [Green Version]
  11. Wassmann, R.; Pasco, R.; Zerrudo, J.; Ngo, D.M.; Vo, T.B.T.; Sander, B.O. Introducing a new tool for greenhouse gas calcula-tion tailored for cropland: Rationale, operational framework and potential application. Carbon Manag. 2019, 10, 79–92. [Google Scholar] [CrossRef]
  12. Leahy, S.; Clark, H.; Reisinger, A. Challenges and Prospects for Agricultural Greenhouse Gas Mitigation Pathways Consistent with the Paris Agreement. Front. Sustain. Food Syst. 2020, 4, 69. [Google Scholar] [CrossRef]
  13. Chen, W.; Wang, Y.; Zhao, Z.; Cui, F.; Gu, J.; Zheng, X. The effect of planting density on carbon dioxide, methane and ni-trous oxide emissions from a cold paddy field in the Sanjiang Plain, northeast China. Agric. Ecosyst. Environ. 2013, 178, 64–67. [Google Scholar] [CrossRef]
  14. Xu, Y.; Ge, J.; Tian, S.; Li, S.; Nguy-Robertson, A.L.; Zhan, M.; Cao, C. Effects of water-saving irrigation practices and drought resistant rice variety on greenhouse gas emissions from a no-till paddy in the central lowlands of China. Sci. Total Environ. 2015, 505, 1043–1052. [Google Scholar] [CrossRef] [PubMed]
  15. Li, X.; Yuan, W.; Xu, H.; Cai, Z.; Yagi, K. Effect of timing and duration of midseason aeration on CH4 and N2O emissions from irrigated lowland rice paddies in China. Nutr. Cycl. Agroecosystems 2011, 91, 293–305. [Google Scholar] [CrossRef]
  16. Li, S.X.; Wang, Z.H.; Stewart, B.A. Responses of Crop Plants to Ammonium and Nitrate N. Adv. Agron. 2013, 118, 205–397. [Google Scholar] [CrossRef]
  17. Li, J.L.; Li, Y.E.; Wan, Y.F.; Wang, B.; Waqas, M.A.; Cai, W.W.; Guo, C.; Zhou, S.H.; Su, R.S.; Qin, X.B.; et al. Combination of modified nitrogen fertilizers and water saving irrigation can reduce greenhouse gas emissions and in-crease rice yield. Geoderma 2017, 315, 1–10. [Google Scholar] [CrossRef]
  18. Wang, J.Y.; Jia, J.X.; Xiong, Z.Q.; Khalil, M.A.K.; Xing, G. Water regime–nitrogen fertilizer–straw incorporation interaction: Field study on nitrous oxide emissions from a rice agroecosystem in Nanjing, China. Agric. Ecosyst. Environ. 2011, 141, 437–446. [Google Scholar] [CrossRef]
  19. Zou, J.W.; Huang, Y.; Jiang, J.Y.; Zheng, X.H.; Sass, R.L. A 3-year field measurement of methane and nitrous oxide emissions from rice paddies in China: Effects of water regime, crop residue, and fertilizer application. Glob. Biogeochem. Cycles 2005, 19, GB2021. [Google Scholar] [CrossRef]
  20. Cai, Y.; Ding, W.; Luo, J. Nitrous oxide emissions from Chinese maize—Wheat rotation systems: A 3-year field measurement. Atmos. Environ. 2013, 65, 112–122. [Google Scholar] [CrossRef]
  21. Feng, J.; Chen, C.; Zhang, Y.; Song, Z.; Deng, A.; Zheng, C.; Zhang, W. Impacts of cropping practices on yield-scaled green-house gas emissions from rice fields in China: A meta-analysis. Agric. Ecosyst. Environ. 2013, 164, 220–228. [Google Scholar] [CrossRef]
  22. Fan, M.S.; Liu, X.J.; Jiang, R.F.; Zhang, F.S.; Lu, S.H.; Zeng, X.; Christie, Z.P. Crop yields, internal nutrient efficiency, and changes in soil properties in rice—Wheat rotations under non-flooded mulching cultivation. Plant Soil. 2005, 277, 265–276. [Google Scholar] [CrossRef] [Green Version]
  23. Zhang, Z.; Zhang, S.; Yang, J.; Zhang, J. Yield, grain quality and water use efficiency of rice under non-flooded mulching cultivation. Field Crop. Res. 2008, 108, 71–81. [Google Scholar] [CrossRef]
  24. Liu, L.; Chen, T.; Wang, Z.; Zhang, H.; Yang, J.; Zhang, J. Combination of site-specific nitrogen management and alternate wetting and drying irrigation increases grain yield and nitrogen and water use efficiency in super rice. Field Crop. Res. 2013, 154, 226–235. [Google Scholar] [CrossRef]
  25. Linquist, B.A.; Anders, M.M.; Adviento-Borbe, M.A.A.; Chaney, R.L.; Nalley, L.L.; da Rosa, E.F.F.; Van Kessel, C. Reducing greenhouse gas emissions, water use, and grain arsenic levels in rice systems. Glob. Chang. Biol. 2015, 21, 407–417. [Google Scholar] [CrossRef] [PubMed]
  26. Kumar, A.; Nayak, A.K.; Pani, D.R.; Das, B.S. Physiological and morphological responses of four different rice cultivars to soil water potential based deficit irrigation management strategies. Field Crop. Res. 2017, 205, 78–94. [Google Scholar] [CrossRef]
  27. He, G.; Wang, Z.; Cui, Z. Managing irrigation water for sustainable rice production in China. J. Clean. Prod. 2019, 245, 118928. [Google Scholar] [CrossRef]
  28. Kadiyala, M.D.M.; Jones, J.W.; Mylavarapu, R.S.; Li, Y.C.; Reddy, M.D. Identifying irrigation and nitrogen best management practices for aerobic rice–maize cropping system for semi-arid tropics using CERES-rice and maize models. Agric. Water Manag. 2015, 149, 23–32. [Google Scholar] [CrossRef] [Green Version]
  29. Du, T.S.; Kang, S.Z.; Zhang, J.H.; Davies, W.J. Deficit irrigation and sustainable water-resource strategies in agriculture for China’s food security. J. Exp. Bot. 2015, 66, 2253–2269. [Google Scholar] [CrossRef]
  30. Kreye, C.; Dittert, K.; Zheng, X.; Zhang, X.; Lin, S.; Tao, H.; Sattelmacher, B. Fluxes of methane and nitrous oxide in wa-ter-saving rice production in north China. Nutr. Cycl. Agroecosyst. 2007, 77, 293–304. [Google Scholar] [CrossRef]
  31. Yang, S.; Peng, S.; Hou, H.; Xu, J. Controlled irrigation and drainage of a rice paddy field reduced global warming potential of its gas emissions. Arch. Agron. Soil Sci. 2013, 60, 151–161. [Google Scholar] [CrossRef]
  32. Chan, A.S.K.; Parkin, T.B. Methane Oxidation and Production Activity in Soils from Natural and Agricultural Ecosystems. J. Environ. Qual. 2001, 30, 1896–1903. [Google Scholar] [CrossRef] [Green Version]
  33. Scheer, C.; Grace, P.R.; Rowlings, D.W.; Payero, J. Nitrous oxide emissions from irrigated wheat in 561 Australia: Impact of irrigation management. Plant Soil. 2012, 359, 351–362. [Google Scholar] [CrossRef] [Green Version]
  34. Ahmad, S.; Li, C.; Dai, G.; Zhan, M.; Wang, J.; Pan, S.; Cao, C. Greenhouse gas emission from direct seeding paddy field under different rice tillage systems in central China. Soil Tillage Res. 2009, 106, 54–61. [Google Scholar] [CrossRef]
  35. Tyagi, L.; Kumari, B.; Singh, S. Water management—A tool for methane mitigation from irrigated paddy fields. Sci. Total Environ. 2010, 408, 1085–1090. [Google Scholar] [CrossRef] [PubMed]
  36. Estop-Aragonés, C.; Knorr, K.H.; Blodau, C. Belowground in situ redox dynamics and methanogenesis recovery in a de-graded fen during dry-wet cycles and flooding. Biogeosciences 2013, 10, 421–436. [Google Scholar] [CrossRef] [Green Version]
  37. Katayanagi, N.; Furukawa, Y.; Fumoto, T.; Hosen, Y. Validation of the DNDC-Rice model by using CH4and N2O flux data from rice cultivated in pots under alternate wetting and drying irrigation management. Soil Sci. Plant Nutr. 2012, 58, 360–372. [Google Scholar] [CrossRef]
Figure 1. Experimental location (a) and daily mean air temperature and daily precipitation (b) of rice cropping seasons in 2015.
Agriculture 12 00937 g001
Figure 2. Irrigation at each watering period during the rice cropping seasons.
Agriculture 12 00937 g002
Figure 3. Differences in CH4 (a), N2O (b), CO2 equivalent of CH4 and N2O (c) emission fluxes and emission ratios of pre- and post-anthesis periods (d) in irrigation plots.
Agriculture 12 00937 g003
Table 1. Mode and timing of experimental field management practices in the four irrigation regimes.
PracticeCKDI1 and DI2FWI
Land preparation and seed sowing methodPloughing, Dry direct seedingPloughing, Dry direct seedingPloughing and furrowing, Dry direct seeding
Fertilization amount and timing N fertilizer: 240 kg N ha–1 as urea, 40% applied before seeding, 30% at tillering stage, 30% at panicle stage;
P fertilizer: 112.5 kg P2O5 ha–1 as Ca(H2PO4)2, applied before seeding.
All fertilizers were applied by hand onto the soil surface.
N fertilizer: 240 kg N ha–1 as urea, 40% applied before seeding, 30% at tillering stage, 30% at panicle stage;
P fertilizer: 112.5 kg P2O5 ha–1 as Ca(H2PO4)2, applied before seeding.
All fertilizers were dissolved in the irrigation water and applied through drip water flow during watering.
N fertilizer: 240 kg N ha–1 as urea, 40% applied before seeding, 30% at tillering stage, 30% at panicle stage;
P fertilizer: 112.5 kg P2O5 ha–1 as Ca(H2PO4)2, applied before seeding.
All fertilizers were hand applied directly to the soil surface.
Plastic film mulchingNonePlastic film mulching before seedingNone
Irrigation methodsContinuous floodingDrip irrigation with 50 mm at each watering time when RSWC was below 100%Drip irrigation with 35 mm at the watering time when RSWC was below 100%The furrows constantly supplied with water to maintain moist condition in the strips during the entire rice growing period
Seeding and harvesting datesDirect seeding on 1 May; Harvested on 28 SeptemberDirect seeding on 1 May; Harvested on 24–26 SeptemberDirect seeding on 1 May; Harvested on 27 September
Total irrigation amount1270 mm700 mm 520 mm625 mm
Table 2. Impact of irrigation on rice growth stages and aboveground biomass at pre- and post-anthesis phases.
TreatmentHeading StageMaturity StageBiomass Production
Date
(MM-DD)
Advanced
Day(s)
Date
(MM-DD)
Advanced
Day(s)
Pre-Anthesis
Period (t ha−1)
Post-Anthesis
Period (t ha−1)
2014
CK07-29-09-25-9.4 ± 0.25.2 ± 0.2
DI107-27209-2328.5 ± 0.34.1 ± 0.2
DI207-28109-2327.6 ± 0.13.2 ± 0.3
FWI07-28109-2418.6 ± 0.34.5 ± 0.3
2015
CK07-31-09-26-9.6 ± 0.15.3 ± 0.1
DI107-28309-2428.4 ± 0.43.9 ± 0.6
DI207-28309-2247.0 ± 0.22.6 ± 0.4
FWI07-29209-2518.2 ± 0.24.3 ± 0.5
CK (Traditional flood irrigation); DI1 (Drip irrigation under plastic film mulching with 50 mm irrigation); DI2 (Drip irrigation under plastic film mulching with 35 mm irrigation); FWI (Furrow wetting irrigation).
Table 3. Rice yield and yield components as impacted by water-saving irrigation.
TreatmentRice Yield
(t ha−1)
Number of Panicles
(m−2)
Spikelets Panicle−11000-Grain Weight
(g)
2014
CK8.7 ± 0.2 a430.2 ± 8.6 a98.9 ± 1.6 a24.8 ± 0.2 a
DI17.8 ± 0.3 b412.5 ± 7.9 b97.4 ± 1.2 a24.2 ± 0.1 b
DI26.2 ± 0.3 c356.8 ± 12.6 c95.3 ± 1.4 b22.1 ± 0.2 c
FWI8.2 ± 0.3 ab416.2 ± 11.3 ab98.1 ± 1.5 a24.4 ± 0.1 b
2015
CK8.5 ± 0.1 a442.0 ± 6.2 a100.0 ± 2.1 a24.7 ± 0.1 a
DI17.5 ± 0.2 b403.7 ± 8.4 b96.6 ± 1.7 ab23.7 ± 0.1 c
DI25.9 ± 0.3 c301.0 ± 10.1 c94.3 ± 1.7 b21.8 ± 0.1 d
FWI7.9 ± 0.2 b411.0 ± 11.6 b99.2 ± 2.0 a24.1 ± 0.1 b
CK (Traditional flood irrigation); DI1 (Drip irrigation under plastic film mulching with 50 mm irrigation); DI2 (Drip irrigation under plastic film mulching with 35 mm irrigation); FWI (Furrow wetting irrigation). Different letters in the same column shows significant differences at p < 0.05.
Table 4. Impact of water-saving irrigation on cumulative CH4, N2O emissions, area and yield-scaled emissions and water productivity.
TreatmentCH4
(kg CO2-eq ha−1)
N2O
(kg CO2-eq ha−1)
Area-Scaled Emission (kg CO2-eq ha−1)Yield-Scaled Emission
(kg CO2-eq t−1)
Water Productivity
(kg m−3)
Pre-AnthesisPost-AnthesisTotal
CK5212.7 ± 1288.5 a364.0 ± 41.4 c2924.2 ± 998.7 a2652.5 ± 411.7 a5576.7 ± 1309.1 a656.1 ± 130.2 a0.66 ± 0.02 c
DI11406.7 ± 148.3 c1033.1 ± 221.0 ab1415.7 ± 175.2 b410.2 ± 31.7 d2439.8 ± 121.8 b325.5 ± 24.4 c1.08 ± 0.04 b
DI2792.8 ± 101.7 d1517.4 ± 271.3 a2195.8 ± 235.4 a728.3 ± 142.7 c2310.2 ± 182.2 b391.6 ± 27.1 b1.13 ± 0.03 ab
FWI1853.1 ± 187.7 b731.4 ± 129.4 b1369.5 ± 135.7 b1215.0 ± 134.7 b2584.5 ± 221.2 b325.3 ± 19.4 c1.26 ± 0.05 a
CK (Traditional flood irrigation); DI1 (Drip irrigation under plastic film mulching with 50 mm irrigation); DI2 (Drip irrigation under plastic film mulching with 35 mm irrigation); FWI (Furrow wetting irrigation). Different letters in the same column shows significant differences at p < 0.005.
Publisher’s Note: MDPI stays neutral with regard to jurisdictional claims in published maps and institutional affiliations.

