Article

Effects of Slow Pyrolysis Biochar on CO2 Emissions from Two Soils under Anaerobic Conditions

1
Department of Soil Physics, Physical Chemistry and Biophysics, Agrophysical Research Institute, 195220 St. Petersburg, Russia
2
Department of Soil Science, Institute of Agronomic Sciences, Faculty of Agrobiology and Food Resources, Slovak University of Agriculture, 94901 Nitra, Slovakia
3
Institute of Landscape Engineering, Faculty of Horticulture and Landscape Engineering, Slovak University of Agriculture, 94976 Nitra, Slovakia
*
Author to whom correspondence should be addressed.
Agriculture 2022, 12(7), 1028; https://doi.org/10.3390/agriculture12071028
Submission received: 8 June 2022 / Revised: 11 July 2022 / Accepted: 12 July 2022 / Published: 14 July 2022
(This article belongs to the Section Agricultural Soils)

Abstract

:
The amendment of sandy Haplic Arenosol and clayey loam Gleyic Fluvisol with two rates of biochar derived from the slow pyrolysis of wood feedstock was evaluated under anaerobic conditions in a 63-day laboratory experiment. The rates of biochar were 15 and 30 t ha−1. Both rates of biochar were applied either with or without 90 kg ha−1 of nitrogen fertilizer (NH4NO3). Soils with no amendments were used as control treatments. Our results showed that only the incorporation of 15 t ha−1 of biochar, compared with the control treatment, led to a significant (p < 0.05) increase in volumetric water content of the sandy soil and a significant (p < 0.05) decrease in the parameters of the clayey loam soil. Increasing the biochar rate from 15 to 30 t ha−1 did not result in significant changes in volumetric water content in either type of soil. In the sandy soil, CO2 emissions were significantly (p < 0.05) higher in the treatments of 15 and 30 t ha−1 with N fertilizer compared with the control and N fertilizer treatment. In the clayey loam soil, the combined application of both rates of biochar with N fertilizer caused no significant increase in CO2 emissions compared with the control and N fertilizer treatment. The incorporation of 30 t ha−1 of biochar into the sandy soil contributed to a significant (p < 0.01) increase in the cumulative CO2 flux compared with the control treatment. Application of 15 and 30 t ha−1 of biochar into the clayey loam soil led, respectively, to a significant (p < 0.05) and a nonsignificant increase in the cumulative CO2 fluxes compared with the control treatment.

1. Introduction

One of the main challenges of modern agriculture is resource conservation, based on the principle of protecting the environment. By regulating the land-based placement of waste, we can enhance long-term carbon sequestration in the soil and mitigate the amounts of greenhouse gas emissions released into the atmosphere. An increase in the carbon sequestration in the soil is associated with changes in land use or with changes in agricultural management practices.
In recent decades, scientists have proposed converting renewable biomass, which is not suitable for direct use in the economy, into biochar. Biochar is a carbon-rich product that occurs when biomass (wood, manure, and crop residues) is heated in pyrolysis chambers (at temperatures up to 900 °C) with little or no available oxygen [1,2,3,4,5]. Biochar has the potential to enhance atmospheric carbon sequestration because of its high chemical stability [6,7,8]. Biochar sequestration can be carbon-negative and therefore contribute to CO2 removal from the atmosphere, with implications for the mitigation of climate change. Biochar can be used in agriculture as its long-term stability in soils make it a useful soil conditioner [9,10,11].
The composition of initial feedstock for biochar production, pyrolysis temperature, and time of heating are crucial factors that can affect the properties of the final product. Biochars produced under different conditions can have different physical (bulk density and porosity), physico-chemical (pH, cation exchange capacity, surface area, and oxygen-containing functional groups), and chemical (total carbon, nitrogen, and hydrogen content) properties, which, in due course, can have positive, neutral, or negative effects on soil properties [1,12,13,14].
Incorporation of biochars into soil can improve soil structure [15], increase organic carbon content [16,17], soil porosity [18,19], saturated hydraulic conductivity [20,21], available water content [22,23], and decrease soil bulk density [24,25]. These favorable biochar-induced changes in the physical properties of soil can increase nitrogen availability [8,26].
Despite the positive feedback from the scientific community on the usage of biochar, there are critical knowledge gaps that exist in the literature. These include knowledge about the availability of plant nutrients in soil under the effect of biochar and the possibility of a priming effect of biochar application on soil organic matter [27]. Incorporation of fresh, non-oxidized biochar to soils can result in an increase in CO2 emissions because of mineralization (priming effect), mainly of labile forms of soil organic matter. These forms of soil organic matter do not participate in the humification of the clay fraction of soil [28,29,30]. Nevertheless, the intensity of mineralization of labile organic compounds could decrease with an increasing degree of biochar oxidation, related to its long-term stay in the soil [31]. However, there remains a need for further research on changes in the degree of the slow or fast pyrolysis-induced aromatization of biochar, and mineralization of its aliphatic structures affected by soil biotic (microorganisms) and abiotic (moisture content, temperature, specific heat, thermal conductivity, and nitrogen availability) factors. These factors also affect the intensity of carbon sequestration in soils and CO2 emissions from soils under different physical and physico-chemical conditions [32,33,34,35].
Slow pyrolysis biochars, in comparison with fast pyrolysis biochars, often demonstrate higher porosity, a higher content of nutrients and organic substances, and, as a result, a greater ability to improve soil aeration and microbial conditions to mitigate CO2 emissions from soils [36]. However, an increase in soil bulk density and a decrease in aerated pore volume following heavy rains, for instance, can result in the formation of soil anaerobic conditions, which contribute to the increasing rate of CO2 emissions from soils. The increase in the rate of CO2 emissions from soils, even those amended with biochars and nitrogen fertilizers, can be induced by enhancing microbial mineralization of soil organic matter or the aliphatic structures of biochars [37,38,39]. On one hand, under anaerobic soil conditions, biochars have the potential to decrease anaerobiosis in coarse-textured soils, but not in fine-textured soils, which have a higher water retention capacity because of a higher content of clay particles and greater volume of micropores. On the other hand, water-saturated, porous biochars themselves can contribute to the formation of anaerobic conditions in soils. Therefore, the mechanisms behind the different effects of biochars on carbon transformation and CO2 emissions from soils under anaerobic conditions remain obscure.
The objective of this study was to assess the effects of two rates of slow pyrolysis biochar on CO2 emissions from sandy and clayey loam soils under anaerobic conditions. It was hypothesized that both rates of the biochar would be more effective in decreasing CO2 emissions from the sandy soil than from the clayey loam soil, under similar anaerobic conditions.

2. Materials and Methods

2.1. Experimental Site

A 63-day laboratory experiment was carried out to fulfill the study objectives. The two studied soils were classified as Haplic Arenosol (sandy soil) and Gleyic Fluvisol (clayey loam soil) and were located in Rišňovce (48°21′788″ N, 17°54′685″ E) and Janíkovce (N48°6′933″ N, 18°07′031″ E), Slovakia, respectively. Disturbed soil samples were collected from the upper 0–20 cm layers. The sandy soil contained 924 g kg−1 of sand, 53 g kg−1 of silt, and 5 g kg−1 of clay, whereas the clayey loam soil contained 288 g kg−1 of sand, 417 g kg−1 of silt, and 295 g kg−1 of clay. Soil organic carbon content in the sandy soil ranged from 12.95 to 13.19 g C kg−1 soil and in the clayey loam soil, from 15.86 to 16.20 g C kg−1 soil. Values of soil pH (KCl) were equal to 6.83 (sandy soil) and 6.25 (clayey loam soil).
Biochar (BC) was produced from branch clippings of broad-leaved trees at a temperature of 500–600 °C in a Pyreg reactor (Pyreg GmbH, Dörth, Germany). The diameter of BC particles was ≤3 mm. The physico-chemical properties of BC included: a specific surface area of 123 m2 g−1, 6.20% oxygen, 0.63% hydrogen, 76.7% carbon, 0.64% nitrogen, and a pH (KCl) of 9.1. We used the Hekatech Euro EA elemental analyzer (Wegberg, Germany) to measure concentrations of the elements.

2.2. Experimental Design

The laboratory pot trial was conducted with the following treatments:
  • Control (soils without BC or nitrogen fertilizer);
  • Soil with ammonium nitrate (NH4NO3) fertilizer (90 kg N ha−1);
  • Soil with 15 t ha−1 of BC;
  • Soil with 15 t ha−1 of BC and NH4NO3 (90 kg N ha−1);
  • Soil with 30 t ha−1 of BC;
  • Soil with 30 t ha−1 of BC and NH4NO3 (90 kg N ha−1).
Before the experiment, air-dried soil samples were mixed with the BC and N fertilizer and moistened to the field capacity. The field capacity of both soils was considered 50–55% of the full saturation. The full saturation of the sandy soil ranged from 50 to 58% (of weight) and of the clayey loam soil, from 62 to 66% (of weight). The moistened soil samples were placed into steel pots (95 cm3). The amount of soil in every steel pot was equal to 120–125 g (dry weight). The specific surface area of the steel pot was 19.625 cm2. The selected rates of BC were 15 and 30 t ha−1. These rates of the BC in t ha−1 were converted into rates in g cm−2, and then into rates in g per pot, and were equal to 2.94 g and 5.88 g per pot, respectively. The recalculated rate of nitrogen fertilizer (90 kg N ha−1) was equal to 0.08 g per pot. The 63-day incubation of soil samples was conducted at room temperature. The soil samples in pots were regularly weighed to maintain the required moisture content in both soils for all treatments. The experiment was carried out in six replicates.
To measure CO2 emissions, the soil pots were placed into plastic vessels (1000 cm3) with airtight lids equipped with sealed rubber septa. For every air sampling, the plastic vessels were sealed for 20 min and air samples were collected from the headspaces with a syringe and transferred to pre-evacuated 12 mL glass vials (Labco Exetainer, Lampeter, UK). The collected air samples were analyzed for CO2 concentration using a gas chromatograph (GC-2010 Plus Shimadzu, WTW SPECTRIOLEX, 6100, Weilheim, Germany) equipped with a thermal conductivity detector. The GC was calibrated using three certified standard gas mixtures of CO2 in the expected concentration range. Helium was used as a carrier gas (30 mL min1).
The volumetric water content in the soils was calculated by multiplying the soil water content (% of weight) by the soil bulk density. The soil water content (% of weight) was measured by a common thermogravimetric method using an oven at a temperature of 105 °C. Bulk density (g cm3) of the soil was calculated using the soil volume and the weight of the dry soil.

2.3. Statistical Analysis

Statistical assessment of the results included the calculation of means, standard deviations, and standard errors. A one-way ANOVA was applied to evaluate the significance of differences between means of data (https://www.socscistatistics.com (accessed on 18 April 2022). Mann-Whitney U test (https://www.socscistatistics.com/tests/mannwhitney/default2.aspx (accessed on 18 April 2022) was applied to assess the significance of differences in means (at p ≤ 0.05) if the distribution was not normal according to the Kolmogorov-Smirnov test of normality (https://www.socscistatistics.com/tests/kolmogorov/default.aspx (accessed on 18 April 2022).

3. Results and Discussion

3.1. Soil Water Content
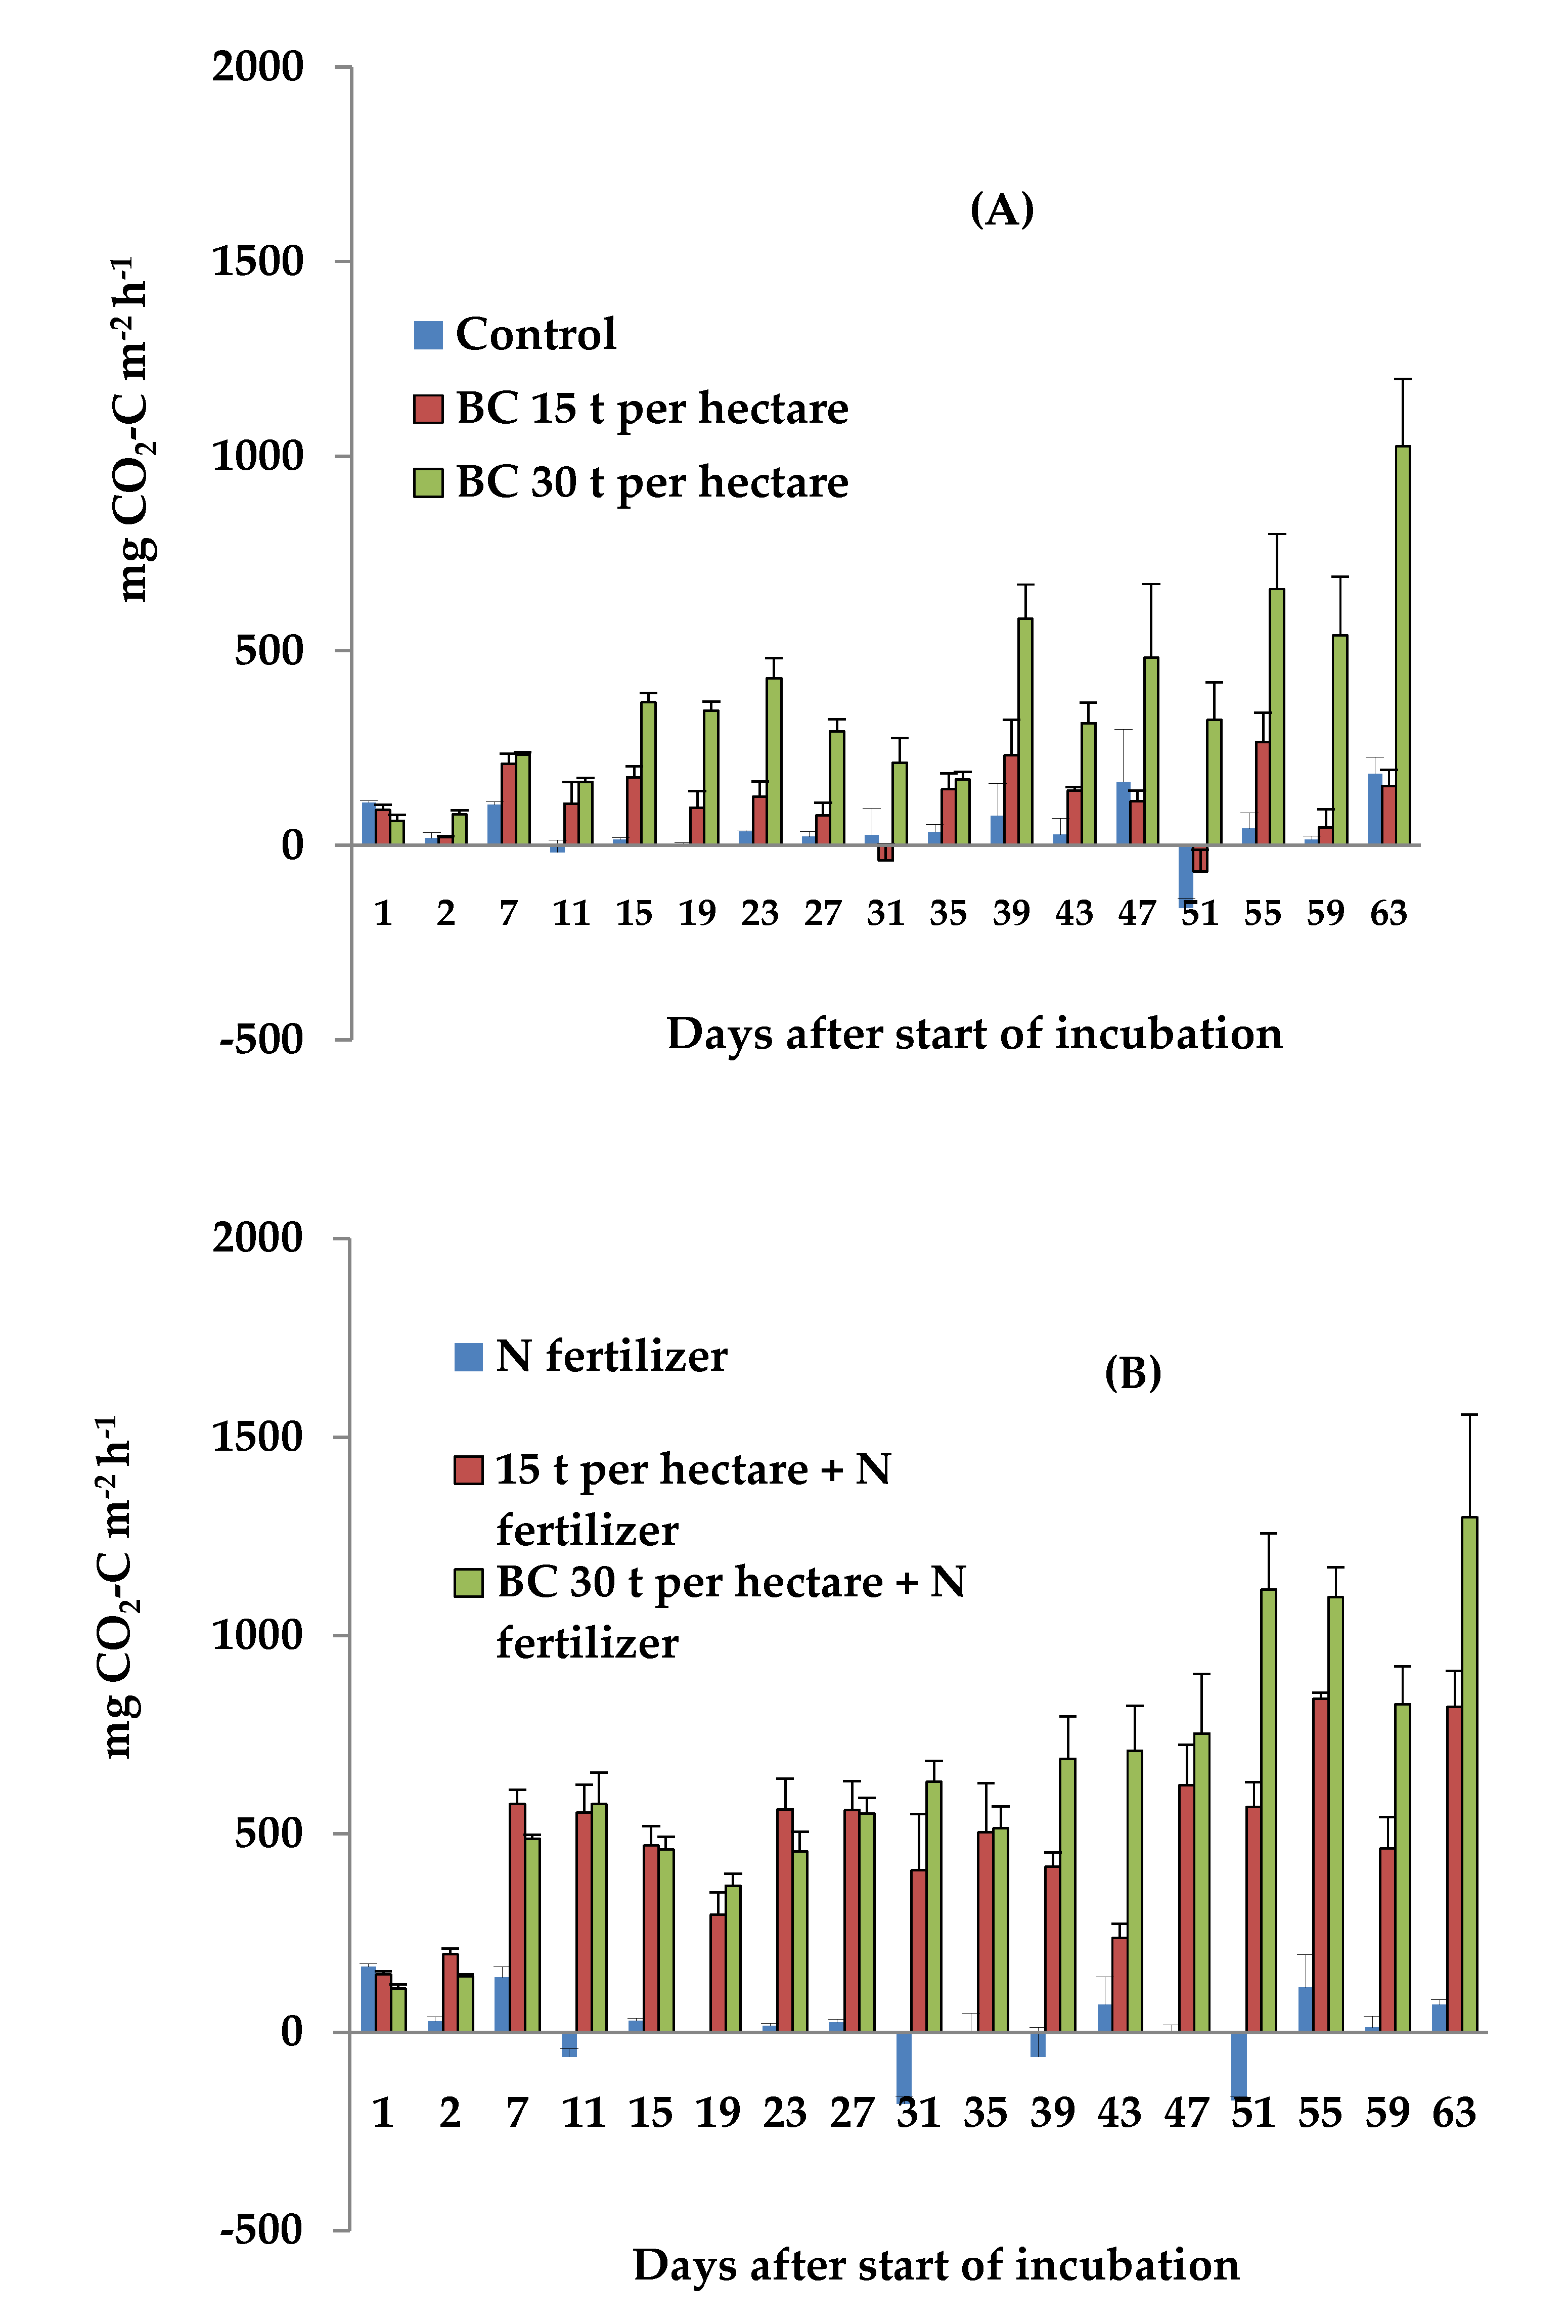
In studies of soil CO2 emissions, the volumetric soil water content (VSWC) is an important indicator of soil moisture conditions, which can be favorable or unfavorable for microbial processes of soil organic matter transformation. According to the results of the one-way analysis of variance (ANOVA), there were mostly nonsignificant differences in the VSWC between the treatments of the sandy soil. Only the incorporation of 15 t ha−1 of BC into this soil resulted in a significant (p < 0.05) increase in the VSWC compared with that of the control treatment. The sandy soil demonstrated anaerobic conditions under all the studied treatments. Biochar is a porous organic substance that contains a large volume of macroporosity in the 1 to 10 μm range [40,41]. It can significantly increase the volume of soil macropores, which, in due course, could be saturated by water; consequently, there would be no improvement in soil aeration under anaerobic conditions [42,43,44]. Moreover, pores inside biochar particles provide extra water storage space beyond soil interpore compartments [45]. Therefore, in specific circumstances, biochar can be an additional source of soil anaerobiosis. According to Hardie et al. [25], biochar-amended soils have a significantly higher near saturated hydraulic conductivity (at water potentials of −0.25 and −0.10 kPa), total porosity, and soil water retention at the water potential of −0.1 kPa, resulting from the presence of large macropores >∼1200 μm. In the clayey loam soil, there was also no significant difference in the VSWC between most of the treatments. Compared with the VSWC of the control treatment, only the BC rate of 15 t ha−1 resulted in a significant (p < 0.05) decrease in the VSWC of the clayey loam soil. This rate of biochar significantly improved aeration of the soil. The degree of biochar-induced changes in the VSWC depends on soil texture and the rates of biochar [46]. The mean values of VSWC of the clayey loam soil were significantly (p < 0.001) higher than those of the sandy soil in all treatments. The greater amounts of silt and clay particles in the clayey loam soil, compared with the sandy soil, were the main reasons for the significant difference in water retention capacity.

3.2. CO2 Emissions

The dynamics of CO2 emissions from the sandy and clayey loam soils with different treatments is shown in Figure 1 and Figure 2. The results showed a high variability in daily CO2 emissions from the sandy soil over the incubation period (Figure 1A,B). The CO2 emissions from the sandy soil in the control treatment with N fertilizer were often equal to zero and sometimes even negative (from −1.5 to −180.7 mg CO2-C m−2 h−1). Therefore, the lowest average daily CO2 emissions were recorded in this treatment: 10.9 ± 49.5 mg CO2-C m−2 h−1, whereas in the control treatment with no N fertilizer, the average values of daily CO2 emissions were 41.2 ± 58.5 mg CO2-C m−2 h−1 (the difference was not significant). The application of biochar to soils can result in either positive or negative priming [47,48,49]. The proposed mechanism of positive priming after biochar application involves the growth of so-called ‘r-strategist’ microbes that are adapted to quickly respond to newly available C sources, re-mineralizing soil nutrients, and co-metabolizing more refractory organic matter, such as soil humic substances in the carbon mineralization process. Positive priming can occur at an early stage of the mineralization of the labile organic matter of biochar [30]. Negative priming (i.e., the repression of soil organic carbon mineralization) is caused by soil organic matter sorption to the biochar surface, either within biochar pores or onto external biochar surfaces [50]. These processes can induce a decrease in activity of soil microbial communities [51].
The results demonstrated that, in the sandy soil, the incorporation of 15 t ha−1 of BC did not cause a significant increase in daily CO2 emissions, compared with those in the control treatment (Figure 1A). However, incorporation of 30 t ha−1 of BC resulted in a significant (p < 0.001) increase in CO2 emissions, compared with the control treatment. The rate of 30 t ha−1 of BC could contribute to an enhanced release of available and weakly protected organic substances from organo-mineral complexes of the sandy soil. Application of N fertilizer did not significantly affect the daily CO2 emissions, probably because of a negligible effect of nitrogen on the activity of ‘r-strategist’ microbes participating in the positive priming of organic matter under anaerobic conditions. There was a gradual decline in CO2 emissions over the entire incubation period, which may have been a result of the declining content of microbial biomass carbon [51]. If the available sources of carbon and nitrogen for microorganisms are gradually reduced, the CO2 emission rates slow down and finally become stabilized. Biochar with N fertilizer could provide an additional source of available carbon and nitrogen to stimulate CO2 emissions from microorganisms. CO2 emission could increase with increasing soil porosity and promotion of CO2 diffusion [52,53]. This was probably the reason why CO2 emissions were significantly (p < 0.05) higher in the treatments of 15 t ha−1 with N fertilizer and 30 t ha−1 with N fertilizer, compared with the control treatment of the sandy soil, as shown by the statistical results of the Mann-Whitney test (Figure 1B). The CO2 emissions from the soil, with the combined application of the biochar (both rates) and N fertilizer, were significantly (p < 0.01) higher than those in the treatment of only N fertilizer application. The statistical results of the Mann-Whitney test showed that the combined application of 15 t ha−1 and N fertilizer resulted in significantly (p < 0.05) higher CO2 emissions from the sandy soil, compared with the treatment of 15 t ha−1 of BC. By the end of the incubation period, an increase in daily CO2 emissions was observed in the sandy soil with the treatment of 30 t ha−1, both with and without N fertilizer. This increase in CO2 emissions may be due to the positive priming of the soil and biochar organic matter, even 63 days after the start of experiment. In the clayey loam soil, the emissions of CO2 also showed high variability in all the treatments over the entire incubation period (Figure 2A). Changes in the content of microbial biomass carbon could result in such a pattern of CO2 emissions from the clayey loam soil [51,52].
The application of 15 and 30 t ha−1 of BC resulted in no significant increase in CO2 emissions from the clayey loam soil, compared with those in the control treatment (Figure 2A). Maximum CO2 emissions occurred in both treatments with BC on the 55th day of incubation, and it was most likely related to the maximum activity of the soil microbial community. The daily CO2 emissions were significantly (p < 0.001) higher from the clayey loam soil than from the sandy soil in the treatment with 15 t ha−1 of BC. In the treatments with 30 t ha−1 of BC, the CO2 emissions from the clayey loam soil were not significantly higher than those from the sandy soil. These results are inconsistent with the findings of previous studies, which reported that biochar mitigated the mineralization of soil organic matter in clay soils, but strongly enhanced the mineralization of soil organic matter in sandy soils [53].
In the clayey loam soil, the incorporation of the N fertilizer had no significant effect on CO2 emissions, probably due to the little impact the N fertilizer had on the activity of the microbial community under anaerobic conditions. Nevertheless, the application of N fertilizer on the clayey loam soil resulted in significantly (p < 0.01) higher CO2 emissions than those from the sandy soil with the same treatment. This may be due to a nitrogen-induced formation of higher nutrient availability caused by a cation release that accelerates the microbial degradation of the soil organic matter in the clayey loam soil compared with the sandy soil. The combined application of either rate of BC with N fertilizer on the clayey loam soil resulted in no significant differences in CO2 emissions compared with those in the control treatment and N fertilizer treatment. There was also no significant difference in CO2 emissions between the sandy and clayey loam soils in the treatments where the BC (both rates) were combined with N fertilizer. The average CO2 emissions from the clayey loam soil were higher than the average CO2 emissions from the sandy soil in the treatments with 15 (p < 0.05) and 30 t ha−1 of BC (p < 0.001). Anaerobic conditions can contribute to an increased decomposition of soil organic matter and to enhanced CO2 fluxes from soils [47,48]. Higher heterotrophic respiration rates in soils that encounter flooding and subsequent drainage could, therefore, experience a release of labile carbon from organo-mineral complexes directly caused by Fe reduction [47,49]. However, decomposition of soil organic matter may be sustained under anaerobic conditions due to compensatory mechanisms, such as the release and metabolism of mineral-associated carbon [50]. Overall, the clayey loam soil demonstrated no significant differences in CO2 emissions between all the treatments under anaerobic conditions. In contrast, the sandy soil showed significant differences in CO2 emissions between the studied treatments with BC under anaerobic conditions. These results indicate that sandy soil may be more suitable for biochar application.

3.3. Cumulative CO2 Fluxes

By the end of the incubation period, the lowest cumulative CO2 fluxes (kg CO2-C ha−1) were measured from the sandy soil with the treatment of N fertilizer (Table 1). The CO2 emissions from the sandy soil in this treatment were often equal to zero or even negative. As a result, the cumulative CO2 fluxes showed the lowest values. The incorporation of 15 t ha−1 of BC into the sandy soil led to no significant changes in the cumulative CO2 flux compared with the control treatment. However, incorporation of 30 t ha−1 of BC into the soil contributed to a significant (p < 0.01) increase in the cumulative CO2 flux compared with the control treatment. There were also significant (p < 0.01) differences between the cumulative CO2 fluxes from the soil with 15 and 30 t ha−1 of BC treatments.
Incorporation of 15 t ha−1 of BC with N fertilizer and 30 t ha−1 of BC with N fertilizer into the sandy soil contributed to enhancing the mineralization (or positive priming) of the soil organic matter and, as a result, caused significantly higher cumulative CO2 fluxes than those from the same soil with 15 t ha−1 (p < 0.01) and 30 t ha−1 of BC (p < 0.05) without N fertilizer treatments. Significant differences in the cumulative CO2 fluxes were also observed between the sandy soil with the control treatment and the treatments with 15 t ha−1 of BC with N fertilizer (p < 0.001) and 30 t ha−1 of BC with N fertilizer (p < 0.001). Although the application of 30 t ha−1 of BC with N fertilizer led to the highest cumulative CO2 flux, the flux was not significantly different (p = 0.63) from the cumulative CO2 flux in the treatment of 15 t ha−1 of BC with N fertilizer (Table 1). In general, the cumulative CO2 fluxes from the sandy soil increased with an increasing rate of BC without N fertilizer. The incorporation of N fertilizer together with the increasing rate of BC appeared to enhance the activity of the ‘r-strategist’ microorganisms and accordingly resulted in greater cumulative CO2 fluxes due to the higher mineralization (positive priming) of soil and biochar organic matter compared with the treatments with BC without N fertilizer. In the clayey loam soil, the incorporation of 15 t ha−1 of BC led to a significant (p < 0.05) increase in the cumulative CO2 flux, whereas incorporation of 30 t ha−1 of BC made no significant (p = 0.06) contribution to the cumulative CO2 flux compared with the control treatment (Table 1). The application of 30 t ha−1 of BC, compared with 15 t ha−1 of BC, resulted in a lower cumulative CO2 flux, presumably due to the negative priming (or repression of mineralization) of organic matter. This could occur due to a decreasing availability of organic carbon adsorbed onto the external biochar surface or within the biochar or soil micropores.
The cumulative CO2 fluxes from the clayey loam soil with the treatments of 15 t ha−1 of BC with N fertilizer and 30 t ha−1 of BC with N fertilizer were not significantly higher than those in the N fertilizer only treatment. Nevertheless, the application of N fertilizer with 15 t ha−1 of BC led to a significant (p < 0.05) decrease in the cumulative CO2 flux from the clayey loam soil. However, the application of N fertilizer with 30 t ha−1 of BC only resulted in a nonsignificant increase in the cumulative CO2 fluxes from this soil, compared with the treatments of 15 and 30 t ha−1 of BC without N fertilizer.
The economic feasibility of the application of biochar in agriculture depends on two aspects. First, we must demonstrate that biochar, at low and high rates, often contributes to an improvement in many soil quality indicators, an increase in carbon sequestration from the atmosphere, and a decrease in nitrous oxide emission from soils [2,15,16,17,18,19,20,21,22,23,24,25,26,36,37]. This is an economical benefit of using biochar in the long term. Secondly, we must demonstrate that the application of high rates of biochar can be unprofitable for farmers because of the current high prices of biochar, high application costs, and operational prices of commodities under standard management practices [54]. Therefore, a detailed analysis of the economic feasibility of using biochar should include further studies on the best combination of soil quality and profit in new and standard management practices. Our results are important because they demonstrate both favorable and unfavorable possibilities of soil moisture content and CO2 emission management using high rates of biochar incorporated into sandy and clayey loam soils under anaerobiosis. These findings can be used for further analysis of the positive or negative priming of organic matter in soils amended with biochar with or without nitrogen fertilizers.

4. Conclusions

The results of this study showed that biochar application at a rate of 15 t ha−1 to sandy soil led to a significant (p < 0.05) increase in the soil volumetric water content. This rate of biochar enhanced soil anaerobiosis due to an increased volume of water-holding soil macropores. Particles of biochar contain a high volume of water-holding macropores; therefore, they can be an additional source of anaerobiosis. The opposite effect was found for the clayey loam soil: 15 t ha−1 of BC significantly (p < 0.05) improved soil aeration, which was probably related to the increase in macropore volume.
Application of 15 t ha−1 of BC to the sandy soil did not result in a significant increase in daily or cumulative CO2 emissions from the soil, probably because of the limited availability of carbon incorporated into the soil with the BC. However, application of 30 t ha1 of BC led to significantly (p < 0.001) higher CO2 emissions. The rate of 30 t ha1 of BC may have enhanced the release of available and weakly protected organic substances from the organo-mineral complexes of the sandy soil. The CO2 emissions from the sandy soil significantly (p < 0.05) increased when BC was applied together with N fertilizer (both rates). The N fertilizer probably contributed to the increasing availability of carbon and nitrogen because the ‘r-strategist’ microbes participated in positive priming.
The application of 15 and 30 t ha−1 of BC without N fertilizer did not significant affect the daily CO2 emissions from the clayey loam soil, probably because the soil labile organic matter in this soil was more protected compared with those in the sandy soil. Compared with the sandy soil, cumulative CO2 fluxes from the clayey loam soil did not change (30 t ha−1) or decreased (15 t ha−1) when the BC was combined with N fertilizer. This could have occurred due to the increased negative priming of organic carbon adsorbed onto the external biochar surface or within the biochar or soil micropores, which were unavailable for ‘r-strategist’ microorganisms in the clayey loam soil. Therefore, we may be able to control the cumulative CO2 fluxes from clayey loam soil by combining the application of biochar with N fertilizer.
The higher content of adsorbed labile organic carbon in the clayey loam soil could be the reason for significantly greater daily and cumulative CO2 emissions from this soil than from the sandy soil.

Author Contributions

Conceptualization, J.H., E.B., N.B. and V.Š.; methodology, E.B. and J.H.; investigation E.B., N.B., V.Š. and J.H.; resources, E.B. and J.H.; data curation, E.B.; formal analysis E.B., N.B., V.Š. and J.H.; writing—original draft preparation, J.H., E.B. and V.Š.; writing—review and editing, N.B.; validation; visualization, E.B.; project administration, J.H.; funding acquisition J.H. All authors have read and agreed to the published version of the manuscript.

Funding

This study was supported by the Slovak Grant Agency (VEGA) project no. 1/0116/21 and 1/0021/22, the Cultural and Educational Grant Agency, KEGA (No. 019SPU–4/2020), and the Operational Program Integrated Infrastructure within the project “Sustainable smart farming systems, taking into account the future challenges 313011W112”, co-financed by the European Regional Development Fund. E.V. Balashov and N.P. Buchkina were partly working according to the scientific topic of the Agrophysical Research Institute.

Institutional Review Board Statement

Not applicable.

Informed Consent Statement

Not applicable.

Data Availability Statement

The datasets generated and/or analysed for the current study are available from the corresponding author on request.

Acknowledgments

N. Buchkina was partly working according to the scientific topic of the Agrophysical Research Institute. The authors thank Katarína Drgoňová for help with soil analyses. Finally, we thank all the reviewers who participated in the improvement of this paper.

Conflicts of Interest

The authors declare no conflict of interest. The funders had no role in the design of the study; in the collection, analyses, or interpretation of data; in the writing of the manuscript; or in the decision to publish the results.

References

  1. Das, S.K.; Ghosh, G.K.; Avasthe, R.K.; Sinha, K. Compositional heterogeneity of different biochar: Effect of pyrolysis temperature and feedstocks. J. Environ. Manag. 2021, 278, 111501. [Google Scholar] [CrossRef]
  2. Kuppusamy, S.; Thavamani, P.; Megharaj, M.; Venkateswarlu, K.; Naidu, R. Agronomic and remedial benefits and risks of applying biochar to soil: Current knowledge and future research directions. Environ. Int. 2016, 87, 1–12. [Google Scholar] [CrossRef]
  3. Lehmann, J.; Rillig, M.C.; Thies, J.; Masiell, C.A.; Hockaday, W.C.; Crowley, D. Biochar effects on soil biota, a review. Soil Biol. Biochem. 2011, 43, 1812–1836. [Google Scholar] [CrossRef]
  4. Lei, O.; Zhang, R. Effects of biochars derived from different feedstocks and pyrolysis temperatures on soil physical and hydraulic properties. J. Soils Sediments 2013, 13, 1561–1572. [Google Scholar] [CrossRef]
  5. Verheijen, F.G.; Zhuravel, A.; Silva, F.C.; Amaro, A.; Ben-Hur, M.; Keizer, J.J. The influence of biochar particle size and concentration on bulk density and maximum water holding capacity of sandy vs sandy loam soil in a column experiment. Geoderma 2019, 347, 194–202. [Google Scholar] [CrossRef]
  6. Laird, D.A. The charcoal vision: A win–win–win scenario for simultaneously producing bioenergy, permanently sequestering carbon, while improving soil and water quality. Agron. J. 2018, 100, 178–181. [Google Scholar] [CrossRef]
  7. Lehmann, J.; Gaunt, J.; Rondon, M. Bio-char sequestration in terrestrial ecosystems–a review. Mitig. Adapt. Strateg. Glob. Change 2006, 11, 403–427. [Google Scholar] [CrossRef]
  8. Van Zwieten, L.; Kimber, S.; Morris, S.; Chan, K.Y.; Downie, A.; Rust, J.; Cowie, A. Effects of biochar from slow pyrolysis of papermill waste on agronomic performance and soil fertility. Plant Soil 2010, 327, 235–246. [Google Scholar] [CrossRef]
  9. Horák, J. Testing biochar as a possible way to ameliorate slightly acidic soil at the research field located in the Danubian lowland. Acta Hortic. Regiotect. 2015, 18, 20–24. [Google Scholar] [CrossRef] [Green Version]
  10. Kondrlová, E.; Horák, J.; Igaz, D.; Dobiášová, D. The possibility of using digital images in assessment of plant canopy development and weed spread. Acta Hortic. Et Regiotect. 2017, 20, 35–39. [Google Scholar] [CrossRef] [Green Version]
  11. Laird, D.A.; Fleming, P.; Davis, D.D.; Horton, R.; Wang, B.; Karlen, D.L. Impact of biochar amendments on the quality of typical Midwestern agricultural soil. Geoderma 2010, 158, 443–449. [Google Scholar] [CrossRef] [Green Version]
  12. Liao, J.; Hu, A.; Zhao, Z.; Liu, X.; Jiang, C.; Zhang, Z. Biochar with large specific surface area recruits N2O-reducing microbes and mitigate N2O emission. Soil Biol. Biochem. 2021, 156, 108212. [Google Scholar] [CrossRef]
  13. Novak, J.M.; Lima, I.; Xing, B.; Gaskin, J.W.; Steiner, C.; Das, K.C.; Ahmedna, M.; Rehrah, D.; Watts, D.W.; Busscher, W.J.; et al. Characterization of designer biochar produced at different temperatures and their effects on a loamy sand. Ann. Environ. Sci. 2009, 3, 195–2006. [Google Scholar]
  14. Rajapaksha, A.U.; Vithanage, M.; Zhang, M.; Ahmad, M.; Mohan, D.; Chang, S.X.; Ok, Y.S. Pyrolysis condition affected sulfamethazine sorption by tea waste biochars. Bioresour. Technol. 2014, 166, 303–308. [Google Scholar] [CrossRef] [PubMed]
  15. Juriga, M.; Aydın, E.; Horák, J.; Chlpík, J.; Rizhiya, E.Y.; Buchkina, N.P.; Balashov, E.V.; Šimanský, V. The importance of initial application and reapplication of biochar in the context of soil structure improvement. J. Hydrol. Hydromech. 2021, 69, 87–97. [Google Scholar] [CrossRef]
  16. Ajayi, A.E.; Horn, R. Modification of chemical and hydrophysical properties of two texturally differentiated soils due to varying magnitudes of added biochar. Soil Tillage Res. 2016, 164, 34–44. [Google Scholar] [CrossRef]
  17. Šimanský, V.; Šrank, D. Relationships between soil organic matter and crop yield after biochar substrates application and their combination with mineral fertilizers on sandy soil. Acta Hortic. Regiotect. 2021, 24, 14–20. [Google Scholar] [CrossRef]
  18. Blanco-Canqui, H. Biochar and soil physical properties. Soil Sci. Soc. Am. J. 2017, 81, 687–711. [Google Scholar] [CrossRef] [Green Version]
  19. Githinji, L. Effect of biochar application rate on soil physical and hydraulic properties of a sandy loam. Arch. Agron. Soil Sci. 2014, 60, 457–470. [Google Scholar] [CrossRef]
  20. Jien, S.H.; Wang, C.S. Effects of biochar on soil properties and erosion potential in a highly weathered soil. Catena 2013, 110, 225–233. [Google Scholar] [CrossRef] [Green Version]
  21. Toková, L.; Igaz, D.; Horák, J.; Aydin, E. Effect of biochar application and re-application on soil bulk density, porosity, saturated hydraulic conductivity, Water Content and Soil Water Availability in a Silty Loam Haplic Luvisol. Agronomy 2020, 10, 1005. [Google Scholar] [CrossRef]
  22. Głąb, T.; Palmowska, J.; Zaleski, T.; Gondek, K. Effect of biochar application on soil hydrological properties and physical quality of sandy soil. Geoderma 2016, 281, 11–20. [Google Scholar] [CrossRef]
  23. Ibrahim, H.M.; Al-Wabel, M.I.; Usman, A.R.; Al-Omran, A. Effect of Conocarpus biochar application on the hydraulic properties of a sandy loam soil. Soil Sci. 2013, 178, 165–173. [Google Scholar] [CrossRef]
  24. Abd El-Mageed, T.A.; Abdelkhalik, A.; Abd El-Mageed, S.A.; Semida, W.M. Co-composted poultry litter biochar enhanced soil quality and eggplant productivity under different irrigation regimes. J. Soil Sci. Plant Nutr. 2021, 21, 1917–1933. [Google Scholar] [CrossRef]
  25. Hardie, M.; Clothier, B.; Bound, S.; Oliver, G.; Close, D. Does biochar influence soil physical properties and soil water availability? Plant Soil 2014, 376, 347–361. [Google Scholar] [CrossRef]
  26. Haider, G.; Steffens, D.; Moser, G.; Müller, C.; Kammann, C.I. Biochar reduced nitrate leaching and improved soil moisture content without yield improvements in a four-year field study. Agric. Ecosyst. Environ. 2017, 237, 80–94. [Google Scholar] [CrossRef]
  27. Kuzyakov, Y.; Friedel, J.K.; Stahr, K. Review of mechanisms and quantification of priming effects. Soil Biol. Biochem. 2000, 32, 1485–1498. [Google Scholar] [CrossRef]
  28. Bruun, E.W.; Ambus, P.; Egsgaard, H.; Hauggaard-Nielsen, H. Effects of slow and fast pyrolysis biochar on soil C and N turnover dynamics. Soil Biol. Biochem. 2012, 46, 73–79. [Google Scholar] [CrossRef]
  29. Cross, A.; Sohi, S.P. The priming potential of biochar products in relation to labile carbon contents and soil organic matter status. Soil Biol. Biochem. 2011, 43, 2127–2134. [Google Scholar] [CrossRef]
  30. Luo, Y.; Durenkamp, M.; De Nobili, M.; Lin, Q.; Brookes, P.C. Short term soil priming effects and the mineralisation of biochar following its incorporation to soils of different pH. Soil Biol. Biochem. 2011, 43, 2304–2314. [Google Scholar] [CrossRef]
  31. Singh, B.P.; Cowie, A.L. Long-term influence of biochar on native organic carbon mineralisation in a low-carbon clayey soil. Sci. Rep. 2014, 4, 1–9. [Google Scholar] [CrossRef] [PubMed] [Green Version]
  32. Fang, Y.; Singh, B.; Singh, B.P.; Krull, E. Biochar carbon stability in four contrasting soils. Eur. J. Soil Sci. 2014, 65, 60–71. [Google Scholar] [CrossRef]
  33. Knorr, W.; Prentice, I.C.; House, J.I.; Holland, E.A. Long-term sensitivity of soil carbon turnover to warming. Nature 2005, 433, 298–301. [Google Scholar] [CrossRef]
  34. Nkongolo, N.V.; Johnson, S.; Schmidt, K.; Eivazi, F. Greenhouse gases fluxes and soil thermal properties in a pasture in central Missouri. J. Environ. Sci. 2010, 22, 1029–1039. [Google Scholar] [CrossRef]
  35. Spokas, K.A.; Reicosky, D.C. Impacts of sixteen different biochars on soil greenhouse gas production. Ann. Environ. Sci. 2009, 3, 179–193. [Google Scholar]
  36. Balashov, E.; Buchkina, N.; Šimanský, V.; Horák, J. Effects of slow and fast pyrolysis biochar on N2O emissions and water availability of two soils with high water-filled pore space. J. Hydrol. Hydromech. 2021, 69, 467–474. [Google Scholar] [CrossRef]
  37. Horák, J.; Šimanský, V.; Aydin, E. Benefits of biochar and its combination with nitrogen fertilization for soil quality and grain yields of barley, wheat and corn. J. Elem. 2020, 25, 443–458. [Google Scholar] [CrossRef]
  38. Smith, J.L.; Collins, H.P.; Bailey, V.L. The effect of young biochar on soil respiration. Soil Biol. Biochem. 2010, 42, 2345–2347. [Google Scholar] [CrossRef]
  39. Wang, J.; Zhang, M.; Xiong, Z.; Liu, P.; Pan, G. Effects of biochar addition on N2O and CO2 emissions from two paddy soils. Biol. Fertil. Soils 2011, 47, 887–896. [Google Scholar] [CrossRef]
  40. Downie, A.; Crosky, A.; Munroe, P. Physical properties of biochar. In Biochar for Environmental Management; Routledge: Oxfordshire, UK, 2012; pp. 45–64. Available online: https://www.taylorfrancis.com/chapters/edit/10.4324/9781849770552-9/physical-properties-biochar-adriana-downie-alan-crosky-paul-munroe (accessed on 16 February 2019).
  41. Duarte, S.J.; Glaser, B.; Cerri, C.E.P. Effect of biochar particle size on physical, hydrological and chemical properties of loamy and sandy tropical soils. Agronomy 2019, 9, 165. [Google Scholar] [CrossRef] [Green Version]
  42. Yu, L.; Tang, J.; Zhang, R.; Wu, Q.; Gong, M. Effects of biochar application on soil methane emission at different soil moisture levels. Biol. Fertil. Soils 2013, 49, 119–128. [Google Scholar] [CrossRef]
  43. Mangalassery, S.; Sjögersten, S.; Sparkes, D.L.; Sturrock, C.J.; Mooney, S.J. The effect of soil aggregate size on pore structure and its consequence on emission of greenhouse gases. Soil Tillage Res. 2013, 132, 39–46. [Google Scholar] [CrossRef]
  44. Karbin, S.; Hagedorn, F.; Hiltbrunner, D.; Zimmermann, S.; Niklaus, P.A. Spatial micro-distribution of methanotrophic activity along a 120-year afforestation chronosequence. Plant Soil 2016, 415, 13–23. [Google Scholar] [CrossRef] [Green Version]
  45. Zhao, Q.; Wang, Y.; Xu, Z.; Yu, Z. How does biochar amendment affect soil methane oxidation? A review. J. Soils Sediments 2021, 21, 1575–1586. [Google Scholar] [CrossRef]
  46. Murtaza, G.; Ahmed, Z.; Usman, M.; Tariq, W.; Ullah, Z.; Shareef, M.; Iqbal, H.; Waqas, M.; Tariq, A.; Wu, Y.; et al. Biochar induced modifications in soil properties and its impacts on crop growth and production. J. Plant Nutr. 2021, 44, 1677–1691. [Google Scholar] [CrossRef]
  47. Kuzyakov, Y.; Bogomolova, I.; Glaser, B. Biochar stability in soil: Decomposition during eight years and transformation as assessed by compound-specific 14C analysis. Soil Biol. Biochem. 2014, 70, 229–236. [Google Scholar] [CrossRef]
  48. Senbayram, M.; Saygan, E.P.; Chen, R.; Aydemir, S.; Kaya, C.; Wu, D.; Bladogatskaya, E. Effect of biochar origin and soil type on the greenhouse gas emission and the bacterial community structure in N fertilized acidic sandy and alkaline clay soil. Sci. Total Environ. 2019, 660, 69–79. [Google Scholar] [CrossRef]
  49. Kuzyakov, Y. Priming effects: Interactions between living and dead organic matter. Soil Biol. Biochem. 2010, 42, 1363–1371. [Google Scholar] [CrossRef]
  50. Zimmerman, A.R.; Gao, B.; Ahn, M.Y. Positive and negative carbon mineralization priming effects among a variety of biochar-amended soils. Soil Biol. Biochem. 2011, 43, 1169–1179. [Google Scholar] [CrossRef]
  51. Lin, S.; Zhang, S.; Shen, G.; Shaaban, M.; Ju, W.; Cui, Y.; Fang, L. Effects of inorganic and organic fertilizers on CO2 and CH4 fluxes from tea plantation soil. Elem. Sci. Anthr. 2021, 9, 1–13. [Google Scholar] [CrossRef]
  52. Kallenbach, C.M.; Rolston, D.E.; Horwath, W.R. Cover cropping affects soil N2O and CO2 emissions differently depending on type of irrigation. Agric. Ecosyst. Environ. 2010, 137, 251–260. [Google Scholar] [CrossRef]
  53. Wang, J.; Xiong, Z.; Kuzyakov, Y. Biochar stability in soil: Meta-analysis of decomposition and priming effects. GCB Bioenergy 2016, 8, 512–523. [Google Scholar] [CrossRef] [Green Version]
  54. Šimanský, V.; Aydın, E.; Igaz, D.; Horák, J. Potential application of biochar depends mainly on its profits for farmers: Case study in Slovakia. Agriculture 2020, 66, 171–176. [Google Scholar] [CrossRef]
Figure 1. Dynamics of daily CO2 emissions from the sandy soil with (A) no N fertilizer and (B) with N-fertilizer, during the incubation period. Error bars show the standard error of the mean for each treatment (n = 6).
Agriculture 12 01028 g001
Figure 2. Dynamics of daily CO2 emissions from the clayey loam soil with (A) no N fertilizer and (B) with N-fertilizer, during the incubation period. Error bars show the standard error of the mean for each treatment (n = 6).
Agriculture 12 01028 g002
Table 1. Mean values of cumulative CO2 fluxes (mean ± standard errors) from the sandy soil and the clayey loam soil with different treatments at the end of the incubation period.
TreatmentSandy SoilClayey Loam Soil
Control2085.1 ± 2090.5 a37,093.8 ± 9357.2 g
N fertilizer67.3 ± 1772.8 b40,036.4 ± 6727.7 g
15 t ha−1 of biochar7047.9 ± 2564.3 c61,616.8 ± 7206.7 h
15 t ha−1 of biochar + N fertilizer30,905.6 ± 4085.3 d42,322.9 ± 9305.0 g
30 t ha−1 of biochar22,898.2 ± 4185.2 d53,247.56 ± 5917.0 g,h
30 t ha−1 of biochar + N fertilizer40,264.7 ± 4763.5 e47,960.2 ± 5227.98 g
Letters a to e, and g and h within each column show significant differences between the mean values of cumulative CO2 fluxes from the sandy soil and clayey loam soil, respectively, by one-way ANOVA (at p ≤ 0.05).
Publisher’s Note: MDPI stays neutral with regard to jurisdictional claims in published maps and institutional affiliations.

