
Zootechnical Performance and Some Physiological Indices of Tambaqui, Colossoma macropomum Juveniles during Biofloc Maturation and in Different Feed Regimes

 ,
, 
Abstract
:1. Introduction
2. Materials and Methods
2.1. Experimental Conditions
2.1.1. Phase 1—Growth Performance under Biofloc Systems
2.1.2. Phase 2—Effect of Different Feeding Regimes on Growth and Physiology Performance of C. macropomum Juveniles Reared in BFT
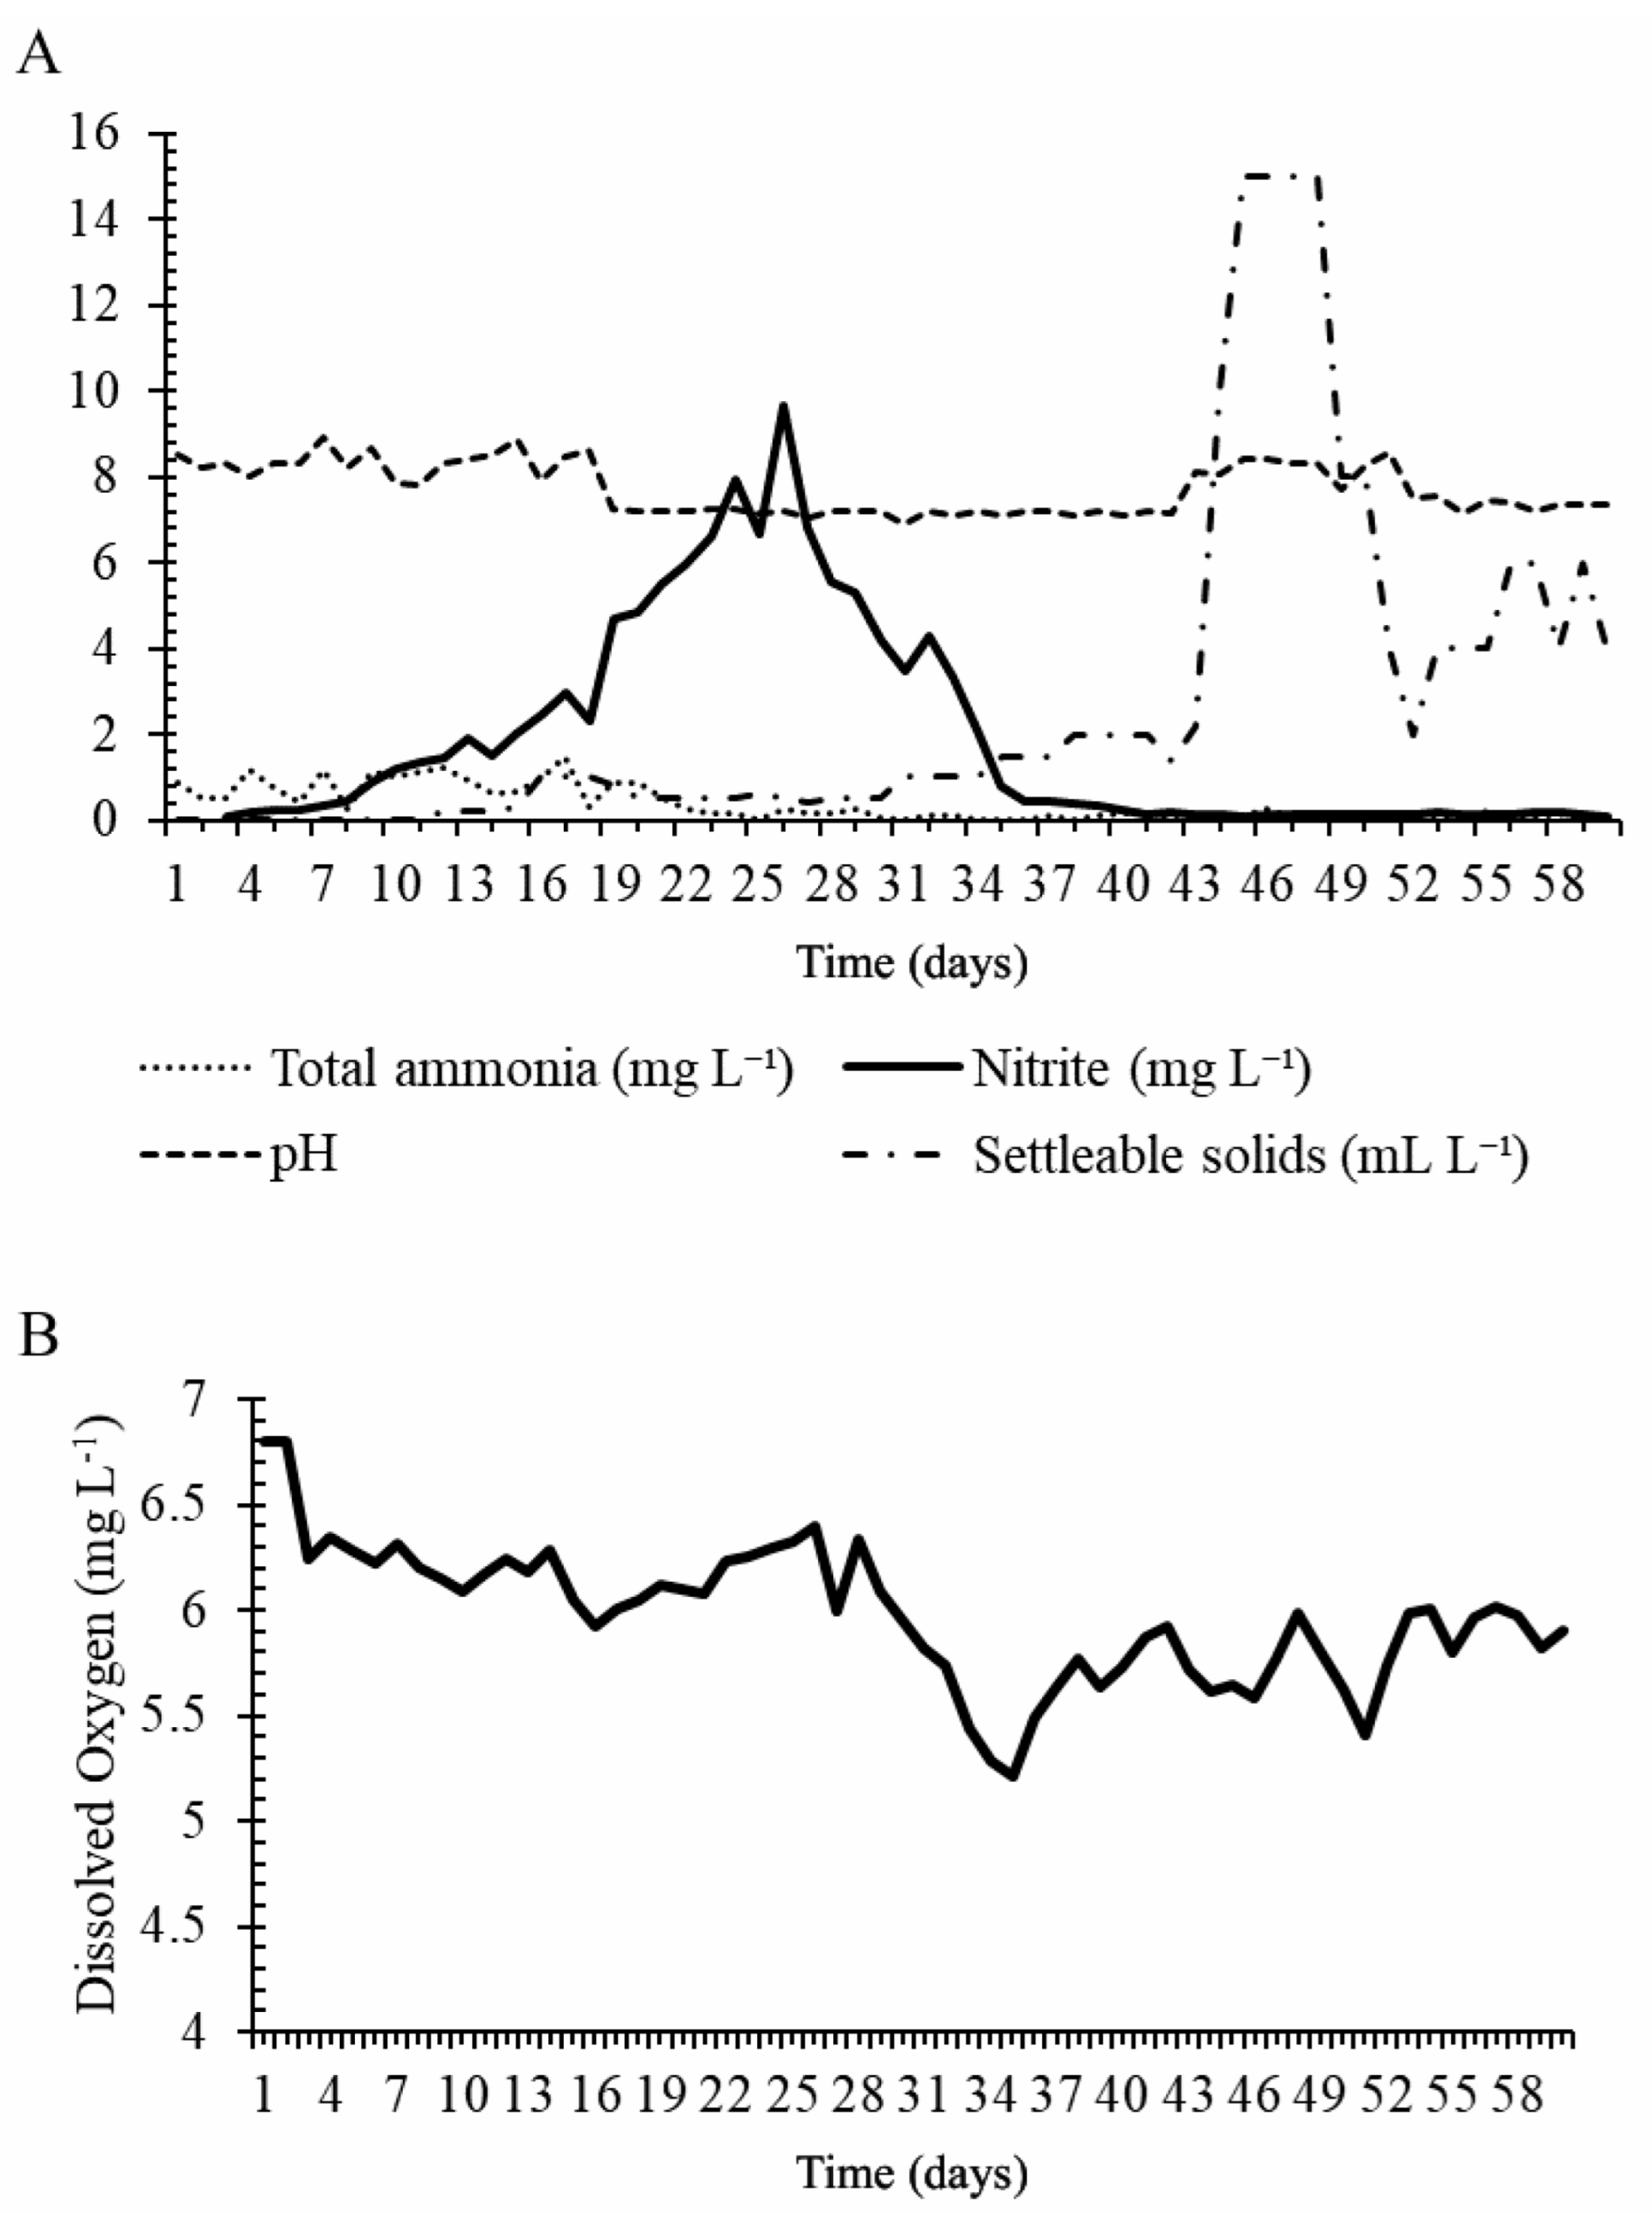
2.2. Water Quality Analysis
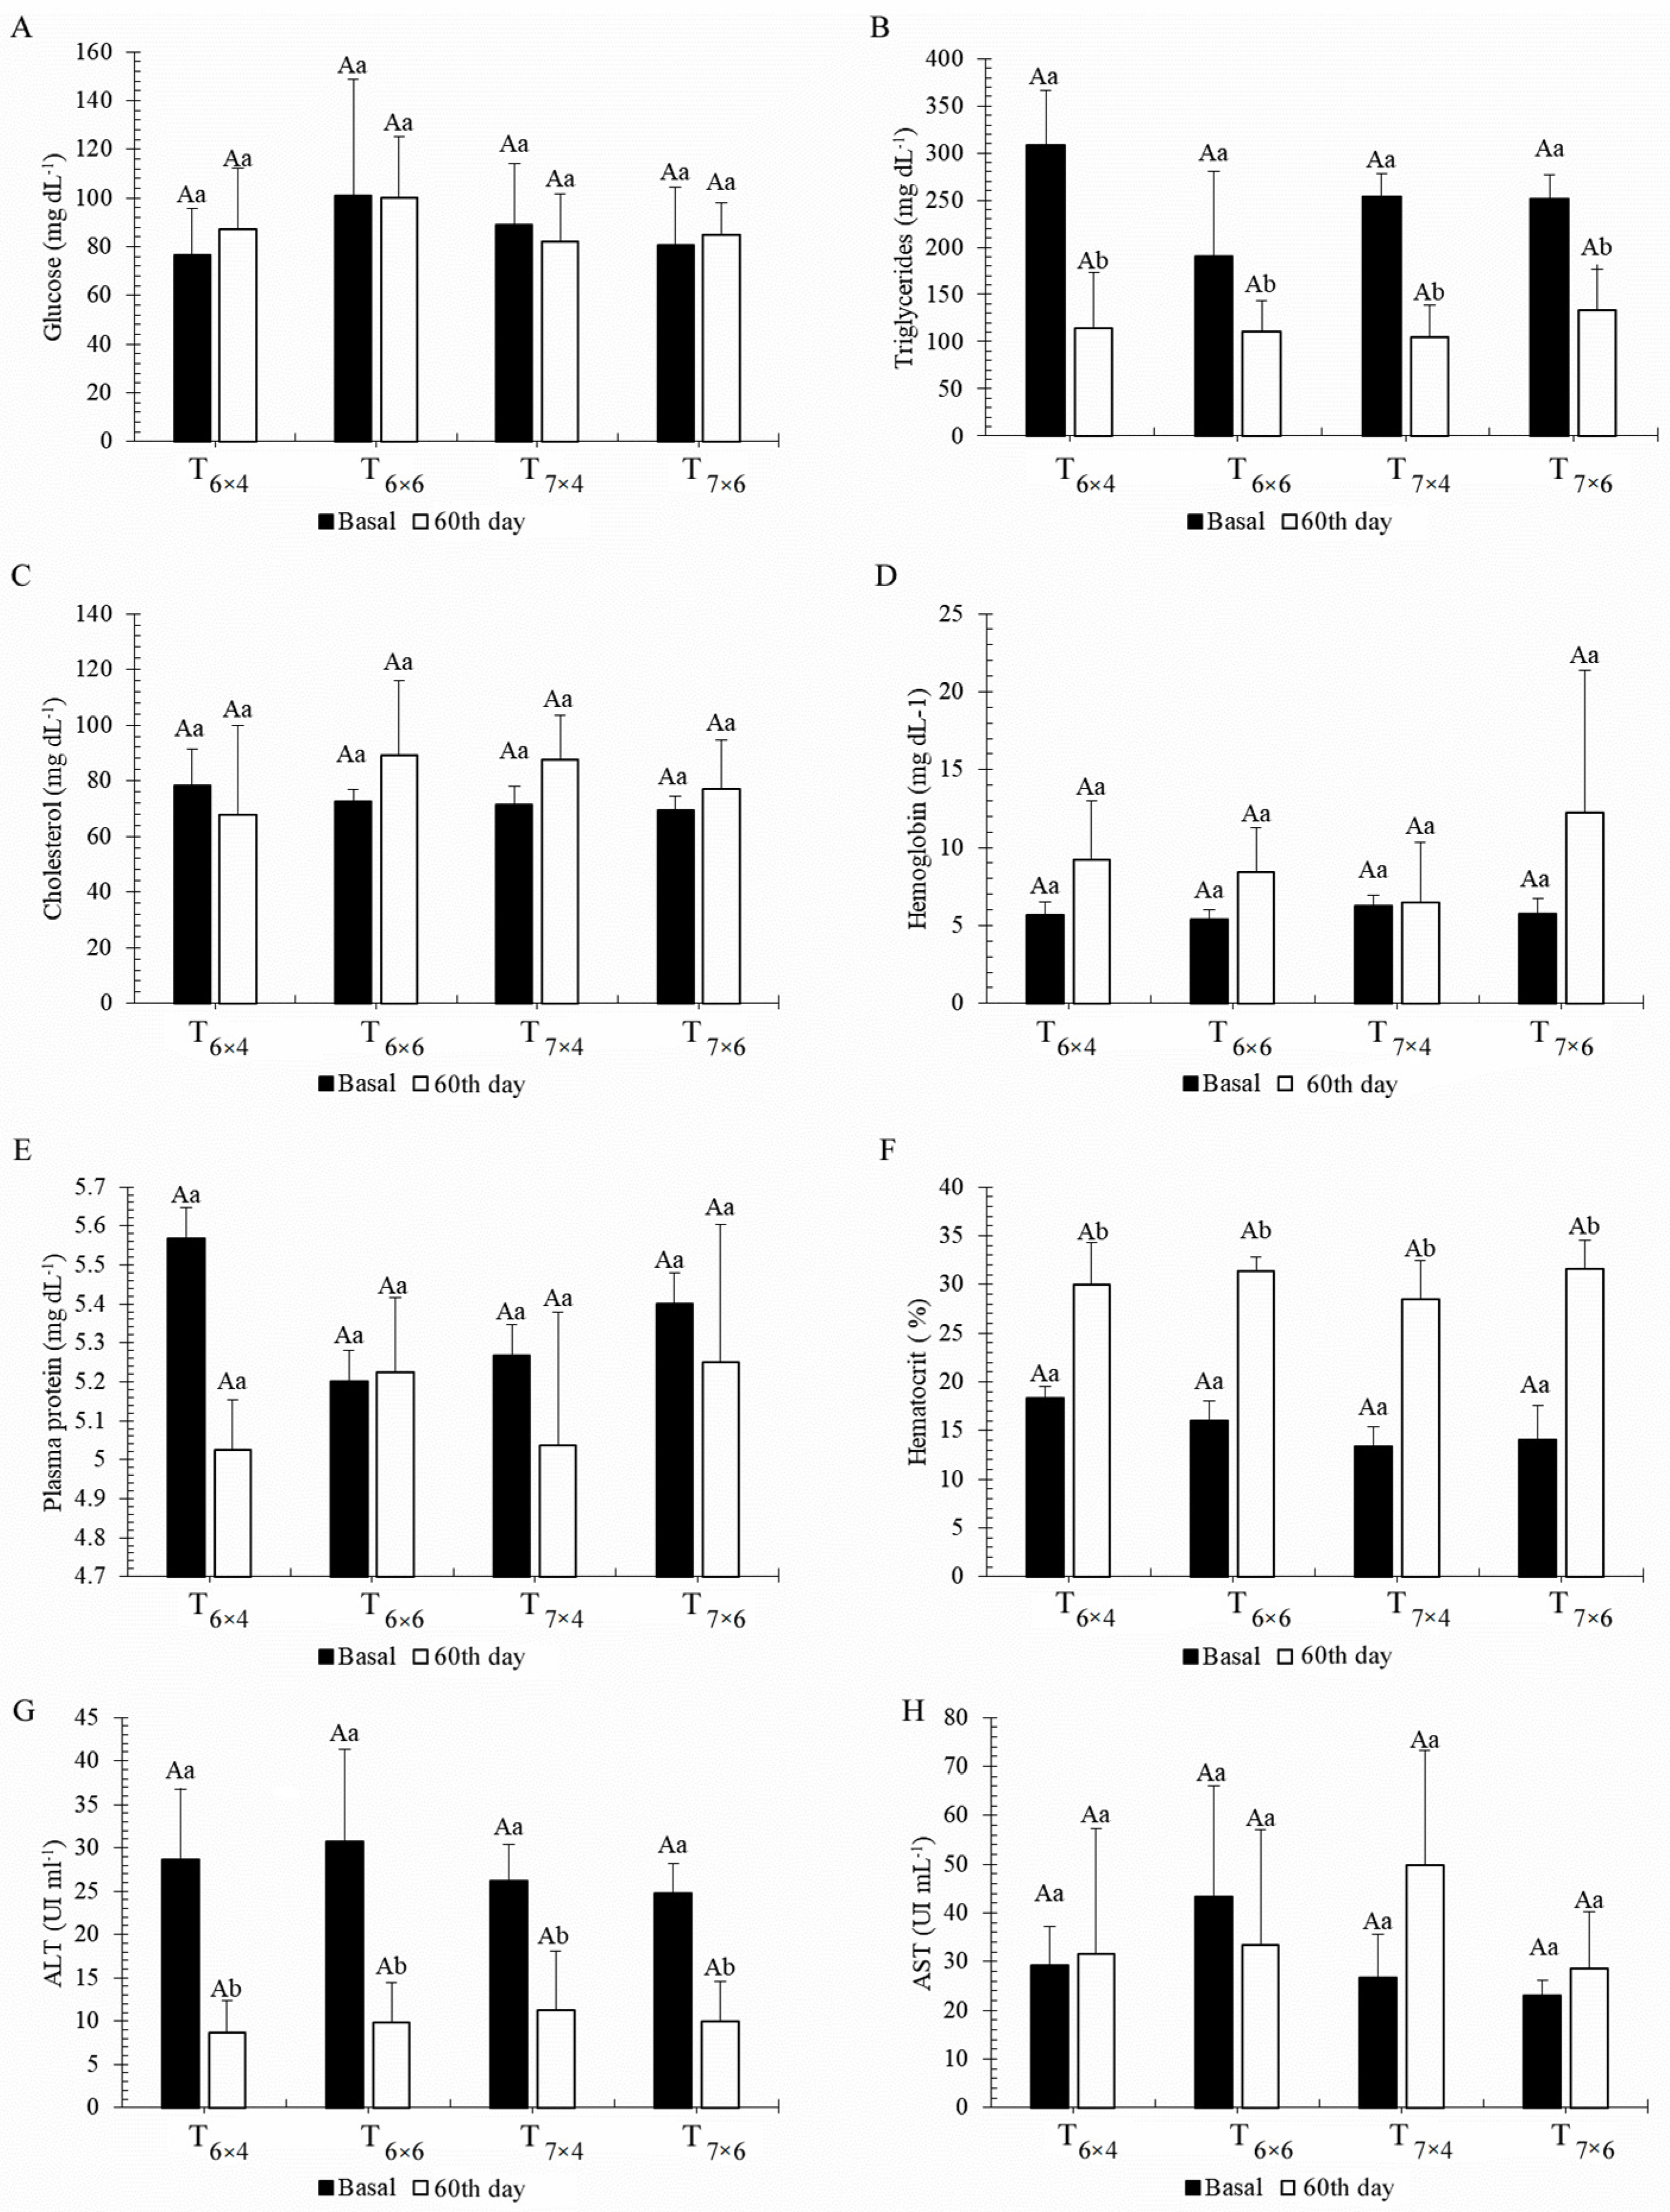
2.3. Blood Analysis
2.4. Growth Performance
- Weight gain (WG; g) = final weight — initial weight;
- Specific growth rate (SGR; % / day) = ((ln final weight — ln initial weight)/days) × 100;
- Production (kg m−3) = biomass/tank volume in m3;
- Biomass (g) = total number of fish × final weight;
- Feed intake (g) = weight of offered feed — weight of uneaten feed;
- Feed conversion rate (FCR) = feed intake/weight gain;
- Survival (%) = (number of fish at the end of the experiment/number of initial fish) × 100.
2.5. Indexes
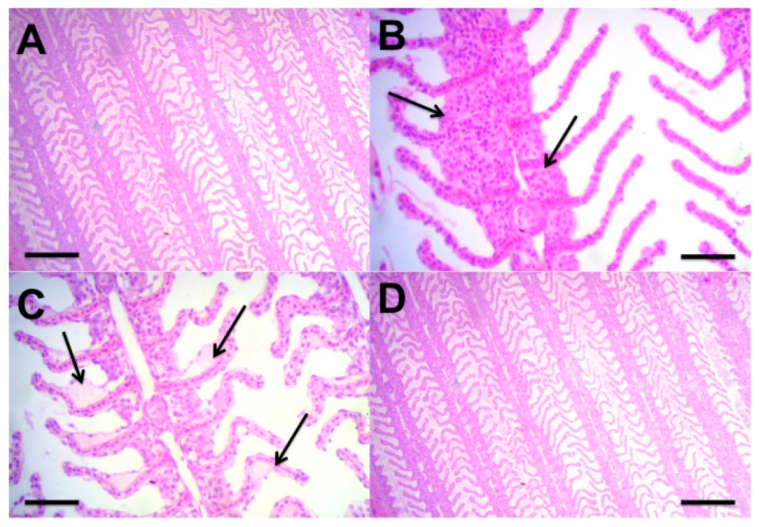
2.6. Histology
2.7. Statistical Analysis
3. Results
3.1. Phase 1—Growth Performance under Biofloc Systems
3.2. Phase 2—Effect of Different Feeding Regimes on Growth and Physiology Performance of C. macropomum Juveniles Reared in BFT
4. Discussion
5. Conclusions
Author Contributions
Funding
Institutional Review Board Statement
Data Availability Statement
Acknowledgments
Conflicts of Interest
References
- Luo, G.; Gao, Q.; Wang, C.; Liu, W.; Sun, D.; Li, L.; Tan, H. Growth, digestive activity, welfare, and partial cost-effectiveness of genetically improved farmed tilapia (Oreochromis niloticus) cultured in a recirculating aquaculture system and an indoor biofloc system. Aquaculture 2014, 422–423, 1–7. [Google Scholar] [CrossRef]
- Fugimura, M.M.S.; dos Reis Flor, H.; de Melo, E.P.; da Costa, T.V.; Wasielesky, W.; Oshiro, L.M.Y. Brewery residues as a source of organic carbon in Litopenaeus schmitti white shrimp farms with BFT systems. Aquac. Int. 2015, 23, 509–522. [Google Scholar] [CrossRef]
- Vilani, F.G.; Schveitzer, R.; Da Fonseca Arantes, R.; Do Nascimento Vieira, F.; Manoel do Espírito Santo, C.; Quadros Seiffert, W. Strategies for water preparation in a biofloc system: Effects of carbon source and fertilization dose on water quality and shrimp performance. Aquac. Eng. 2016, 74, 70–75. [Google Scholar] [CrossRef]
- Krummenauer, D.; Poersch, L.H.; Fóes, G.; Lara, G.; Wasielesky, W. Survival and growth of Litopenaeus vannamei reared in Bft System under different water depths. Aquaculture 2016, 465, 94–99. [Google Scholar] [CrossRef]
- Bakhshi, F.; Najdegerami, E.H.; Manaffar, R.; Tukmechi, A.; Farah, K.R. Use of different carbon sources for the biofloc system during the grow-out culture of common carp (Cyprinus carpio L.) fingerlings. Aquaculture 2018, 484, 259–267. [Google Scholar] [CrossRef]
- Kaya, D.; Genc, E.; Genc, M.A.; Aktas, M.; Eroldogan, O.T.; Guroy, D. Biofloc technology in recirculating aquaculture system as a culture model for green tiger shrimp, Penaeus semisulcatus: Effects of different feeding rates and stocking densities. Aquaculture 2020, 528, 735526. [Google Scholar] [CrossRef]
- Battisti, E.K.; Rabaioli, A.; Uczay, J.; Sutili, F.J.; Lazzari, R. Effect of stocking density on growth, hematological and biochemical parameters and antioxidant status of silver catfish (Rhamdia quelen) cultured in a biofloc system. Aquaculture 2020, 524, 735213. [Google Scholar] [CrossRef]
- Avnimelech, Y. Biofloc Technology: A Practical Guidebook, 2nd ed.; The Word Aquaculture Society: Baton Rouge, LA, USA, 2012; p. 271. [Google Scholar]
- Samocha, T.M.; Patnaik, S.; Speed, M.; Ali, A.M.; Burger, J.M.; Almeida, R.V.; Ayub, Z.; Harisanto, M.; Horowitz, A.; Brock, D.L. Use of molasses as carbon source in limited discharge nursery and grow-out systems for Litopenaeus vannamei. Aquac. Eng. 2007, 36, 184–191. [Google Scholar] [CrossRef]
- Ebeling, J.M.; Timmons, M.B.; Bisogni, J.J. Engineering analysis of the stoichiometry of photoautotrophic, autotrophic, and heterotrophic removal of ammonia-nitrogen in aquaculture systems. Aquaculture 2006, 257, 346–358. [Google Scholar] [CrossRef] [Green Version]
- Camargo, J.A.; Alonso, A.; Salamanca, A. Nitrate toxicity to aquatic animals: A review with new data for freshwater invertebrates. Chemosphere 2006, 58, 1255–1267. [Google Scholar] [CrossRef] [PubMed]
- Yanbo, W.; Wenju, Z.; Weifen, L.; Zirong, X. Acute toxicity of nitrite on tilapia (Oreochromis niloticus) at different external chloride concentrations. Fish Phys. Bioch. 2006, 32, 49–54. [Google Scholar] [CrossRef] [PubMed]
- Yang, W.; Xiang, F.; Liang, L.; Yang, Z. Toxicity of ammonia and its effects on oxidative stress mechanisms of juvenile crucian carp (Carassius auratus). J. Freshw. Ecol. 2010, 25, 297–302. [Google Scholar] [CrossRef] [Green Version]
- Ferreira, N.C.; Bonetti, C.; Seiffer, W.Q. Hydrological and water quality indices as management tools in marine shrimp culture. Aquaculture 2011, 318, 425–433. [Google Scholar] [CrossRef]
- Xian, J.A.; Wang, A.L.; Hao, X.M.; Miao, Y.T.; Li, B.; Ye, C.X.; Liao, S.A. In vitro toxicity of nitrite on haemocytes of the tiger shrimp Penaeus monodon, using flow cytometric analysis. Comp. Bioch. Phys. Part C 2012, 156, 75–79. [Google Scholar] [CrossRef]
- Kim, J.H.; Park, H.J.; Hwang, I.K.; Han, J.M.; Kim, D.H.; Oh, C.W.; Lee, J.-S.; Kang, J.-C. Toxic effects of juvenile sablefish, Anoplopoma fimbria by ammonia exposure at different water temperature. Envir. Toxic. Pharm. 2017, 54, 169–176. [Google Scholar] [CrossRef] [PubMed]
- Bartoli, M.; Nizzoli, D.; Castaldelli, G.; Vialroli, P. Community metabolism and buffering capacity of nitrogen in a Ruppia cirrhosa meadow. J. Exp. Mar. Biol. Ecol. 2008, 360, 21–30. [Google Scholar] [CrossRef]
- Yun, L.; Yu, Z.; Li, Y.; Luo, P.; Jiang, X.; Tian, Y.; Ding, X. Ammonia nitrogen and nitrite removal by a heterotrophic Sphingomonas sp. strain LPN080 and its potential application in aquaculture. Aquaculture 2019, 500, 477–484. [Google Scholar] [CrossRef]
- Robles-Porchas, G.R.; Gollas-Galván, T.; Martínez-Porchas, M.; Martínez-Cordova, L.R.; Miranda-Baeza, A.; Vargas-Albores, F. The nitrification process for nitrogen removal in biofloc system aquaculture. Rev. Aquac. 2020, 12, 2228–2249. [Google Scholar] [CrossRef]
- Romano, N.; Zeng, C. Toxic effects of ammonia, nitrite, and nitrate to decapod crustaceans: A review on factors influencing their toxicity, physiological consequences, and coping mechanisms. Rev. Fish. Sci. 2013, 21, 1–21. [Google Scholar] [CrossRef]
- Long, L.N.; Yang, J.; Li, Y.; Guan, C.W.; Wu, F. Effect of biofloc technology on growth, digestive enzyme activity, hematology, and immune response of genetically improved farmed tilapia (Oreochromis niloticus). Aquaculture 2015, 448, 135–141. [Google Scholar] [CrossRef]
- Khatoon, H.; Banerjee, S.; Yuan, G.T.G.; Haris, N.; Ikhwanuddin, M.; Ambak, M.A.; Endut, A. Biofloc as a potential natural feed for shrimp postlarvae. Inter. Biodet. Biodeg. 2016, 113, 304–309. [Google Scholar] [CrossRef]
- Maciel, J.C.; Francisco, C.J.; Miranda, K.C. Compensatory growth and feed restriction in marine shrimp production, with emphasis on biofloc technology. Aqua. Int. 2018, 26, 203–212. [Google Scholar] [CrossRef] [Green Version]
- Krummenauer, D.; Samocha, T.; Poersch, L.; Lara, G.; Wasielesky, W. The reuse of water on the culture of pacific white shrimp, litopenaeus vannamei, in BFT system. J. World Aquac. Soc. 2014, 45, 3–14. [Google Scholar] [CrossRef]
- Emerenciano, M.G.C.; Martínez-Córdova, L.R.; Martínez-Porchas, M.; Miranda-Baeza, A. Biofloc Technology (BFT): A Tool for Water Quality Management in Aquaculture. Water Qual. 2018, 5, 92–109. [Google Scholar] [CrossRef] [Green Version]
- Timmons, M.B.; Ebeling, J.M.; Wheaton, F.W.; Sommerfelt, S.T.; Vinci, B.J. Recirculating Aquaculture Systems, 2nd ed.; Caruga Aqua Ventures: New York, NY, USA, 2002. [Google Scholar]
- Woynárovich, A.; Anrooy, R.V. Field Guide to the Culture of Tambaqui (Colossoma Macropomum, Cuvier, 1816); FAO—Fisheries and Aquaculture Technical Paper, No. 624; Food and Agriculture Organization of the United Nations: Rome, Italy, 2018. [Google Scholar]
- Silva, C.R.; Gomes, L.C.; Brandão, F.R. Effect of feeding rate and frequency on tambaqui (Colossoma macropomum) growth, production and feeding costs during the first growth phase in cages. Aquaculture 2007, 264, 135–139. [Google Scholar] [CrossRef]
- Abdel-Hakim, N.F.; State, H.A.A.; Al-Azab, A.A.; El-Kholy, K.F. Effect of Feeding Regimes on Growth Performance of Juvenile Hybrid Tilapia (Oreochromis niloticus × Oreochromis aureus). World J. Agric. Sci. 2019, 5, 49–54. [Google Scholar]
- Favero, G.C.; Boaventura, T.P.; Ferreira, A.L.; Silva, A.C.F.; Porto, L.A.; Luz, R.K. Fasting/re-feeding and water temperature promote the mobilization of body reserves in juvenile freshwater carnivorous catfish Lophiosilurus alexandri. Aquaculture 2019, 511, 734223. [Google Scholar] [CrossRef]
- Mozanzadeh, M.; Zabayeh Najafabadi, M.; Torfi, M.; Safari, O.; Oosooli, R.; Mehrjooyan, S.; Pagheh, E.; Javad Hoseini, S.; Saghavi, H.; Monem, J.; et al. Compensatory growth of Sobaity (Sparidentex hasta) and yellowfin seabreams (Acanthopagrus latus) relative to feeding rate during nursery phase. Aquac. Nutr. 2021, 27, 468–476. [Google Scholar] [CrossRef]
- Borghetti, J.R.; Canzi, C. The effect of water temperature and feeding rate on the growth rate of pacu (Piaractus mesopotamicus) raised in cages. Aquaculture 1993, 114, 93–101. [Google Scholar] [CrossRef]
- Robinson, E.H.; Li, M.H. Effect of dietary protein concentration and feeding rate on weight gain, feed efficiency, and body composition of pond-raised channel catfish Ictalurus punctatus. J. World Aquac. Soc. 1999, 30, 311–318. [Google Scholar] [CrossRef]
- Soares, E.C.; Pereira-Filho, M.; Roubach, R.; Silva, R.C.S. Condicionamento alimentar no desempenho zootécnico do tucunaré. Rev. Bras. Enga. Pesca. 2007, 2, 35–48. [Google Scholar]
- Assis, Y.P.A.S.; de Assis Porto, L.; de Melo, N.F.A.C.; Palheta, G.D.A.; Luz, R.K.; Favero, G.C. Feed restriction as a feeding management strategy in Colossoma macropomum juveniles under recirculating aquaculture system (RAS). Aquaculture 2020, 529, 735689. [Google Scholar] [CrossRef]
- Paz, A.L.; Pastrana, Y.M.; Brandão, L.V. Food deprivation does not affect growth performance of juvenile tambacu. Acta Amaz. 2018, 48, 207–210. [Google Scholar] [CrossRef]
- Santos, E.L.; Soares, A.C.L.; Tenório, O.L.D.; Soares, E.C.; Silva, T.J.; Gusmão Júnior, L.F.; Santos, E.L. Desempenho de tambaquis (Colossoma macropomum) submetidos a restrição alimentar e a realimentação em tanques—rede. Arq. Bras. Med. Vet. Zootec. 2018, 70, 931–938. [Google Scholar] [CrossRef] [Green Version]
- Correa, A.D.S.; Pinho, S.M.; Molinari, D.; Pereira, K.D.R.; Gutiérrez, S.M.; Monroy-Dosta, M.D.C.; Emerenciano, M.G.C. Rearing of Nile tilapia (Oreochromis niloticus) juveniles in a biofloc system employing periods of feed deprivation. J. Appl. Aquac. 2020, 32, 139–156. [Google Scholar] [CrossRef]
- Abrar, W.A.; Pamukas, N.A.; Putra, I.; Penelitian, W. The effect of probiotic addition in feed towards growth performance and survival rate of tambaqui (Colossoma macropomum) using Bioflocs System. Jur. Perik. Kel. 2019, 24, 32–40. [Google Scholar]
- Oliveira, W.D.S.; Ferreira, J.D.N.; Gonçalves, M.D.S.; Castro, Í.P.; Marinho-Pereira, T.; Cavero, B.A.S. Resíduo De Macaxeira E De Banana Como Fontes De Carbono Na Criação De Tambaqui (Colossoma macropomum) Em Sistema Bioflocos No Estado Do Amazonas, Brasil / Cassava and Banana Residue As Carbon Sources in the Biofloc System Cultivation of Tambaqui (Colossoma macropomum) in Amazonas State, Brazil. Brazilian J. Dev. 2020, 6, 76711–76724. [Google Scholar] [CrossRef]
- Santos, R.B.; Izel-Silva, J.; Fugimura, M.M.S.; Suita, S.M.; Ono, E.A.; Affonso, E.G. Growth performance and health of juvenile tambaqui, Colossoma macropomum, in a biofloc system at different stocking densities. Aquac. Res. 2021, 52, 3549–3559. [Google Scholar] [CrossRef]
- Wasielesky, W.; Atwood, H.; Stokes, A.; Browdy, C.L. Effect of natural production in a zero-exchange suspended microbial floc based super-intensive culture system for white shrimp Litopenaeus vannamei. Aquaculture 2006, 258, 396–403. [Google Scholar] [CrossRef]
- García-Ríos, L.; Miranda-Baeza, A.; Coelho-Emerenciano, M.G.; Huerta-Rábago, J.A.; Osuna-Amarillas, P. Biofloc technology (BFT) applied to tilapia fingerlings production using different carbon sources: Emphasis on commercial applications. Aquaculture 2019, 502, 26–31. [Google Scholar] [CrossRef]
- Avnimelech, Y. Biofloc Technology: A Practical Guidebook; The World Aquaculture Society: Baton Rouge, LA, USA, 2009; p. 182. [Google Scholar]
- Corrêa, R.O.; Sousa, A.R.B.; Junior, H.M. Criação de Tambaquis; Embrapa: Brasília, Brasil, 2018; ISBN 9788570358226; Available online: http://www.embrapa.br/amazonia-oriental/publica%C3%A7%C3%B5es (accessed on 10 February 2022).
- UNESCO. Chemical Methods for Use in Marine Environmental Monitoring; Pages 29–36 in Manual and guides 12; Intergovernmental Oceanographic Commission: Paris, France, 1983. [Google Scholar]
- Aminot, A.; Chaussepied, M. Manuel des Analyses Chimiques en Milieu Marin; CNEXO: Paris, France, 1983; p. 395. [Google Scholar]
- Monteiro, M.I.C.; Ferreira, F.N.; de Oliveira, N.M.M.; Ávila, A.K. Simplified version of the sodium salicylate method for analysis of nitrate in drinking water. Anal. Chim. Acta. 2003, 477, 125–129. [Google Scholar] [CrossRef]
- Eaton, A.D.; Cleserci, L.S.; Greenberg, A.E. Standard Methods for the Examination of Water and Waste Water, 10th ed.; American Public Health Association: Washington, DC, USA, 1995. [Google Scholar]
- Gaona, C.A.P.; Serra, F.P.; Furtado, P.S.; Poersch, L.H.; Wasielesky, W. Biofloc management with different flow rates for solids removal in the Litopenaeus vannamei BFT culture system. Aquac. Int. 2016, 24, 1263–1275. [Google Scholar] [CrossRef]
- Furtado, P.S.; Poersch, L.H.; Wasielesky, W. Effect of calcium hydroxide, carbonate and sodium bicarbonate on water quality and zootechnical performance of shrimp Litopenaeus vannamei reared in bioflocs technology (BFT) systems. Aquaculture 2011, 321, 130–135. [Google Scholar] [CrossRef]
- Jomori, R.K.; Luz, R.K.; Takata, R.; Perez Fabregat, T.E.H.; Portella, M.C. Água Levemente Salinizada Aumenta a Eficiência Da Larvicultura De Peixes Neotropicais. Pesqui. Agropecu. Bras. 2013, 48, 809–815. [Google Scholar] [CrossRef]
- Fiúza, L.S.; Aragão, N.M.; Ribeiro Junior, H.P.; de Moraes, M.G.; Rocha, Í.R.C.B.; Lustosa Neto, A.D.; de Sousa, R.R.; Madrid, R.M.M.; de Oliveira, E.G.; Costa, F.H.F. Effects of salinity on the growth, survival, haematological parameters and osmoregulation of tambaqui Colossoma macropomum juveniles. Aquac. Res. 2015, 46, 1–9. [Google Scholar] [CrossRef]
- Goldenfarb, P.B.; Bowyer, F.P.; Hall, E.; Brosious, E. Reproducibility in the hematology laboratory: The microhematocrit determination. Am. J. Clin. Path. 1971, 56, 35–39. [Google Scholar] [CrossRef]
- Mattioli, C.C.; Takata, R.; Paes Leme, F.D.O.; Costa, D.C.; Melillo Filho, R.; de Souza e Silva, W.; Luz, R.K. The effects of acute and chronic exposure to water salinity on juveniles of the carnivorous freshwater catfish Lophiosilurus alexandri. Aquaculture 2017, 481, 255–266. [Google Scholar] [CrossRef]
- Brittelli, M.R.; Hans, H.; Che, C.; Muska, C.F. Induction of brachial (gill) neoplasm in the Medaka fish (Oryzias latipes) by V-methyl-AT-nitrito-A-nitrosoguanidine. Cancer Res. 1985, 45, 3209–3214. [Google Scholar]
- Araújo-Lima, C.; Goulding, M. So Fruitful a Fish: Ecology, Conservation and Aquaculture of the Amazon´s Tambaqui; Columbia University Press: New York, NY, USA, 1997; p. 191. [Google Scholar]
- Avnimelech, Y. Feeding with microbial flocs by tilapia in minimal discharge bioflocs technology ponds. Aquaculture 2007, 264, 140–147. [Google Scholar] [CrossRef]
- Emerenciano, M.; Cuzon, G.; Paredes, A.; Gaxiola, G. Evaluation of biofloc technology in pink shrimp Farfantepenaeus duorarum culture: Growth performance, water quality, microorganisms’ profile and proximate analysis of biofloc. Aquac. Int. 2013, 21, 1381–1394. [Google Scholar] [CrossRef]
- Becerril-Cortés, D.; Monroy-Dosta, M.D.C.; Emerenciano, M.G.C.; Sofia, B.; Bermúdez, S.; Correa, G.V.; Castro-Mejía, G.; Bermúdez, S.; Avnimelech, B.S. Effect on nutritional composition of produced bioflocs with different carbon sources (Molasses, coffee waste and rice bran) in Biofloc system. Int. J. Fish. Aquat. Stud. 2018, 6, 541–547. [Google Scholar]
- FAO; Eurofish. A Guide to Recirculation Aquaculture; Rep. 100; FAO: Rome, Italy; Eurofish: Copenhagen, Denmark, 2015. [Google Scholar]
- Abakari, G.; Luo, G.; Kombat, E.O. Dynamics of nitrogenous compounds and their control in biofloc technology (BFT) systems: A review. Aquac. Fish. 2021, 6, 441–447. [Google Scholar] [CrossRef]
- Costa, O.T.F.; Dos Santos Ferreira, D.J.; Presti Mendonça, F.L.; Fernandes, M.N. Susceptibility of the Amazonian fish, Colossoma macropomum (Serrasalminae), to short-term exposure to nitrite. Aquaculture 2004, 232, 627–636. [Google Scholar] [CrossRef]
- Perrone, S.J.; Meade, T.J. Protective effects of chloride on nitrite toxicity to coho salmon (Oncorhynchus kisutch). J. Fish. Res. Boar. Can. 1977, 34, 486–492. [Google Scholar] [CrossRef]
- Williams, E.M.; Eddy, F.B. Chloride uptake in freshwater teleosts and its relationship to nitrite uptake and toxicity. J. Comp. Phys. B 1986, 156, 867–872. [Google Scholar] [CrossRef]
- Moraes, G.; Avilez, I.M.; Hori, T.S.F. Comparison between biochemical responses of the teleost pacu and its hybrid tambacu (Piaractus mesopotamicus × Colossoma macropomum) to short term nitrite exposure. Braz. J. Biol. 2006, 66, 1103–1108. [Google Scholar] [CrossRef] [Green Version]
- Knudsen, P.K.; Jensen, F.B. Recovery from nitrite-induced methaemoglobinaemia and potassium balance disturbances in carp. Fish Physiol. Biochem. 1997, 16, 1–10. [Google Scholar] [CrossRef]
- Avilez, I.M.; Altran, A.E.; Aguiar, L.H.; Moraes, G. Hematological responses of the Neotropical teleost matrinxã (Brycon cephalus) to environmental nitrite. Comp. Biochem. Physiol. C Toxicol. Pharmacol. 2004, 139, 135–139. [Google Scholar] [CrossRef]
- Ciji, A.; Sahu, N.P.; Pal, A.K.; Akhtar, M.S.; Tincy, V.; Mishal, P.; Das, P. Effect of dietary vitamin e and nitrite exposure on growth and metabolic variables of Labeo rohita juveniles. Natl. Acad. Sci. Lett. 2014, 37, 123–129. [Google Scholar] [CrossRef]
- Sgnaulin, T.; de Mello, G.L.; Thomas, M.C.; Garcia, J.R.E.; de Oca, G.A.R.M.; Emerenciano, M.G.C. Biofloc technology (BFT): An alternative aquaculture system for piracanjuba Brycon orbignyanus? Aquaculture 2018, 485, 119–123. [Google Scholar] [CrossRef]
- Araújo-Lima, C.A.R.M. Tambaqui (Colossoma macropomum). In Espécies Nativas Para Piscicultura no BRASIL, 2nd ed.; Baldisserotto, B., Gomes, L.D.C., Eds.; UFSM: Santa Maria, Brasil, 2010; pp. 175–204. [Google Scholar]
- Santos, F.A.C.; Boaventura, T.P.; da Costa Julio, G.S.; Cortezzi, P.P.; Figueiredo, L.G.; Favero, G.C.; Palheta, G.D.A.; de Melo, N.F.A.C.; Luz, R.K. Growth performance and physiological parameters of Colossoma macropomum in a recirculating aquaculture system (RAS): Importance of stocking density and classification. Aquaculture 2021, 534, 736274. [Google Scholar] [CrossRef]
- Silva, W.D.S.; Hisano, H.; Mattioli, C.C.; Torres, I.F.A.; Paes-Leme, F.D.O.; Luz, R.K. Effects of cyclical short-term fasting and refeeding on juvenile Lophiosilurus alexandri, a carnivorous neotropical catfish. Aquaculture 2019, 505, 12–17. [Google Scholar] [CrossRef]
- Frisso, R.M.; de Matos, F.T.; Moro, G.V.; de Mattos, B.O. Stocking density of Amazon fish (Colossoma macropomum) farmed in a continental neotropical reservoir with a net cages system. Aquaculture 2020, 529, 735702. [Google Scholar] [CrossRef]
- Xu, W.J.; Pan, L.Q.; Zhao, D.H.; Huang, J. Preliminary investigation into the contribution of bioflocs on protein nutrition of Litopenaeus vannamei fed with different dietary protein levels in zero-water exchange culture tanks. Aquaculture 2012, 350–253, 147–153. [Google Scholar] [CrossRef]
- Ekasari, J.; Rivandi, D.R.; Firdausi, A.P.; Surawidjaja, E.H.; Zairin, M.; Bossier, P.; De Schryver, P. Biofloc technology positively affects Nile tilapia (Oreochromis niloticus) larvae performance. Aquaculture 2015, 441, 72–77. [Google Scholar] [CrossRef]
- Bossier, P.; Ekasari, J. Biofloc technology application in aquaculture to support sustainable development goals. Microb. Biotechnol. 2017, 10, 1012–1016. [Google Scholar] [CrossRef]
- Xu, W.; Zhang, Q.; Chen, Y.; Zhang, Y.; Zhou, C. Effects of dietary carbohydrate types on growth performance, innate immunity, antioxidant ability and glucose metabolism of brook trout Salvelinus fontinalis. Aquac. Res. 2020, 51, 4638–4648. [Google Scholar] [CrossRef]


| Performance | Day 30 | Day 60 |
|---|---|---|
| Weight (W) (g) 1 | 31.06 ± 1.03 b | 37.71 ± 2.88 a |
| Total length (L) (cm) 2 | 13.19 ± 0.29 b | 13.95 ± 0.32 a |
| Biomass (g) 1 | 372.68 ± 12.40 b | 452.49 ± 34.61 a |
| Production (kg m−3) 1 | 4.66 ± 0.15 b | 5.42 ± 0.58 a |
| Feed conversion rate (FCR) 1 | 1.90 ± 0.22 b | 3.14 ± 1.27 a |
| Freed intake (FI) (g) 1 | 18.46 ± 0.34 b | 30.33 ± 2.94 a |
| Weight gain (WG) (g) 1 | 9.81 ± 1.11 a | 6.67 ± 2.69 b |
| Specific growth rate (SGR) (%) 1 | 1.26 ± 0.13 a | 0.65 ± 0.24 b |
| Survival (%) 1 | 100.00 a | 95.83 ± 6.80 a |
| Day | Feeding Frequency | Feeding Rate | Treatment | W (g) | L (cm) | Biomass (g) | Production (kg m−3) | FCR | FI (g) | WG (g) | SGR (%) |
|---|---|---|---|---|---|---|---|---|---|---|---|
| 30 | 6 | 4 | T6 × 4 | 54.65 ± 3.56 | 15.62 ± 0.81 | 327.92 ± 21.38 | 4.09 ± 0.27 | 2.24 ± 0.28 | 24.83 ± 5.46 | 11.37 ± 3.43 | 0.77 ± 0.21 |
| 6 | T6 × 6 | 58.94 ± 5.21 | 16.07 ± 0.52 | 353.65 ± 31.30 | 4.42 ± 0.39 | 2.03 ± 0.37 | 29.95 ± 5.76 | 15.41 ± 5.36 | 1.00 ± 0.31 | ||
| 7 | 4 | T7 × 4 | 65.06 ± 8.14 | 16.38 ± 0.98 | 390.40 ± 48.87 | 4.88 ± 0.61 | 1.64 ± 0.22 | 34.37 ± 10.35 | 21.70 ± 7.90 | 1.33 ± 0.42 | |
| 6 | T7 × 6 | 57.97 ± 10.58 | 16.05 ± 1.10 | 347.87 ± 63.48 | 4.35 ± 0.79 | 3.14 ± 2.07 | 34.71 ± 8.05 | 14.79 ± 10.63 | 0.94 ± 0.61 | ||
| Feeding frequency (P) | 0.225 | 0.422 | 0.225 | 0.225 | 0.481 | 0.087 | 0.212 | 0.376 | |||
| Feeding rate (P) | 0.712 | 0.894 | 0.711 | 0.711 | 0.167 | 0.490 | 0.704 | 0.674 | |||
| Interaction (P) | 0.149 | 0.395 | 0.149 | 0.149 | 0.089 | 0.544 | 0.162 | 0.156 | |||
| 60 | 6 | 4 | T6 × 4 | 69.90 ± 8.95 | 17.18 ± 0.35 | 419.42 ± 53.74 | 5.24 ± 0.67 | 2.77 ± 0.61 | 45.09 ± 6.48 | 15.25 ± 6.05 | 0.80 ± 0.34 |
| 6 | T6 × 6 | 72.69 ± 14.43 | 17.14 ± 1.20 | 436.17 ± 85.56 | 5.45 ± 1.08 | 3.56 ± 2.08 | 50.94 ± 3.43 | 18.64 ± 2.39 | 0.89 ± 0.10 | ||
| 7 | 4 | T7 × 4 | 82.24 ± 5.20 | 18.29 ± 0.86 | 493.46 ± 31.21 | 6.17 ± 0.39 | 2.13 ± 0.14 | 56.07 ± 11.32 | 17.17 ± 4.94 | 0.79 ± 0.36 | |
| 6 | T7 × 6 | 78.21 ± 14.84 | 18.22 ± 1.10 | 469.27 ± 89.07 | 5.86 ± 1.11 | 2.39 ± 0.51 | 62.63 ± 16.57 | 20.23 ± 6.33 | 0.99 ± 0.35 | ||
| Feeding frequency (P) | 0.301 | 0.076 | 0.301 | 0.981 | 0.315 | 0.09 | 0.292 | 0.855 | |||
| Feeding rate (P) | 0.587 | 0.612 | 0.587 | 0.563 | 0.524 | 0.074 | 0.581 | 0.380 | |||
| Interaction (P) | 0.202 | 0.513 | 0.202 | 0.205 | 0.091 | 0.259 | 0.208 | 0.792 | |||
Publisher’s Note: MDPI stays neutral with regard to jurisdictional claims in published maps and institutional affiliations. |
© 2022 by the authors. Licensee MDPI, Basel, Switzerland. This article is an open access article distributed under the terms and conditions of the Creative Commons Attribution (CC BY) license (https://creativecommons.org/licenses/by/4.0/).
Share and Cite
Nakayama, C.L.; Silva, L.F.S.; Santos, F.A.C.d.; Boaventura, T.P.; Favero, G.C.; Palheta, G.D.A.; Correia de Melo, N.F.A.; Romano, L.A.; Luz, R.K. Zootechnical Performance and Some Physiological Indices of Tambaqui, Colossoma macropomum Juveniles during Biofloc Maturation and in Different Feed Regimes. Agriculture 2022, 12, 1025. https://doi.org/10.3390/agriculture12071025
Nakayama CL, Silva LFS, Santos FACd, Boaventura TP, Favero GC, Palheta GDA, Correia de Melo NFA, Romano LA, Luz RK. Zootechnical Performance and Some Physiological Indices of Tambaqui, Colossoma macropomum Juveniles during Biofloc Maturation and in Different Feed Regimes. Agriculture. 2022; 12(7):1025. https://doi.org/10.3390/agriculture12071025
Chicago/Turabian StyleNakayama, Cintia Labussière, Luiz Felipe Silveira Silva, Fabio Aremil Costa dos Santos, Tulio Pacheco Boaventura, Gisele Cristina Favero, Glauber David Almeida Palheta, Nuno Filipe Alves Correia de Melo, Luiz Alberto Romano, and Ronald Kennedy Luz. 2022. "Zootechnical Performance and Some Physiological Indices of Tambaqui, Colossoma macropomum Juveniles during Biofloc Maturation and in Different Feed Regimes" Agriculture 12, no. 7: 1025. https://doi.org/10.3390/agriculture12071025
APA StyleNakayama, C. L., Silva, L. F. S., Santos, F. A. C. d., Boaventura, T. P., Favero, G. C., Palheta, G. D. A., Correia de Melo, N. F. A., Romano, L. A., & Luz, R. K. (2022). Zootechnical Performance and Some Physiological Indices of Tambaqui, Colossoma macropomum Juveniles during Biofloc Maturation and in Different Feed Regimes. Agriculture, 12(7), 1025. https://doi.org/10.3390/agriculture12071025