Article

Experimental Study on the Droplet Size and Charge-to-Mass Ratio of an Air-Assisted Electrostatic Nozzle

1
High-Tech Key Laboratory of Agricultural Equipment and Intelligence of Jiangsu Province, Jiangsu University, Zhenjiang 212013, China
2
School of Agricultural Engineering, Jiangsu University, Zhenjiang 212013, China
3
State Key Laboratory of Soil-Plant-Machinery System Technology, Chinese Academy of Agricultural Mechanization Sciences, Beijing 100083, China
*
Author to whom correspondence should be addressed.
Agriculture 2022, 12(6), 889; https://doi.org/10.3390/agriculture12060889
Submission received: 10 May 2022 / Revised: 15 June 2022 / Accepted: 19 June 2022 / Published: 20 June 2022
(This article belongs to the Section Crop Protection, Diseases, Pests and Weeds)

Abstract

:
An air-assisted electrostatic nozzle uses a combination of air-assisted atomization and electrostatic spray technology. This article optimizes the existing air-assisted electrostatic nozzles in terms of structural design to obtain a higher charge-to-mass ratio and a smaller droplet size. The optimized air-assisted electrostatic nozzle was studied experimentally, and the effects of liquid pressure, air pressure and applied voltage on the droplet size and charge-to-mass ratio were investigated. Comparing the effects of air pressure, liquid pressure and applied voltage on the charge-to-mass ratio and droplet size, the relationship curves of the droplet size and charge-to-mass ratio under each voltage were fitted using the Rayleigh charge limit theory. For a higher CMR during the spray operation, applied voltages between 2.5 kV and 3 kV, an air pressure between 0.4 bar and 0.6 bar, and a liquid pressure of less than 0.9 bar could be chosen. The optimized air-assisted electrostatic nozzles not only have small droplets but also have high charge-to-mass ratios, reducing the need for pesticide use and thus protecting human health and the environment.

1. Introduction

Chemical intervention is still the most effective, convenient and economical method of crop protection [1,2]. Because of the imperfection of pesticide spraying equipment and technology, pesticide utilization rate is low. The heavy use of pesticides results in too much pesticide residue on crops, causing damage to operators. Additionally, loss of pesticides in the environment causes environmental pollution, endangering the ecological environment and human health [3,4]. Electrostatic application technology is widely used in the field of crop protection as a new technology that can effectively increase droplet deposition, reduce drift and increase pesticide utilization [5].
The induced electric field is generated by the electrode charged spray droplets which the nozzle sprays. The charged droplets are deposited on the surface of the blade under the force of the electric field, reducing loss and thus increasing pesticide utilization [6,7]. However, electrostatic spraying lacks the ability to improve the canopy penetration of droplets and reduce the drift susceptibility of airborne charged droplets, and auxiliary air supply technology can effectively solve this problem [8]. The air-assisted electrostatic nozzle is a combination of an air-assisted nozzle and electrostatic spray technology. Air-assisted electrostatic nozzles can reduce the number of pesticides used while achieving the same or even better protection [9]. In the design of an air-assisted electrostatic nozzle, the material, geometry and position of the electrode play a crucial role. Electrode materials used are mainly brass, stainless steel and gold-plated, and electrode shapes are mainly circular and flat [10,11,12].
Droplet size and charge-to-mass ratio are two important indicators used to evaluate air-assisted electrostatic nozzles. The main factors affecting the droplet size and charge-to-mass ratio are liquid pressure, air pressure, applied voltage, etc. [13,14]. During the operation of an air-assisted electrostatic nozzle, a high charge-to-mass ratio is required to optimize the trajectory of the droplets during transport, which can increase the underside leaf deposition [15]. In order to maximize the droplets’ charge-to-mass ratio, the effect of applied voltages, liquid pressures and distances on the droplets’ charge-to-mass ratio and ultimate Rayleigh charge-to-mass ratio is investigated in previous papers [16,17,18]. However, there is less research on whether there is a link between droplet size and charge-to-mass ratio.
In the present studies, the atomization process of the air-assisted electrostatic nozzle is such that the liquid column is broken up in parallel air flow [19,20]. In this paper, the structure of the air-assisted electrostatic nozzle is further optimized, changing the airflow of the broken liquid column from a parallel to a cross flow, in order to obtain a smaller droplet size and larger charge-to-mass ratio. The performance of the optimized air-assisted electrostatic nozzle is also studied, and the relationship between the charge-to-mass ratio and droplet size is further investigated in conjunction with the Rayleigh limit.

2. Materials and Methods

2.1. Air-Assisted Electrostatic Nozzle Design

The main form of air-assisted electrostatic nozzle is a nozzle that uses an air-liquid concentric atomization method: This is a twin fluid, internal mixing, air-induced and concentric method [20]. Moreover, the air-assisted electrostatic nozzle charges liquid and droplets based on the induction principle through annular ring concentric electrodes [21]. The hydrodynamics of the liquid flow, the atomization of the liquid and the charging of the liquid sprays are factors that must be considered when designing an air-assisted electrostatic nozzle, and these factors are directly related to the droplet size and charge-to-mass ratio of the droplets [22]. The charge-to-mass ratio varies with changes in charge voltage, hydraulic pressure, air pressure and other factors, as does the droplet size [7]. Therefore, in the design of the air-assisted electrostatic nozzle, the nozzle’s structure is optimized to obtain a higher charge-to-mass ratio and a smaller droplet size.
The air-liquid non-concentric atomization method was adopted to replace the concentric atomization method by changing the liquid channel in the middle of the cylindrical nozzle tip to be evenly distributed around the nozzle tip, as shown in the schematic diagram of Figure 1. Figure 1 A–A depicts a scale enlargement of the nozzle tip’s cross-section and four small circles that indicate the optimized liquid channel. va indicates the velocity of the airflow at the nozzle tip position; vl denotes the velocity of the liquid as it is ejected from the optimized channel; and ð is the angle between the airflow and liquid when they meet in the nozzle tip. In this paper, ð is 20°. The airflow acts as a crossflow to impact the ejected liquid column to make it initially atomized into droplets.
The annular ring electrode is coaxially located at the front of the nozzle. The electric field intensity E is closely related to the characteristics of the annular ring electrode and the applied voltage. The outside diameter, hole diameter and thickness of the annual ring electrodes are 30, 4 and 1 mm, respectively. The electric module of ANSYS is used to study the variation in the electric field intensity at the center axis of the annular ring electrode [23]. The distribution map of the electric field intensity is obtained by numerical simulation when the applied voltage is 3 kV, as shown in Figure 2. D indicates the distance between each point and the central point of the annular ring electrode on the central axis. As D increases, the trend of electric field intensity shows a sharp increase followed by a sharp decrease. The electric field intensity reaches its extreme values, which are 162.66 and 165.27 kV/m at 3.767 mm and −3.767 mm from the center point. In order to make the droplets fully charged, the distance D between the liquid channel outlet and the annular ring electrode should be greater than 3.767 mm, considering the process required to choose a distance D of 4 mm. In order to improve the electric field intensity of the induced electric field, the annular ring electrode material is usually made of nickel, copper, stainless steel and gold-plated materials [10,11,12]. The Fermi level and work function of brass are 7.1 eV and 4.5 eV [24], respectively. Brass is a better induction electrode material. In our experiment, brass was used as an electrode material for spray charging.
Another important parameter of air-assisted electrostatic spray nozzles is the flow rate. For the optimized air-assisted electrostatic nozzle, the diameter of all four liquid channels is 0.5 mm. When the liquid pressure changes from 0.5 bar to 1.3 bar and the air pressure changes from 0.2 bar to 0.6 bar, the liquid flow rate of the air-assisted electrostatic nozzle ranges from 110 to 450 mL/min, and the air flow rate ranges from 39.3 to 68.1 L/min.

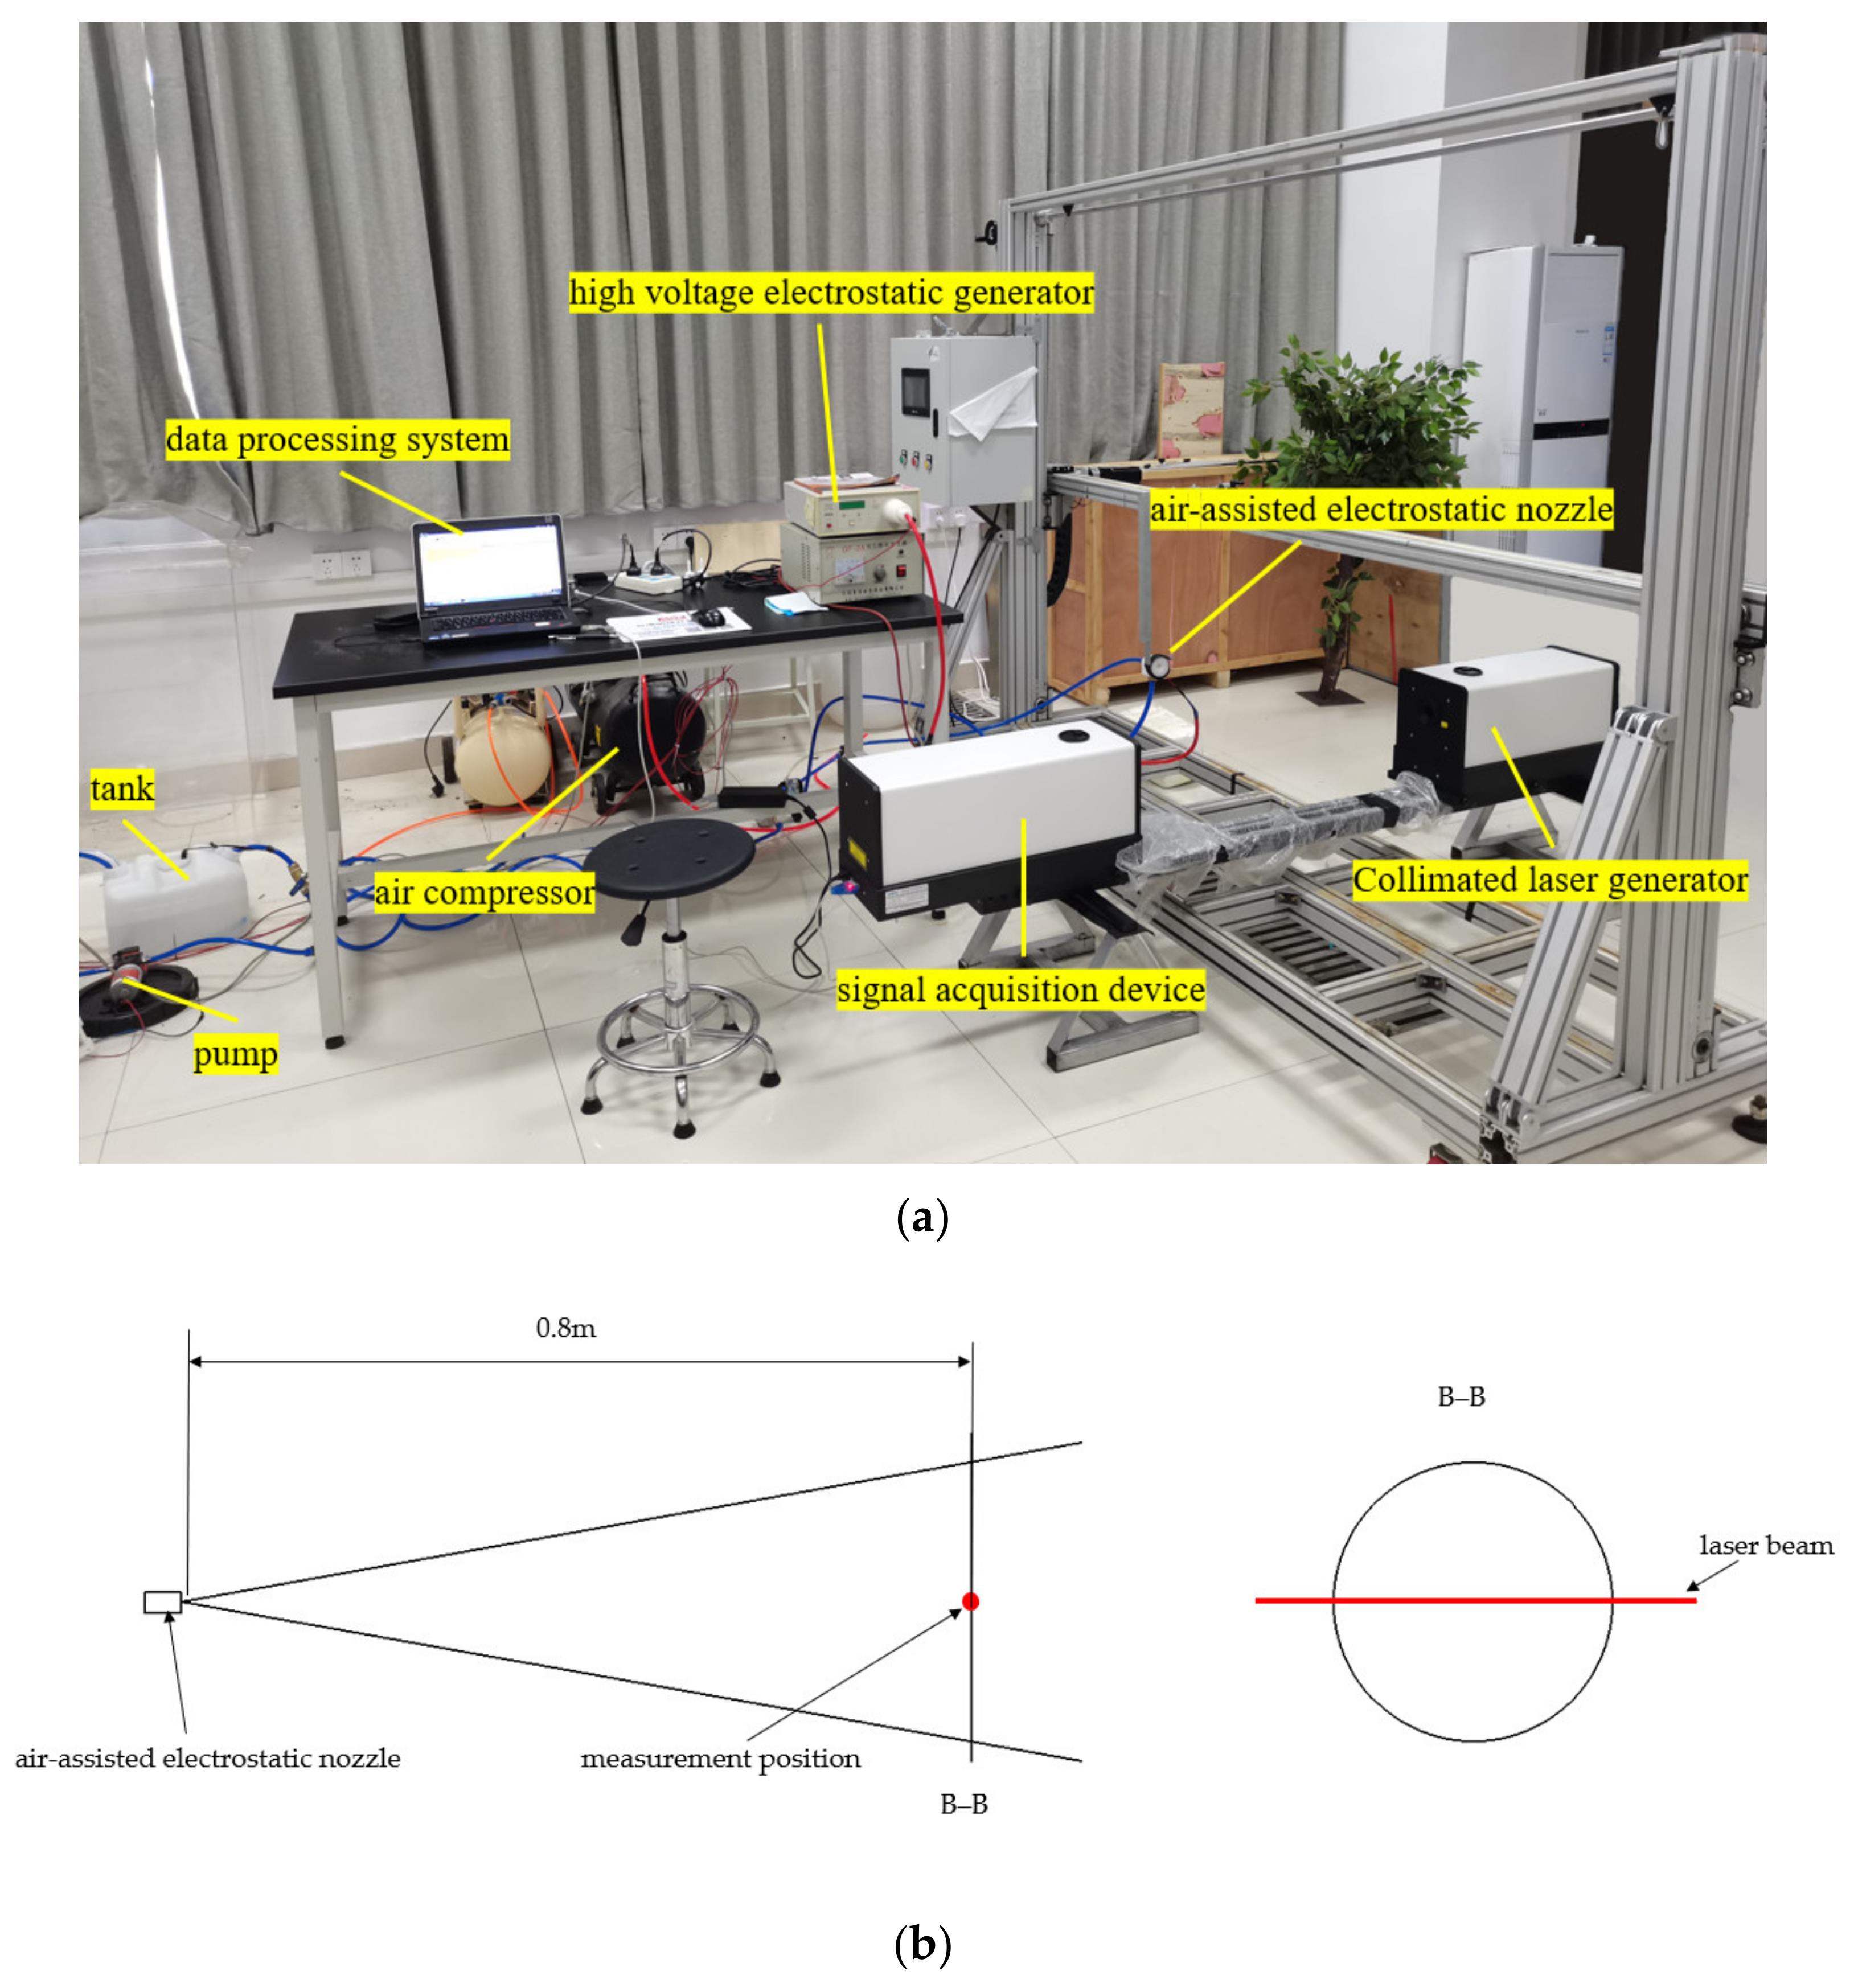
2.2. Electrostatic Spray System Design

As shown in Figure 3, the electrostatic spray system mainly includes an air-assisted electrostatic nozzle, water pump, water tank, high-voltage electrostatic generator and air compressor, etc. The water pump (model no: SFDP1-013-100-22; flow variation range: 0–5 L/min; pressure variation range: 0–6.9 bar) supplies liquid for the air-assisted electrostatic nozzle, powered by a 12 V lead battery. The high-voltage electrostatic generator (model no:GF-2A; input voltage: 220 V; output voltage variation range: 0–20 kV) provides the high-voltage static electricity required by the air-assisted electrostatic nozzle. The high-voltage electrostatic generator needs to be grounded at the same time as the high-voltage output. The air compressor (flow rate 300 L/min; rated pressure: 7 bar) supplies the airflow required by the air-assisted electrostatic nozzle.

2.3. Experimental Set-Up to Measure the Droplet Size

The experimental set-up to measure the droplet size includes the electrostatic spray system and laser particle size analyzer (model no: OMEC DP-02; measurement range: 0.5–1500 μm), as shown in Figure 3a. The laser particle size analyzer works on the theory of electromagnetic waves and measures the distribution of tiny particles based on the distribution of scattered light. The laser particle size analyzer consists of a collimated laser generator, signal acquisition device and data processing system. The collimated laser generator consists of a fixed wavelength (λ = 0.6328 μm) He-Ne gas laser source, which could offer good stability and a better signal-to-noise ratio [25,26], as well as a collimating and beam expanding system and collimating lens. The signal acquisition device mainly consists of a Fourier lens, main detector, auxiliary detector, regulated power supply and a data acquisition circuit. The data processing system consists of a computer and a program.
In this experiment, the air-assisted electrostatic nozzle is fixed between the collimated laser generator and signal acquisition device by an insulated rod. As shown in Figure 3b, the air-assisted electrostatic nozzle is 0.8 m away from the laser beam which is generated by the collimated laser generator. Additionally, they are in the same horizontal plane to ensure that the air-assisted electrostatic nozzle ejects a cloud of droplets that pass through the laser beam generated by the laser particle size analyzer [27,28]. Figure 3 B–B is a cross-section of the solid cone jet, sprayed by the air-assisted electrostatic nozzle at 0.8 m. The laser beam of the laser particle size analyzer passes through the center of the cross-section. Due to the presence of the extremely strong adsorption of charged droplets, the Fourier lens and collimating lens of the laser particle size analyzer need to be frequently wiped with wiping paper to prevent the attached droplets from affecting the test data.
The laser particle size analyzer can measure the air-assisted spray nozzle’s droplet size and droplet distribution parameters, such as DV10, DV50, DV90, etc. DVn indicates that the diameter, which is n% of the total spray volume, is made up of droplets of an equal or lesser diameter. The diameter that is 50% of the total spray volume is the volume median diameter (VMD) [29]. In this paper, the VMD is chosen as the mean diameter to describe the droplet particle size.
VMD = d i 3 N i N i 1 3

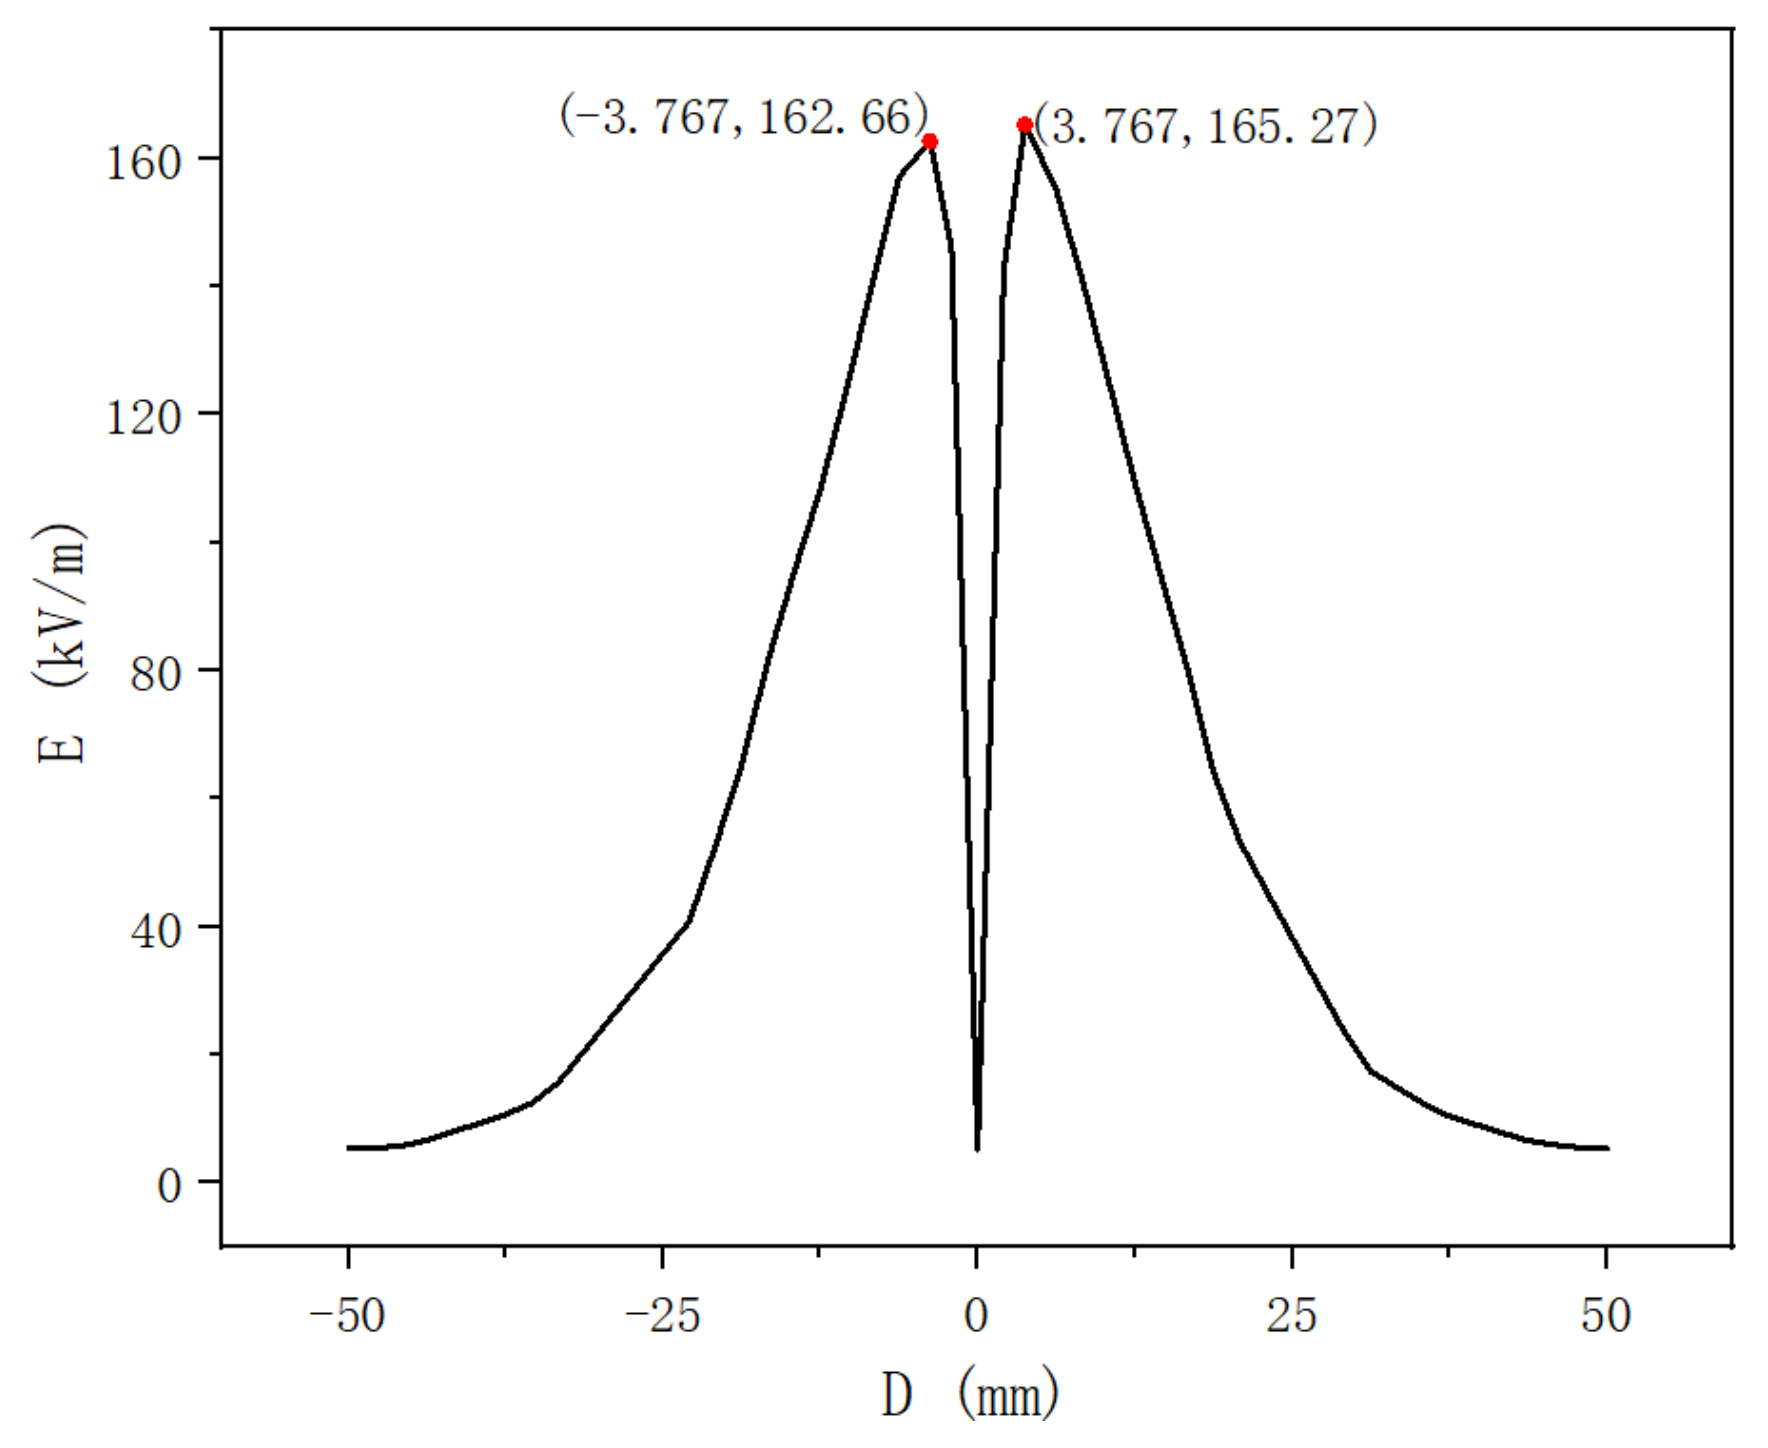
2.4. Experimental Set-Up to Measure the Charge-to-Mass Ratio

The experimental set-up to measure the droplet size includes the electrostatic spray system and Faraday cylinder [30], as shown in Figure 4. The Faraday cylinder is a homemade device that includes a cylinder for capturing charged droplets, a digital multimeter, a beaker for collecting the droplets, and an electronic balance for weighing the droplets. The Faraday cylinder is insulated from the ground. The input of the digital multimeter (model no: Fluke 8808A) is connected to the cylinder collecting the charged droplets and the output is grounded to measure the current of the charged droplets.
To measure the charge-to-mass ratio, the air-assisted electrostatic nozzle is on the centerline of the Faraday cylinder so that the sprayed droplet clouds could be collected as much as possible. The charge-to-mass ratio (CMR) is the number of droplets charged per unit mass, calculated by the ratio of the spray current to the mass flow rate [31,32], as shown in Equation (2).
CMR = Q m = i Q m
where i is the spray current, Qm is the mass flow rate, m is the droplet mass, and Q is the droplet charge.

2.5. Laboratory Test

The size test and the charge-to-mass ratio test were performed in the laboratory. Tap water was used for spraying in the tests and the physical properties of the tap water included a conductivity of 0.206 mS/cm, a density of 0.998 g/mL and a surface tension of 0.073 N/m. Experiments were carried out to measure the droplet size and the charge-to-mass ratio with respect to various parameters, such as air pressure, liquid pressure and applied voltage. The number of air pressure and liquid pressure levels were 5 in both tests. The number of applied voltage levels was 5 in the size test. In order to study the effect of the applied voltage on the charge-to-mass ratio in more detail, the number of applied voltage levels was 8 in the charge-to-mass ratio test. The levels of the three parameters were shown in Table 1. During the tests, the temperature of the laboratory was 296 ± 2 K and the relative humidity was 60 ± 4%.

3. Results and Discussion

3.1. VMD Variation with Air Pressure and Liquid Pressure

In order to explore the influence of air pressure and liquid pressure on the VMD, Figure 5 shows the droplet size test data with the applied voltage of 0 kV and 3 kV. Regardless of whether the applied voltage is 0 kV or 3 kV, the VMD decreases with the increase in air pressure, whereas the VMD presents a rising trend in the increase in liquid pressure. These phenomena are consistent with the pattern of the Nukiyama Formula [33], as shown in Equation (3).
d = K 1 v l v a σ ρ + K 2 μ 2 σ ρ 0.225 ( 1000 Q l Q a ) 1.5
where v l and v a are the liquid velocity and air velocity as shown in Figure 1, σ is the surface tension, ρ is the liquid density, μ is the viscosity of the liquid, Q l is the volume of liquid flow rate and Q a is the volume of air flow rate.
The main reason for this is that increased air pressure causes an increase in v a and Q a . Therefore, v l v a becomes bigger because v a is much larger than v l . When other conditions are constant, the VMD decreases. Similarly, increased liquid pressure results in increased v l and Q l , so that v l v a becomes smaller and Q l becomes bigger. When other conditions are constant, the VMD increases.
To investigate the effect of liquid pressure and air pressure on the amount of VMD variation, ΔVMD is defined as the VMD difference between two operation conditions (air pressure, liquid pressure and applied voltage). For example, when the liquid pressure and applied voltage are stable, the ΔVMD of the air pressure that changed from 0.2 to 0.3 bar is the value of the VMD of 0.3 bar air pressure minus the VMD of 0.2 bar air pressure. Because the VMD decreases with the increase in air pressure, the ΔVMD of the air pressure’s increase is negative. Although the increase in liquid pressure results in the increase in the VMD, the ΔVMD of the air pressure has a positive increase. In this paper, the ΔVMD is compared using absolute values.
In Figure 5c,d, the horizontal coordinate i–j indicates that the pressure change from i to j. For example, 0.2–0.3 indicates that the air pressure changes from 0.2 bar to 0.3 bar in Figure 5c. In Figure 5c, the ΔVMD of the air pressure that changed from 0.2 to 0.3 bar is the biggest and the ΔVMD of the air pressure that changed from 0.3 to 0.4 bar is second. On the other hand, the ΔVMD of the air pressure that changed from 0.4 to 0.5 bar and 0.5 to 0.6 bar is smaller. In addition, the ΔVMDs of the air pressure changed from 0.2 to 0.6 bar are 41.744, 42.899, 42.804, 47.988 and 54.340 μm when the liquid pressures are 0.5, 0.7, 0.9, 1.1 and 1.3 bar. The greater the liquid pressure, the greater the ΔVMD. Therefore, with the increase in the VMD, the ΔVMD shows an increasing trend.
This is because droplet splitting is affected by air pressure, surface tension, viscous forces and electric field forces. In the same situation as air pressure, surface tension and electric field forces, the cohesion caused by surface tension will prevent the droplet from breaking up [34], as shown in the following equation:
F s = 4 σ / D
where F s is the cohesion, σ is the surface tension and D is the droplet size. The larger the VMD is, the smaller the cohesion is. Therefore, with the increase in the VMD, the ΔVMD shows an increasing trend.
Figure 5d also shows that the ΔVMD of the liquid pressure that changed from 0.5 to 0.7 bar and 0.7 to 0.9 bar is smaller, whereas the ΔVMD of the liquid pressure that changed from 0.9 to 1.1 bar and 1.1 to 1.3 bar greatly changed. The ΔVMDs of the liquid pressure changed from 0.5 to 1.3 bar are 32.618, 28.594, 27.683, 25.150 and 20.022 μm when the air pressures are 0.2, 0.3, 0.4, 0.5 and 0.6 bar. Therefore, the air pressure becomes greater and the ΔVMD becomes lower. This phenomenon also proves that the ΔVMD showed an increasing trend with the increase in the VMD.
In general, the largest decrease in the VMD occurred when the air pressure changed from 0.2 to 0.3 bar, and the largest increase occurred when the liquid pressure changed from 0.9 to 1.3 bar. In terms of energy saving and emission reduction, the liquid pressure below 0.9 bar and the air pressure above 0.3 bar can be chosen to obtain a smaller VMD.

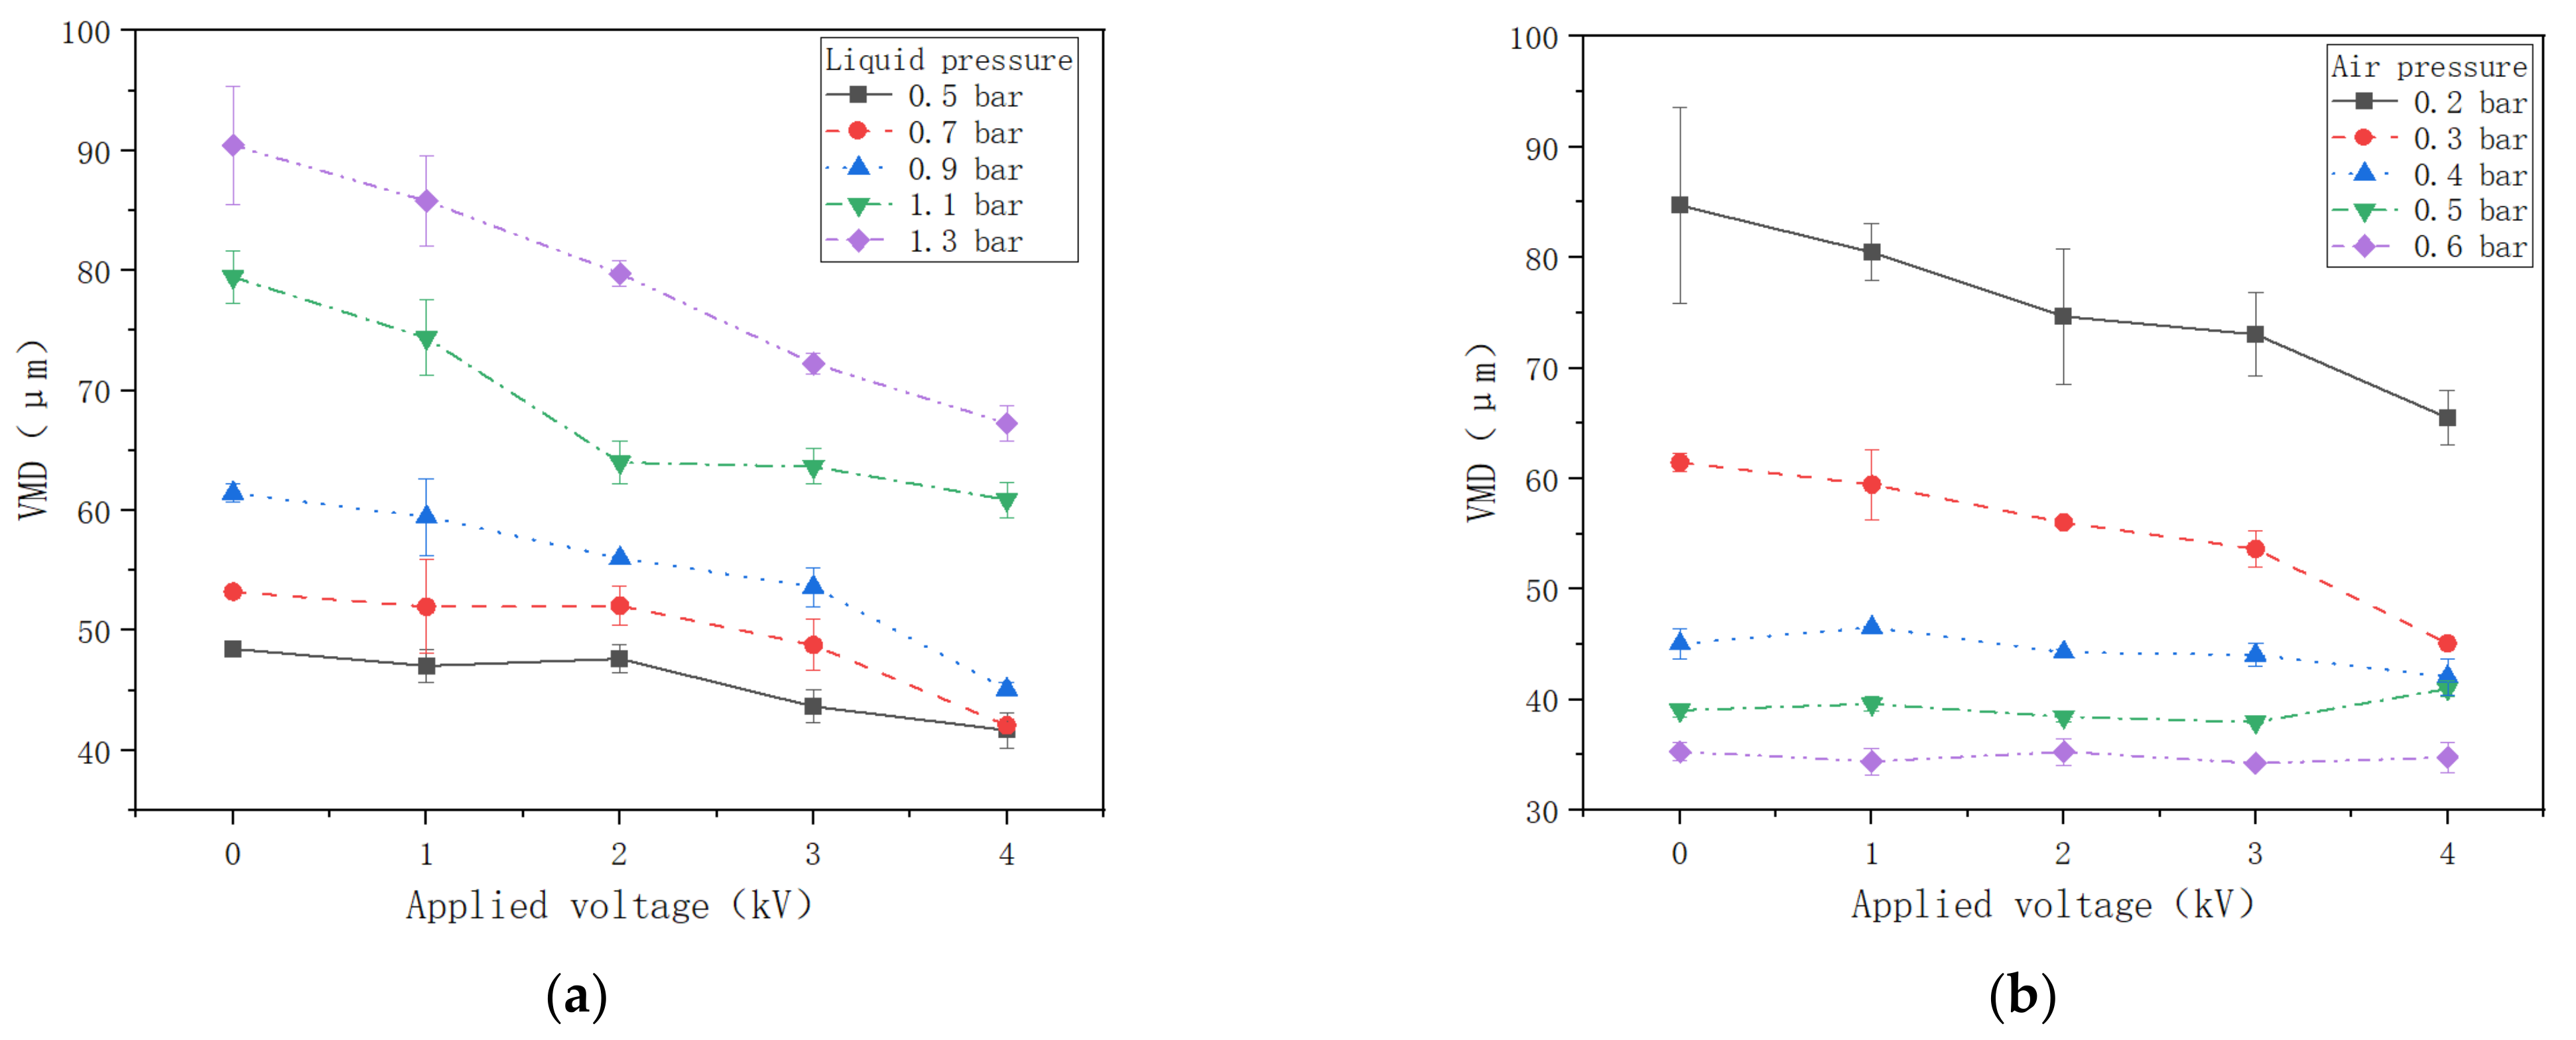
3.2. VMD Variation with the Applied Voltage

When comparing Figure 5a,b, it can be seen that the applied voltage has a significant effect on the VMD. To illustrate this relationship, the data of VMD variation with air pressure when the liquid pressure was 0.9 bar, as well as the data of VMD variation with liquid pressure when the air pressure was 0.3 bar, were selected for processing in Figure 6a in the case of an applied voltage of 0 kV and Figure 6b in the case of an applied voltage of 3 kV. In Figure 6, the VMD’s change ratio α represents the ratio of the VMD after the change in pressure to the initial VMD. For example, in Figure 6a, the α of the air pressure at 0.3 bar is the ratio of 0.3 bar VMD to 0.2 bar VMD. With the increase in air pressure, the VMD decreases. Although the VMD change ratio at 3 kV is bigger than the VMD change ratio at 0 kV, the VMD increases with the increase in liquid pressure. On the other hand, the VMD change ratio at 3 kV is smaller than the VMD change ratio at 0 kV. This proves that the applied voltage does have a large effect on atomization, reducing the VMD.
An increase in the applied voltage results in an increase in the electric field force, and the electric field force can weaken the surface tension of droplets [35]. When the applied voltage rises, the charged value of the droplet rises and the surface tension that is weakened by the electric field force increases, so that droplets are easily broken up.
δ σ = q 2 64 π 2 ε R 3
where δ σ is the surface tension that is weakened by the electric field force, q is the charged value of the droplet, ε is the permittivity of the vacuum and R is the droplet radius.
Figure 7 shows that the VMD decreases with the increase in the applied voltage when the air pressure is 0.3 bar and the liquid pressure is 0.9 bar. In Figure 7a, no matter how the liquid pressure changes, the VMD decreases with the increase in the applied voltage. Furthermore, when the VMD applied voltage changes from 0 to 4 kV, the ΔVMD gets bigger as the liquid pressure increases. In Figure 7b, in the case of a liquid pressure of 0.9 bar, the VMD decreases significantly when the air pressure is 0.2 and 0.3 bar, whereas the VMD decreases insignificantly, or even tends to be constant, when other air pressures are. When the applied voltage changes from 0 to 4 kV, the ΔVMD of an air pressure of 0.2 bar is bigger than the 0.3 bar, VMD and the ΔVMDs of other air pressures level off to 0. When the air pressure is high (close to 0.6 bar), the VMD is constant. It means that the liquid breakup occurs mainly due to air flow rate, and the effect of the electric force in further breakup is negligible.
Studying the data in Figure 7, there is a certain pattern between the initial VMD when the applied voltage is 0 kV and the ΔVMD decreases from 0 to 4 kV. When the initial VMD is higher than 45 μm, the initial VMD and ΔVMD show a positive correlation. When the ΔVMD of other applied voltages levels off to 0, the initial VMD is lower than 45 μm. To further clarify the relationship between the initial VMD and ΔVMD, the two data are fitted into Figure 8. In Figure 8, the ΔVMD variation tends to be close to 0 ± 2.5 μm when the VMD is below 45. The ΔVMD and initial VMD have a linear relationship when the initial VMD is larger than 45 μm. As the VMD decreases, the cohesion increases, and the droplet becomes more unbreakable. When the VMD is less than 45, the effect of the electric field force is negligible.
In addition, when comparing the data of the ΔVMD caused by the change in the applied voltage, there is little difference when the applied voltage increases by 1 kV. Therefore, the selection of voltage application techniques should not only consider the VMD factor but also the CMR factor.

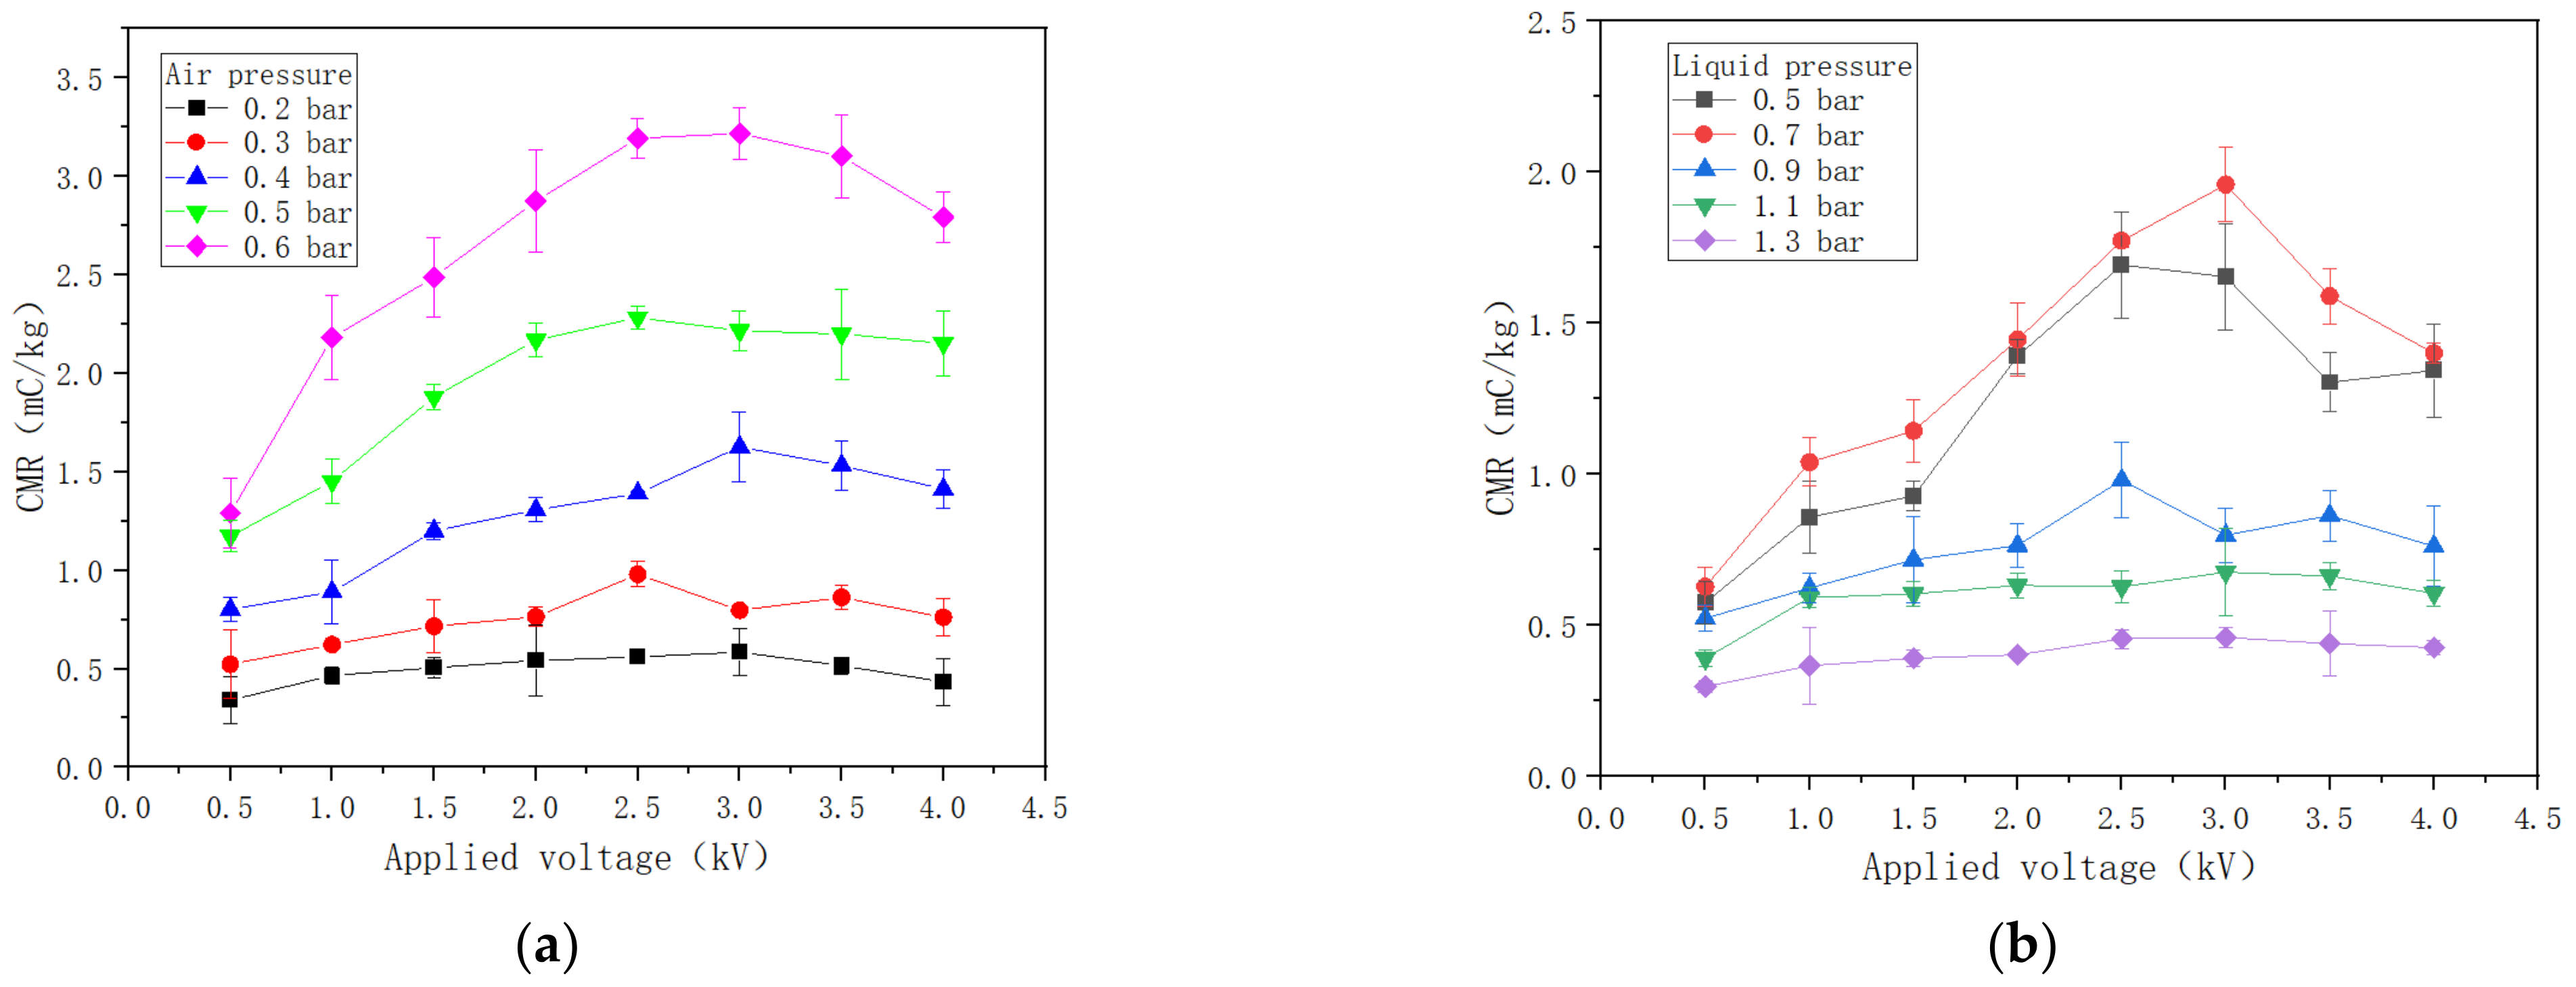
3.3. CMR Variation with the Applied Voltage

In order to clarify the relationship between the CMR and the applied voltage, the data of 0.9 bar liquid pressure with a different air pressure and 0.3 bar air pressure with a different liquid pressure were chosen for analysis in Figure 9. With the increase in the applied voltage, the CMR shows a trend of increasing first and then decreasing. The extreme values of the CMR occur between applied voltages of 2.5 kV and 3 kV. When the applied voltage is less than the extreme values of the applied voltage of the CMR, the mode of charging is induction charge. When the applied voltage exceeds the extreme values of the applied voltage of the CMR, the charge mode starts to change from the induction charge to the corona charge mode, since the electric field is unstable. The instability of the electric field reduces the charging effect and makes the CMR lower [13,16].
In Figure 9a, when the air pressure is lower, the changes in the CMR are gentler. As the air pressure rises, the changes in the CMR become more obvious. The CMR increases with the increase in air pressure in the same application techniques of the applied voltage. However, in Figure 9b, when the liquid pressure is higher, the changes in the CMR are gentler and become more obvious as the liquid pressure drops. In the same application techniques of the applied voltage, the CMR goes up when the liquid pressure changes from 0.5 bar to 0.7 bar. On the other hand, as the liquid pressure increases from 0.7 bar to 1.3 bar, the CMR shows a downward trend.
When the liquid pressure is below 0.7 bar, the solution relaxation time is longer than or equal to the solution atomization time and droplets can be fully charged. When the liquid pressure exceeds 0.7 bar, the solution atomization time has overtaken the solution relaxation time. The solution has broken up into droplets and droplets have left the electrostatic field before they are fully charged [24].
According to the above, the extreme values of the CMR occur between the applied voltages of 2.5 kV and 3 kV. The CMR significantly affects the number of droplets deposited on the back of the blade [36], so that a larger CMR is an ideal choice and applied voltages between 2.5 kV and 3 kV could be chosen. High air pressure gives a high charge-to-mass ratio, but the low air pressure is in line with energy saving and emission reduction. Considering both together, an air pressure between 0.4 and 0.6 bar is chosen for the spraying operation. To make droplets fully charged, a liquid pressure below 0.9 bar should be chosen. At the same time, this is consistent with the conclusion that a liquid pressure of less than 0.9 bar can be chosen to obtain a smaller VMD.

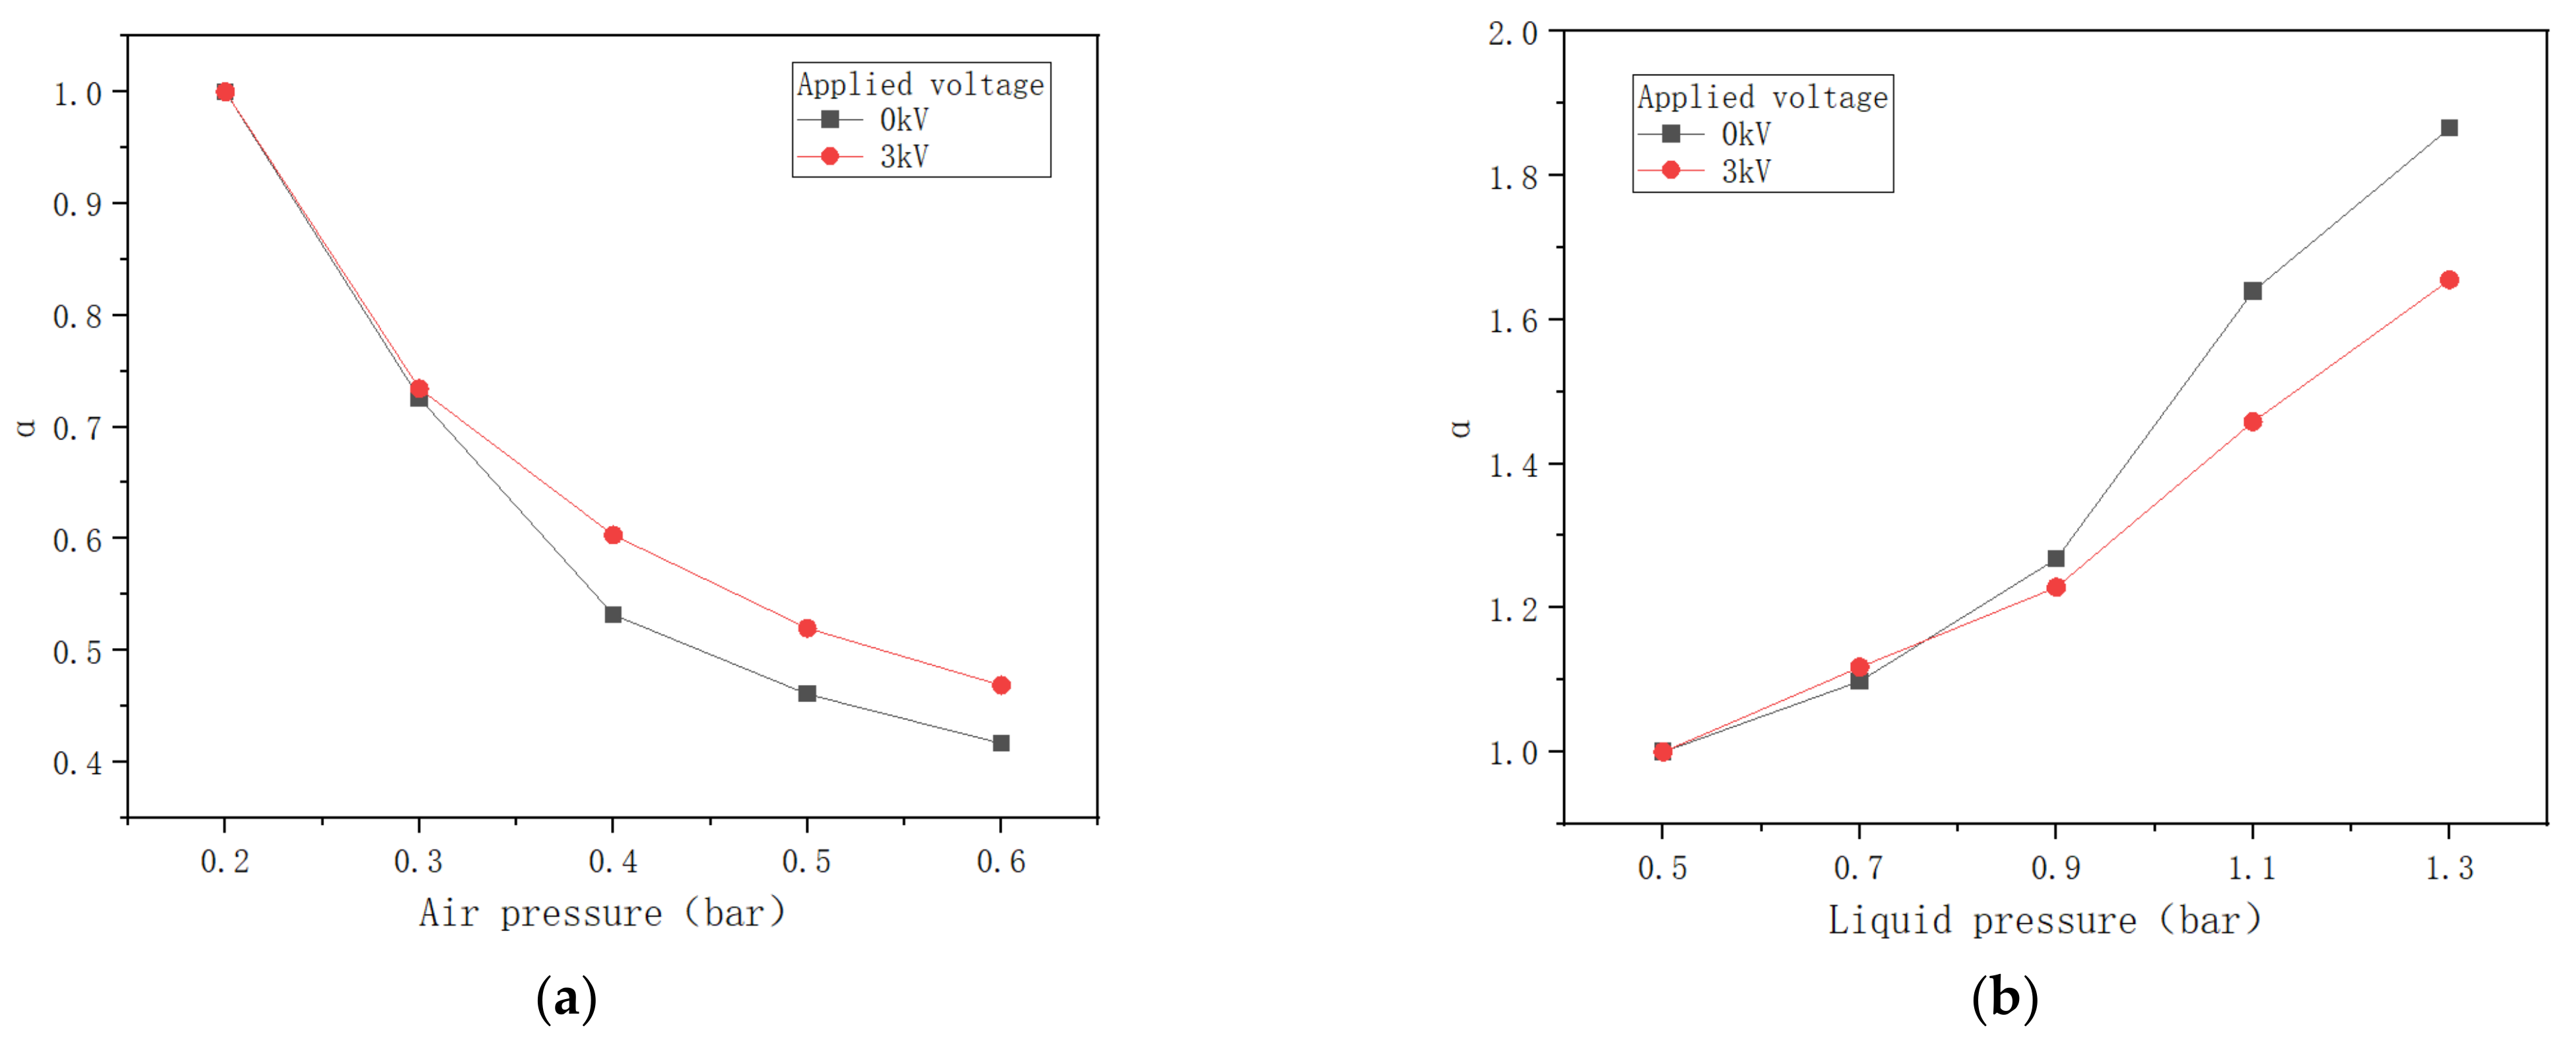
3.4. Relationship between the VMD and CMR

The CMR is an important indicator of the charge of droplets in electrostatic sprays. Refer to Equation (6), wherein the CMR represents the number of droplets charged per unit mass of liquid. Assuming that the VMD is a unit mass of liquid, the CMR is the ratio of individual droplets charged to its mass. The droplet charge is the most fundamental physical quantity of the droplet charge, and Lord Rayleigh conducted a pioneering study on the limit of droplet charges as early as 1882 [17,37]. The droplet limit charge Q 0 is calculated as follows:
Q 0 = 8 π ϵ 1 2 σ 1 2 R 3 2
where ϵ is the air dielectric constant.
When the droplet charge reaches the Rayleigh limit Q 0 , the CMR is defined as the CMR limit CMR0. The CMR limit formula is shown below [38].
CMR 0 = Q 0 m 0 = 8 π ϵ 1 2 σ 1 2 R 3 2 ρ   · 4 3 π R 3 = 12 2 ϵ σ ρ · D 3 2
Based on the relationship between CMR0 and droplet size, it is assumed that CMR is related to VMD as shown in Equation (8).
CMR = A × VMD 3 2
where A is defined as the droplet charge coefficient.
According to the relationship between the air pressure and VMD, the larger the air pressure, the smaller the VMD. At the same time, the CMR increases with the increase in the air pressure in the same application techniques of the applied voltage. Thus, we can assume that there is a negative correlation between the VMD and CMR. To verify this hypothesis, the laws of the VMD and CMR versus the liquid pressure and applied voltage are compared. When the liquid pressure is higher than 0.7 bar and droplets are not fully charged, the CMR shows a tendency to decrease with an increasing liquid pressure, whereas the VMD tends to increase. Before the electric field becomes unstable, the CMR becomes larger as the applied voltage increases, but the VMD shows a decreasing trend. The pattern of the CMR and VMD with the liquid pressure and applied voltage proves the hypothesis that there is a negative correlation between the CMR and VMD.
Different applied voltages produce different intensities of charged electric fields, and the same VMD droplet has different charging capacities in electric fields of different intensities. Therefore, to study the relationship between the VMD and CMR, it is necessary to consider the applied voltage of the charge, while the air pressure and liquid pressure are not considered. Scatter plots are drawn with the VMD as the independent variable and the CMR as the dependent variable at different applied voltages in Figure 10.
In Figure 10, the scatter plot distribution trend of the VMD and CMR corresponds to the Rayleigh charge limit [39]. These fitted curves are drafted according to Equation (8). In the four equations, all R2 are above 0.80. These droplet charge coefficients of equations are 394.30, 596.60, 683.06 and 593.74 when applied voltages are 1, 2, 3 and 4 kV, respectively. The trend of the droplet charge coefficient shows a rising trend followed by a decreasing trend, which is similar to the trend of the CMR with the applied voltage. When the applied voltage is 4 kV, the charge mode starts to change from the induction charge to corona charge mode and corona discharge from the liquid jets of water deposited on the induction electrode could be observed [16]. However, the droplet charging effect in complicated electric fields is not clear and further investigation should be carried out. When the VMD is below 40 μm, the CMR decreases by a large margin. When the VMD is higher than 40 μm, the changes to the CMR are moderate. These formulas can be used to predict the CMR of droplets of different VMDs with charges at different applied voltages, including 1, 2, 3 and 4 kV.

4. Conclusions

In this paper, the air-assisted electrostatic nozzle structure was optimized, and its performance was evaluated. The increase in air pressure promotes atomization and makes the VMD smaller, while the increase in liquid pressure inhibits atomization and makes the VMD larger. An effect of the increase in the applied voltage is, to a certain degree, the promotion of atomization. However, when the VMD is less than or equal to 45 μm, the atomization effect because of applied voltage is not obvious or may even not be present. The CMR increases with the increase in air pressure. The CMR shows a tendency to increase and then decrease with increasing liquid pressure, and a liquid pressure of 0.7 bar is the threshold value. Similarly, the CMR tends to increase and then decrease with the applied voltage, and the extreme value of the CMR appears when the applied voltage is between 2.5 kV and 3 kV.
Comparing the variation in the CMR and VMD with the liquid pressure, air pressure and applied voltage, and the drafted the fitted curves between CMR and VMD at each applied voltage, the model of VMD and CMR corresponds to the Rayleigh charge limit. When the VMD is below 40 μm, the CMR decreases by a large margin. When the VMD is higher than 40 μm, the CMR’s changes are moderate.
In addition, a higher CMR can ensure the use of the electrostatic nozzle for high-range spraying applications, such as orchards. Therefore, applied voltages between 2.5 kV and 3 kV, air pressures between 0.4 and 0.6 bar and liquid pressures of less than 0.9 bar could be chosen for a higher CMR during the spray operation. Because a higher CMR promotes the adhesion of droplets on the leaves, the optimized air-assisted electrostatic nozzles can reduce the use of pesticides and thus protect people and the ecosystem from pesticide pollution.

Author Contributions

Conceptualization, S.D., M.O. and W.J.; data curation S.D., J.Z. and H.Z.; methodology, S.D., J.Z., H.Z., X.D., M.W., H.C., Y.C. and S.Y.; writing—original draft, S.D.; writing—review and editing, J.Z., M.O. and X.D.; validation, W.J.; funding acquisition, M.O. and W.J. All authors have read and agreed to the published version of the manuscript.

Funding

This work was funded by the Project of Faculty of Agricultural Equipment of Jiangsu University (grant number NZXB20200204), the Ningxia Hui Autonomous Region science and technology key R&D project (Grant No. 2018BBF02020), the Jiangsu Agriculture Science and Technology Innovation Fund (JASTIF) (CX(20)3065).

Institutional Review Board Statement

Not applicable.

Informed Consent Statement

Not applicable.

Data Availability Statement

The data are available within the article.

Acknowledgments

The author thanks Faculty of Agricultural Equipment of Jiangsu University and High-Tech Key Laboratory of Agricultural Equipment and Intelligence of Jiangsu Province for the facilities and supports.

Conflicts of Interest

The authors declare no conflict of interest.

References

  1. Chambers, J.E.; Greim, H.; Kendall, R.J.; Segner, H.; Sharpe, R.M.; Van Der Kraak, G. Human and ecological risk assessment of a crop protection chemical: A case study with the azole fungicide epoxiconazole. Crit. Rev. Toxicol. 2014, 44, 176–210. [Google Scholar] [CrossRef] [PubMed]
  2. Gong, C.; Kang, C.; Jia, W.; Yang, W.; Wang, Y. The effect of spray structure of oil-based emulsion spray on the droplet characteristics. Biosyst. Eng. 2020, 198, 78–90. [Google Scholar] [CrossRef]
  3. Huang, Y. Characterization of spray deposition and drift from a low drift nozzle for aerial application at different application altitudes. Electron. Lett. 2011, 38, 967–968. [Google Scholar]
  4. Sinha, R.; Ranjan, R.; Khot, L.R.; Hoheisel, G.A.; Grieshop, M.J. Comparison of within canopy deposition for a solid set canopy delivery system (SSCDS) and an axial-fan airblast sprayer in a vineyard. Crop Prot. 2020, 132, 105124. [Google Scholar] [CrossRef]
  5. Maski, D.; Durairaj, D. Effects of charging voltage, application speed, target height, and orientation upon charged spray deposition on leaf abaxial and adaxial surfaces. Crop Prot. 2010, 29, 134–141. [Google Scholar] [CrossRef]
  6. Patel, M.K.; Sahoo, H.K.; Nayak, M.K.; Kumar, A.; Ghanshyam, C.; Kumar, A. Electrostatic Nozzle: New Trends in Agricultural Pesticides Spraying. In Proceedings of the National Conference on Emerging Fields in Engineering and Sciences (EFES-2015), Kobe, Japan, 18–20 November 2015. [Google Scholar]
  7. Patel, M.K.; Sharma, T.; Nayak, M.K.; Ghanshyam, C. Computational modeling and experimental evaluation of the effects of electrode geometry and deposition target on electrostatic spraying processes. Int. J. Comput. Appl. 2015, 124, 10e15. [Google Scholar]
  8. Almekinders, H.; Ozkan, H.E.; Reichard, D.L.; Carpenter, T.G.; Brazee, R.D. Spray Deposit Patterns of an Electrostatic Atomizer. Trans. Asae 1992, 35, 1361–1367. [Google Scholar] [CrossRef]
  9. Palumbo, J.C.; Coates, W.E. Air-assisted electrostatic application of pyrethroid and endosulfan mixtures for sweetpotato whitefly (Homoptera: Aleyrodidae) control and spray deposition in cauliflower. J. Econ. Entomol. 1996, 89, 970–980. [Google Scholar] [CrossRef]
  10. Patel, M.K.; Ghanshyam, C.; Kapur, P. Characterization of electrode material for electrostatic spray charging: Theoretical and engineering practices. J. Electrost. 2013, 71, 55–60. [Google Scholar] [CrossRef]
  11. Patel, M.K.; Kundu, M.; Sahoo, H.K.; Nayak, M.K. Enhanced performance of an air-assisted electrostatic nozzle: Role of electrode material and its dimensional considerations in spray charging. Eng. Agric. Environ. Food 2016, 9, 332–338. [Google Scholar] [CrossRef]
  12. Appah, S.; Zhou, H.; Wang, P.; Ou, M.; Jia, W. Charged monosized droplet behaviour and wetting ability on hydrophobic leaf surfaces depending on surfactant-pesticide concentrate formulation. J. Electrost. 2019, 100, 103356. [Google Scholar] [CrossRef]
  13. Laryea, G.N.; No, S.Y. Development of electrostatic pressure-swirl nozzle for agricultural applications. J. Electrost. 2003, 57, 129–142. [Google Scholar] [CrossRef]
  14. Gan-Mor, S.; Ronen, B.; Ohaliav, K. The effect of air velocity and proximity on the charging of sprays from conventional hydraulic nozzles. Biosyst. Eng. 2014, 121, 200–208. [Google Scholar] [CrossRef]
  15. Zhao, S.; Castle, G.; Adamiak, K. Factors affecting deposition in electrostatic pesticide spraying. J. Electrost. 2008, 66, 594–601. [Google Scholar] [CrossRef]
  16. Krupa, A.; Jaworek, A.; Sobczyk, A.T.; Marchewicz, A.; Szudyga, M.; Antes, T. Charged spray generation for gas cleaning applications. J. Electrost. 2013, 71, 260–264. [Google Scholar] [CrossRef]
  17. Rayleigh, L. On the Equilibrium of Liquid Conducting Masses Charged with Electricity. Phil. Mag. J. Sci. 1882, 14, 87. [Google Scholar] [CrossRef] [Green Version]
  18. Xu, H.; Wang, J.; Wang, Z.; Yu, K.; Xu, H.; Wang, D.; Zhang, W. Impact dynamics of a charged droplet onto different substrates. Phys. Fluids 2021, 33, 102111. [Google Scholar] [CrossRef]
  19. Liu, L.; Fu, Q.; Yang, L. Theoretical Atomization Model of Liquid Sheet Generated by Coaxial Swirl Injectors. Int. J. Multiph. Flow 2021, 142, 103725. [Google Scholar] [CrossRef]
  20. Patel, M.K.; Praveen, B.; Sahoo, H.K.; Patel, B.; Kumar, A.; Singh, M.; Nayak, M.K.; Rajan, P. An advance air-induced air-assisted electrostatic nozzle with enhanced performance. Comput. Electron. Agric. 2017, 127, 280–288. [Google Scholar] [CrossRef]
  21. Kacprzyk, R.; Lewandowski, M. Post-dispersion electrification of droplets. J. Electrost. 2016, 79, 33–37. [Google Scholar] [CrossRef]
  22. Biris, A.S.; Saini, D.; Srirama, P.K.; Mazumder, M.K.; Sims, R.A.; Calle, C.I.; Buhler, C.R. Electrodynamic removal of contaminant particles and its applications. In Proceedings of the Industry Applications Conference, Seattle, WA, USA, 3–7 October 2004. [Google Scholar]
  23. Chen, H.; Zhao, Y. Electrostatic Induction Field and Charging Property of Droplet in Electrostatic Spraying Process. High Volt. Eng. 2010, 36, 2519–2524. [Google Scholar]
  24. Lan, Y.B.; Zhang, H.Y.; Wen, S.; Li, S.H. Analysis and Experiment on Atomization Characteristics and Spray Deposition of Electrostatic Nozzle. Trans. Chin. Soc. Agric. Mach. 2018, 49, 130–139. [Google Scholar]
  25. Beck-Broichsitter, M. Polymer-coated aperture plates for tailored atomization processes. Mater. Sci. Eng. C 2020, 110, 110666. [Google Scholar] [CrossRef] [PubMed]
  26. Pontinen, P.J.; Airaksinen, O. Comparative effects of exposure to different light sources (He-Ne laser, InGaAl diode laser, a specific type of noncoherent LED) on skin blood flow for the head. Acupunct. Electro-Ther. Res. 1996, 21, 105–118. [Google Scholar]
  27. Kumar, S.S.; He, Z.; Hogan, C.J.; Fredericks, S.A.; Hong, J. Evaluation of laser diffraction-based particle size measurements using digital inline holography. Meas. Sci. Technol. 2020, 31, 125201. [Google Scholar] [CrossRef]
  28. Patel, M.K.; Khanchi, A.; Chauhan, A.; Kumar, A.; Akkireddi, S.R.; Jangra, A.; Kanawade, R.; Manivannan, N.; Mitchell, G.R. Real-time measurement of droplet size and its distribution of an air-induced air-assisted electrostatic nozzle. J. Electrost. 2022, 115, 103665. [Google Scholar] [CrossRef]
  29. Law, S.E.; Bailey, A.G. Perturbations of Charged-Droplet Trajectories Caused by Induced Target Corona: LDA Analysis. Industry Applications. IEEE Trans. Ind. Appl. 1984, IA-20, 1613–1622. [Google Scholar] [CrossRef]
  30. Wang, S.; He, X.; Song, J.; Zhong, C.; Wang, Z.; Qi, P.; Ling, Y. Charging and spraying performance test of bipolar contact electrostatic spraying system for unmanned aerial vehicle. Trans. Chin. Soc. Agric. Eng. 2018, 34, 82–89. [Google Scholar]
  31. Appah, S.; Wang, P.; Ou, M.; Gong, C.; Jia, W. Review of electrostatic system parameters, charged droplets characteristics and substrate impact behavior from pesticides spraying. Int. J. Agric. Biol. Eng. 2019, 12, 9. [Google Scholar] [CrossRef]
  32. Appah, S.; Jia, W.; Ou, M.; Wang, P.; Gong, C. Investigation of Optimum Applied Voltage, Liquid Flow Pressure, and Spraying Height for Pesticide Application by Induction Charging. Appl. Eng. Agric. 2019, 35, 795–804. [Google Scholar] [CrossRef]
  33. Nukiyama, S.; Tanasawa, Y. Experiments on the Atomization of Liquids in an Air Stream; Report 3: On the Droplet-Size Distribution in An Atomized Jet. 1950. Available online: https://www.researchgate.net/publication/284091443_Experiments_on_the_atomization_of_liquids_in_an_airstream (accessed on 6 May 2022).
  34. Cao, J. Liquid Sprays; China Machine Press: Beijing, China, 2005. [Google Scholar]
  35. Ma, X.; Guo, L.; Wen, Z. Atomization characteristics of multi-nozzle electrostatic spray and field experiment. Trans. Chin. Soc. Agric. Eng. 2020, 36, 73–82. [Google Scholar]
  36. Jia, W.; Zhu, H. Dynamics of water droplet impact and spread on soybean leaves. Trans. Asabe 2015, 58, 1009–1016. [Google Scholar]
  37. Grimm, R.L.; Beauchamp, J.L. Evaporation and Discharge Dynamics of Highly Charged Multicomponent Droplets Generated by Electrospray Ionization. J. Phys. Chem. A 2009, 114, 1411–1419. [Google Scholar] [CrossRef] [PubMed]
  38. Wang, J.F.; Huang, J.W.; Wang, Z.T.; Wang, X.Y.; Hang, Q.M. Analysis of charged state of droplet during evaporation process. High Volt. Eng. 2010, 36, 2531–2536. [Google Scholar]
  39. Pascuzzi, S.; Cerruto, E. Spray deposition in “tendone” vineyards when using a pneumatic electrostatic sprayer. Crop Prot. 2015, 68, 1–11. [Google Scholar] [CrossRef]
Figure 1. Schematic diagram of the air-induced, air-assisted electrostatic nozzle. v l and v a are the liquid velocity and air velocity, ð is the angle between the airflow and liquid when they meet in the nozzle tip, D indicates the distance between the liquid channel outlet and the annular ring electrode, A–A depicts the nozzle tip’s cross-section.
Agriculture 12 00889 g001
Figure 2. The distribution map of the electric field intensity.
Agriculture 12 00889 g002
Figure 3. (a) Experimental set-up to measure the droplet size, (b) Schematic sketch of measuring position in the spray jet.
Agriculture 12 00889 g003
Figure 4. Experimental set-up to measure the charge-to-mass ratio.
Agriculture 12 00889 g004
Figure 5. (a) VMD variation with air pressure when the applied voltage is 0 kV, (b) VMD variation with liquid pressure when the applied voltage is 3 kV, (c) ΔVMD variation with air pressure change when the applied voltage is 3 kV, (d) ΔVMD variation with liquid pressure change when the applied voltage is 0 kV.
Agriculture 12 00889 g005aAgriculture 12 00889 g005b
Figure 6. Trend of the VMD’s change ratio with pressure. (a) Liquid pressure of 0.9 bar, (b) Air pressure of 0.3 bar.
Agriculture 12 00889 g006
Figure 7. VMD variation with the applied voltage. (a) Air pressure of 0.3 bar, (b) Liquid pressure of 0.9 bar.
Agriculture 12 00889 g007
Figure 8. The relationship between the VMD when the applied voltage is 0 kV and the ΔVMD when the applied voltage changes from 0 to 4 kV.
Agriculture 12 00889 g008
Figure 9. CMR variation with the applied voltage. (a) Liquid pressure of 0.9 bar, (b) Air pressure of 0.3 bar.
Agriculture 12 00889 g009
Figure 10. CMR variation with the VMD. (a) Applied Voltage of 1 kV, (b) Applied Voltage of 2 kV, (c) Applied Voltage of 3 kV, (d) Applied Voltage of 4 kV.
Agriculture 12 00889 g010
Table 1. The levels of the three parameters.
No.Air Pressure (bar)Liquid Pressure (bar)Applied Voltage 1 1 (kV)Applied Voltage 2 2 (kV)
10.20.500.5
20.30.71.01.0
30.40.92.01.5
40.51.13.02.0
50.61.34.02.5
6 3.0
7 3.5
8 4.0
1 Applied voltage 1 is the levels of the size test. 2 Applied voltage 2 is the levels of the charge-to-mass ratio test.
Publisher’s Note: MDPI stays neutral with regard to jurisdictional claims in published maps and institutional affiliations.

