Article

Assessing the Effect of Physicochemical Properties of Saline and Sodic Soil on Soil Microbial Communities

College of Resources and Environment, University of Chinese Academy of Sciences, Beijing 100049, China
*
Author to whom correspondence should be addressed.
These authors contributed equally to this work.
Agriculture 2022, 12(6), 782; https://doi.org/10.3390/agriculture12060782
Submission received: 27 March 2022 / Revised: 23 May 2022 / Accepted: 27 May 2022 / Published: 29 May 2022

Abstract

:
Soil physicochemical properties are the main driving factors affecting the stability and diversity of the soil microbial community. The impacts of the saline–alkali situation and associated soil degradation need to be understood and reversed as soil diversity and communities are increasingly affected by saline–alkaline soil. However, the differences between salinization and alkalization soil and their impact on microbiota have been overlooked. The object of this study is to demonstrate the differences in salinization and alkalization soil and the driving factors affecting microbiota. In this study, 12 soil samples collected from saline–alkaline spots were used to detect the differences in soil physicochemical properties. The soil microbial community was sequenced by high-throughput sequencing. The results of ESP and EC in the soil samples indicated that the soil samples were categorized as saline soil and sodic soil. Venn diagrams indicated that unique OTUs in saline soil showed higher adaptation and environmental tolerance. Partial Mantel tests showed that the differences in pH, exchangeable sodium percentage (ESP), C/N, Na, and K between saline and sodic soil were the primary determinants affecting the relative abundance of bacterial and fungal communities, besides electrical conductivity (EC). In the KEGG analysis, ESP mainly affected the cellular processes in the archaea. Metabolism in the bacterial function was positively correlated with K only in sodic soil. These results indicated that the proportions in sodic soil were more strongly affecting soil microbiota.

1. Introduction

The saline–alkali situation has been perceived as one of the most significant factors causing soil degradation throughout the world [1]. Saline–alkaline soil reduces soil microbial diversity, activity, and soil quality [2]. Saline-alkaline soil is distributed in more than 100 countries and affects various soil ecosystems, such as agriculture, grassland, and wet meadows [1,3,4]. The area in Inner Mongolia accounts for 12.3% of the area of China, while saline–alkaline soil covers nearly a quarter of the saline–alkaline soil of China [5]. High evaporation associated with a short rainy period in arid and semi-arid areas further aggravates the shaping of saline–alkaline soil [6]. Inner Mongolia is the dominant grazed area in the north of China, where saline–alkaline soil on the pastures has been rapidly shaped and adversely affected the grass growth [7]. According to the soil classification, saline–alkaline soil is the general term for salinization and alkalization soil (based on the physicochemical properties of soil, such as electrical conductivity, EC, dS/m, and exchangeable sodium percentage, ESP, %, saline–alkaline soil can be classified as saline soil, EC < 4 dS/m, ESP < 15%, and sodic soil, EC < 4 dS/m, ESP > 15%) [8,9]. The soil is home to large and diverse microbes [10]. Soil microbiota has a key role in regulating and supporting soil ecosystems, including restoring degradation and nutrient cycling [11,12]. They are not only a participant in soil activity but also a responder to changes in soil characteristics [13]. The soil microbiota is sensitive to soil environmental factors, affecting their diversity and composition [14]. Microbial communities mainly consist of archaea, bacteria, and fungi [15].
High salinity in the soil is considered a harsh habitat for microorganisms, including salt lakes, the sediment of salt lakes, and desert soil, but many microbial communities still survive [16,17]. Many studies pay attention to the effect of saline soil on soil and ecological environments. In a global survey of microbial communities from both terrestrial and aquatic ecosystems, it was found that salinity was the dominant factor in shaping bacterial community composition [18]. A study by Zhang et al. (2019) [19] found that bacterial alpha diversity in desert soil was strongly negatively correlated with saline gradients, using EC as an indicator of soil salinity. Banda et al. (2021) [20] demonstrated that the relative abundance of Euryarchaeota (archaeal phylum) in saline lakes increased with rising salinity. The abundant change of Nectriaceae and Cladosporiaceae can be used as a marker to distinguish the extent of low and high saline soil in the Yellow River Delta [21]. Therefore, the change in microbial diversity and composition in the soil can reflect the extent of the salinity of the soil [22].
Apart from the effect of salinity, microorganisms also face different abiotic factors in habitats, including pH, moisture, and other physicochemical properties. In aquatic ecosystems, oxygen, carbon substrates, and pH are also the key factors shaping the microbial community of the sediment in the salt lakes. Zhao et al. (2018) [23] demonstrated that pH was equally a determinant of bacterial communities in soil across a salt lake shoreline. It was demonstrated that the pH in the soil could increase due to saline ion exchange [24]. Therefore, saline and sodic soil are closely related and occur concurrently [1]. A change in saline and sodic soil was associated with high Na, pH, and ESP [25]. Moreover, as an important indicator, a change in EC can severely affect the soil microbiota [26]. However, the differences between saline and sodic soil and the relative importance of saline and sodic soil in shaping the microbial community of soil are still poorly understood, although the properties and classification of soil have been widely studied. Considering the relationship between microbial communities and various soil factors, it is important to identify which differences in factors in saline and sodic soil have a greater influence on the composition and distribution of soil microbial communities.
The feces of livestock can also result in soil with different levels of salinization and alkalization, and further lead to different sizes of spots on the grassland [27]. In this study, we analyzed the effect of physicochemical differences between saline and sodic soil on soil microbiota using high-throughput sequencing in the Maodeng pasture in Xilingol, in Inner Mongolia, China. In this study, we aimed to evaluate (1) the differences in physicochemical properties in saline and sodic soil; (2) the effect of the physicochemical property differences between saline and sodic soil on soil microbiota; (3) the potential function of changes in saline and sodic soil. The purpose of this study was to understand the differences between salinization and alkalinization and provide a direction for improving soil quality.

2. Materials and Methods

2.1. Sampling Sites and Collection

The climate of Inner Mongolia is that of an arid and semi-arid monsoon [28]. As part of the great Euro-Asian grassland, the main management of the Inner Mongolia steppe is agricultural and animal husbandry [29]. Climate change and overgrazing aggravate drought and plant degradation [30]. The experiment was carried out at the field station located in the Maodeng pasture (Research Station of Animal Ecology, Institute of Zoology, CAS, 44°11′ N, 116°27′ E), located in the Xilingol League of Inner Mongolia. The mean annual temperature of the Xilingol League is 2.76 ℃, and the mean annual precipitation is 253.86 mm [31].
All the saline–alkaline spots’ soil samples were collected randomly at 12 sites using uniform sampling. Each site used a 1 m × 1 m quadrilateral frame (five subsamples per site) and each subsample was driven into the soil at 20 cm with a drill. Stones and residue were removed from five subsamples before they were mixed as a site soil sample. Each fresh soil sample was divided into two parts, one of which was sifted using a 2 mm mesh screen and air-dried for physicochemical property measurement. The other part was sifted using a 0.15 mm mesh screen and stored at −80 °C for DNA extraction.

2.2. Analysis of Soil Physicochemical Properties

Electrical conductivity (EC) was used as the indicator of soil salinity in this study. The basic soil physicochemical properties (including pH, EC, C/N ratio, exchangeable sodium, and cation exchange capacity (CEC)) and soil ions (including K, Ca, Na, Mg, Fe, Al, Sr, and Si) were measured and analyzed. Briefly, elements in soil and exchangeable sodium were analyzed using ICP-OES (Prodigy, Leeman, WI, USA). CEC was analyzed using the ammonium acetate method [32]. Exchangeable sodium percentage (ESP, %) was calculated by the date of exchangeable sodium and CEC (Table S1) [33]. pH and EC were measured using water extracts (pH, 1:5 w/v; EC, 1:2.5 w/v) after suspension for 30 min (ORION-STAR A215, Thermo Fisher Scientific, Waltham, MA, USA). The C/N ratio was analyzed using Elemental Analyzer (Vario Macro Cube, Elemental, Germany).

2.3. DNA Extraction

Genomic DNA from the soil sample was extracted using a MoBio PowerSoil kit (MoBio Laboratories, Carlsbad, CA, USA) according to the manufacturer’s instructions. The DNA concentration was detected using a NanoDrop ND-2000 spectrophotometer (NaonoDrop Technologie, Wilmington, DE, USA). The DNA quality was detected using 1% (w/v) agarose gel electrophoresis. Each final DNA sample was mixed with the same volume from triplicate samples, avoiding bias in sampling and extraction. All the DNA was stored at −20 °C until further PCR amplification.

2.4. PCR Amplification

PCR amplifications targeting the V3–V4 region of archaeal 16S rRNA genes were performed in all samples using primers 524-10-ext (5′-TGYCAGCCGCCGCGGTAA-3′) and arch958RmodR (5′-YCCGGCGTTGAVTCCAATT-3′) [34]. PCR amplifications targeting the V3–V4 region of bacterial 16S rRNA genes were performed for all samples using primers 338F (5′-ACTCCTACGGGAGGCAGCAG-3′) and 806R (5′-GGACTACHVGGGTWTCTAAT-3′) [35]. PCR amplifications targeting the ITS region of fungal genes were performed for all samples using primers ITS3F (5′-CTTGGTCATTTAGAGGAAGTAA-3′) and ITS3R (5′-GCTGCGTTCTTCATCG ATGC-3′) [36].
PCR was performed in a 20 μL mixture volume containing 10× Buffer 2.0 μL (TAKARA, Tokyo, Japan), 2.5× mM dNTPs 2.0 μL (TAKARA, Tokyo, Japan), 10× each primer (5 μM) 0.8 μL, 10× rTaq Polymerase 0.2 μL (TAKARA, Tokyo, Japan), BSA 0.2 μL and DNA template 10 ng, and 14.8 μL ddH2O. PCR was performed with the following program: 95 °C for 3 min, 35 cycles of 95 °C for 30 s, 55 °C for 30 s, and 72 °C for 45 s, followed by 72 °C for 10 min. PCR of each sample was performed in triplicate and the PCR products were mixed to minimize the impact of potential early-round PCR errors [37]. All PCR products were detected using 1% (w/v) agarose gels. Then, PCR products were purified using the AxyPrep DNA Gel Extraction Kit (Axygen Biosciences, Union City, CA, USA), according to the manufacturer’s protocol. The PCR products were quantified using a QuantiFluorTM-ST (Promega, Madison, WI, USA). Purified PCR productions were sent to Shanghai Majorbio Bio-Pharm Biotechnology Co. Ltd. (Shanghai, China) for sequencing.

2.5. Sequencing Analysis

The obtained raw sequence reads from each sample were processed and analyzed using the Quantitative Insights Into Microbial Ecology (QIIME) Pipeline (http://qiime.org/index.html (accessed on 26 March 2022)) [38]. Briefly, low-quality reads with a quality score below 20 and containing an ambiguous base (“N”) were filtered using Trimmomatic [39]. Chimeric reads were checked and discarded using UCHIME [40]. Obtained high-quality paired-end reads were merged into sequences using Fast Length Adjustment of Short reads (FLASH) (Version 1.2.11) [41]. Sequences were clustered into operational taxonomic units (OTUs) based on a 97% identity threshold using USEARCH (Version 7.0) [42]. Bacterial and archaeal sequences from OTUs were selected to compare to SILVA sequence database reference alignment for taxonomic assignment (Version 132). Fungal sequences from OTUs were classified against the UNITE sequence database (Version 8.0).

2.6. Statistical Analyses

After the raw sequences were quality-filtered and merged, alpha diversity indices of observed OTUs, Shannon index, Chao 1 estimator, and the Good’s coverage were estimated by the calculation of Mothur (v 1.30.1) [43]. The normal distribution of the soil physicochemical properties and the alpha diversity of the microbial community were tested by qq plot and Shapiro–Wilk normality test using the “shapiro. test()” function in package “car” by R (Version 3.3.1). A T-test was used to determine the significance of different soil samples. A Venn diagram was used to evaluate the differences and overlap in the microbial communities of soil samples. Redundancy analysis (RDA) was conducted to explore the association between the physicochemical properties and microbial communities of soil using the package “vegan” in R. Linear discriminant analysis (LDA) was used to identify the abundance difference at the genera level using the online LEfSe program [44]. Based on the Bray–Curtis distance matrix, principal coordinates analysis (PCoA) was used to assess the beta diversity of microbial community structures among the different soil samples, and permutational multivariate analysis of variance (PERMANOVA) was used to determine the significant differences in the groups using the “vegan” package in R. Pairwise comparisons of soil physicochemical properties were performed using Spearman’s correlation coefficients. The Mantel test was used to confirm the influence of the physicochemical properties of soil on microbial community structures using the “vegan” package. The Mantel test was also used to calculate the correlation between environmental factors of soil and the relative abundance of microbial communities with the package “linkET”. Rare communities were considered as the microbial communities with relative abundance less than 0.1% (<0.1%). Phylogenetic Investigation of Communities by Reconstruction of Unobserved States (PICRUSt) was conducted to predict the metabolic functions of archaeal and bacterial communities based on the 16S rRNA gene, and FUNGuild was used to annotate fungal metabolic functions [45,46]. Correlations between the soil physicochemical properties and microbial community were analyzed using Pearson’s correlation in packages “psych” and “rewshape2” in R.

3. Results

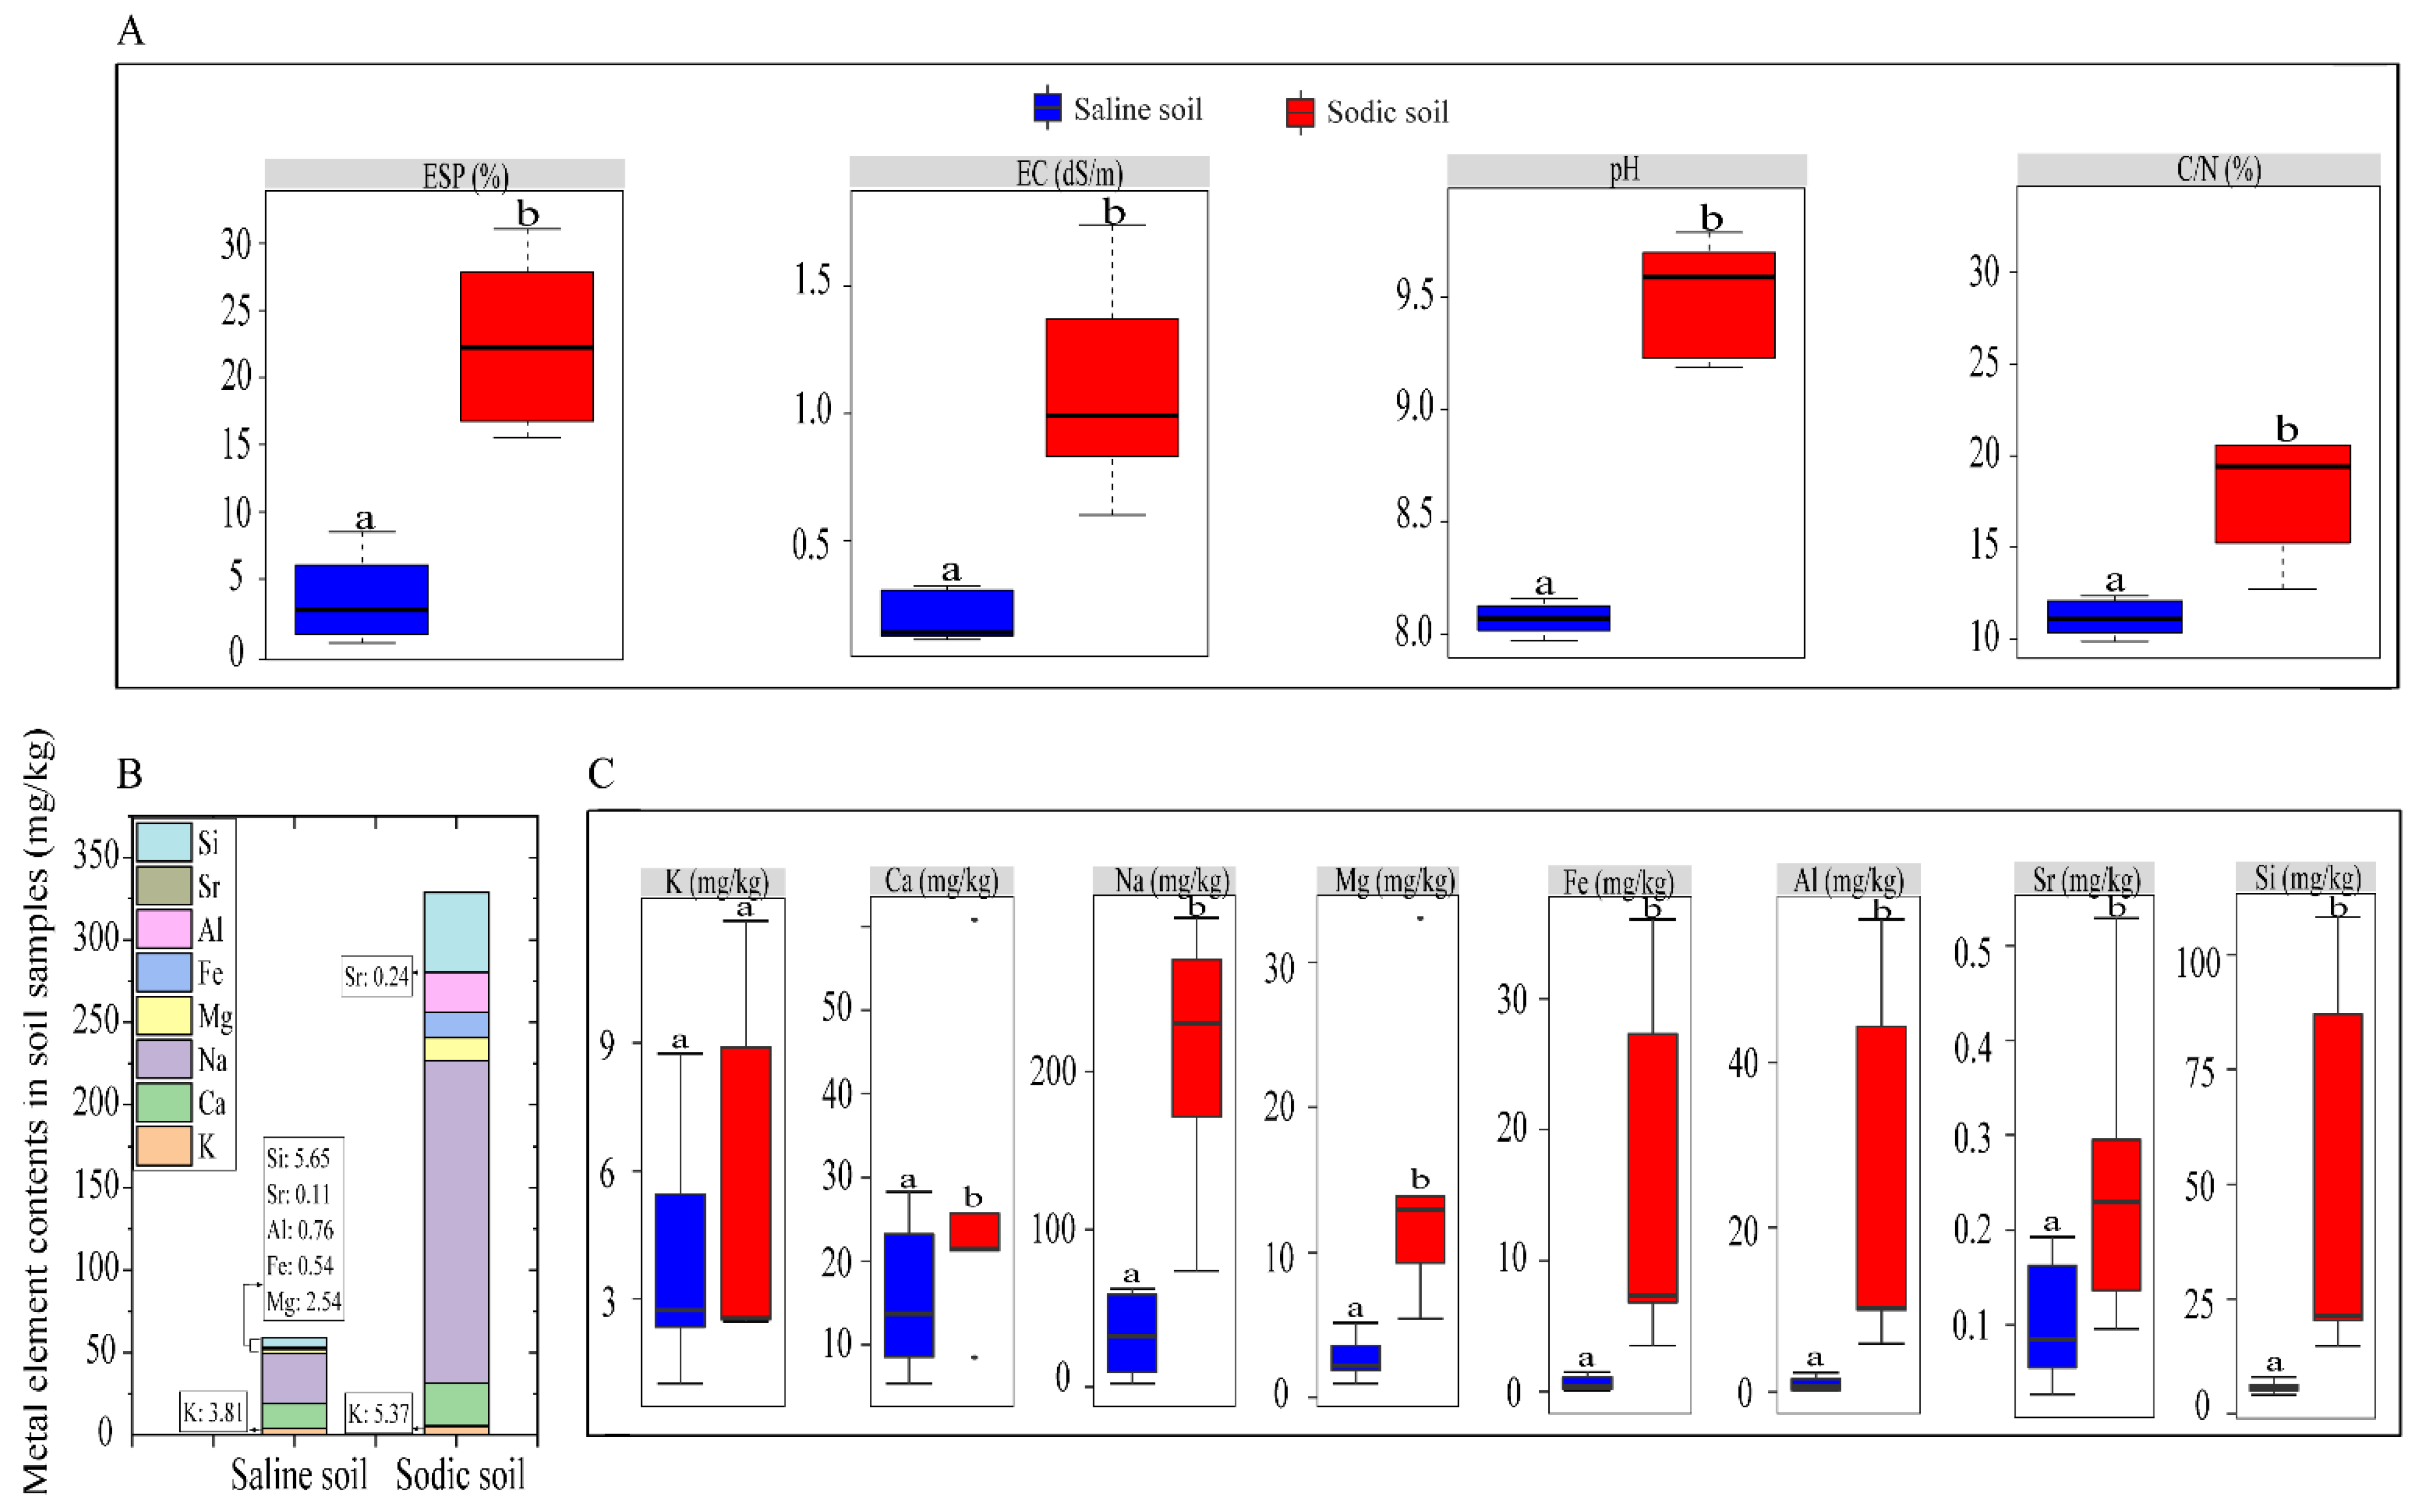
3.1. Differences in Soil Physicochemical Properties

According to the value of ESP and EC, the soil samples were divided into two categories: saline soil (ESP < 15%, EC < 4 dS/m) and sodic soil (ESP > 15%, EC < 4 dS/m) (Figure 1A). The physicochemical properties of the two soil categories were significantly different (Figure 1). The basic physicochemical properties of sodic soil samples, including ESP, EC, pH, and C/N were significantly higher than those in saline soil samples (p < 0.05), especially ESP. The average values of ESP in saline and sodic soil were 3.61% and 23.03% (Figure 1A). K content in saline soil showed no significant difference from sodic soil (Figure 1C). The content of each element in the saline and sodic soil samples showed a significant change (Figure 1B). Na content was significantly higher in sodic soil samples (average content, 195.23 mg/kg) (Figure 1B). The Ca, Mg, Fe, Al, Sr, and Si content in saline soil were lower than in sodic soil samples (Figure 1C).

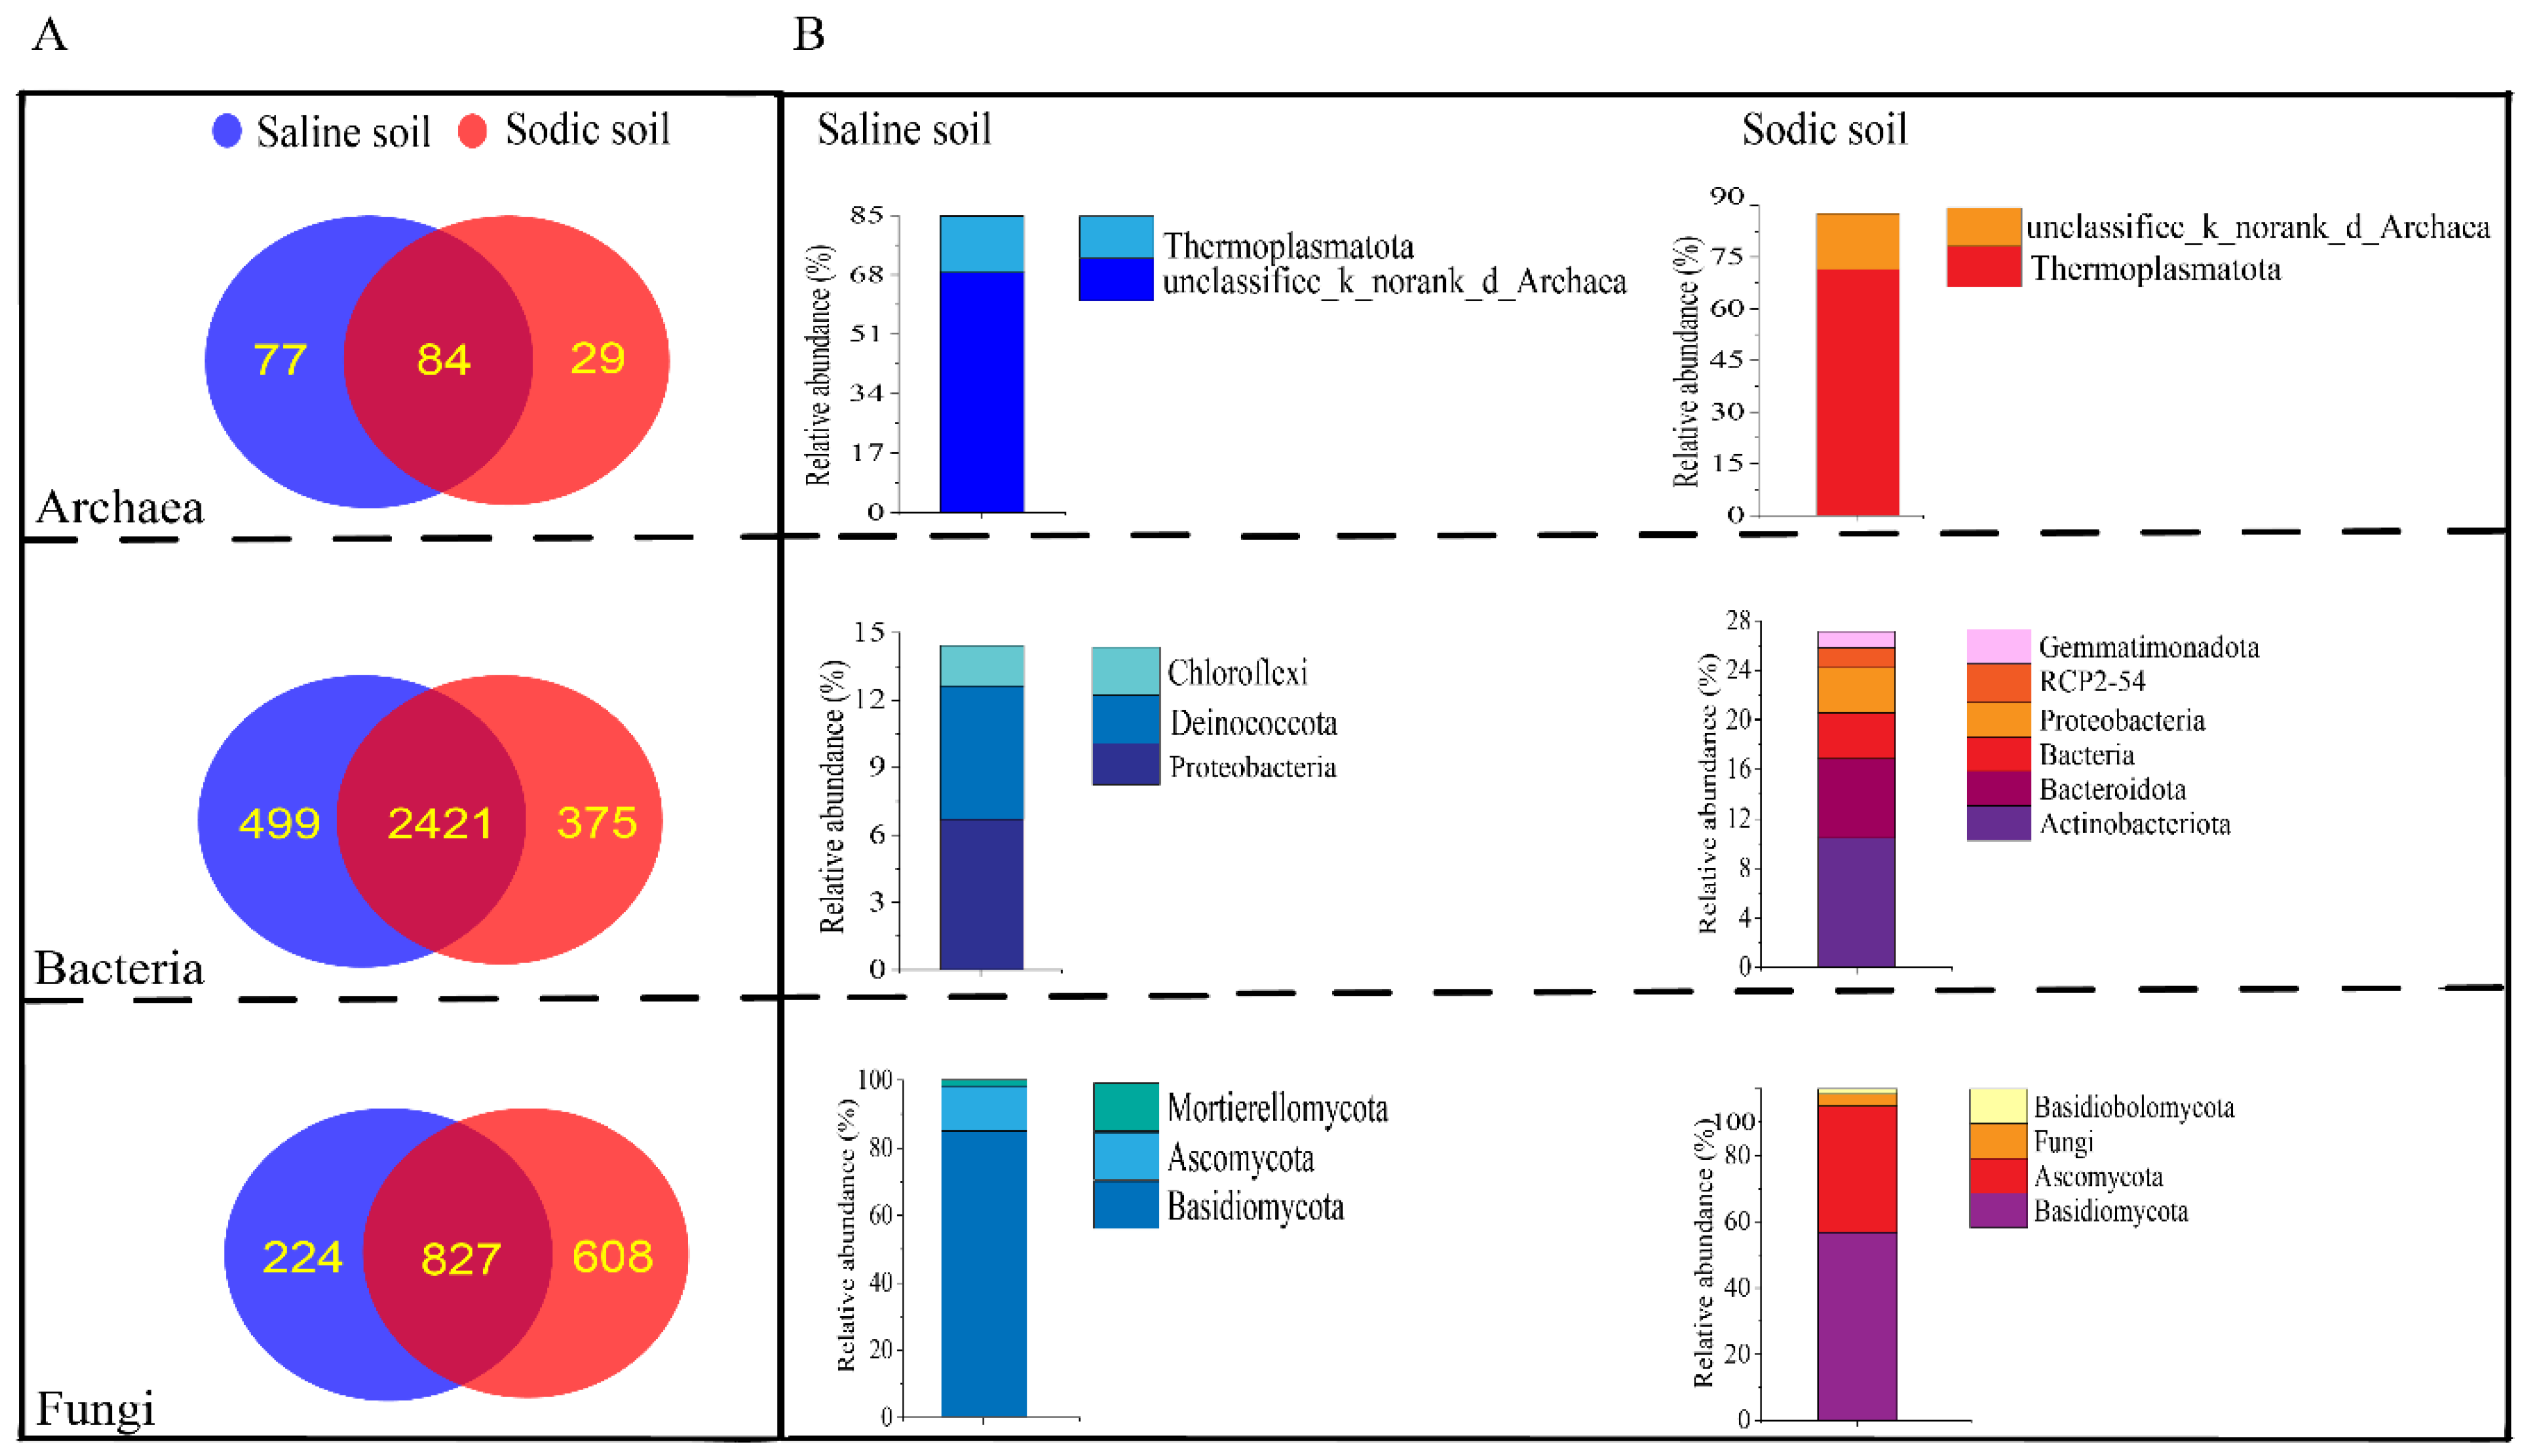
3.2. Sequencing Data and Alpha Diversity of Saline and Sodic Soil

In total, we obtained 571,307 high-quality archaeal 16S rDNA gene sequences, 558,900 bacterial 16S rDNA gene sequences, and 695,347 fungal ITS region sequences (Table S2). After normalization, 29,897 archaeal 16S rDNA gene sequences were clustered into 190 OTUs based on a 97% identity threshold, 22,466 bacterial 16S rDNA gene sequences were clustered into 3295 OTUs, and 37,523 fungal ITS region sequences were clustered into 1659 OTUs. The Good’s coverage ranged from 0.9759 to 0.9999, which indicated that the sequencing depth was sufficient to describe the microbial composition accurately (Table S3). The alpha diversity of the bacterial community was higher than that of archaea and fungi, and all the bacterial diversity indexes in saline soil were higher than in sodic soil (Table 1). The observed OTUs of the archaeal community in sodic soil samples were significantly higher than those in saline soil samples (t-test, p < 0.05). Chao 1 estimator values of the archaeal and fungal communities in sodic soil samples were significantly higher than those in saline soil samples (t-test, p < 0.05), but the Shannon index of the bacterial community in sodic soil samples was significantly lower than that in saline soil samples (t-test, p < 0.05).

3.3. Beta Diversity of Saline and Sodic Soil

Venn diagrams revealed that the bacterial microbial community possessed the highest number of shared and unique OTUs (Figure 2A). The numbers of unique OTUs in the archaeal and bacterial communities of saline soil were higher than in sodic soil, while the numbers of unique OTUs of the fungal community in saline soil were lower than in sodic soil samples. Further analysis revealed that the unique OTUs in the archaeal communities mainly belonged to the phyla Thermmoplasmatota and unclassified_archaea (Figure 2B). Thermmoplasmatota abundance was the highest in sodic soil samples, while the relative abundance of unclassified_archaea was the highest in saline soil. Although the number of unique OTUs in the bacterial communities of sodic soil were lower than in saline soil, they belonged to more phyla (Figure 2A,B). The principal coordinate analysis (PCoA) results of Bray–Curtis distance with PERMANOVA tests also showed significant differences in the archaeal, bacterial, and fungal communities of saline and sodic soil (Figure S1).
Based on the Venn diagrams and PCoA analysis, the results indicated significant differences in microbial community structures between saline soil and sodic soil samples (Figure 2 and Figure S1). The Mantel test revealed that the basic physicochemical properties of soil and soil metal elements Na, Mg, Fe, Al, and Si significantly affected the archaeal, bacterial, and fungal communities (p < 0.01, Table S4). K only impacted the archaeal community (p < 0.05, Table S4). Ca and Sr in soil did not significantly affect the microbial community (p > 0.05, Table S4). As shown in Figure 3, RDA indicated that the basic physicochemical properties of sodic soil positively correlated with microbial communities, and the metal elements of sodic soil positively correlated with microbial communities, except for K (Figure 3B,D,F). Meanwhile, the basic physicochemical properties and metal elements of saline soil were not significantly correlated with microbial communities (Figure 3A,C,E).

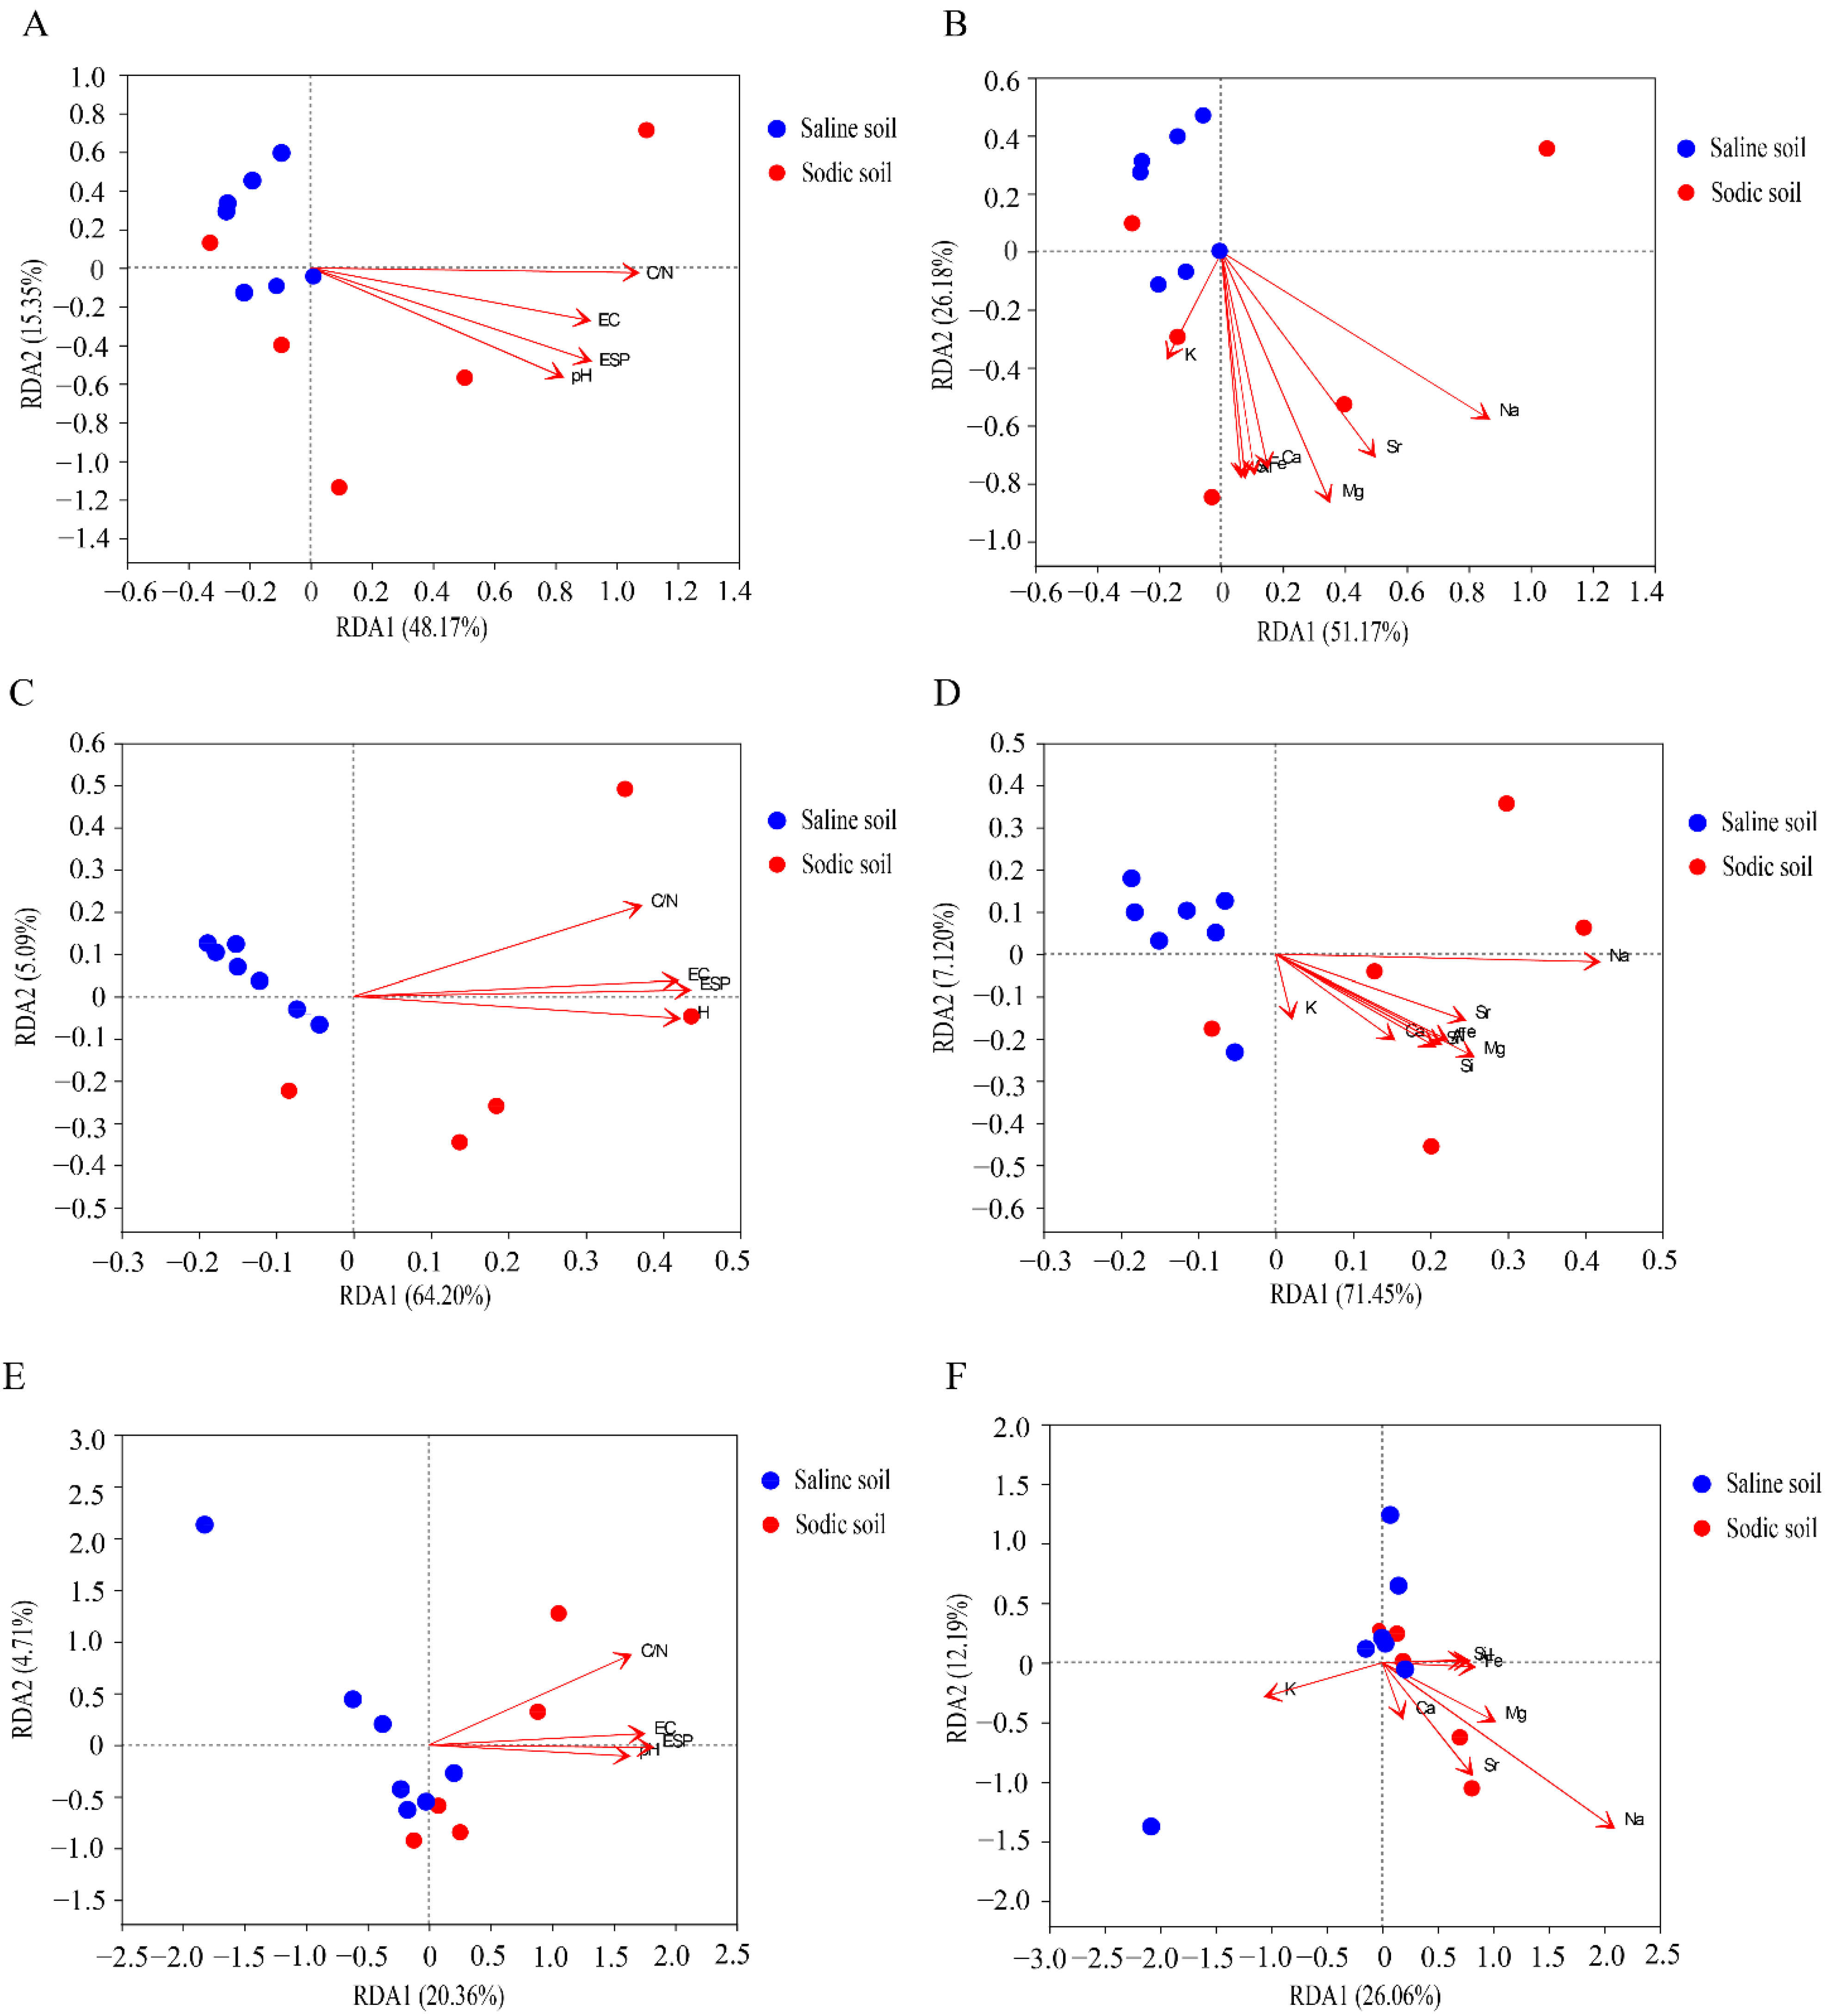
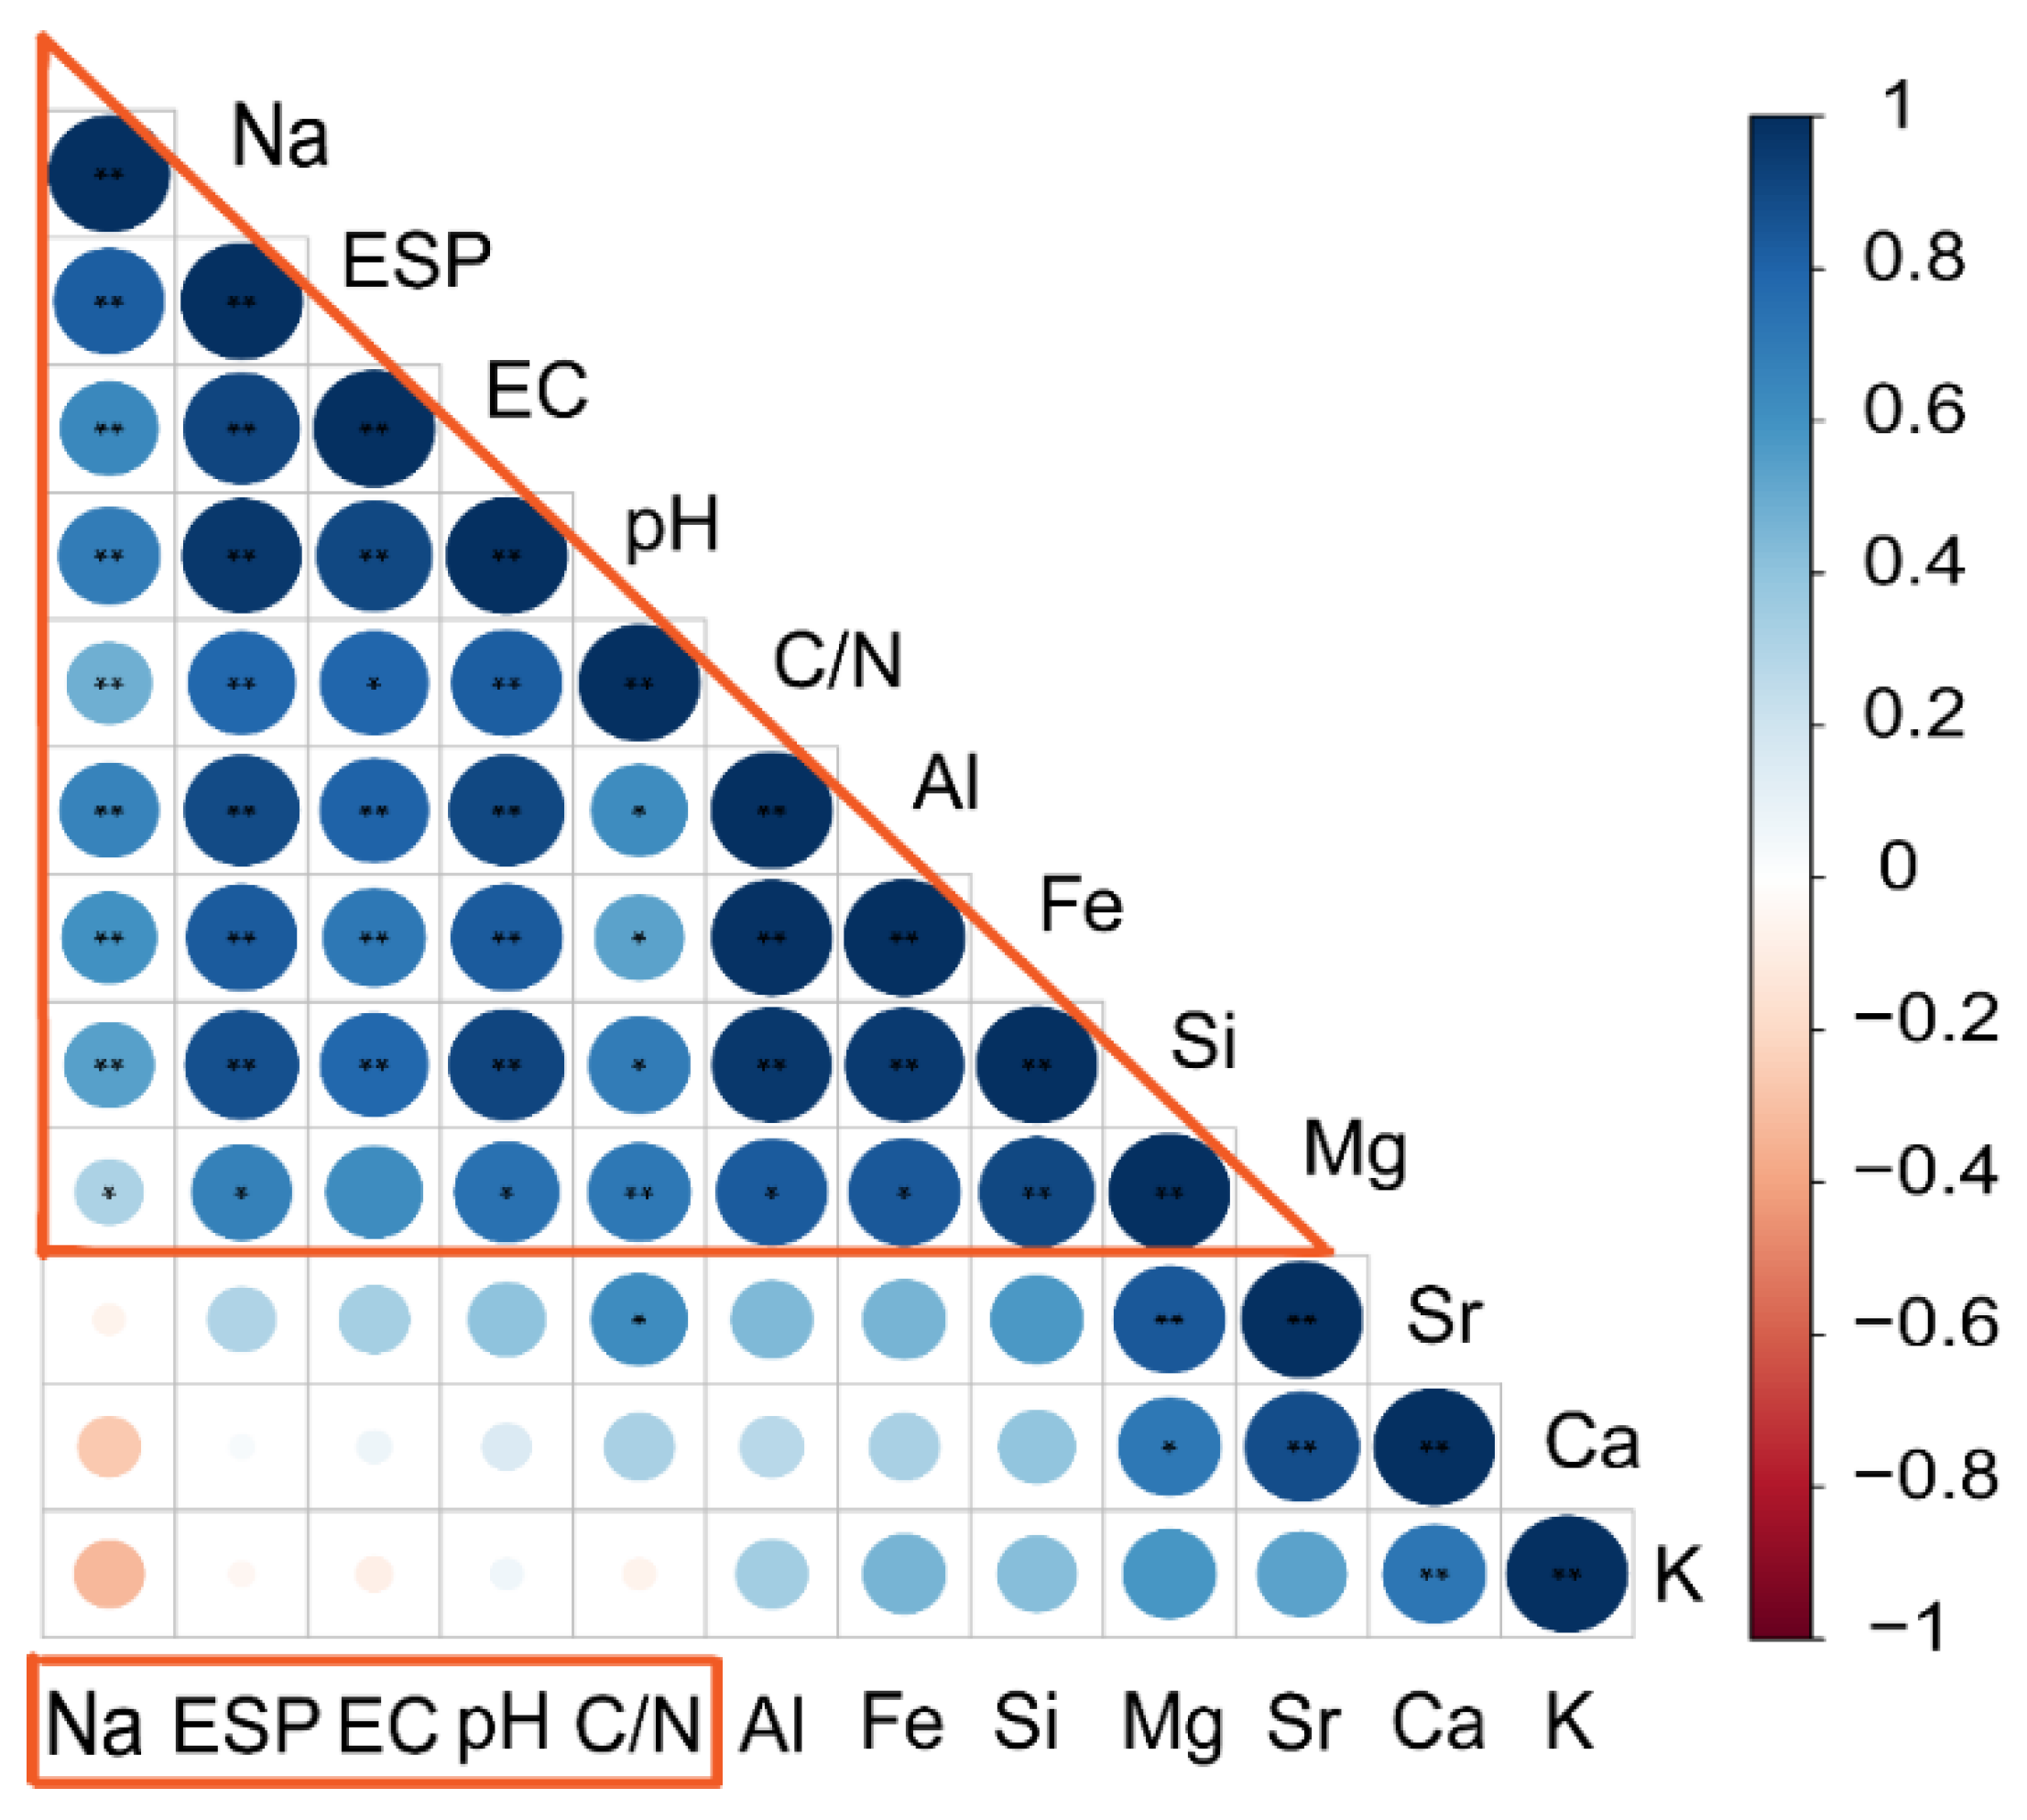
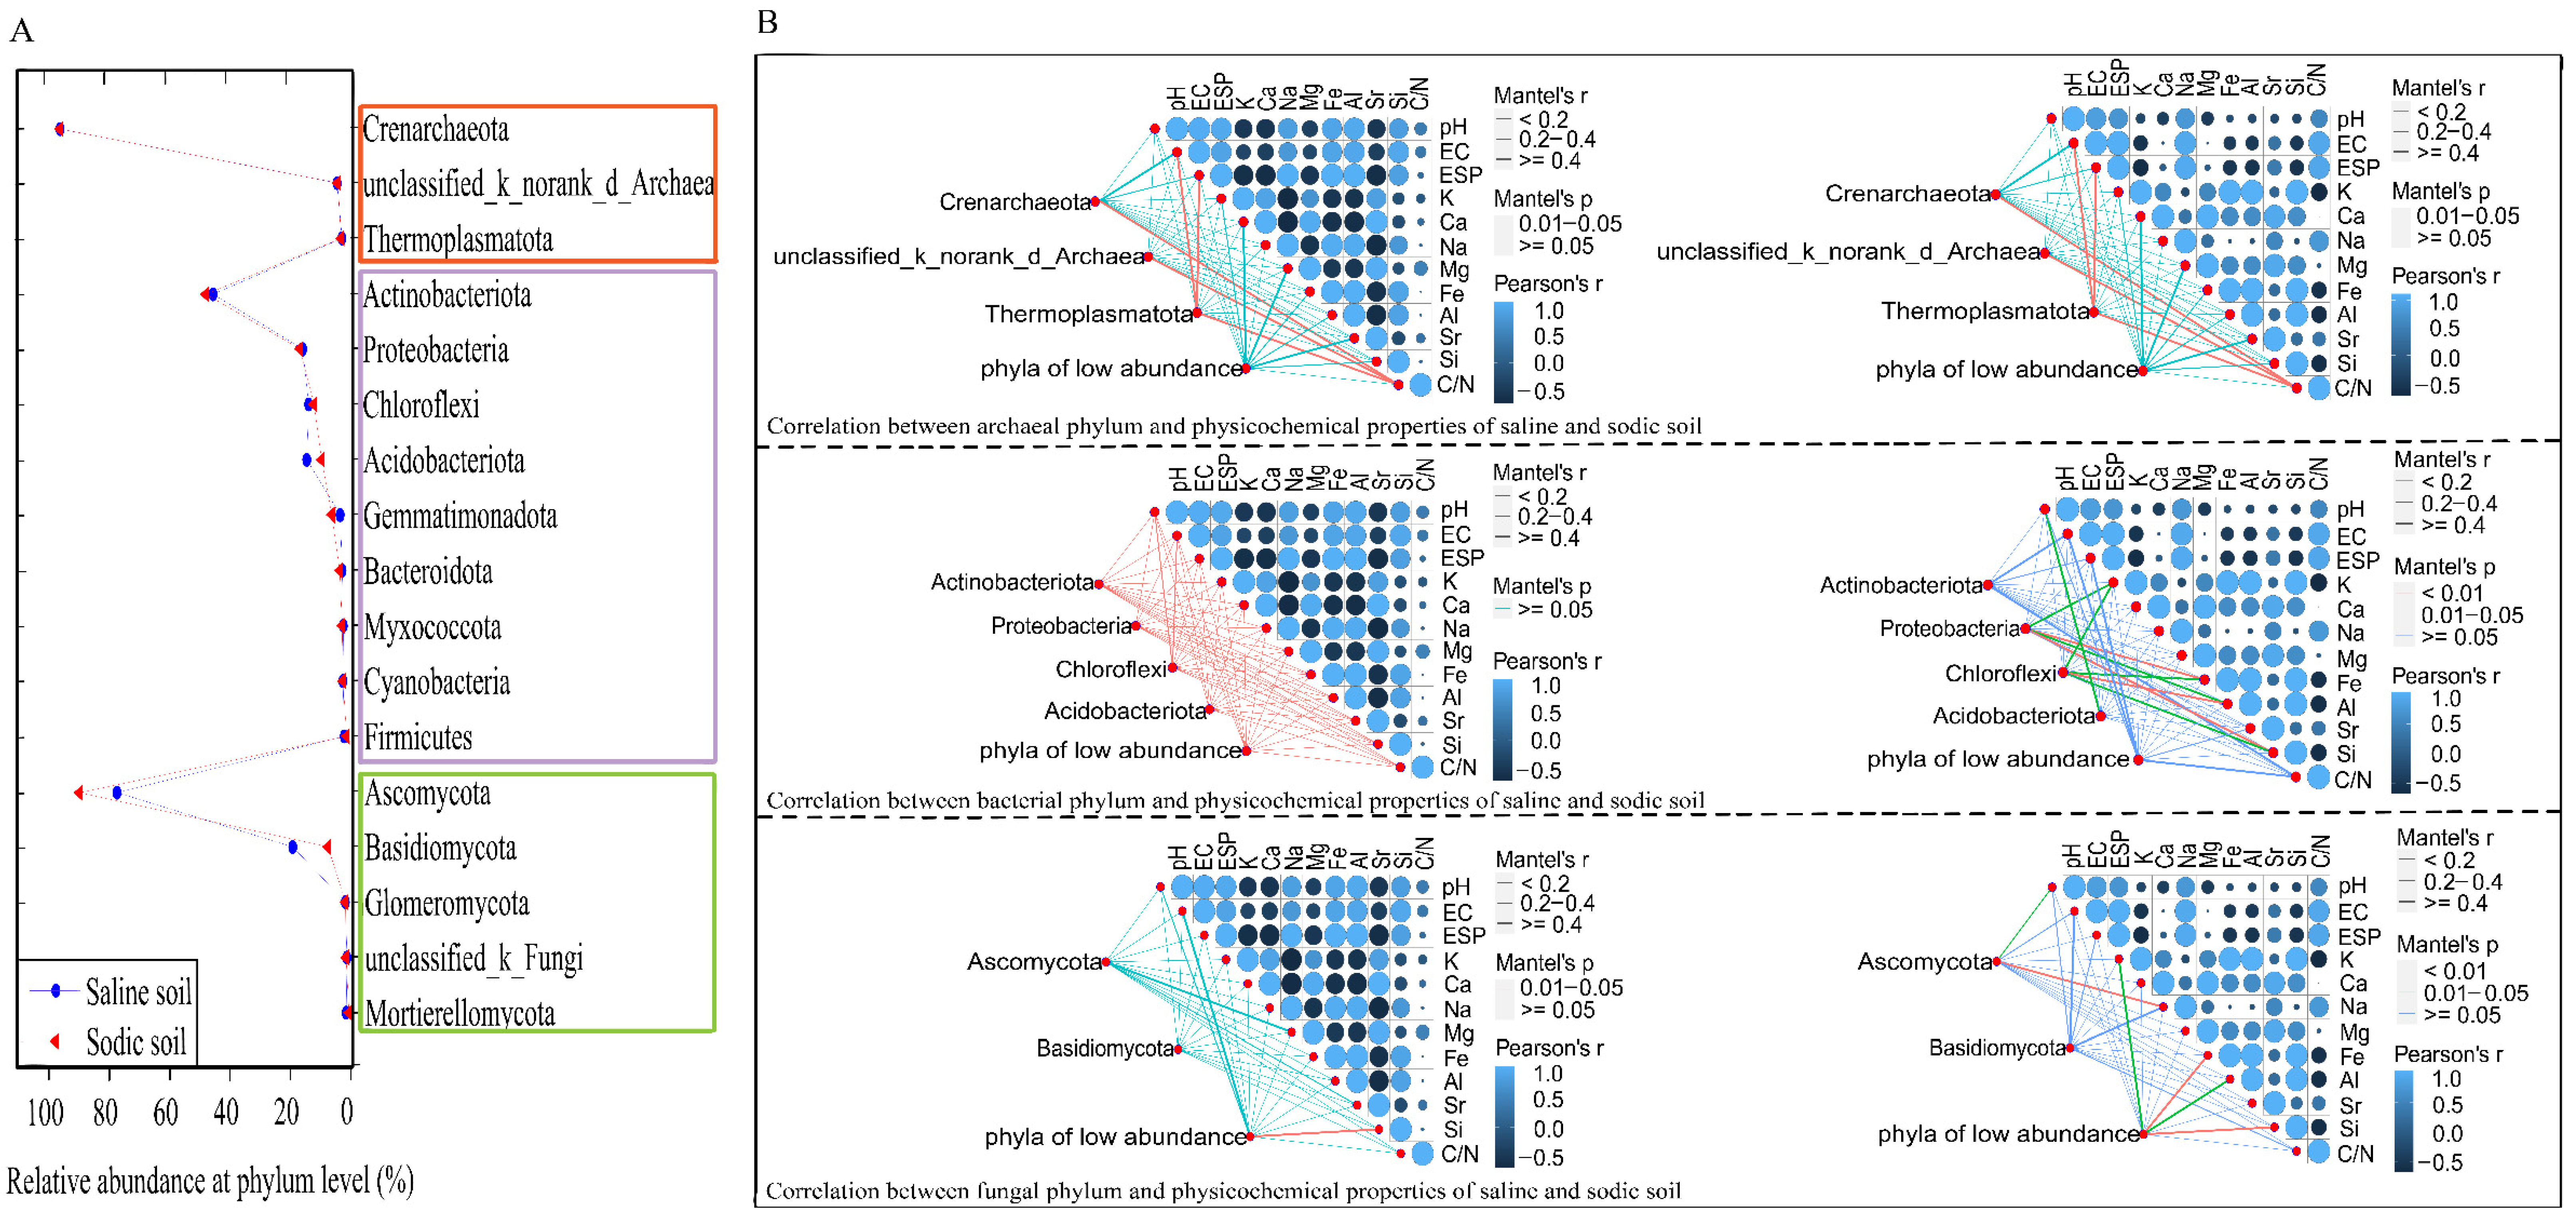
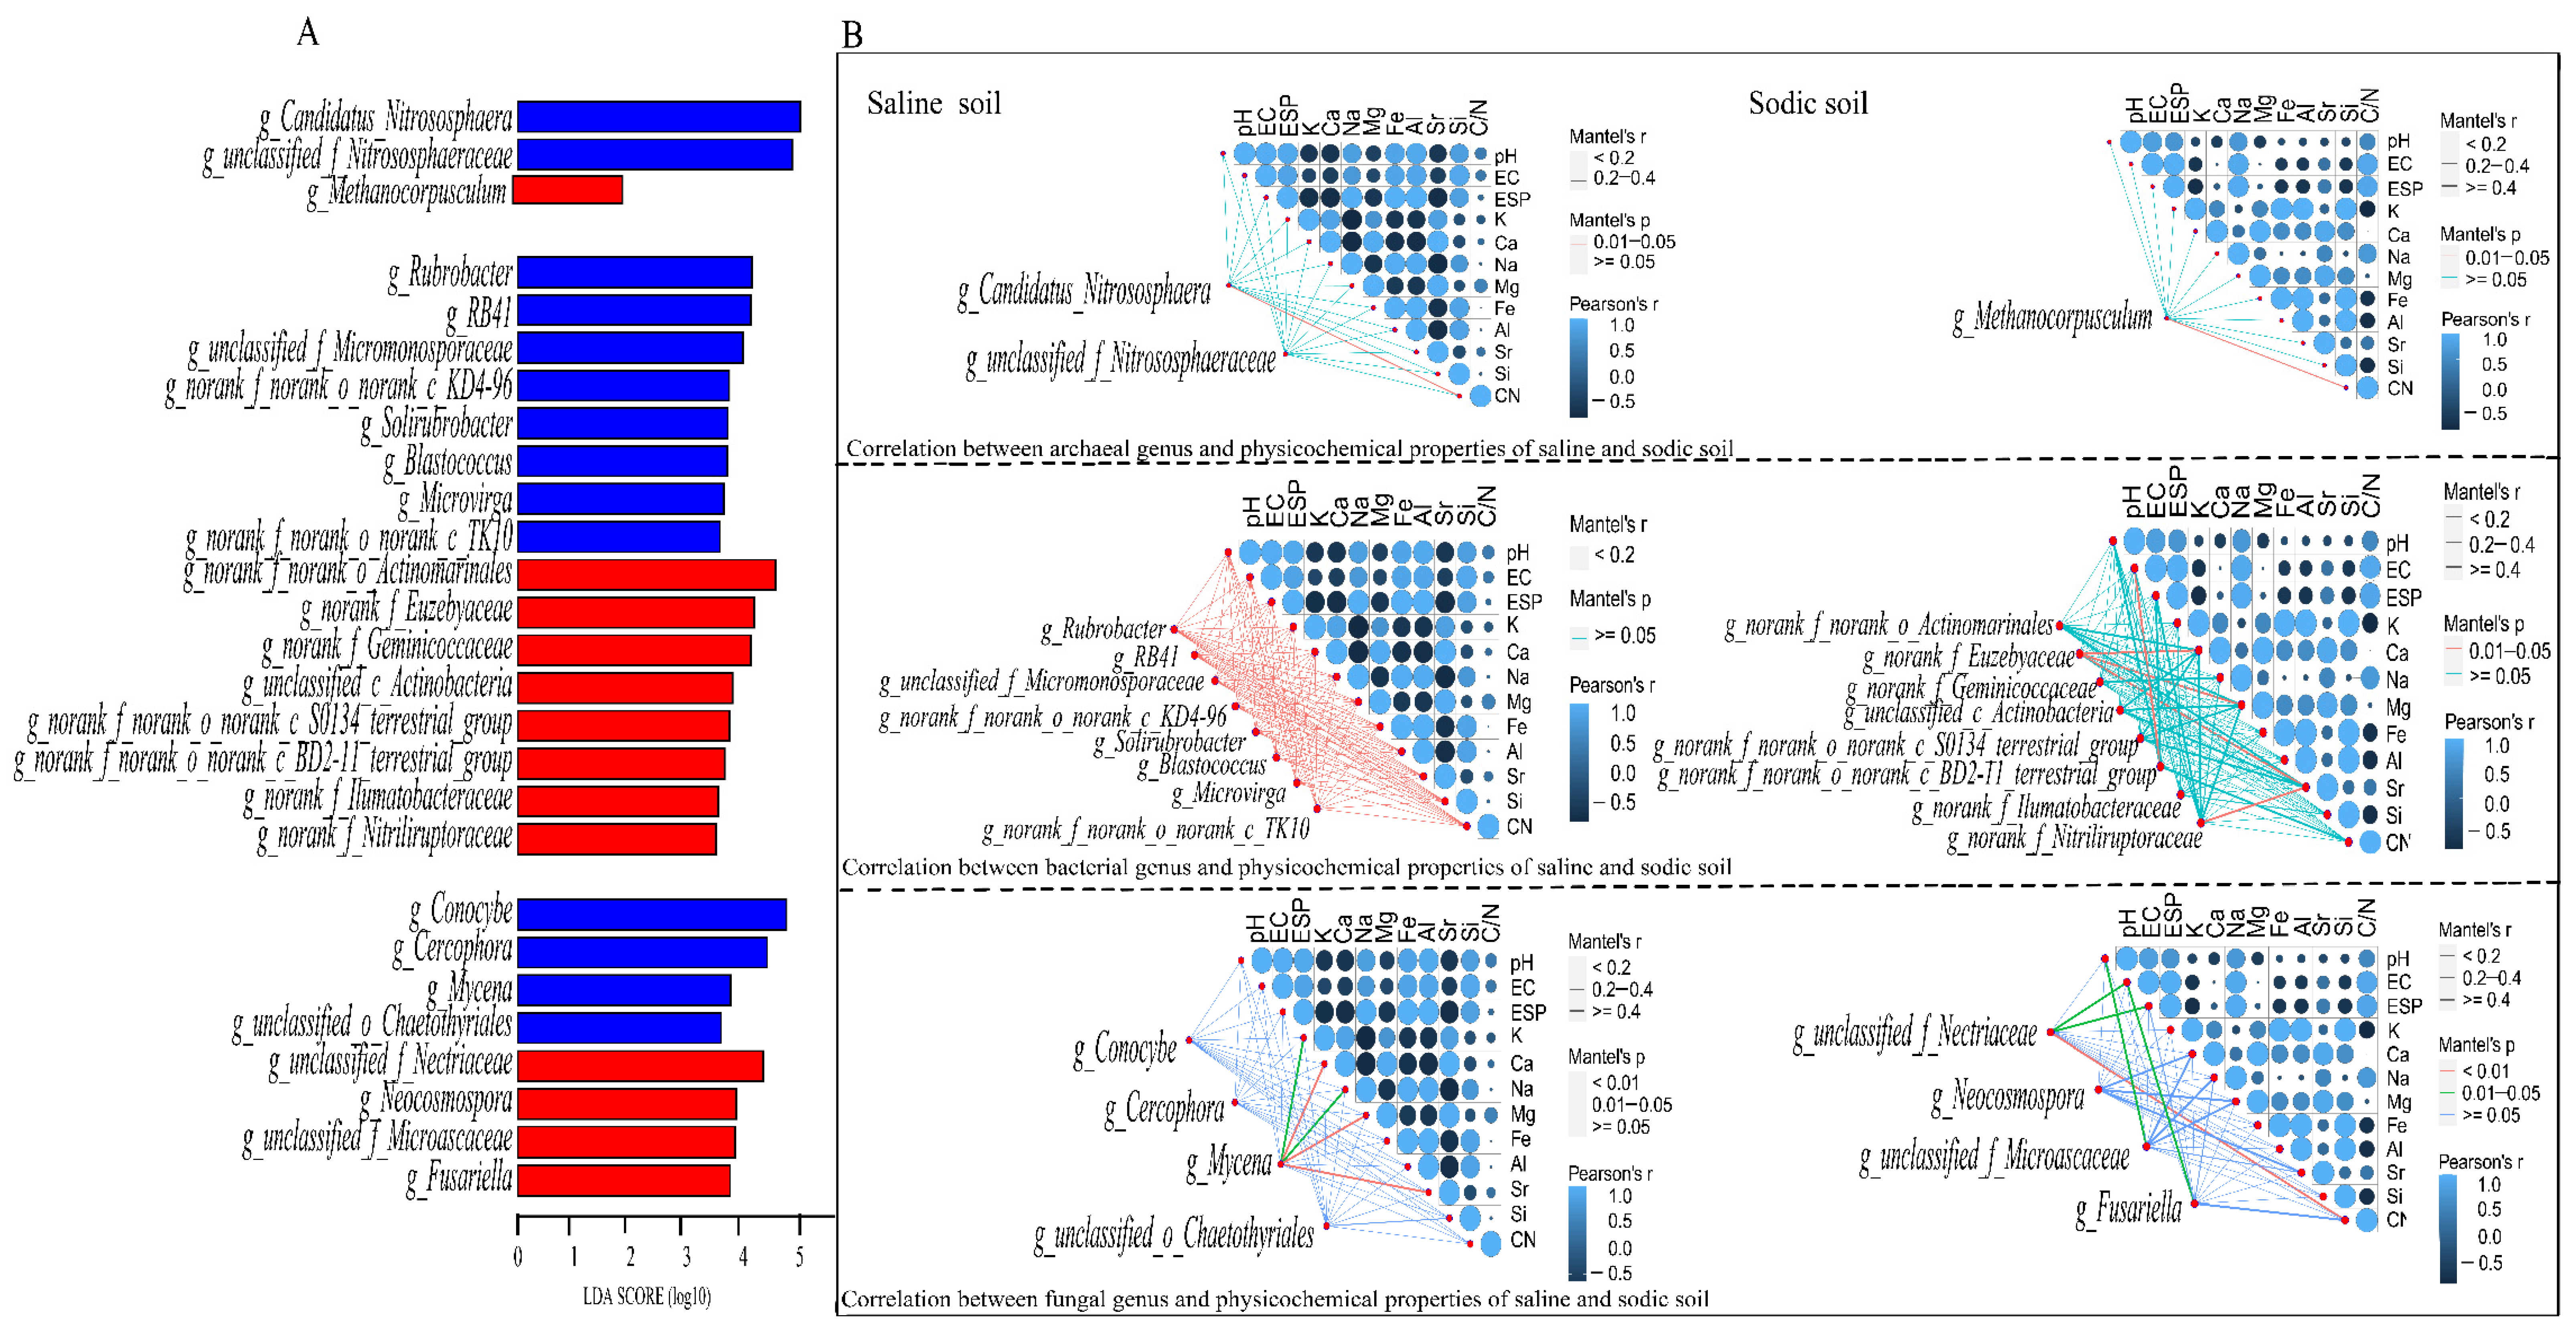
3.4. Microbial Composition of Soil and Driving Factors in Soil Physicochemical Properties

As shown in Figure 4, a strong correlation among basic soil physicochemical properties, Na as well as between them and Al, Fe, Si, Mg were observed. Based on the results of RDA and PCoA, soil physicochemical properties in sodic soil were found to strongly correlate with the microbial community (Figure 3 and Figure S1). The mainly three archaeal phyla in soil samples (relative abundance > 1%) belonged to Crenarchaeota, unclassified archaea, and Thermoplasmatota (Figure 5A). Among these, most of the archaeal sequences of soil samples were classified as Crenarchaeota (average relative abundance, 94.89%). Other phyla identified in soil were unclassified archaea and Thermoplasmatota. In the bacterial community, 3295 OTUs were assigned to 32 phyla and mainly consisted of four dominant phyla (relative abundance > 5%): Actinobacteriota, Proteobacteria, Chloroflexi, and Acidobacteriota. Among these, Actinobacteriota was the most abundant phylum in all soil samples, accounting for an average of 45.46% of the total bacterial communities. We also largely identified members of Proteobacteria, Chloroflexi, and Acidobacteriota, while members of Gemmatimonadota, Bacteroidota, Myxococcota, Cyanobacteria, and Firmicutes were minor groups (relative abundance < 5%). The dominant phyla in the fungal community were Ascomycota (average, 83.11%) and Basidiomycota (average, 13.81%), followed by Glomeromycota, unclassified_k_Fungi, and Mortierellomycota (relative abundance < 5%). Significant differences in microbial community composition for phyla in saline and sodic soil were found (Table S5).
To verify the effect of soil physicochemical properties in sodic soil on the soil microbial community and identify the main drivers of the soil physicochemical properties, we correlated the abundance-correlated dissimilarities of community composition with those of environmental variables (Figure 5B). These results further illustrated the reasons for the differences between RDA and PCoA. Archaeal phylum Crenarchaeota, unclassified archaea, and Thermoplasmatota in saline and sodic soil positively correlated with C/N; Thermoplasmatota positively correlated with EC and ESP. A relationship between soil physicochemical properties and low-abundance phyla (relative abundance < 1%) could not be found. There was no correlation between the environmental factors in saline soil and bacterial phyla. However, Proteobacteria and Chloroflexi positively correlated with K, Fe, Al, and Si in sodic soil; in particular, Chloroflexi strongly correlated with Al and Si (p < 0.01). For the fungal community, low-abundance fungal phyla were only significantly related to Si in saline soil (relative abundance < 5%), while no significant correlations of other fungal phyla and environmental factors were found; low-abundance fungal phyla in sodic soil were strongly correlated to both Fe and Si (p < 0.01). Meanwhile, Ascomycota was strongly affected by pH and Na (p < 0.01).
A total of 190 archaeal OTUs, 3295 bacterial OTUs, and 1659 fungal OTUs were assigned to 14 archaeal genera, 622 bacterial genera, and 388 fungal genera. As shown in Figure 6A, the LefSe analysis revealed the representative microbiota at the genus level in saline soil and sodic soil, including three archaeal genera, 16 bacterial genera, and eight fungal genera. In the archaeal genera, both g_Candidatus_Nitrocosmicus in saline soil and g_Methanocorpusculum in sodic soil significantly correlated with C/N (Figure 6B). A correlation between all the environmental factors of saline soil and bacterial communities at the genus level was not found. Bacterial genus g_norank_f_norank_o_norank_c_S0134_terrestrial_group was strongly correlated with pH and EC in sodic soil, while g_norank_f_Euzebyaceae was strongly correlated with Ca, Mg, and Sr. Meanwhile, fungal genus g_Mycena was significantly correlated with Ca, Mg, and Sr in saline soil. In sodic soil, the fungal genus g_unclassified_f_Nectriaceae significantly correlated with EC, ESP, and C/N. g_unclassified_f_Microascaceae significantly correlated with pH (p < 0.01), and g_Fusarium was significantly correlated with EC (p < 0.01).

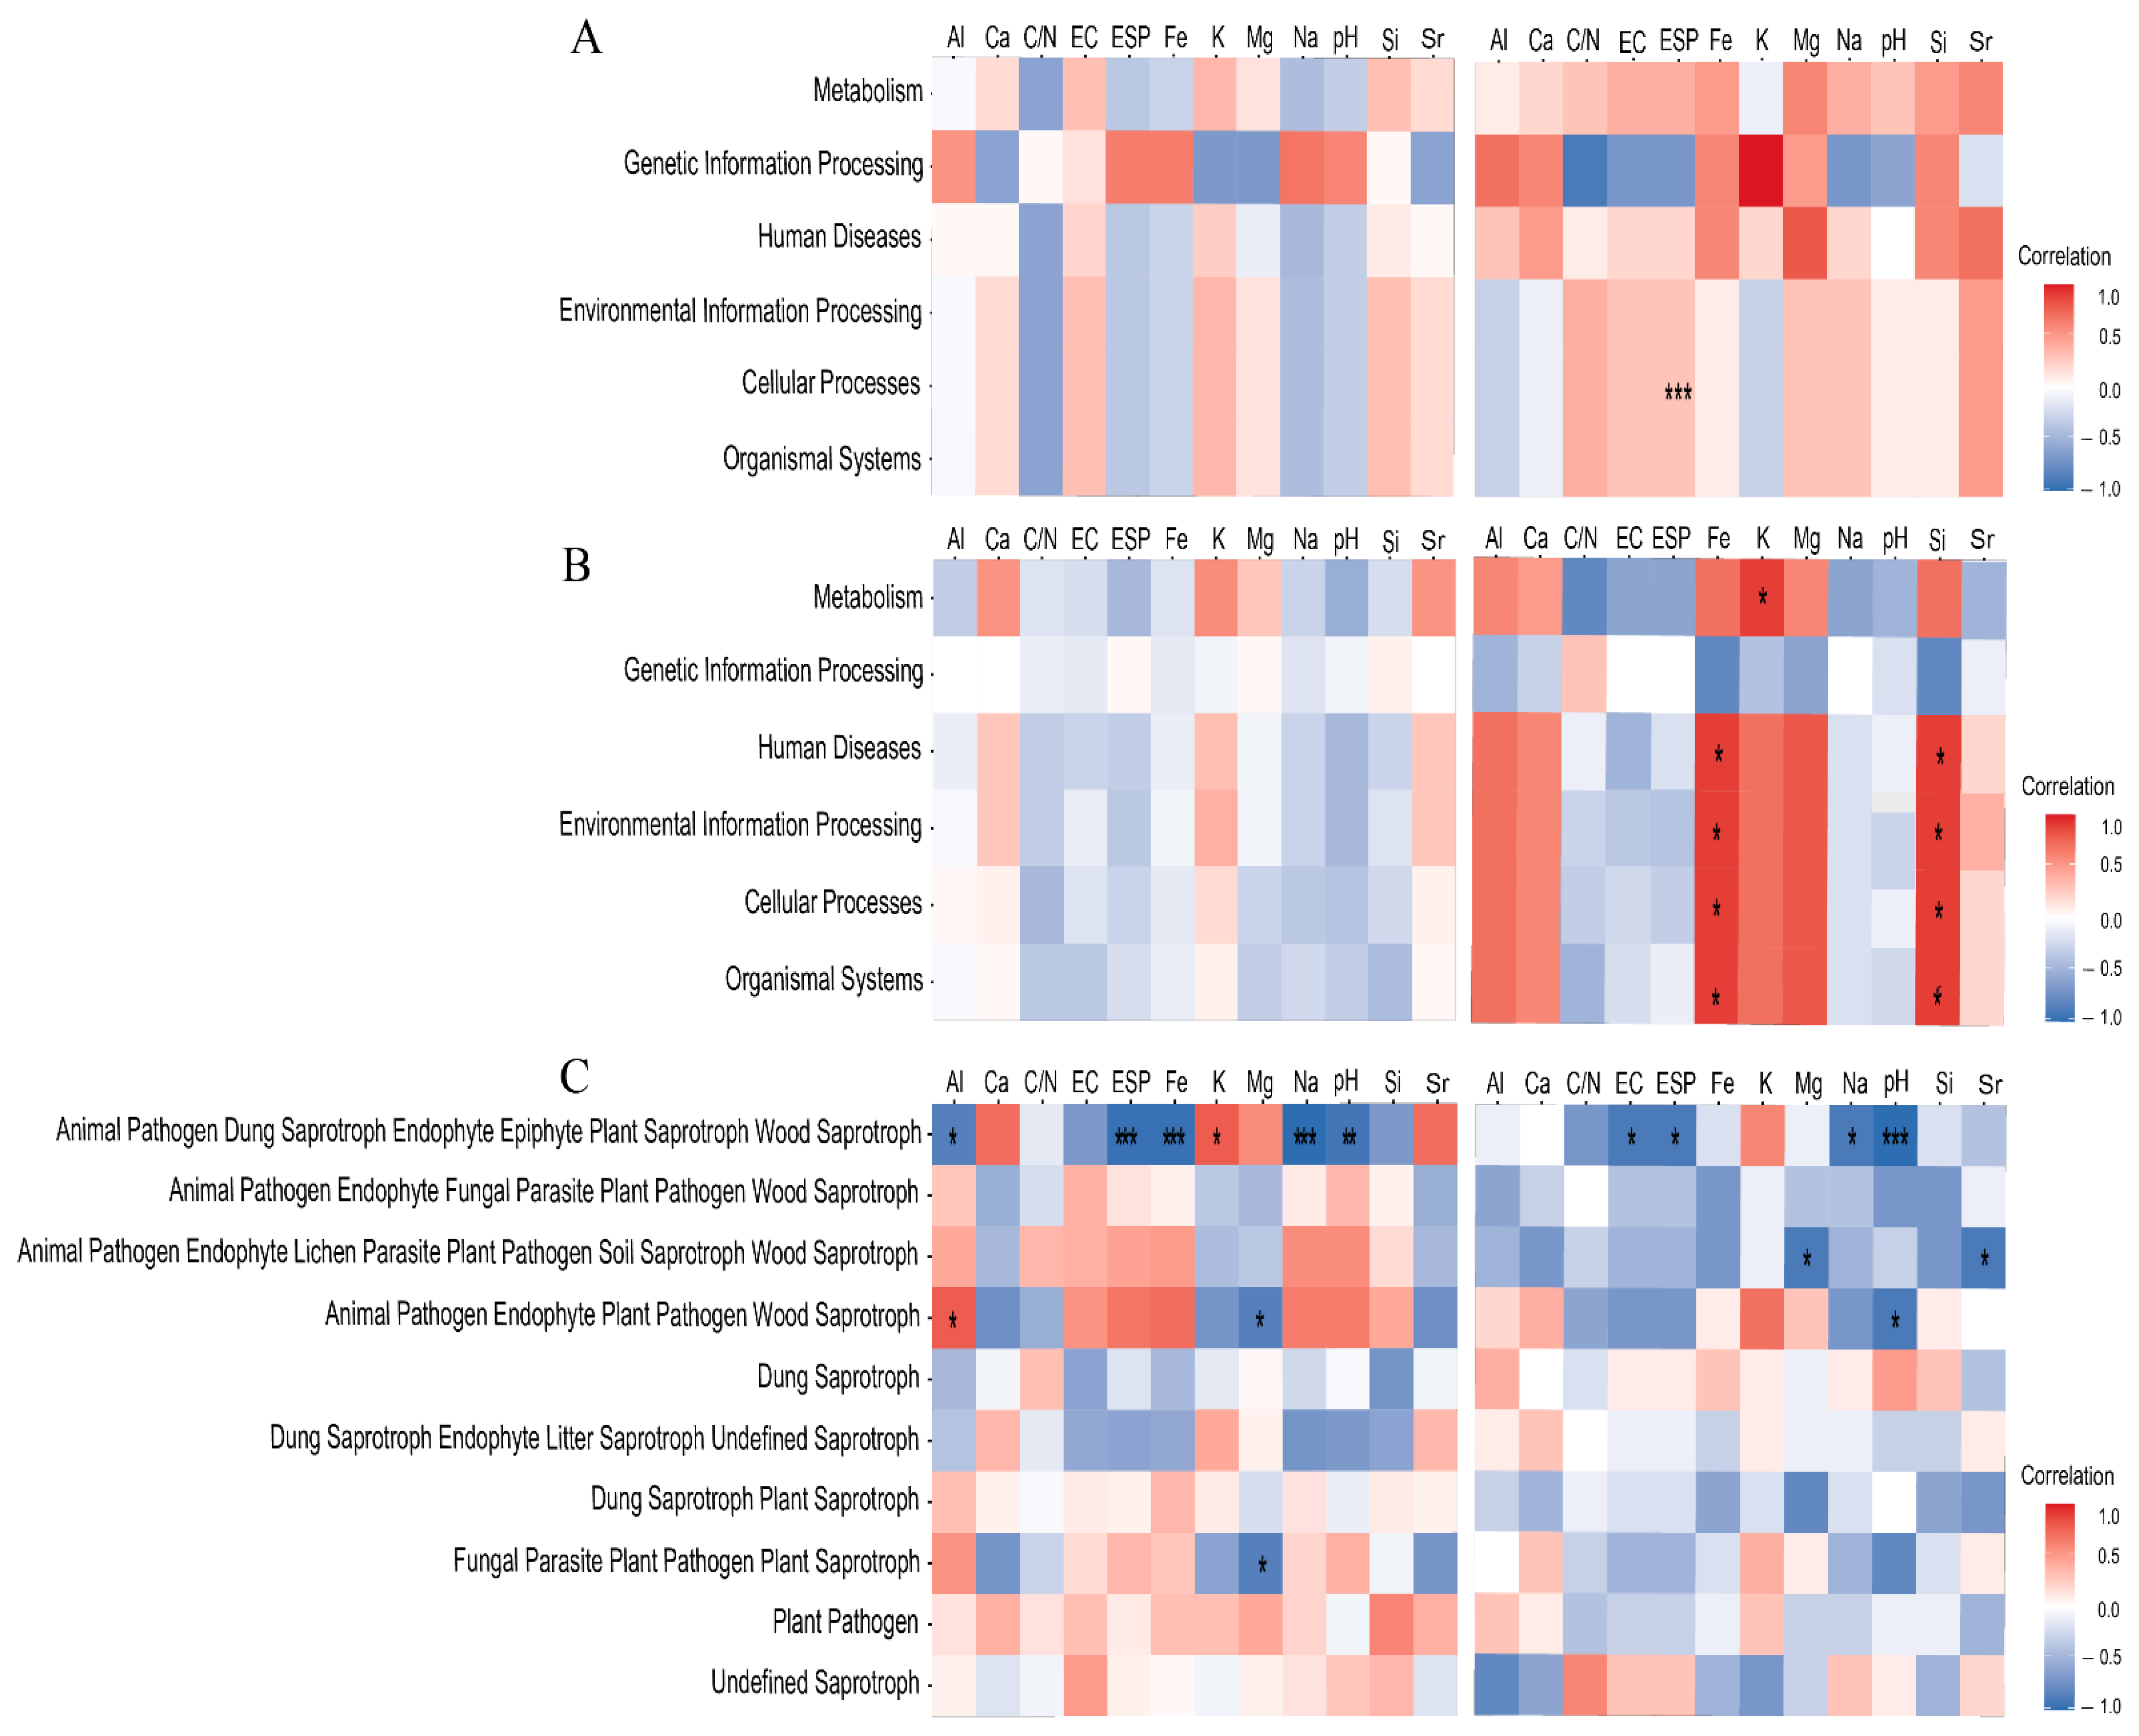
3.5. The Effect of Soil Physicochemical Properties on Functional Prediction of Microbiota

To gain further insight into the ecological role of soil environmental factors in microbial functions in soil, PICRUSt and FUNGulid were used to assess the relationships between soil physicochemical properties and bacterial and fungal metabolic pathways. In Figure 7, the left and the right of the three figures show the functional correlations with saline soil and sodic soil environmental factors and the relative abundance of soil microbiota, respectively. For the archaeal functional pathways, cellular processes positively correlated with ESP in sodic soil samples (Figure 7A). Bacterial metabolic pathways strongly positively correlated with Fe and Si in sodic soil samples, except for genetic information processing, whereas bacterial metabolism only positively correlated with K (Figure 7B). There were no significant correlations between the physicochemical properties of saline soil and archaeal and bacterial metabolic pathways (Figure 7). For the fungal functional metabolic pathways, “Fungal Parasite Plant Pathogen Saprotroph” negatively correlated with Mg in saline soil (Figure 7C). “Animal Pathogen Endophyte Plant Pathogen Wood Saprotroph” in saline soil negatively correlated with Mg, but it negatively correlated with pH in sodic soil. Only “Animal Pathogen Endophyte Plant Pathogen Wood Saprotroph” was positively correlated with Al in saline soil. “Animal Pathogen Endophyte Lichen Parasite Plant Pathogen Soil Saprotroph-Wood Saprotroph” negatively correlated with Mg and Sr in sodic soil. “Animal Pathogen-Dung Saprotroph-Endophyte-Epiphyte-Plant Saprotroph-Wood Saprotroph” negatively correlated with ESP, Na, and pH in saline and sodic soil (Figure 7C). “Animal Pathogen-Dung Saprotroph-Endophyte-Epiphyte-Plant Saprotroph-Wood Saprotroph” negatively correlated with Al and Fe in saline soil, but positively correlated with K. In total, the differences in correlation with fungal functions and different soil properties showed that both saline and sodic soil affected fungal functions. “Animal Pathogen-Dung Saprotroph-Endophyte-Epiphyte-Plant Saprotroph-Wood Saprotroph” in the fungal function was more negatively correlated with soil physicochemical properties.

4. Discussion

The effect of soil physicochemical properties on microbial communities and diversity has been well established [47]. However, fewer studies consider the effects of differences in saline soil and sodic soil on soil microbiota, respectively. As established by the Chao1 estimator and Shannon index, the microbial alpha diversity was highest in bacterial communities, followed by fungal and archaeal communities. Previous reports demonstrated that fungal diversity decreased under saline stress [48]. It was interesting that the diversity of bacteria and fungi did not show significant differences between saline and sodic soil samples. This may be due to the similar filtering effects of the physicochemical properties of saline and sodic soil on microbial communities. Previous studies also identified filtering effects of environmental factors in Tibet and the coastline showed a similarity of alpha diversity [18,49]. Although the roles of soil factors in alpha diversity were still not clearly explained, these characteristics as soil properties provide a reference for saline and sodic soil. We examined the different physiochemical properties of soil samples to evaluate whether soil factors affect the composition of archaea, bacteria, and fungi. The Mantel test results showed that Ca and Sr were not significantly correlated with microbial communities in the saline and sodic soil (Table 1 and Table S4). Notably, K correlated with microbial communities in the archaeal communities of saline and sodic soil but not in bacterial and fungal communities, suggesting a strong influence of K for the archaeal community.
Accumulating studies have revealed the tight correlations of soil physicochemical properties that can affect the microbial community [49,50,51], and our results indicated that the differences in saline soil and sodic soil might explain the distribution of microbial community structures. Many studies have reported the effects of different salinities on the soil microbial community [50,52]. It directly or indirectly affects the microbial community structure by filtering out those microbiota that are not adapted to a particular saline environment [53]. In this study, we found that the basic physicochemical properties in saline soil were significantly lower than in sodic soil samples. This might result in a high number of archaeal and bacterial unique OTUs in saline soil samples, which also indicates that archaea and bacteria have more stability and can adapt to a saline environment. However, unique OTUs were affected by differences in saline and sodic soil, e.g., Thermmoplasmatota showed higher abundance in sodic soil, Basidiomycota was higher in saline soil, and a higher abundance of Actinobacteria was observed in sodic soil (Figure 2B). Differences in basic physicochemical properties also changed the microbial community structures and distribution in soil. Clustering reflected a significant relationship between microbial community structures and soil environmental factors. The results of PCoA, RDA, and LEfSe directly showed and explained that the differences between saline and sodic soil shaped the microbial community structures (Figure 3). It was noteworthy that the microbial community structures in sodic soil were significantly related to C/N and Na; this indicated that the microbial communities in sodic soil were more sensitive than in saline soil environments.
According to the ESP and EC, saline–alkaline soil was classified as saline and sodic soil [9]. The physicochemical property differences in saline and sodic soil exerted a significant influence on microbial community compositions. Crenarchaeota was the most abundant archaeal phylum in all soil samples and was also prevalent in saline soil in the lake, mineral soil, and other saline soil [54,55]. Analysis of bacterial communities in different soil samples revealed that the most abundant phylum was Actinobacteria, followed by Proteobacteria and Chloroflexi (Figure 5A, Table S5). pH is generally considered an essential driving factor in microbial diversity and community composition, and previous studies also indicated consistent results [23]. However, this study showed that pH was not a dominant limiting factor; the differences in physicochemical properties in saline and sodic soil played critical roles in driving archaeal, bacterial, and fungal communities. We found that the archaeal communities at the phylum and genus levels have a significantly positive correlation with EC, ESP, and C/N. Thermoplasmatota positively correlated with EC and ESP. On the other hand, EC, ESP, and C/N might act as predictors as they played an essential role in influencing archaeal community abundance and regulating adaptation. Compared with the archaeal community, bacterial and fungal communities have a more evident correlation with soil physicochemical properties. Previous studies detected halotolerant bacteria affiliated with Proteobacteria, Bacteroidetes, and Actinobacteria [56,57]. The relative abundance of Actinobacteria, Proteobacteria, and Bacteroidetes correlated with physicochemical properties in sodic soil. These bacterial phyla may act as potential niche markers for microbial communities in sodic soil. There was no significant correlation between the bacterial community at the phylum and genus levels and the physicochemical properties of saline soil. This indicates that bacterial communities have a strong ability to regulate and relieve the stress of saline soil. Fewer studies have focused on the effects of pH on the fungal community, especially in sodic soil [58]. Importantly, Ascomycota and Basidiomycota are the dominant fungal phyla in soil and are involved in degrading plant lignocellulose and maintaining soil aggregate stability [59]. In the present study, we found a high abundance of Ascomycota in sodic soil that was strongly affected by pH and Na, which has not been found previously. Overall, our results support the findings of other studies wherein the critical factors of differences in microbial composition were soil environmental factors [60]. Moreover, the results showed that, compared with Na and basic physicochemical properties, the interaction contributions of other environmental factors were weaker, especially K (Figure 4). K is predominantly involved in balancing the osmosis of microbial cytoplasm in saline soil [61]. Accumulating Na content in saline–alkaline soil may reduce the effectivity of other metal elements, such as K [62]. The high content of Na in the soil also affected the mobilities of other base cations [63]. Therefore, the findings in this study further identified that K content had no significant difference in saline and sodic soil. Although salinity is an important determining factor in shaping the microbial community in different environments, the physicochemical differences in saline and sodic soil determined soil types and affected the microbial community and distribution. This finding expands our understanding of the influence of differences in saline and sodic soil on microbial communities and might lead to innovations in soil improvement strategies in the future.
In this study, the environmental stress of sodic soil significantly affected the cellular processes of archaeal function. Feng et al. evaluated the C/N cycle in the fungal community through FUNGuild [25]. Notably, we found that Fe and Si in sodic soil were significantly correlated with most bacterial functions, which indicated that bacterial functions could be regulated by changes in soil environments. ESP, Na, and pH in saline and sodic soil were negatively correlated with only a fungal pathway. Compared with bacterial functions, fungal functions at the phylum level showed higher tolerance and stability, indicating more potential benefits in improving saline and sodic soil.

5. Conclusions

Our results demonstrated the differences in the microbial community in saline and sodic soil and revealed the main influencing factors. Based on the ESP and EC, soil samples were classified as saline and sodic soil. Environmental factors in sodic soil, including pH, ESP, EC, and C/N, were higher than in saline soil. The RDA and partial Mantel tests further suggested that the microbial community structures were significantly related to pH, EC, ESP, C/N, Na, and K in sodic soil, which were also the primary determinants affecting the abundance of microbial communities. ESP mainly affected the cellular processes of the archaea in sodic soil. Metabolism in the bacterial metabolic pathway in sodic soil was only positively correlated with K. Based on this, sodic soil more strongly altered the microbial community structure. Our results shed light on the main factors in saline and sodic soil affecting microbial assemblages and the potential influence on the functions of the microbial community, and more attention should be paid to the response of the microbial community to increasingly saline and sodic soil environments in future studies, especially in grasslands.

Supplementary Materials

The following supporting information can be downloaded at: https://www.mdpi.com/article/10.3390/agriculture12060782/s1, Figure S1: PCoA analysis of archaeal (A), bacterial (B), and fungal (C) communities based on Bray–Curtis distance matrix; Table S1: The data of exchangeable sodium and cation exchange capacity; Table S2: Valid sequences of each sample; Table S3: Comparison coverage and diversity estimators of the archaeal, bacterial, and fungal sequences after normalization; Table S4: Significance tests of the correlation between physicochemical properties and microbial community composition as shown by the Mantel tests; Table S5: Relative abundance at phylum level in saline and sodic soil samples.

Author Contributions

Data curation, J.G.; formal analysis, J.G.; investigation, J.G.; validation, J.G.; visualization, J.G.; writing—original draft, J.G.; funding acquisition, Z.Y; project administration, Z.Y.; supervision, Z.Y.; resources, Z.Y.; writing—review and editing, Q.Z., D.C., F.N. and Z.Y. All authors have read and agreed to the published version of the manuscript.

Funding

This work was supported by National Key Research and Development Program of China (No. 2018YFD0800403) and the National Natural Science Foundation of China (No. 21978287).

Institutional Review Board Statement

Not applicable.

Informed Consent Statement

Not applicable.

Data Availability Statement

Sequence data obtained in this study are deposited in the NCBI Sequence Read Archive and are accessible under bioproject accession number PRJNA751210, with biosample number SUB10121718 for archaea, and bioproject accession number PRJNA751157, with biosample number SUB10121716 for bacteria, and bioproject accession number PRJNA751152, with biosample number SUB10120359.

Acknowledgments

The authors also wish to thank the following people: Guoliang Li, for his excellent cooperation and agreement in allowing us to use the experimental field for the present study; Jianjun Chen and his group members, for their help during the experimental material collection.

Conflicts of Interest

The authors declare no conflict of interest.

References

  1. Zhang, Z.C.; Feng, S.C.; Luo, J.Q.; Hao, B.H.; Diao, F.W.; Li, X.; Jia, B.B.; Wang, L.X.; Bao, Z.H.; Guo, W. Evaluation of microbial assemblages in various saline-alkaline soils driven by soluble salt ion components. J. Agric. Food Chem. 2021, 69, 3390–3400. [Google Scholar] [CrossRef] [PubMed]
  2. Tripathi, S.; Kumari, S.; Chakraborty, A.; Gupta, A.; Chakrabarti, K.; Bandyapadhyay, B.K. Microbial biomass and its activities in salt-affected coastal soils. Biol. Fertil. Soils 2005, 42, 273–277. [Google Scholar] [CrossRef]
  3. Shahid, S.A.; Zaman, M.; Heng, L. Soil salinity: Historical perspectives and a world overview of the problem. In Guideline for Salinity Assessment, Mitigation and Adaptation Using Nuclear and Related Techniques; Springer: New York, NY, USA, 2018; pp. 43–53. [Google Scholar]
  4. Wicke, B.; Smeets, E.; Dornburg, V.; Vashev, B.; Gaiser, T.; Turkenburg, W.; Faaij, A. The global technical and economic potential of bioenergy from salt-affected soils. Energy Environ. Sci. 2011, 4, 2669–2681. [Google Scholar] [CrossRef] [Green Version]
  5. Bai, W. Sustainable Development of Animal Husbandry in Inner Mongolia. Master’s Thesis, Minzu University of China, Beijing, China, 2007. [Google Scholar]
  6. Egamberdieva, D.; Kamilova, F.; Validov, S.; Gafurova, L.; Kucharova, Z.; Lugtenberg, B. High incidence of plant growth-stimulating bacteria associated with the rhizosphere of wheat grown on salinated soil in Uzbekistan. Environ. Microbiol. 2008, 10, 1–9. [Google Scholar] [CrossRef] [PubMed]
  7. Wang, J.Y.; Abdullah, I.; Xu, T.T.; Zhu, W.Y.; Gao, Y.; Wang, L. Effects of mowing disturbance and competition on spatial expansion of the clonal plant Leymus chinensis into saline-alkali soil patches. Environ. Exp. Bot. 2019, 168, 103890. [Google Scholar] [CrossRef]
  8. Cheng, B.; Zhang, H.H. Information extraction of saline-alkali soil in the west of jilin province based on fully polarimetric sar-a case study in qian an county. In Proceedings of the 2nd International Conference on Computer Science and Application Engineering of the Conference, Hohhot, China, 22–24 October 2018. [Google Scholar]
  9. Allison, L.; Richards, L.A. Diagnosis and Improvement of Saline and Alkali Soils; Soil and Water Conservative Research Branch, Agricultural Research Service: Washington, DC, USA, 1954. [Google Scholar]
  10. Chandra, N.; Kumar, S. Antibiotics producing soil microorganisms. In Antibiotics and Antibiotics Resistance Genes in Soils; Springer: New York, NY, USA, 2017; pp. 1–18. [Google Scholar]
  11. Mataix-Solera, J.; Guerrero, C.; García-Orenes, F.; Bárcenas, G.M.; Torres, M.P. Forest fire effects on soil microbiology. In Fire Effects on Soils and Restoration Strategies; CRC Press: Boca Raton, FL, USA, 2009; pp. 149–192. [Google Scholar]
  12. Rashid, M.I.; Mujawar, L.H.; Shahzad, T.; Almeelbi, T.; Ismail, I.M.I.; Oves, M. Bacteria and fungi can contribute to nutrients bioavailability and aggregate formation in degraded soils. Microbiol. Res. 2016, 183, 26–41. [Google Scholar] [CrossRef]
  13. Muñoz-Rojas, M.; Erickson, T.E.; Dixon, K.W.; Merritt, D.J. Soil quality indicators to assess functionality of restored soils in degraded semiarid ecosystems. Restor. Ecol. 2016, 24, S43–S52. [Google Scholar] [CrossRef]
  14. Mendes, L.W.; Tsai, S.M.; Navarrete, A.A.; De Hollander, M.; Van Veen, J.A.; Kuramae, E.E. Soil-Borne Microbiome: Linking Diversity to Function. Microb. Ecol. 2015, 70, 255–265. [Google Scholar] [CrossRef]
  15. Wagg, C.; Bender, S.F.; Widmer, F.; van der Heijden, M.G.A. Soil biodiversity and soil community composition determine ecosystem multifunctionality. Proc. Natl. Acad. Sci. USA 2014, 111, 5266–5270. [Google Scholar] [CrossRef] [Green Version]
  16. Caton, T.M.; Witte, L.R.; Ngyuen, H.D.; Buchheim, J.A.; Schneegurt, M.A. Halotolerant Aerobic Heterotrophic Bacteria from the Great Salt Plains of Oklahoma. Microb. Ecol. 2004, 48, 449–462. [Google Scholar] [CrossRef]
  17. Hollister, E.B.; Engledow, A.S.; Hammett, A.J.M.; Provin, T.L.; Wilkinson, H.H.; Gentry, T.J. Shifts in microbial community structure along an ecological gradient of hypersaline soils and sediments. ISME J. 2010, 4, 829–838. [Google Scholar] [CrossRef] [PubMed] [Green Version]
  18. Lozupone, C.A.; Knight, R. Global patterns in bacterial diversity. Proc. Natl. Acad. Sci. USA 2007, 104, 11436–11440. [Google Scholar] [CrossRef] [PubMed] [Green Version]
  19. Zhang, K.P.; Shi, Y.; Cui, X.Q.; Yue, P.; Li, K.H.; Liu, X.J.; Tripathi, B.M.; Chu, H.Y. Salinity Is a Key Determinant for Soil Microbial Communities in a Desert Ecosystem. mSystems 2019, 4, e00225-18. [Google Scholar] [CrossRef] [PubMed] [Green Version]
  20. Banda, J.F.; Zhang, Q.; Ma, L.Q.; Pei, L.X.; Du, Z.R.; Hao, C.B.; Dong, H.L. Both pH and salinity shape the microbial communities of the lakes in Badain Jaran Desert, NW China. Sci. Total Environ. 2021, 791, 148108. [Google Scholar] [CrossRef] [PubMed]
  21. Yang, C.; Sun, J. Soil Salinity Drives the Distribution Patterns and Ecological Functions of Fungi in Saline-Alkali Land in the Yellow River Delta, China. Front. Microbiol. 2020, 11, 594284. [Google Scholar] [CrossRef] [PubMed]
  22. Andronov, E.E.; Petrova, S.N.; Pinaev, A.G.; Pershina, E.V.; Rakhimgaliyeva, S.Z.; Akhmedenov, K.M.; Gorobets, A.V.; Sergaliev, N.K. Analysis of the structure of microbial community in soils with different degrees of salinization using T-RFLP and real-time PCR techniques. Eurasian Soil Sci. 2012, 45, 147–156. [Google Scholar] [CrossRef]
  23. Zhao, S.; Liu, J.J.; Banerjee, S.; Zhou, N.; Zhao, Z.Y.; Zhang, K.; Tian, C.Y. Soil pH is equally important as salinity in shaping bacterial communities in saline soils under halophytic vegetation. Sci. Rep. 2018, 8, 4550. [Google Scholar] [CrossRef]
  24. Dakouré, M.Y.S.; Mermoud, A.; Yacouba, H.; Boivin, P. Impacts of irrigation with industrial treated wastewater on soil properties. Geoderma 2013, 200–201, 31–39. [Google Scholar] [CrossRef]
  25. Feng, H.J.; Wang, S.Y.; Gao, Z.D.; Wang, Z.K.; Ren, X.Q.; Hu, S.W.; Pan, H. Effect of land use on the composition of bacterial and fungal communities in saline-sodic soils. Land Degrad Dev. 2019, 30, 1851–1860. [Google Scholar] [CrossRef]
  26. Rietz, D.N.; Haynes, R.J. Effects of irrigation-induced salinity and sodicity on soil microbial activity. Soil Biol. Biochem. 2003, 35, 845–854. [Google Scholar] [CrossRef]
  27. Yang, X.; Shen, Y.; Badgery, W.B.; Guo, Y.P.; Zhang, Y.J. Arbuscular mycorrhizal fungi alter plant community composition along a grazing gradient in Inner Mongolia Steppe. Basic Appl. Ecol. 2018, 32, 53–65. [Google Scholar] [CrossRef]
  28. Yin, Y.; Liu, H.Y.; He, S.Y.; Zhao, F.J.; Zhu, J.L.; Wang, H.Y.; Liu, G.; Wu, X.C. Patterns of local and regional grain size distribution and their application to Holocene climate reconstruction in semi-arid Inner Mongolia, China. Palaeogeogr. Palaeoclim. Palaeoecol. 2011, 307, 168–176. [Google Scholar] [CrossRef]
  29. Miao, L.J.; Jiang, C.; Xue, B.L.; Liu, Q.; He, B.; Nath, R.; Cui, X.F. Vegetation dynamics and factor analysis in arid and semi-arid Inner Mongolia. Environ. Earth Sci. 2014, 73, 2343–2352. [Google Scholar] [CrossRef]
  30. Sun, G.N.; Wang, M.H. Study on relation and distribution between vegetative coverage and land degradation in Inner Mongolia. Arid Land Resour. Environ. 2008, 22, 140–144. [Google Scholar]
  31. Cao, Y.P.; Pang, Y.J.; Pang, X.J. The characteristics of climate change in Xilingol league from 1956 to 2017. Agric. Res. Arid. Areas 2019, 37, 284–290. [Google Scholar]
  32. Luo, X.X.; Liu, G.C.; Xia, Y.; Chen, L.; Jiang, Z.X.; Zheng, H.; Wang, Z.Y. Use of biochar-compost to improve properties and productivity of the degraded coastal soil in the Yellow River Delta, China. J. Soils Sediments 2016, 17, 780–789. [Google Scholar] [CrossRef]
  33. Irvine, S.A.; Reid, D.J. Field prediction of sodicity in dryland agriculture in Central Queensland, Australia. Soil Res. 2001, 39, 1349–1357. [Google Scholar] [CrossRef]
  34. Liu, C.; Li, H.; Zhang, Y.Y.; Si, D.D.; Chen, Q.W. Evolution of microbial community along with increasing solid concentration during high-solids anaerobic digestion of sewage sludge. Bioresour. Technol. 2016, 216, 87–94. [Google Scholar] [CrossRef] [Green Version]
  35. Xu, N.; Tan, G.C.; Wang, H.Y.; Gai, X.P. Effect of biochar additions to soil on nitrogen leaching, microbial biomass and bacterial community structure. Eur. J. Soil Biol. 2016, 74, 1–8. [Google Scholar] [CrossRef]
  36. Adams, R.I.; Miletto, M.; Taylor, J.W.; Bruns, T.D. Dispersal in microbes: Fungi in indoor air are dominated by outdoor air and show dispersal limitation at short distances. ISME J. 2013, 7, 1262–1273. [Google Scholar] [CrossRef] [Green Version]
  37. Eren, A.M.; Sogin, M.L.; Morrison, H.G.; Vineis, J.H.; Fisher, J.C.; Newton, R.J.; McLellan, S.L. A single genus in the gut microbiome reflects host preference and specificity. ISME J. 2015, 9, 90–100. [Google Scholar] [CrossRef] [PubMed] [Green Version]
  38. Caporaso, J.G.; Kuczynski, J.; Stombaugh, J.; Bittinger, K.; Bushman, F.D.; Costello, E.K.; Fierer, N.; Pena, A.G.; Goodrich, J.K.; Gordon, J.I.; et al. QIIME allows analysis of high-throughput community sequencing data. Nat. Methods 2010, 7, 335–336. [Google Scholar] [CrossRef] [PubMed] [Green Version]
  39. Bolger, A.M.; Lohse, M.; Usadel, B. Trimmomatic: A flexible trimmer for Illumina sequence data. Bioinformatics 2014, 30, 2114–2120. [Google Scholar] [CrossRef] [PubMed] [Green Version]
  40. Edgar, R.C.; Haas, B.J.; Clemente, J.C.; Quince, C.; Knight, R. UCHIME improves sensitivity and speed of chimera detection. Bioinformatics 2011, 27, 2194–2200. [Google Scholar] [CrossRef] [Green Version]
  41. Magoč, T.; Salzberg, S.L. FLASH: Fast length adjustment of short reads to improve genome assemblies. Bioinformatics 2011, 27, 2957–2963. [Google Scholar] [CrossRef]
  42. Edgar, R.C. Search and clustering orders of magnitude faster than BLAST. Bioinformatics 2010, 26, 2460–2461. [Google Scholar] [CrossRef] [Green Version]
  43. Schloss, P.D.; Westcott, S.L.; Ryabin, T.; Hall, J.R.; Hartmann, M.; Hollister, E.B.; Lesniewski, R.A.; Oakley, B.B.; Parks, D.H.; Robinson, C.J.; et al. Introducing mothur: Open-Source, Platform-Independent, Community-Supported Software for Describing and Comparing Microbial Communities. Appl. Environ. Microbiol. 2009, 75, 7537–7541. [Google Scholar] [CrossRef] [Green Version]
  44. Segata, N.; Izard, J.; Waldron, L.; Gevers, D.; Miropolsky, L.; Garrett, W.S.; Huttenhower, C. Metagenomic biomarker discovery and explanation. Genome Biol. 2011, 12, R60. [Google Scholar] [CrossRef] [Green Version]
  45. Langille, M.G.I.; Zaneveld, J.; Caporaso, J.G.; McDonald, D.; Knights, D.; Reyes, J.A.; Clemente, J.C.; Burkepile, D.E.; Thurber, R.L.V.; Knight, R.; et al. Predictive functional profiling of microbial communities using 16S rRNA marker gene sequences. Nat. Biotechnol. 2013, 31, 814–821. [Google Scholar] [CrossRef]
  46. Nguyen, N.H.; Song, Z.W.; Bates, S.T.; Branco, S.; Tedersoo, L.; Menke, J.; Schilling, J.S.; Kennedy, P.G. FUNGuild: An open annotation tool for parsing fungal community datasets by ecological guild. Fungal Ecol. 2016, 20, 241–248. [Google Scholar] [CrossRef]
  47. Lombard, N.; Prestat, E.; Van Elsas, J.D.; Simonet, P. Soil-specific limitations for access and analysis of soil microbial communities by metagenomics. FEMS Microbiol. Ecol. 2011, 78, 31–49. [Google Scholar] [CrossRef] [PubMed] [Green Version]
  48. Chowdhury, N.; Marschner, P.; Burns, R.G. Soil microbial activity and community composition: Impact of changes in matric and osmotic potential. Soil Biol. Biochem. 2011, 43, 1229–1236. [Google Scholar] [CrossRef]
  49. Wang, J.J.; Yang, D.M.; Zhang, Y.; Shen, J.; van der Gast, C.; Hahn, M.W.; Wu, Q.L. Do Patterns of Bacterial Diversity along Salinity Gradients Differ from Those Observed for Macroorganisms? PLoS ONE 2011, 6, e27597. [Google Scholar] [CrossRef] [PubMed] [Green Version]
  50. Bissett, A.; Richardson, A.E.; Baker, G.; Thrall, P.H. Long-term land use effects on soil microbial community structure and function. Appl. Soil Ecol. 2011, 51, 66–78. [Google Scholar] [CrossRef]
  51. Ushio, M.; Kitayama, K.; Balser, T.C. Tree species-mediated spatial patchiness of the composition of microbial community and physicochemical properties in the topsoils of a tropical montane forest. Soil Biol. Biochem. 2010, 42, 1588–1595. [Google Scholar] [CrossRef]
  52. Lin, W.; Wang, Y.Z.; Gorby, Y.; Nealson, K.; Pan, Y.X. Integrating niche-based process and spatial process in biogeography of magnetotactic bacteria. Sci. Rep. 2013, 3, 1643. [Google Scholar] [CrossRef] [Green Version]
  53. Logares, R.; Bråte, J.; Bertilsson, S.; Clasen, J.L.; Shalchian-Tabrizi, K.; Rengefors, K. Infrequent marine–freshwater transitions in the microbial world. Trends Microbiol. 2009, 17, 414–422. [Google Scholar] [CrossRef]
  54. de Vries, F.T.; Liiri, M.E.; Bjørnlund, L.; Bowker, M.A.; Christensen, S.; Setälä, H.M.; Bardgett, R.D. Land use alters the resistance and resilience of soil food webs to drought. Nat. Clim. Change 2012, 2, 276–280. [Google Scholar] [CrossRef]
  55. Ayton, J.; Aislabie, J.; Barker, G.M.; Saul, D.; Turner, S. Crenarchaeota affiliated with group 1.1 b are prevalent in coastal mineral soils of the Ross Sea region of Antarctica. Environ. Microbiol. 2010, 12, 689–703. [Google Scholar] [CrossRef]
  56. Canfora, L.; Bacci, G.; Pinzari, F.; Lo Papa, G.; Dazzi, C.; Benedetti, A. Salinity and Bacterial Diversity: To What Extent Does the Concentration of Salt Affect the Bacterial Community in a Saline Soil? PLoS ONE 2014, 9, e106662. [Google Scholar] [CrossRef] [Green Version]
  57. Ahmed, V.; Verma, M.K.; Gupta, S.; Mandhan, V.; Chauhan, N.S. Metagenomic Profiling of Soil Microbes to Mine Salt Stress Tolerance Genes. Front. Microbiol. 2018, 9, 159. [Google Scholar] [CrossRef] [PubMed] [Green Version]
  58. Rousk, J.; Bååth, E.; Brookes, P.C.; Lauber, C.L.; Lozupone, C.; Caporaso, J.G.; Knight, R.; Fierer, N. Soil bacterial and fungal communities across a pH gradient in an arable soil. ISME J. 2010, 4, 1340–1351. [Google Scholar] [CrossRef] [PubMed]
  59. Osono, T.; Takeda, H. Fungal decomposition of Abiesneedle and Betulaleaf litter. Mycologia 2006, 98, 172–179. [Google Scholar] [CrossRef]
  60. Drenovsky, R.E.; Steenwerth, K.L.; Jackson, L.E.; Scow, K.M. Land use and climatic factors structure regional patterns in soil microbial communities. Glob. Ecol. Biogeogr. 2009, 19, 27–39. [Google Scholar] [CrossRef] [PubMed] [Green Version]
  61. Oren, A. Thermodynamic limits to microbial life at high salt concentrations. Environ. Microbiol. 2010, 13, 1908–1923. [Google Scholar] [CrossRef]
  62. Coban, O.; De Deyn, G.B.; van der Ploeg, M. Soil microbiota as game-changers in restoration of degraded lands. Science 2022, 375, abe0725. [Google Scholar] [CrossRef]
  63. Wang, M.; Chen, S.B.; Chen, L.; Wang, D. Responses of soil microbial communities and their network interactions to saline-alkaline stress in Cd-contaminated soils. Environ. Pollut. 2019, 252, 1609–1621. [Google Scholar] [CrossRef]
Figure 1. (A) Basic physicochemical properties of soil samples (t-test, p < 0.05). (B) Soil content of metal elements. (C) differences in saline and sodic soil (t-test, p < 0.05).
Agriculture 12 00782 g001
Figure 2. (A) Venn diagrams of archaeal, bacterial, and fungal OTUs. (B) Unique OTUs of archaea, bacteria, and fungi belonging to different phyla.
Agriculture 12 00782 g002
Figure 3. The relationship between basic physicochemical properties and soil metal elements in saline and sodic soil samples and archaeal (A,B), bacterial (C,D), and fungal (E,F) communities.
Agriculture 12 00782 g003
Figure 4. Pairwise comparisons of soil physicochemical properties (Spearman’s correlation coefficients).
Agriculture 12 00782 g004
Figure 5. (A). The relative abundance of microbial communities at the phylum level, including archaeal (orange box), bacterial (pink box), and fungal (green box) communities; (B). Relative abundance of microbial communities at the phylum level is related to soil environmental factors (saline soil at the left and sodic soil at the right) by partial Mantel test (phyla of low abundance represent archaeal microbial communities with relative abundance less than 1%, the relative abundance of bacterial and fungal microbial communities less than 5%); edge width corresponds to the Mantel’s r statistic for the corresponding distance correlations, and the edge color denotes the statistical significance based on 9999 permutations.
Agriculture 12 00782 g005
Figure 6. (A). Dominant microorganisms at genus in saline soil (blue frame) and sodic soil (red frame) based on LEfSe identities (LDA scores greater than 2.0). (B). Relative abundance of the dominant genus related to soil environmental factor by partial Mantel test; edge width corresponds to the Mantel’s r statistic for the corresponding distance correlations, and the edge color denotes the statistical significance based on 9999 permutations.
Agriculture 12 00782 g006
Figure 7. The correlation with saline (left) and sodic (right) soil environmental factors and relative abundance of archaeal (A), bacterial (B), and fungal (C) functional prediction. * p < 0. 05; ** p < 0.01; *** p < 0.01.
Agriculture 12 00782 g007
Table 1. Comparison of alpha diversity between saline soil and sodic soil samples.
Sample ClassificationsObserved OTUsChao 1 EstimatorShannon Index
Archaea
Saline soil52 ± 14 a64 ± 24 a2.16 ± 0.14 a
Sodic soil74 ± 11 b90 ± 20 b2.04 ± 0.12 a
Bacteria
Saline soil1780 ± 104 a2227 ± 142 a6.18 ± 0.09 a
Sodic soil1634 ± 204 a2073 ± 252 a5.91 ± 0.29 b
Fungi
Saline soil585 ± 76 a118 ± 48 a3.74 ± 0.83 a
Sodic soil444 ± 16 a193 ± 30 b3.82 ± 0.57 a
Values in this table indicate the means ± SD of each index. Different letters within the same column represent significant differences across seasonal groups (t-test, p < 0.05).
Publisher’s Note: MDPI stays neutral with regard to jurisdictional claims in published maps and institutional affiliations.

