
North Expansion of Winter Wheat Planting Area in China under Different Emissions Scenarios


Abstract
:1. Introduction
2. Materials and Methods
2.1. Study Area
2.2. Data
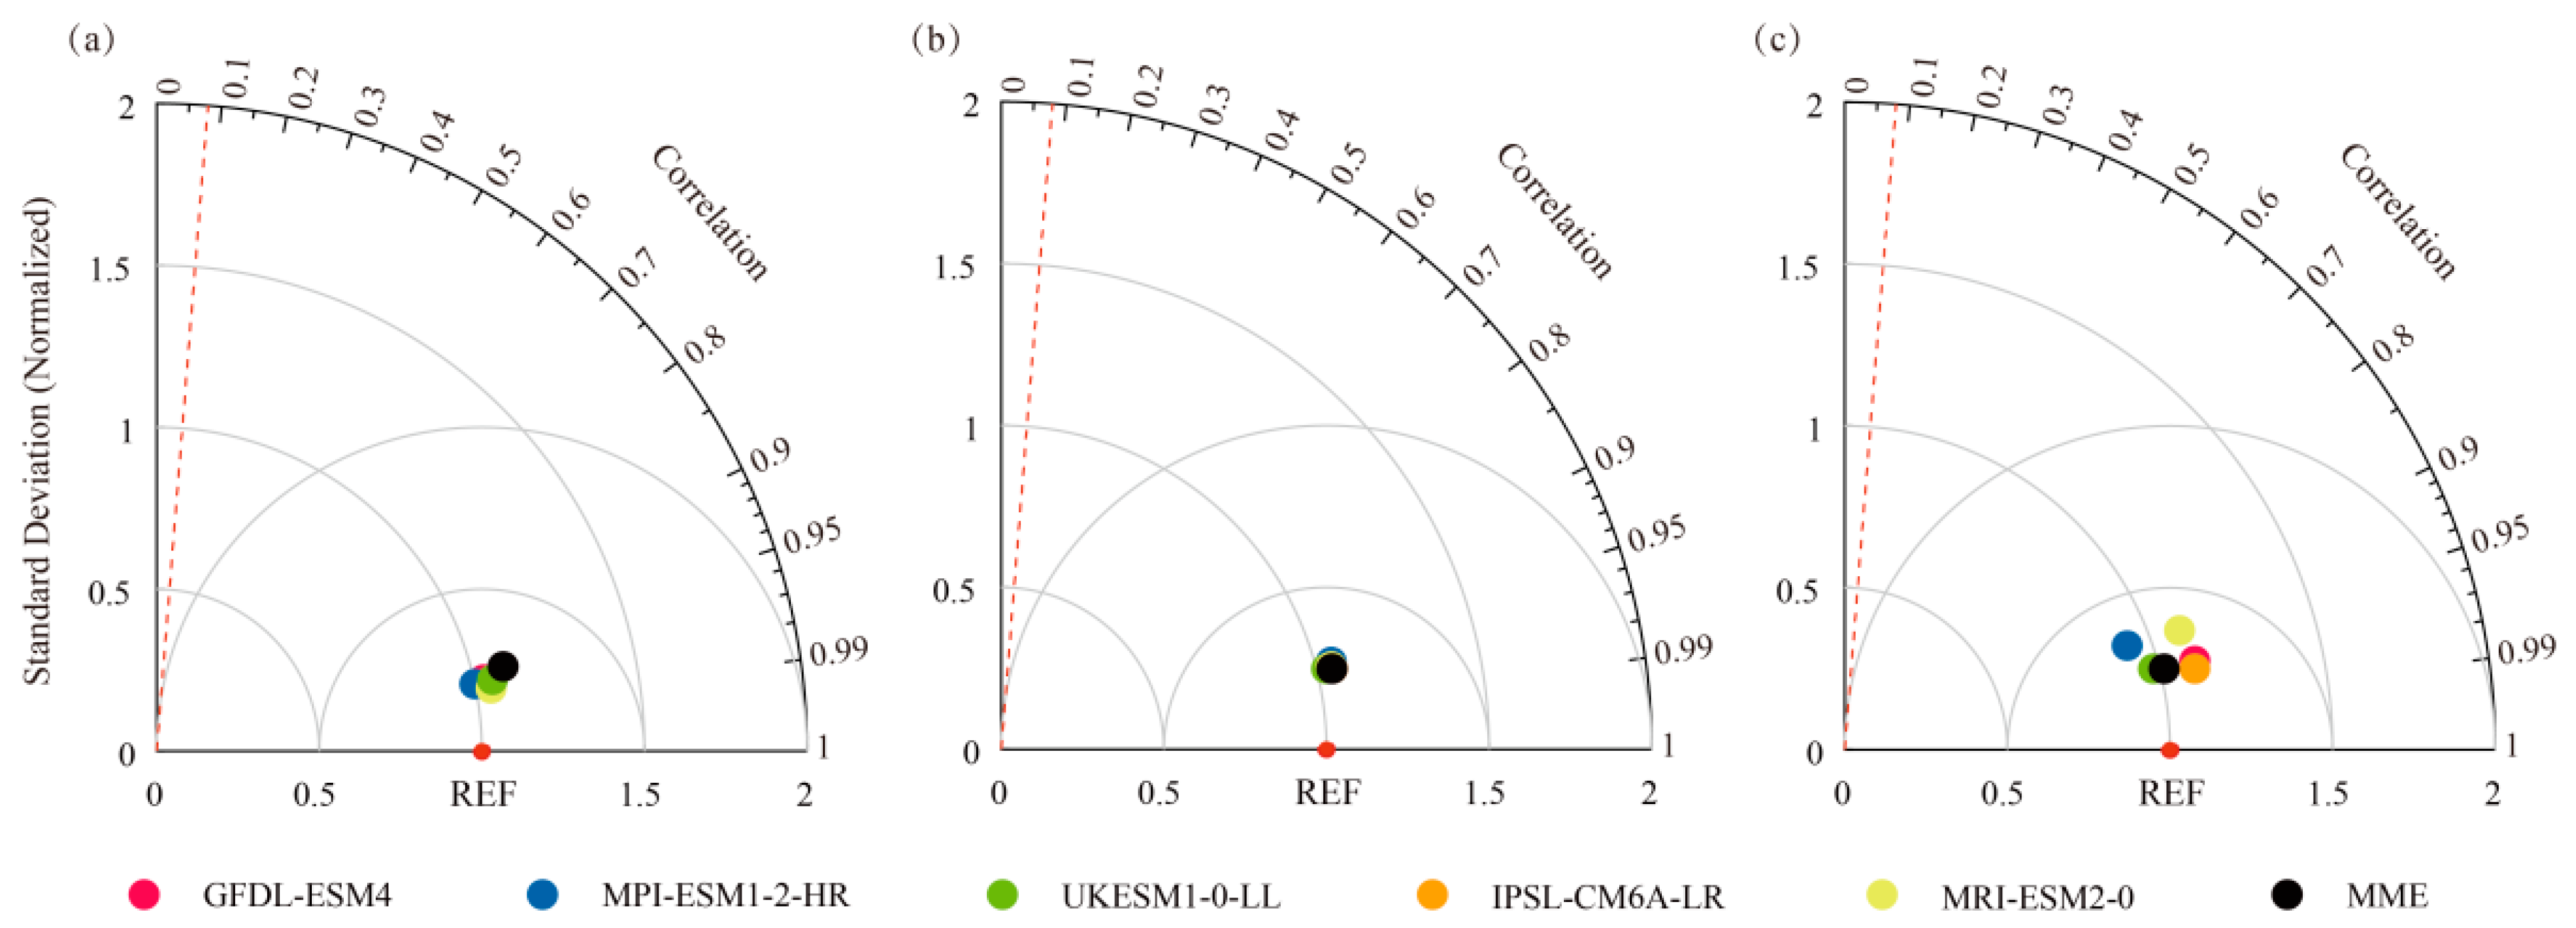
2.3. Methodology
3. Results
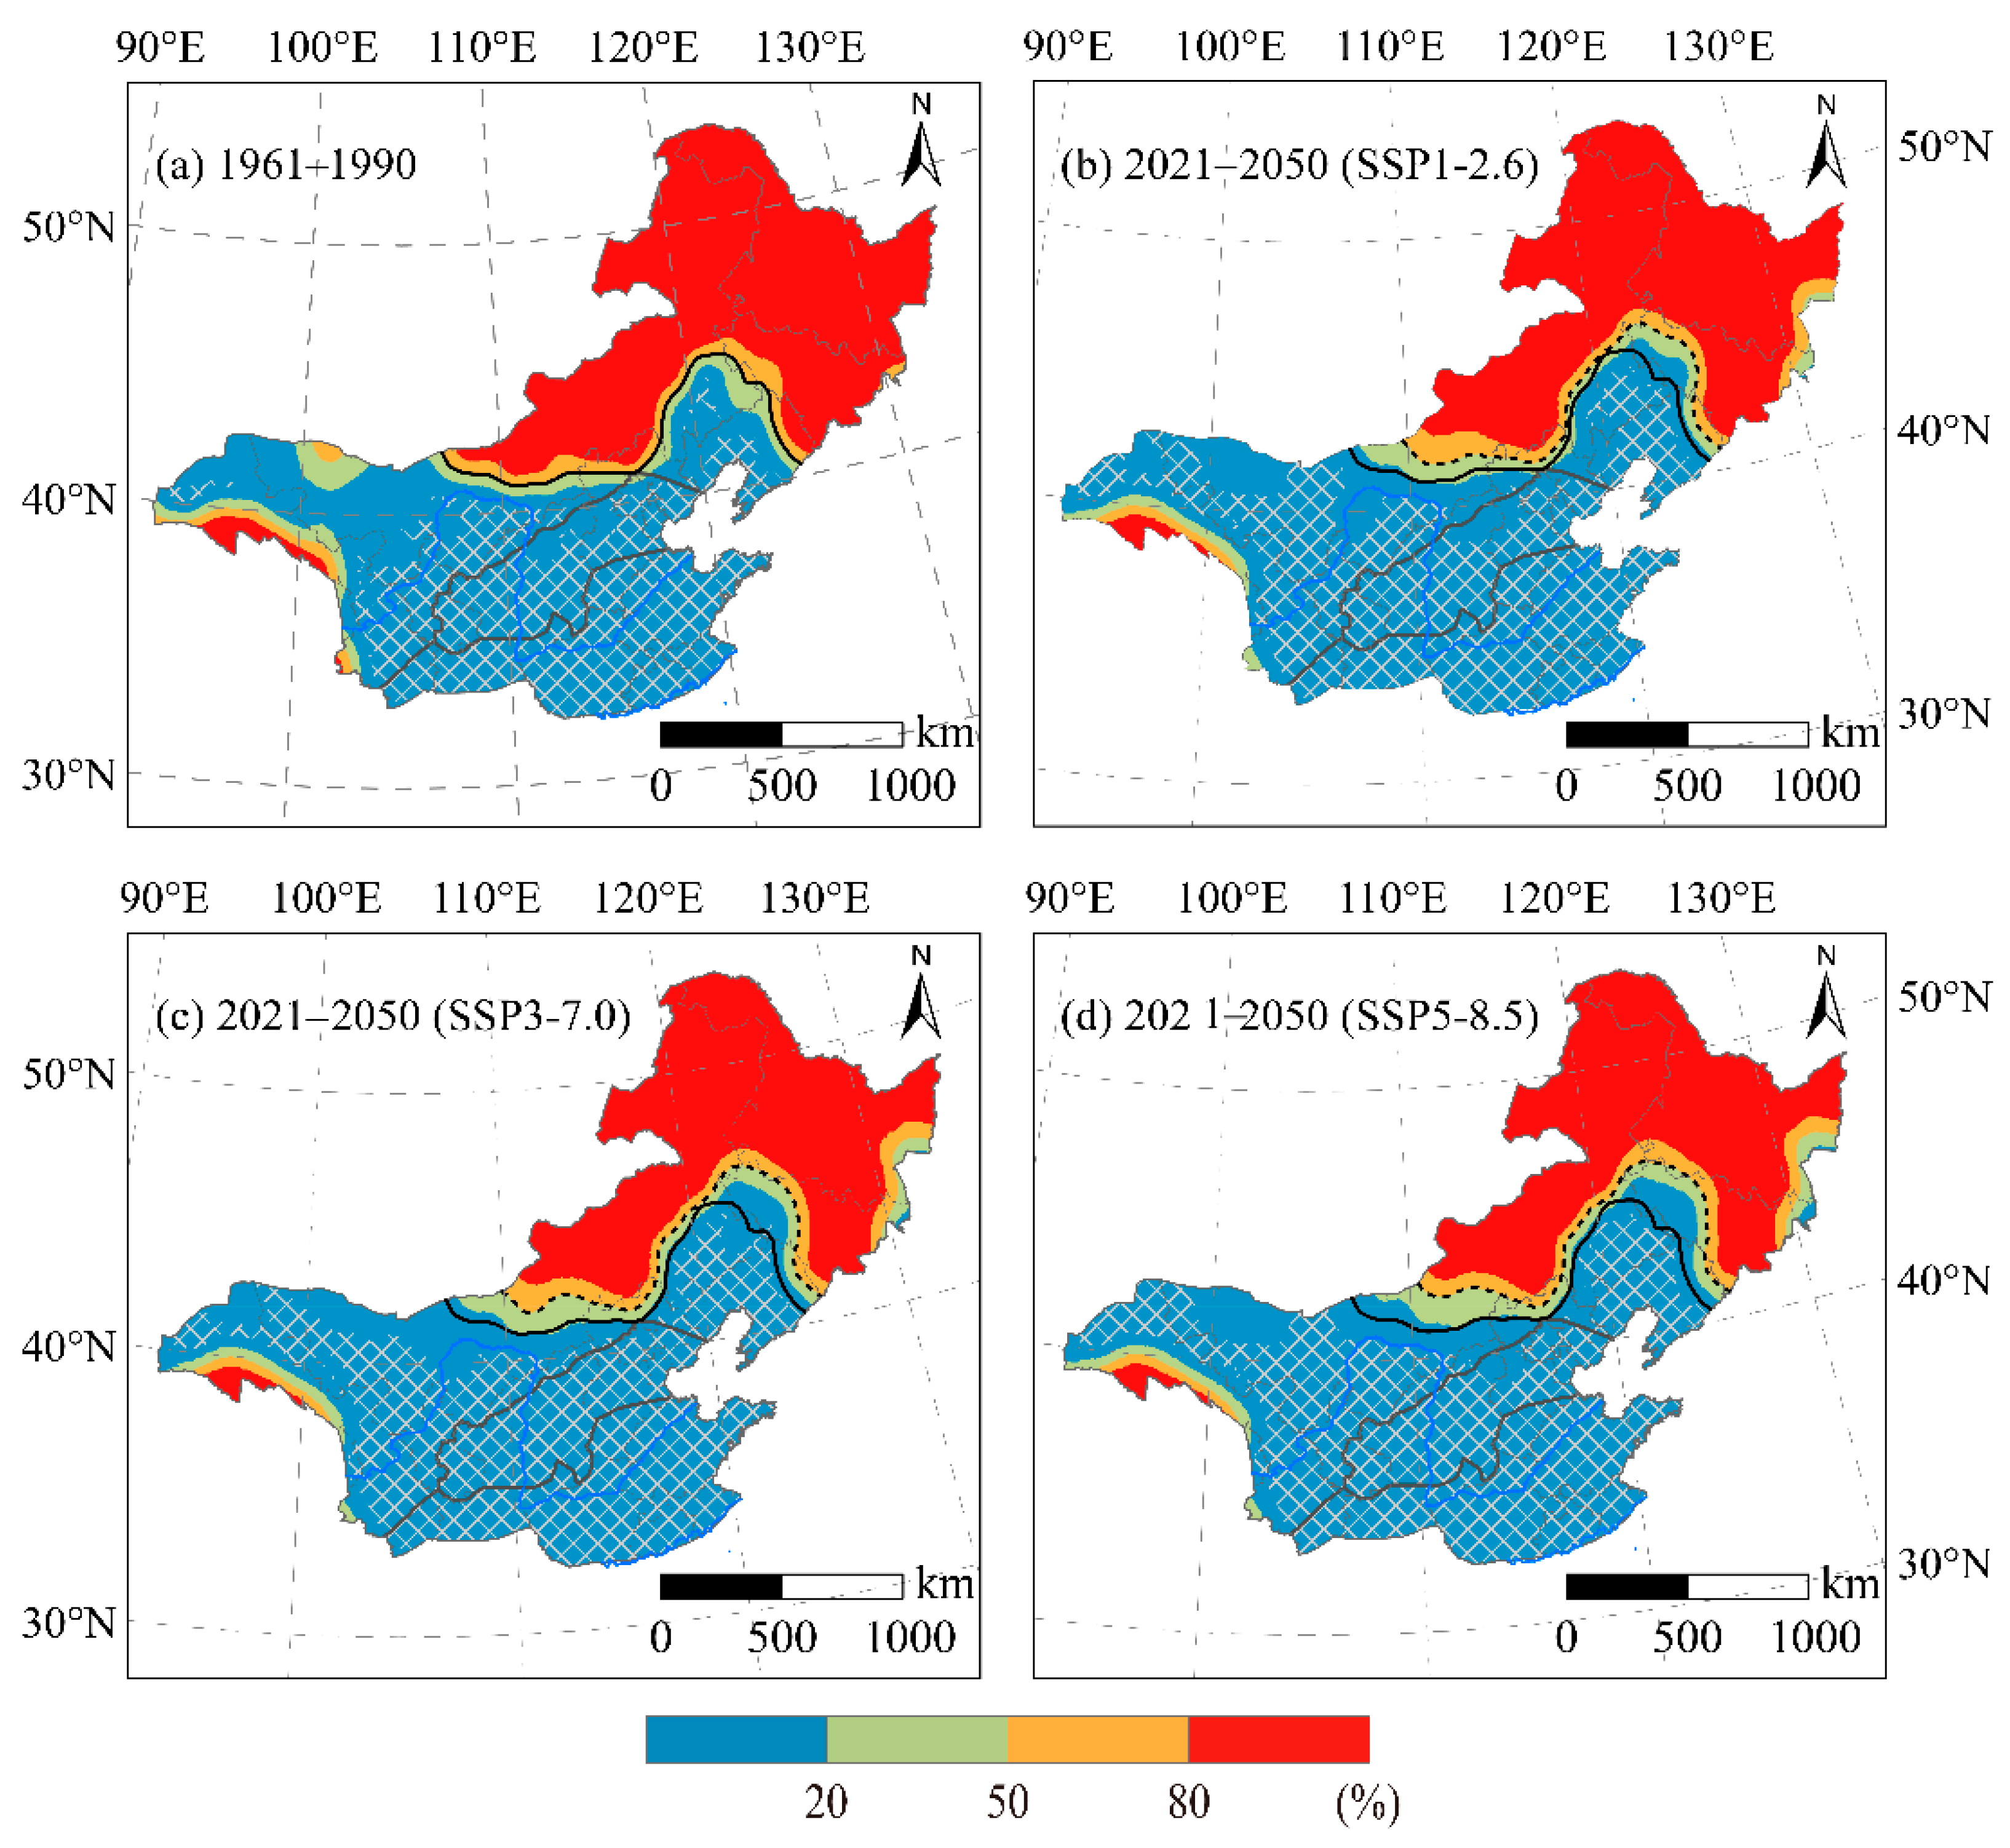
3.1. Percentage of Extreme Minimum Temperature (−22 °C) Years Occurrence
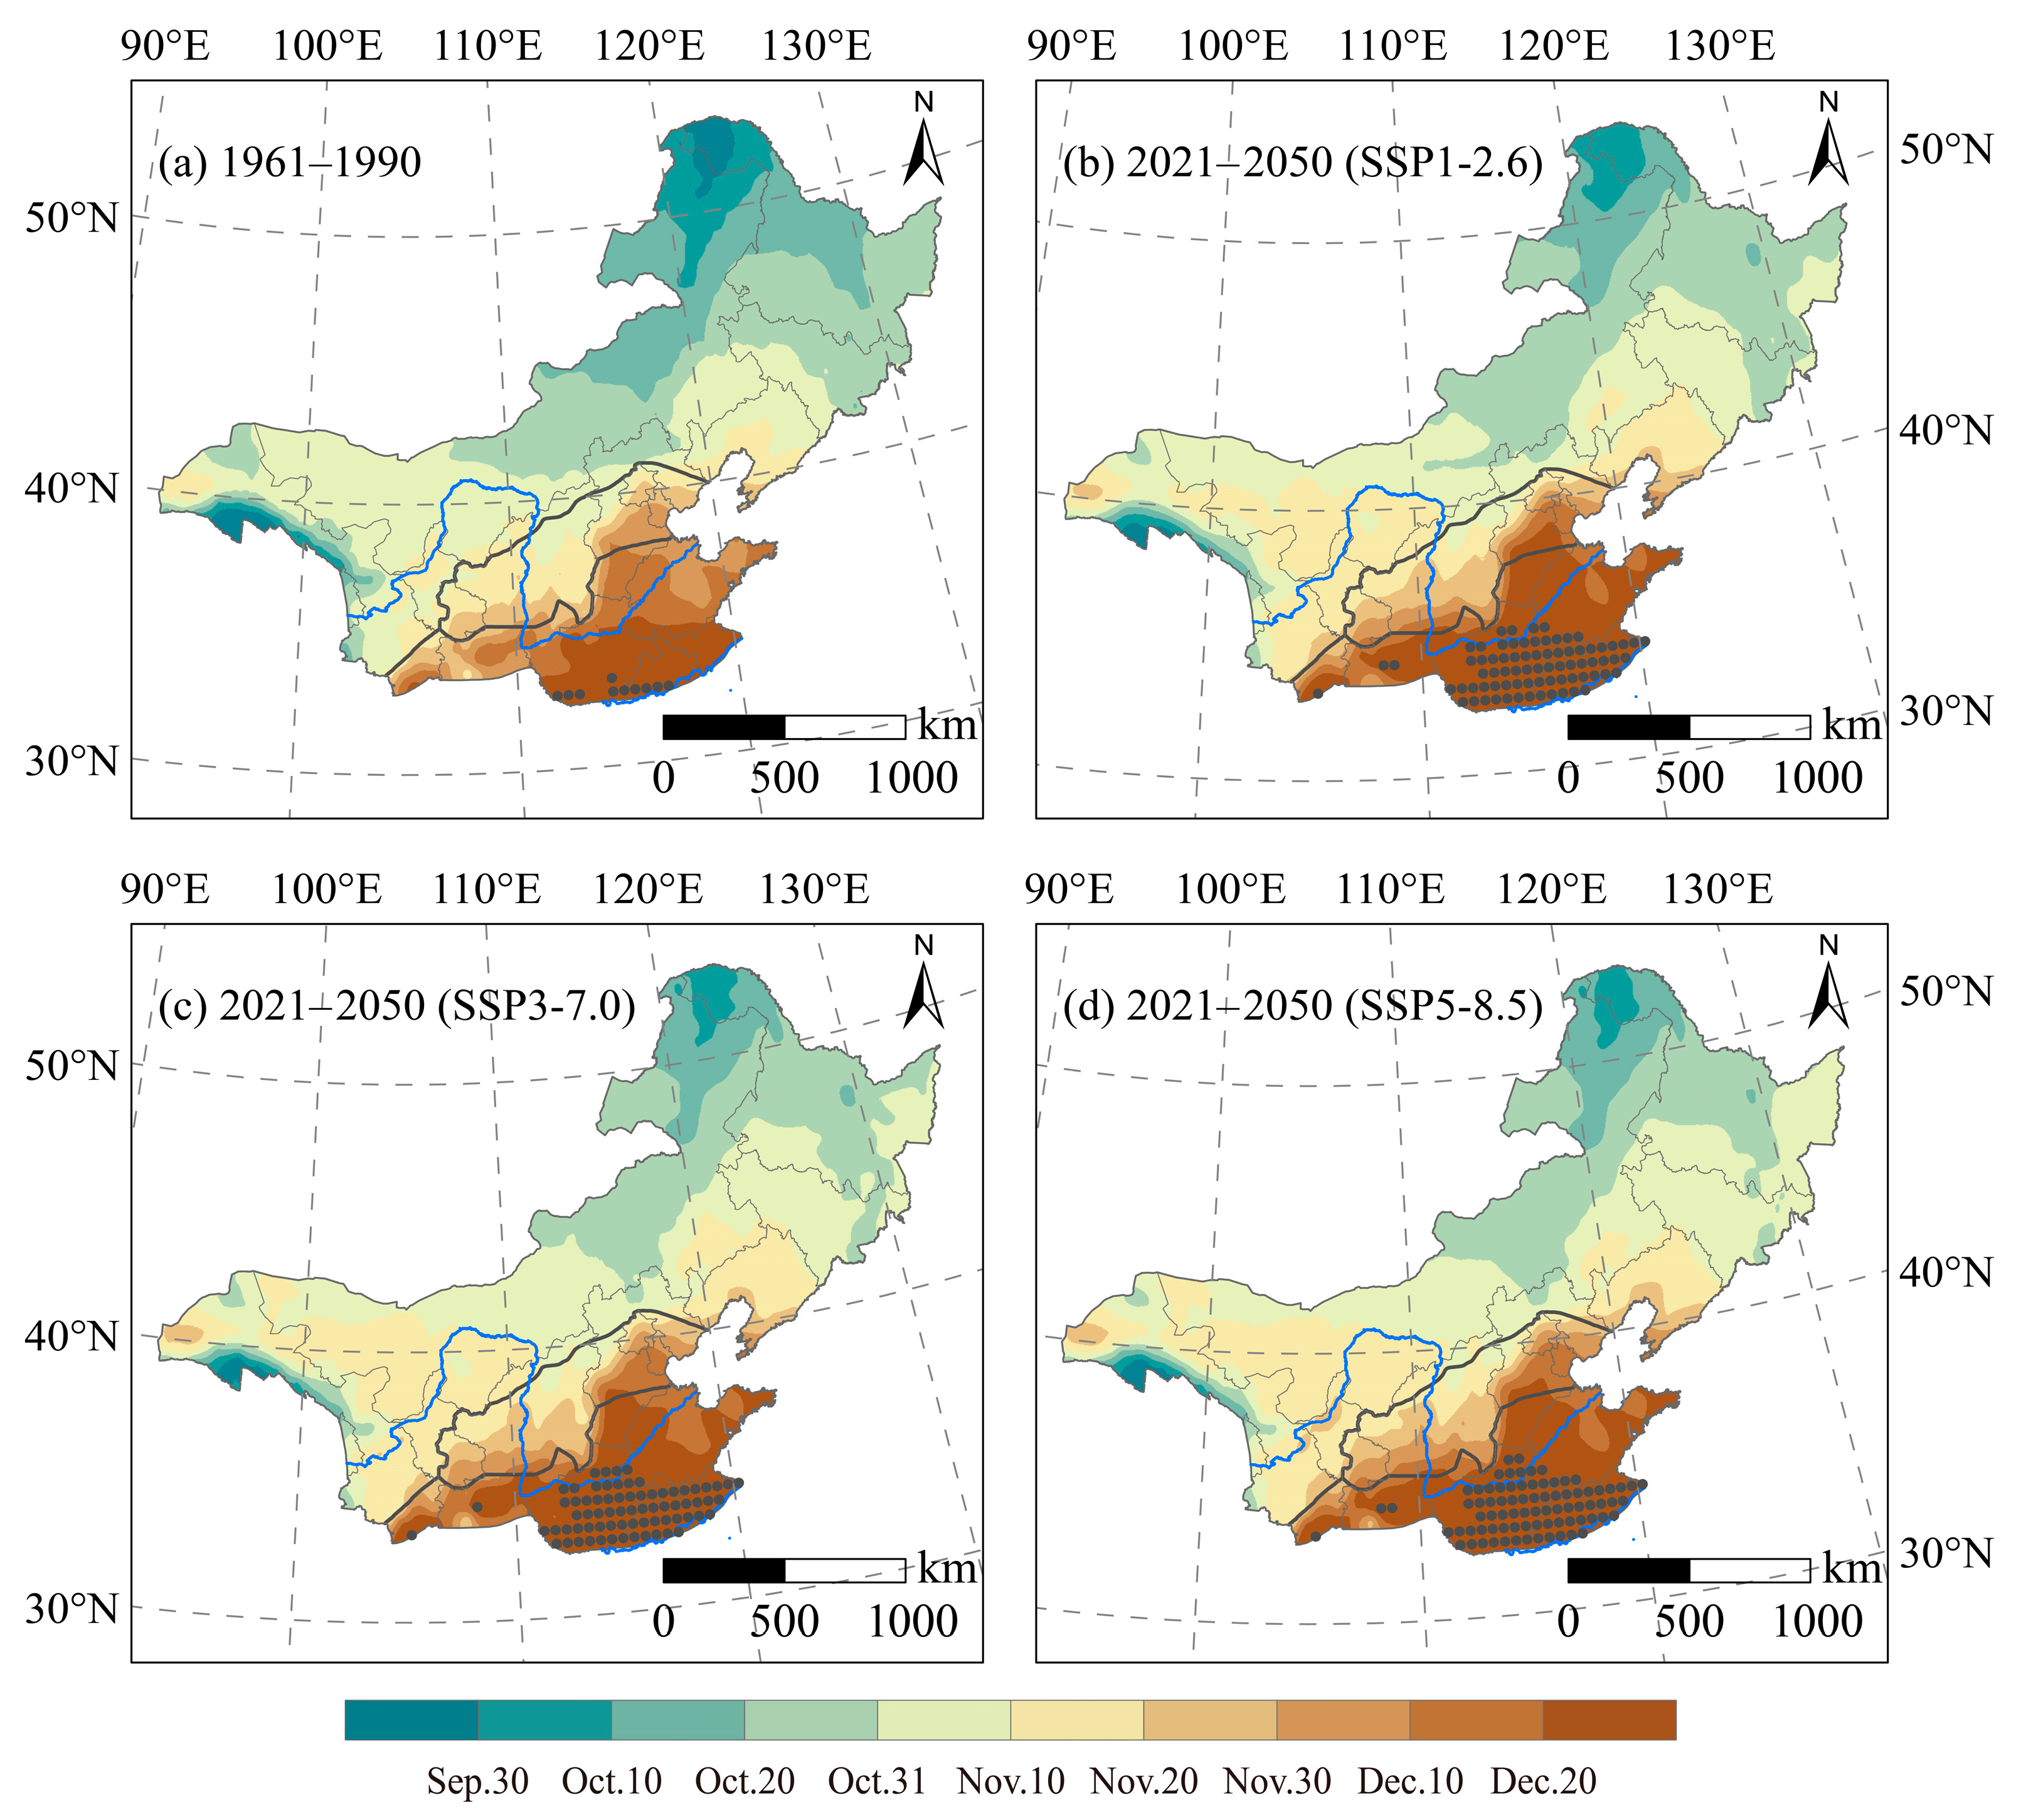
3.2. First Day of the Overwintering Period
3.3. Sowing Date
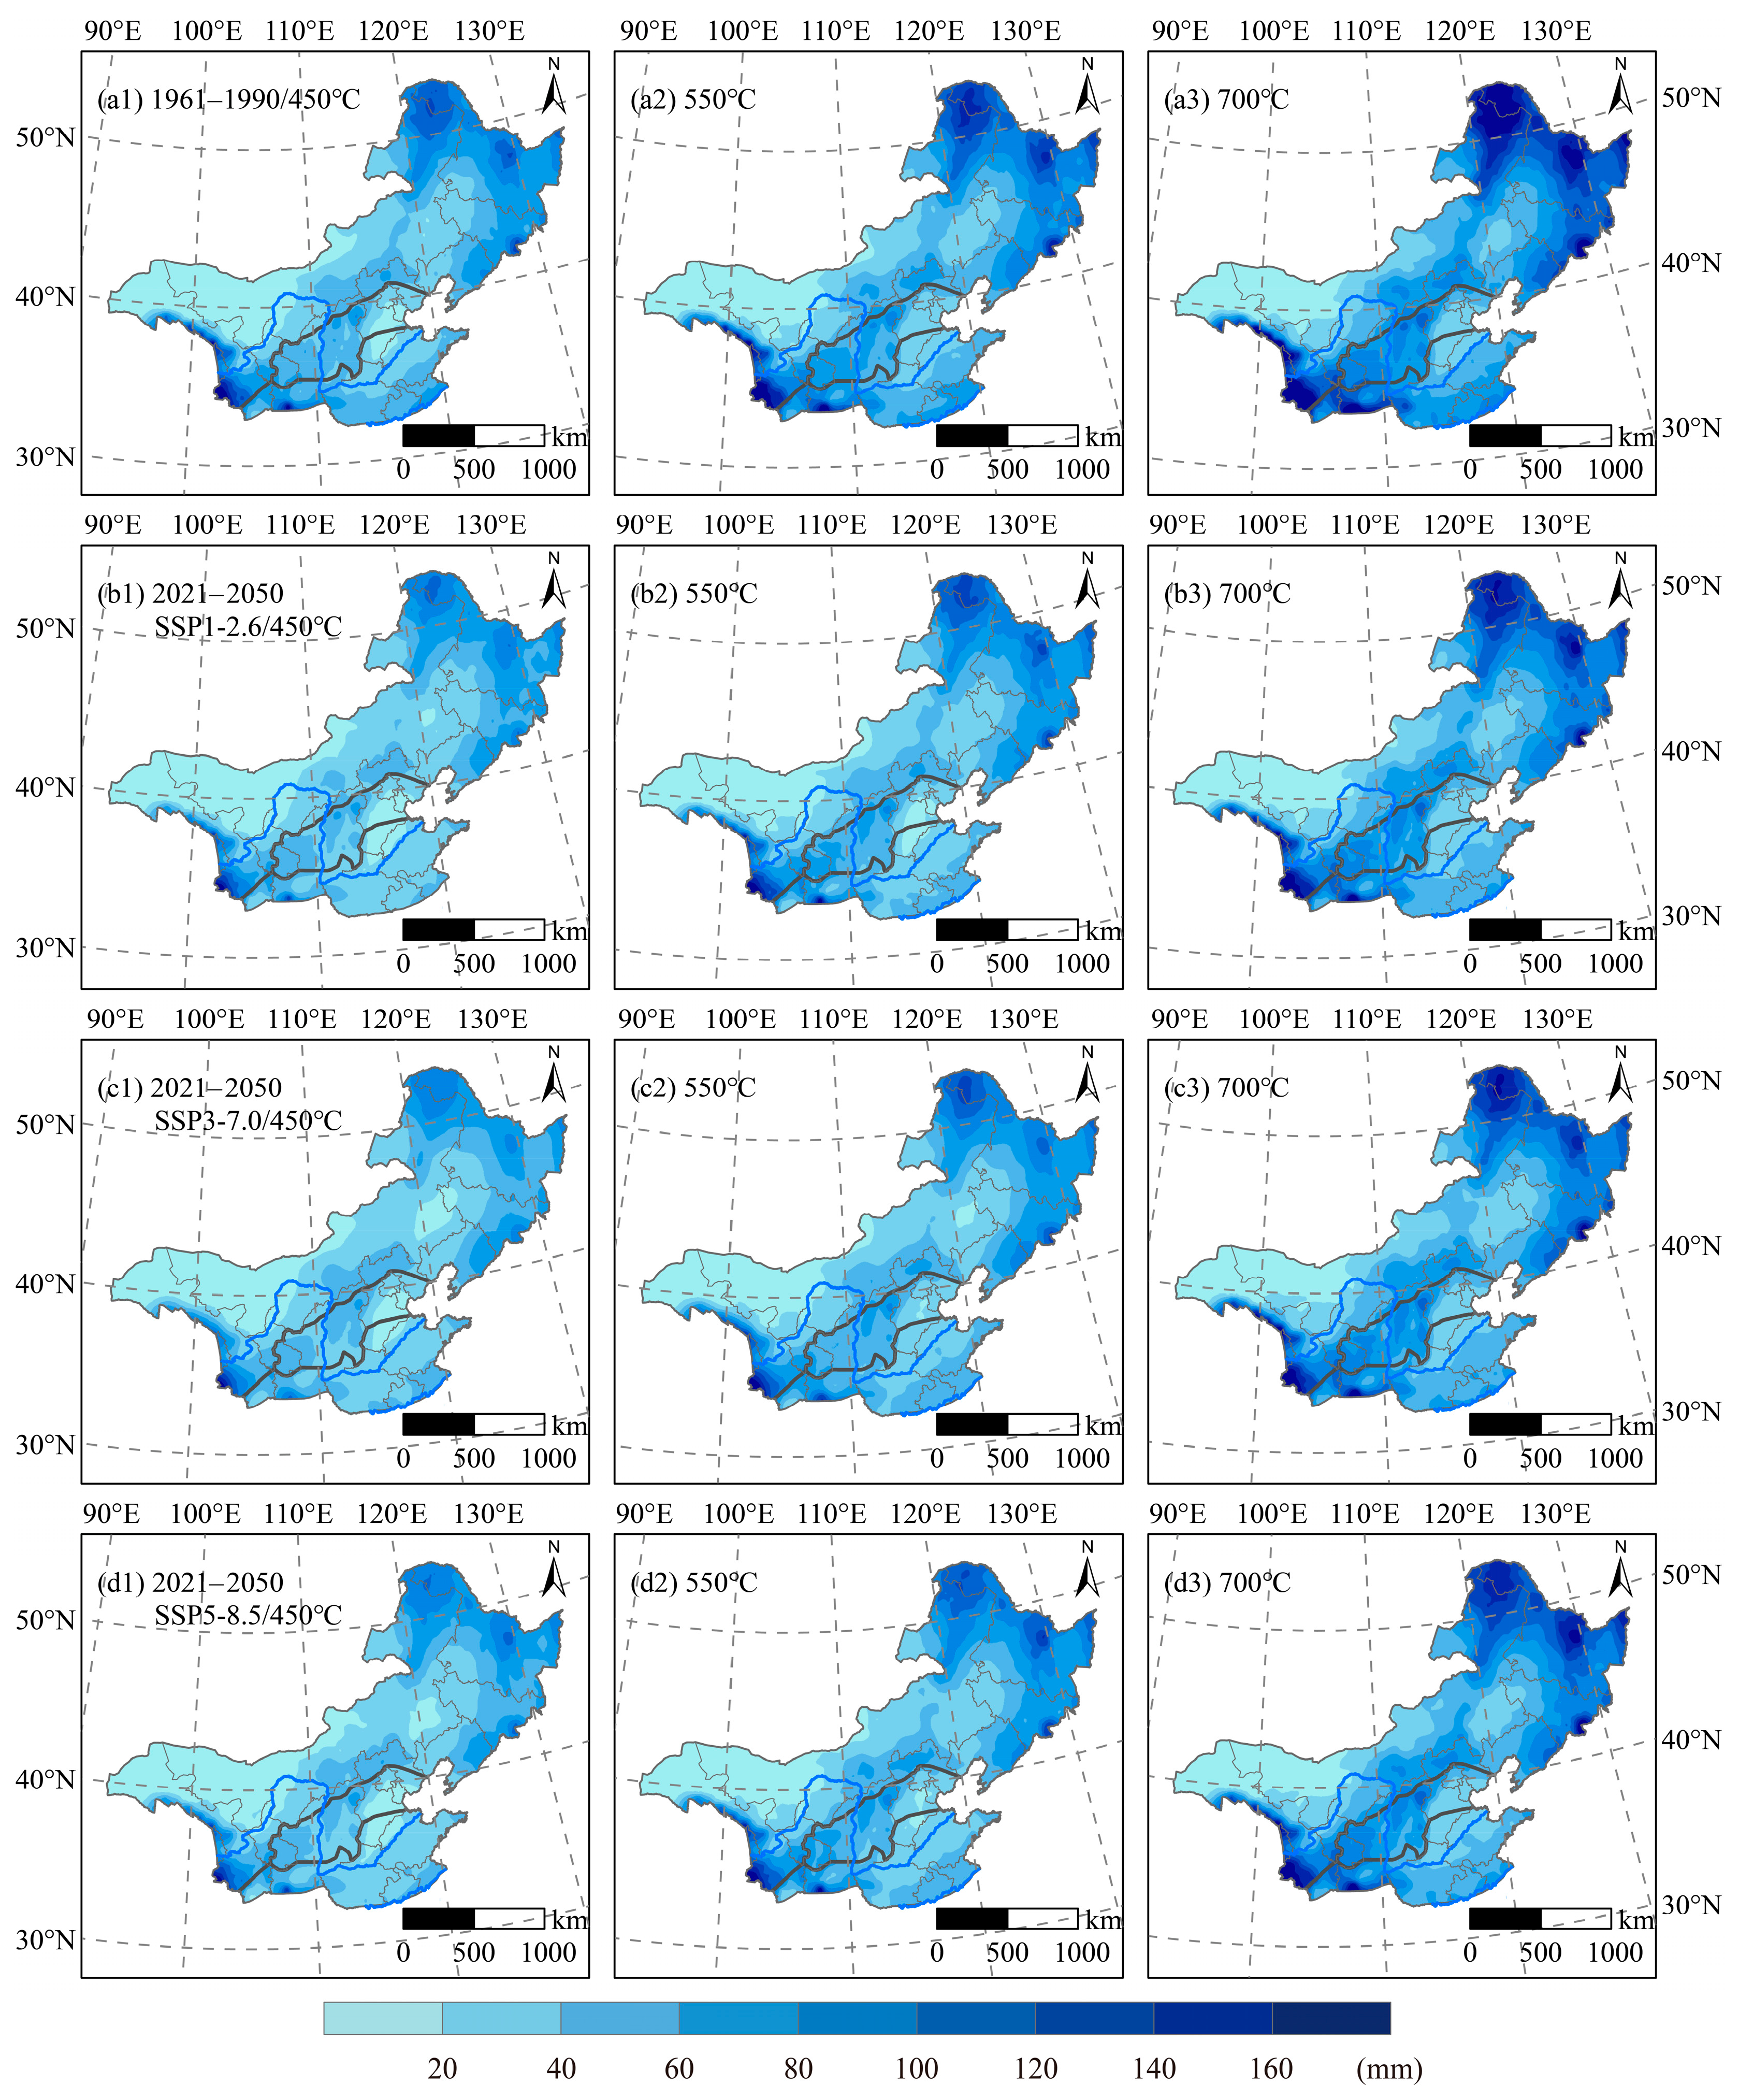
3.4. Precipitation before Winter
3.5. Planting Boundaries under the Different Scenarios
4. Discussion
5. Conclusions
Author Contributions
Funding
Institutional Review Board Statement
Informed Consent Statement
Data Availability Statement
Conflicts of Interest
References
- Shiferaw, B.; Smale, M.; Braun, H.; Duveiller, E.; Reynolds, M.; Muricho, G. Crops that feed the world 10. Past successes and future challenges to the role played by wheat in global food security. Food Secur. 2013, 5, 291–317. [Google Scholar] [CrossRef] [Green Version]
- Shewry, P.; Hey, S. The contribution of wheat to human diet and health. Food Energy Secur. 2015, 4, 178–202. [Google Scholar] [CrossRef] [PubMed]
- Tadesse, W.; Amri, A.; Ogbonnaya, F.C.; Sanchez-Garcia, M.; Sohail, Q.; Baum, M. Genetic and Genomic Resources for Grain Cereals Improvement; National Academic Press: Queensland, Australia, 2016. [Google Scholar] [CrossRef]
- Masson-Delmotte, V.; Zhai, P.; Pirani, A.; Connors, S.L.; Péan, C.; Berger, S.; Caud, N.; Chen, Y.; Goldfarb, L.; Gomis, M.I.; et al. IPCC, 2021. Summary for Policymakers. In Climate Change 2021: The Physical Science Basis. Contribution of Working Group I to the Sixth Assessment Report of the Intergovernmental Panel on Climate Change; Cambridge University Press: Cambridge, UK, 2021. [Google Scholar]
- Rosenberg, N. The increasing CO2 concentration in the atmosphere and its implication on agricultural productivity. II. Effects through CO2-induced climatic change. Clim. Chang. 1982, 4, 239–254. [Google Scholar] [CrossRef]
- Rosenzweig, C. Potential CO2-induced climate effects on North American wheat producing regions. Clim. Chang. 1985, 7, 367–389. [Google Scholar] [CrossRef]
- Kenny, G.; Harrison, P.; Olesen, J.; Parry, M. The effects of climate change on land suitability of grain maize, winter wheat and cauliflower in Europe. Eur. J. Agron. 1993, 2, 325–338. [Google Scholar] [CrossRef]
- Audsley, E.; Pearn, K.; Simota, C.; Cojocaru, G.; Koutsidou, E.; Rounsevell, M.D.A.; Trnka, M.; Alexandrov, V. What can scenario modelling tell us about future European scale agricultural land use, and what not? Environ. Sci. Policy 2006, 9, 148–162. [Google Scholar] [CrossRef] [Green Version]
- Olesen, J.; Carter, T.; Díaz-Ambrona, C.; Fronzek, S.; Heidmann, T.; Hickler, T.; Holt, T.; Minguez, M.I.; Morales, P.; Palutikof, J.; et al. Uncertainties in projected impacts of climate change on European agriculture and terrestrial ecosystems based on scenarios from regional climate models. Clim. Chang. 2007, 81, 123–143. [Google Scholar] [CrossRef]
- Rosenzweig, C.; Parry, M. Potential impacts of climate change on world food supply. Nature 1994, 367, 133–138. [Google Scholar] [CrossRef]
- Balkovic, J.; van der Velde, M.; Skalsky, R.; Xiong, W.; Folberth, C.; Khabarov, N.; Smirnov, A.; Mueller, N.; Obersteiner, M. Global wheat production potentials and management flexibility under the representative concentration pathways. Glob. Planet. Chang. 2014, 122, 107–121. [Google Scholar] [CrossRef] [Green Version]
- United States Department of Agriculture (USDA), World Agricultural Production. Circular Series WAP. 2016, pp. 7–16. Available online: https://downloads.usda.library.cornell.edu/usda-esmis/files/5q47rn72z/6w924c19w/44558d80d/worldag-production-07-12-2016.pdf (accessed on 1 May 2021).
- National Bureau of Statistics of China, National Bureau of Statistics of China. National Data. 2017. Available online: http://data.stats.gov.cn/easyquery.htm?cn=C01 (accessed on 1 May 2021).
- Zhao, G. Study on Chinese wheat planting regionalization. J. Triticeae Crop. 2010, 30, 886–895. (In Chinese) [Google Scholar]
- Sun, J.; Zhou, G.; Sui, X. Climatic suitability of the distribution of the winter wheat cultivation zone in China. Eur. J. Agron. 2012, 43, 77–86. [Google Scholar]
- Vico, G.; Hurry, V.; Weih, M. Snowed in for survival: Quantifying the risk of winter damage to overwintering field crops in northern temperate latitudes. Agric. For. Meteorol. 2014, 197, 65–75. [Google Scholar] [CrossRef]
- Zheng, D.; Yang, X.; Minguez, M.; Mu, C.; He, Q.; Xia, W. Effect of freezing temperature and duration on winter survival and grain yield of winter wheat. Agric. For. Meteorol. 2018, 260, 1–8. [Google Scholar] [CrossRef]
- Guo, W.; Shi, H.; Ma, J.; Zhang, Y.; Wang, J.; Shu, W.; Zhang, Z. Basic Features of Climate Change in North China during 1961–2010. Adv. Clim. Chang. Res. 2013, 4, 73–83. [Google Scholar] [CrossRef]
- Li, Y.; Liang, H.; Wang, P. Effects of Climate Warming on the Planting Boundary and Developmental Stages of Winter Wheat. J. Triticeae Crop. 2013, 33, 382–388. [Google Scholar]
- Li, K.; Yang, X.; Mu, C.; Xu, H.; Chen, F. The possible effects of global warming on cropping system in China VIII-The effects of climate change on planting boundaries of different winter-spring varieties of winter wheat in China. Sci. Agric Sin. 2013, 46, 1583–1594. [Google Scholar]
- Hao, Z.; Geng, X.; Wang, F.; Zheng, J. Impacts of climate change on agrometeorological indices at winter wheat overwintering stage in northern China during 2021–2050. Int. J. Climatol. 2018, 38, 5576–5588. [Google Scholar] [CrossRef]
- Zhang, W.; Brandt, M.; Prishchepov, A.V.; Li, Z.; Lyu, C.; Fensholt, R. Mapping the Dynamics of Winter Wheat in the North China Plain from Dense Landsat Time Series (1999 to 2019). Remote Sens. 2021, 13, 1170. [Google Scholar] [CrossRef]
- Hu, Q.; Ma, X.; Pan, X.; Huang, B. Climate Warming Changed the Planting Boundaries of Varieties of Summer Corn with Different Maturity Levels in the North China Plain. J. Appl. Meteorol. Climatol. 2019, 12, 2605–2615. [Google Scholar] [CrossRef]
- Li, J.; Lei, H. Tracking the spatio-temporal change of planting area of winter wheat-summer maize cropping system in the North China Plain during 2001–2018. Comput. Electron. Agric. 2021, 187, 106222. [Google Scholar] [CrossRef]
- Riahi, K.; Vuuren, D.; Kriegler, E.; Edmonds, J.; O’Neill, B.; Fujimori, S.; Bauer, N.; Calvin, K.; Dellink, R.; Fricko, O.; et al. The Shared Socioeconomic Pathways and their energy, land use, and greenhouse gas emissions implications: An overview. Glob. Environ. Chang. 2017, 42, 153–168. [Google Scholar] [CrossRef] [Green Version]
- O’Neill, B.C.; Tebaldi, C.; Vuuren, D.P.v.; Eyring, V.; Friedlingstein, P.; Hurtt, G.; Knutti, R.; Kriegler, E.; Lamarque, J.-F.; Lowe, J. The scenario model intercomparison project (ScenarioMIP) for CMIP6. Geosci. Model Dev. 2016, 9, 3461–3482. [Google Scholar] [CrossRef] [Green Version]
- Hempel, S.; Frieler, K.; Warszawski, L.; Schewe, J.; Piontek, F. A trend-preserving bias correction—The ISI-MIP approach. Earth Syst. Dyn. 2013, 4, 219–236. [Google Scholar] [CrossRef] [Green Version]
- Cooperative Agricultural and Forest Crop Regionalization Group in China. Agricultural and Forest Crop Climate Regionalization in China; China Meteorological Press: Beijing, China, 1987. (In Chinese) [Google Scholar]
- Jin, S. Wheat Science in China; China Agriculture Press: Beijing, China, 1996. (In Chinese) [Google Scholar]
- Wang, S. A statistical method for the first and last date with the daily temperature steadily passing through the threshold. Meteorol. Mon. 1982, 8, 29–30. (In Chinese) [Google Scholar]
- Cui, Y.; Han, J.; Cao, G.; Jiang, M.; Zhang, J. Effect of per-winter positive accumulated temperature on suitable planting dates of winter wheat in south centre area of Hebei. Chin. Sci. Bull. 2008, 24, 195–198. (In Chinese) [Google Scholar]
- Hao, Z.; Zheng, J.; Tao, X. A study on northern boundary of winter wheat during climate warming: A case study in Liaoning Province. Prog. Geogr. 2001, 20, 254–261. (In Chinese) [Google Scholar]
- Gao, J.; Yang, X.; Zheng, B.; Liu, Z.; Zhao, J.; Sun, S.; Li, K.; Dong, C. Effects of climate change on the extension of the potential double cropping region and crop water requirements in Northern China. Agric. For. Meteorol. 2019, 268, 146–155. [Google Scholar] [CrossRef]
- Yang, G.; Li, S.; Wang, H.; Wang, L. Study on agricultural cultivation development layout based on the matching characteristic of water and land resources in North China Plain. Agric. Water Manag. 2022, 259, 107272. [Google Scholar] [CrossRef]
- Zou, L.; Zhang, J.; Jiang, Q.; Qing, Z.; Wang, G.; Zhao, H. Research and development of winter wheat growing in northern region. Chin. J. Agrometeorol. 2001, 22, 54–58. (In Chinese) [Google Scholar]
- Xiao, D.; Tao, F.; Liu, Y.; Shi, W.; Wang, M.; Liu, G.; Zhang, S.; Zhu, Z. Observed changes in winter wheat phenology in the North China Plain for 1981–2009. Int. J. Biometeorol. 2013, 57, 275–285. [Google Scholar] [CrossRef] [PubMed]
- Liu, Y.; Chen, Q.; Ge, Q.; Dai, J. Spatiotemporal differentiation of changes in wheat phenology in China under climate change from 1981 to 2010. Sci. China Earth Sci. 2018, 61, 1088–1097. [Google Scholar] [CrossRef]
- Wang, D.; Zeng, Y.; Mou, Y.; Yu, J.; Cang, J. Research on antifreeze proteins of Dongnongdongmai 1 in high–cold area. J. Triticeae Crop. 2009, 29, 823–826. (In Chinese) [Google Scholar]


Publisher’s Note: MDPI stays neutral with regard to jurisdictional claims in published maps and institutional affiliations. |
© 2022 by the authors. Licensee MDPI, Basel, Switzerland. This article is an open access article distributed under the terms and conditions of the Creative Commons Attribution (CC BY) license (https://creativecommons.org/licenses/by/4.0/).
Share and Cite
Wu, M.; Xu, Y.; Zheng, J.; Hao, Z. North Expansion of Winter Wheat Planting Area in China under Different Emissions Scenarios. Agriculture 2022, 12, 763. https://doi.org/10.3390/agriculture12060763
Wu M, Xu Y, Zheng J, Hao Z. North Expansion of Winter Wheat Planting Area in China under Different Emissions Scenarios. Agriculture. 2022; 12(6):763. https://doi.org/10.3390/agriculture12060763
Chicago/Turabian StyleWu, Maowei, Yang Xu, Jingyun Zheng, and Zhixin Hao. 2022. "North Expansion of Winter Wheat Planting Area in China under Different Emissions Scenarios" Agriculture 12, no. 6: 763. https://doi.org/10.3390/agriculture12060763
APA StyleWu, M., Xu, Y., Zheng, J., & Hao, Z. (2022). North Expansion of Winter Wheat Planting Area in China under Different Emissions Scenarios. Agriculture, 12(6), 763. https://doi.org/10.3390/agriculture12060763