Article

Effects of Climate Warming on the Potential Northern Planting Boundaries of Three Main Grain Crops in China

1
State Key Laboratory of Sever Weather, Chinese Academy of Meteorological Sciences, Beijing 100081, China
2
Collaborative Innovation Centre on Forecast and Evaluation of Meteorological Disasters, Nanjing University of Information Science and Technology, Nanjing 210044, China
3
Beijing Penta Color Gold Soil Information & Technology Co., Ltd., Beijing 100193, China
4
School of Geography and Earth Sciences, McMaster University, Hamilton, ON L8S 4L8, Canada
*
Author to whom correspondence should be addressed.
Agriculture 2022, 12(6), 746; https://doi.org/10.3390/agriculture12060746
Submission received: 11 April 2022 / Revised: 9 May 2022 / Accepted: 20 May 2022 / Published: 25 May 2022

Abstract

:
The production of wheat, maize and rice accounts for more than 90% of the total grain production of China. Assessing the impact of climate warming on suitable planting regions, especially the potential northern planting boundaries of these crops, is therefore critical to help guide agricultural policymaking and further maintain food security. In this study, we analyzed the effect of climate warming on the potential northern planting boundaries of three specific crops (winter wheat, spring maize, double and triple rice cropping systems) during two time periods (1961–1990 and 1991–2020) using meteorological data from 2437 national weather stations. Results show that the potential planting boundaries of these crops present a northward movement and a westward expansion during the time period of 1991–2020 under the background of temperature increase compared with the time period of 1961–1990. Moreover, the boundaries of winter wheat and spring maize also show a trend of expansion to high-altitude areas (e.g., the Qinghai–Tibet Plateau). The average moving distance of these crops ranged from 20 km to 300 km. In general, the potential planting boundaries of winter wheat, spring maize, double and triple rice cropping systems changed significantly due to climate warming, and the suitable planting area was increased. Our study aims to provide a more recent and accurate result than those of previous studies, which is expected to strengthen our understanding of the effect of climate change on the potential northern planting boundaries of the three main grain crops in China.

1. Introduction

World food security faces severe challenges under the background of climate change. According to the Sixth IPCC Assessment Report, climate change is already affecting every region of the earth in many ways, and the changes we experience will intensify with global warming [1]. Climate change can directly affect the crop growth environments (e.g., temperature, water and light) [2], and the crop planting areas are extremely sensitive to climate change, especially temperature increase [3]. Since the 1960s, the annual average temperature of China has risen by 1.22–1.66 °C with global climate change, which may have a significant effect on crop planting regions in China, the world’s largest developing economy [4,5,6]. Therefore, accurate information about the suitable crop planting regions especially northern planting boundaries under climate change, is of great importance to ensure food security and formulate sound agricultural policies.
Temperature is a key factor in crop growth and development [7,8,9]. The increase in temperature will make some areas that were not suitable for planting crops due to the lack of heat resources become potential planting regions, thus causing planting boundaries to move. China is a sensitive area that is significantly impacted by global climate change, and the heating rate has been significantly higher than the global average level in the same period since 1950s [10]. It should be noted that, although, many researchers have outlined the northern boundaries of different crops in China under climate change, most of them have only used climate data before 2010. However, the latest Blue Book on Climate Change in China reported that 2011–2020 was the warmest decade since 1850, and 2020 was the warmest year in Asia since 20th century [11]. Consequently, it is necessary to update the potential northern boundaries of different crops in China, especially considering the climatic conditions in last ten years.
The northern planting boundaries of various crops have been delineated by previous studies, and the effect of climate change on these boundaries has also been analyzed. Yang et al. compared the planting limits of winter wheat during 1950s–1980 and 1981–2007 [12]. They found that the planting limits moved to north and west about 20 km to 200 km in China. Liu et al. analyzed the effects of past climate change on the northern limits of maize planting in Northeast China, and results showed that temperature increase led to a northward expansion of the northern limits of maize, which allowed these areas to be planted with new cultivars that have a longer growing season [13]. Research conducted by Ye et al. showed that in the context of climate warming, the northern planting boundaries for rice cropping systems in China moved northward and extended westward [14]. Sun et al. used the CMIP5 (Coupled Model Intercomparison Project Phase 5) historical simulation test (1850–2005) to simulate the historical climate evolution process, and used the Representative Concentration Pathway 4.5 (RCP4.5) to present the future climate change. They then analyzed the planting boundaries of winter wheat in China [2]. Results showed that the northern planting boundaries of winter wheat in China will likely move northward and expand westward in the future.
However, most of these studies only used meteorological data from about 600 national basic weather stations of China to present the results, which may cause large uncertainties at the national scale when using fewer meteorological data to determine suitable planting areas of crops in China. As shown in Figure 1, there were only less than 500 national weather stations in the early 1950s, and the number of stations increased to more than 2000 in the 1960s. The red color represents the amount range (500–700) of weather stations that most previous studies used, which is much less than the existing national weather stations. Therefore, it is better to consider more weather stations for a more accurate result when analyzing the effect of climate change on the potential planting boundaries at the national scale.
In summary, the objectives of this study are to (1) analyze the climate change effect on crop northern planting boundaries and update the time period to 1961-2020 to include the latest ten years; (2) determine the northern planting boundaries of three main grain crops (winter wheat, spring maize, and rice) in China based on their own growth criteria; (3) compare and analyze the changes of the northern planting boundaries between the first 30 years (1961–1990) and the last 30 years (1991–2020); and (4) present a more accurate and real-time information about the northern planting boundary changes of three main grain crops by integrating more weather stations (the 2437 national weather stations in China).

2. Materials and Methods

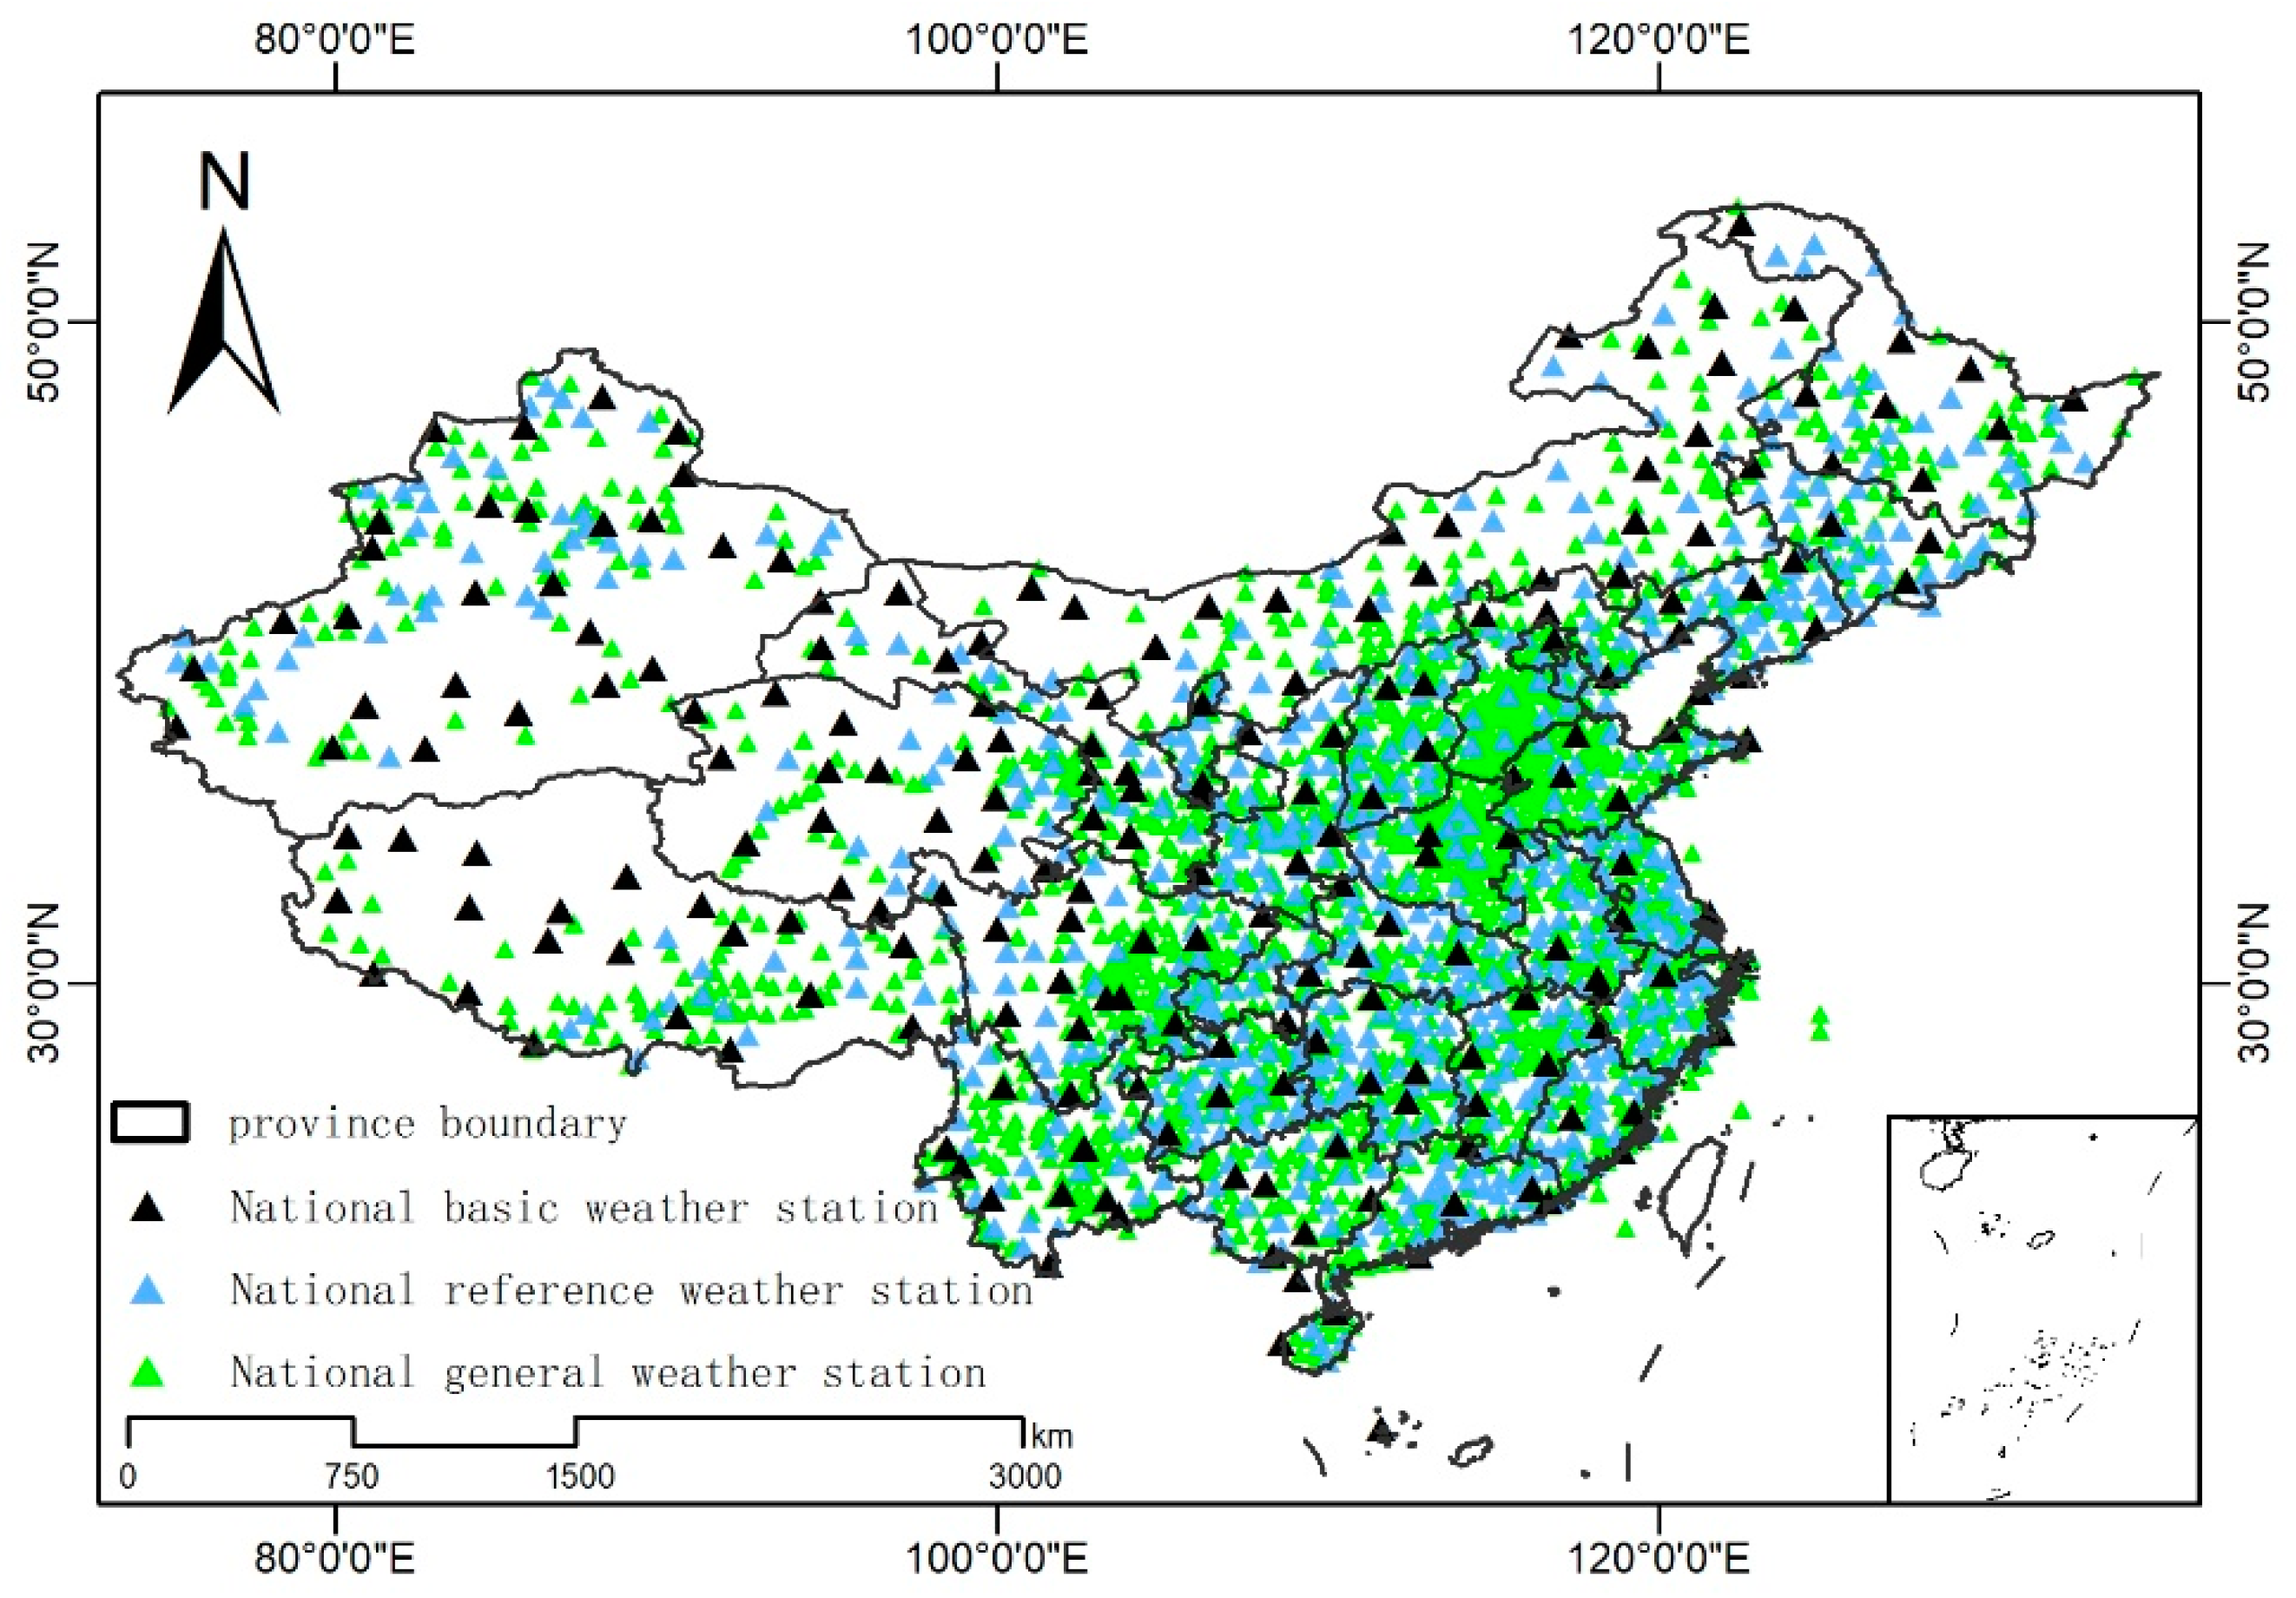
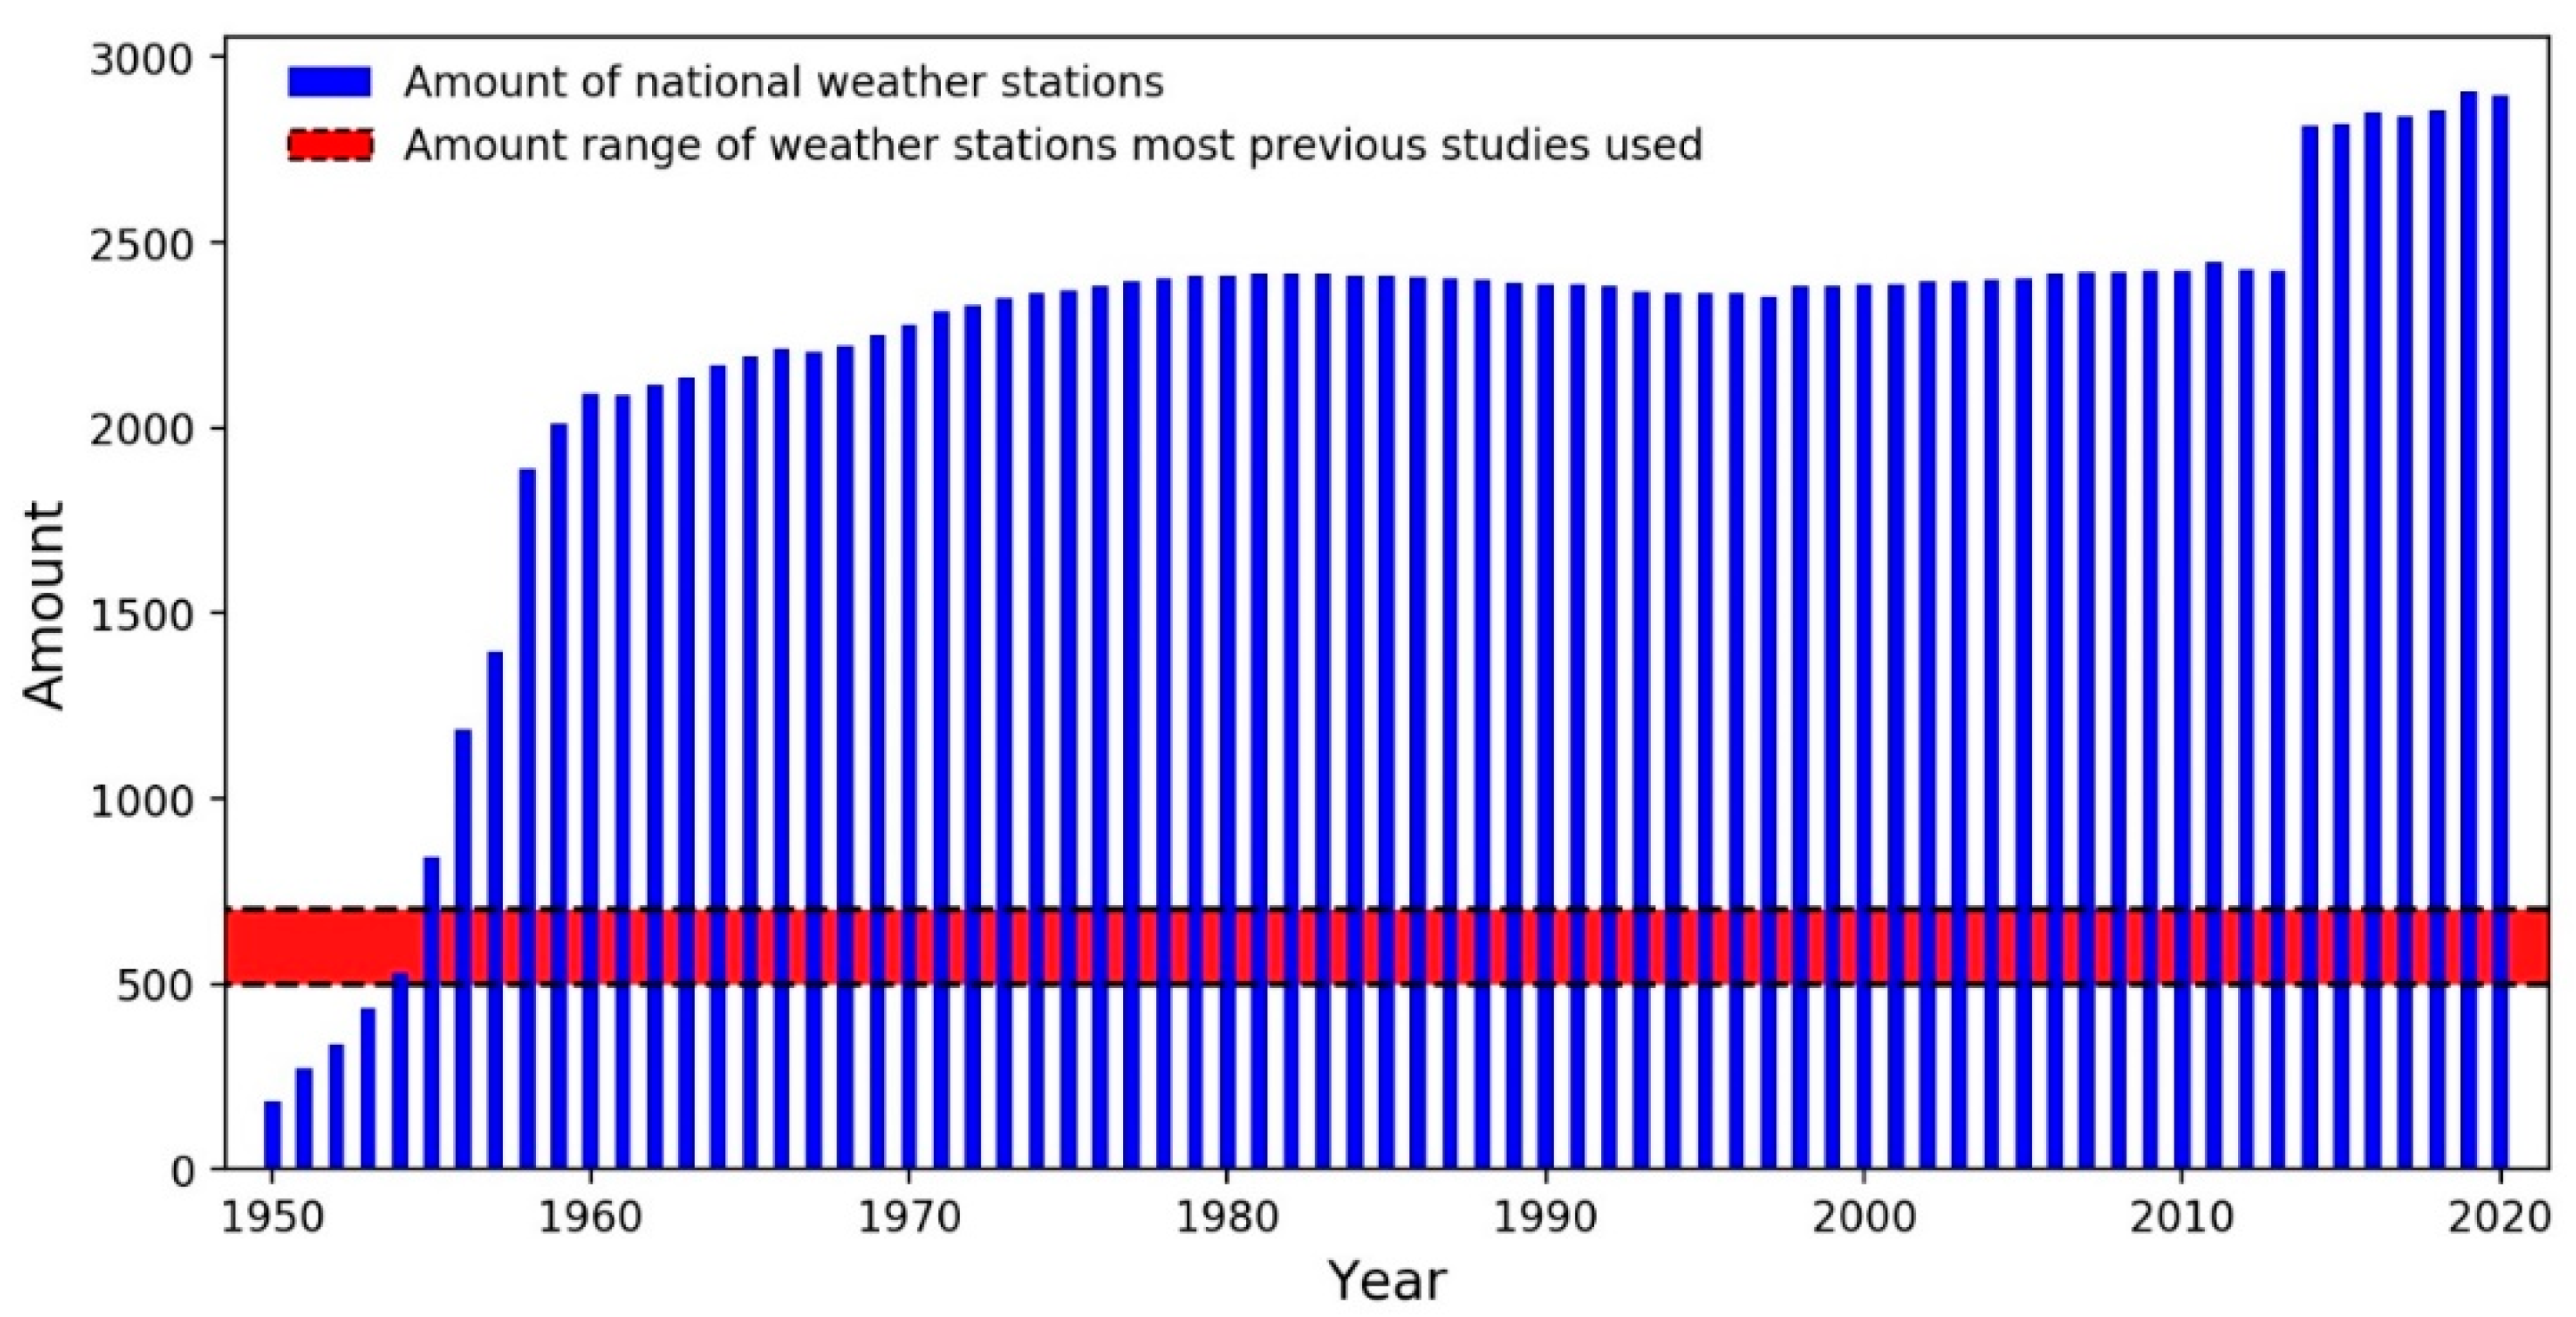
2.1. Study Area and Meteorological Datasets

The study area is the mainland of China with an area of 9.6 × 10⁷ km2 (Figure 2). The meteorological data were obtained from the China Meteorological Administration climate data sharing service system (http://data.cma.cn/ accessed on 1 May 2021), which contains historical daily weather measurements taken by weather stations. In this study, we obtained meteorological data, including daily maximum temperature, daily minimum temperature and daily mean temperature, for the time period of 1961–2020 from 2437 weather stations by rejecting some relocated stations. The locations of these weather stations are shown in Figure 2.

2.2. Determination of the Northern Boundaries of Three Main Grain Crops

The base temperature (Tb) means the minimum cardinal temperature required for crop germination [15]. As the Tb obtained from different experiments or different literature sources fluctuates greatly [16,17,18], we set the most commonly used 0 °C as the Tb of winter wheat and 10 °C as the Tb of maize and rice in this study. The northern boundary of winter wheat was determined refer to the previous studies conducted by the China Crop Climatic Division Cooperation Group [19], Cui et al. [20], Liu and Han [21]. There are two criteria for winter wheat northern boundary determination: (1) the mean minimum temperature in the coldest month should be above −15 °C, and (2) the extreme minimum temperature, which is the lowest daily minimum temperature in a year, should be between −24–−22 °C. The northern boundary of spring maize was determined according to previous studies [22,23] that accumulated temperature (where daily mean temperature should be greater than or equal to 10 °C) needs to be greater than 2100 °C d. The northern boundaries of double and triple rice cropping systems were determined using the safely-planting northern limits index proposed by the National Agricultural Zoning Committee [24], which were accumulated temperature (where daily mean temperature should be greater than or equal to 10 °C) meeting 5300 °C d and 7000 °C d, respectively. A summary of the determination indices of three main grain crops in China are shown in Table 1.
The accumulated temperature (where daily mean temperature should be greater than or equal to 10 °C) was calculated according to the 5-day moving average method [13,25]. For each weather station during each year, the daily mean temperature was accumulated for a time period when daily mean temperature was steadily above 10 °C. The starting date (or the ending date) of this period is defined as the first day (or the last day) after (or before) which all 5-day moving average temperatures were above 10 °C. Moreover, large uncertainty may be caused if the average value of the multi-year temperature is directly used to characterize the northern planting boundaries. We, therefore, used the experienced frequency method to calculate the accumulated temperature, the extreme minimum temperature and the mean minimum temperature in the coldest month with 80% guarantee rate during two time periods (1961–1991 and 1991–2020) for each weather station [12,25].
The calculated accumulated temperature, extreme minimum temperature and mean minimum temperature in the coldest month with 80% guarantee rate of 2437 weather stations were interpolated to a raster dataset using the Inverse Distance Weight (IDW) method in ArcGIS software, and the cell size of these output raster were all set to 0.01°. The contour was then generated using the contour tool in the spatial analysis module of ArcGIS, and the contour intervals of the accumulated temperature, extreme minimum temperature and mean minimum temperature were set to 100 °C, 2 °C and 5 °C, respectively. Finally, the corresponding northern planting boundaries of three main grain crops was extracted according to the northern planting boundary requirements, and the spatial displacement of the first 30-year (1961–1990) boundary and the last 30-year (1991–2020) boundary was measured.

3. Results

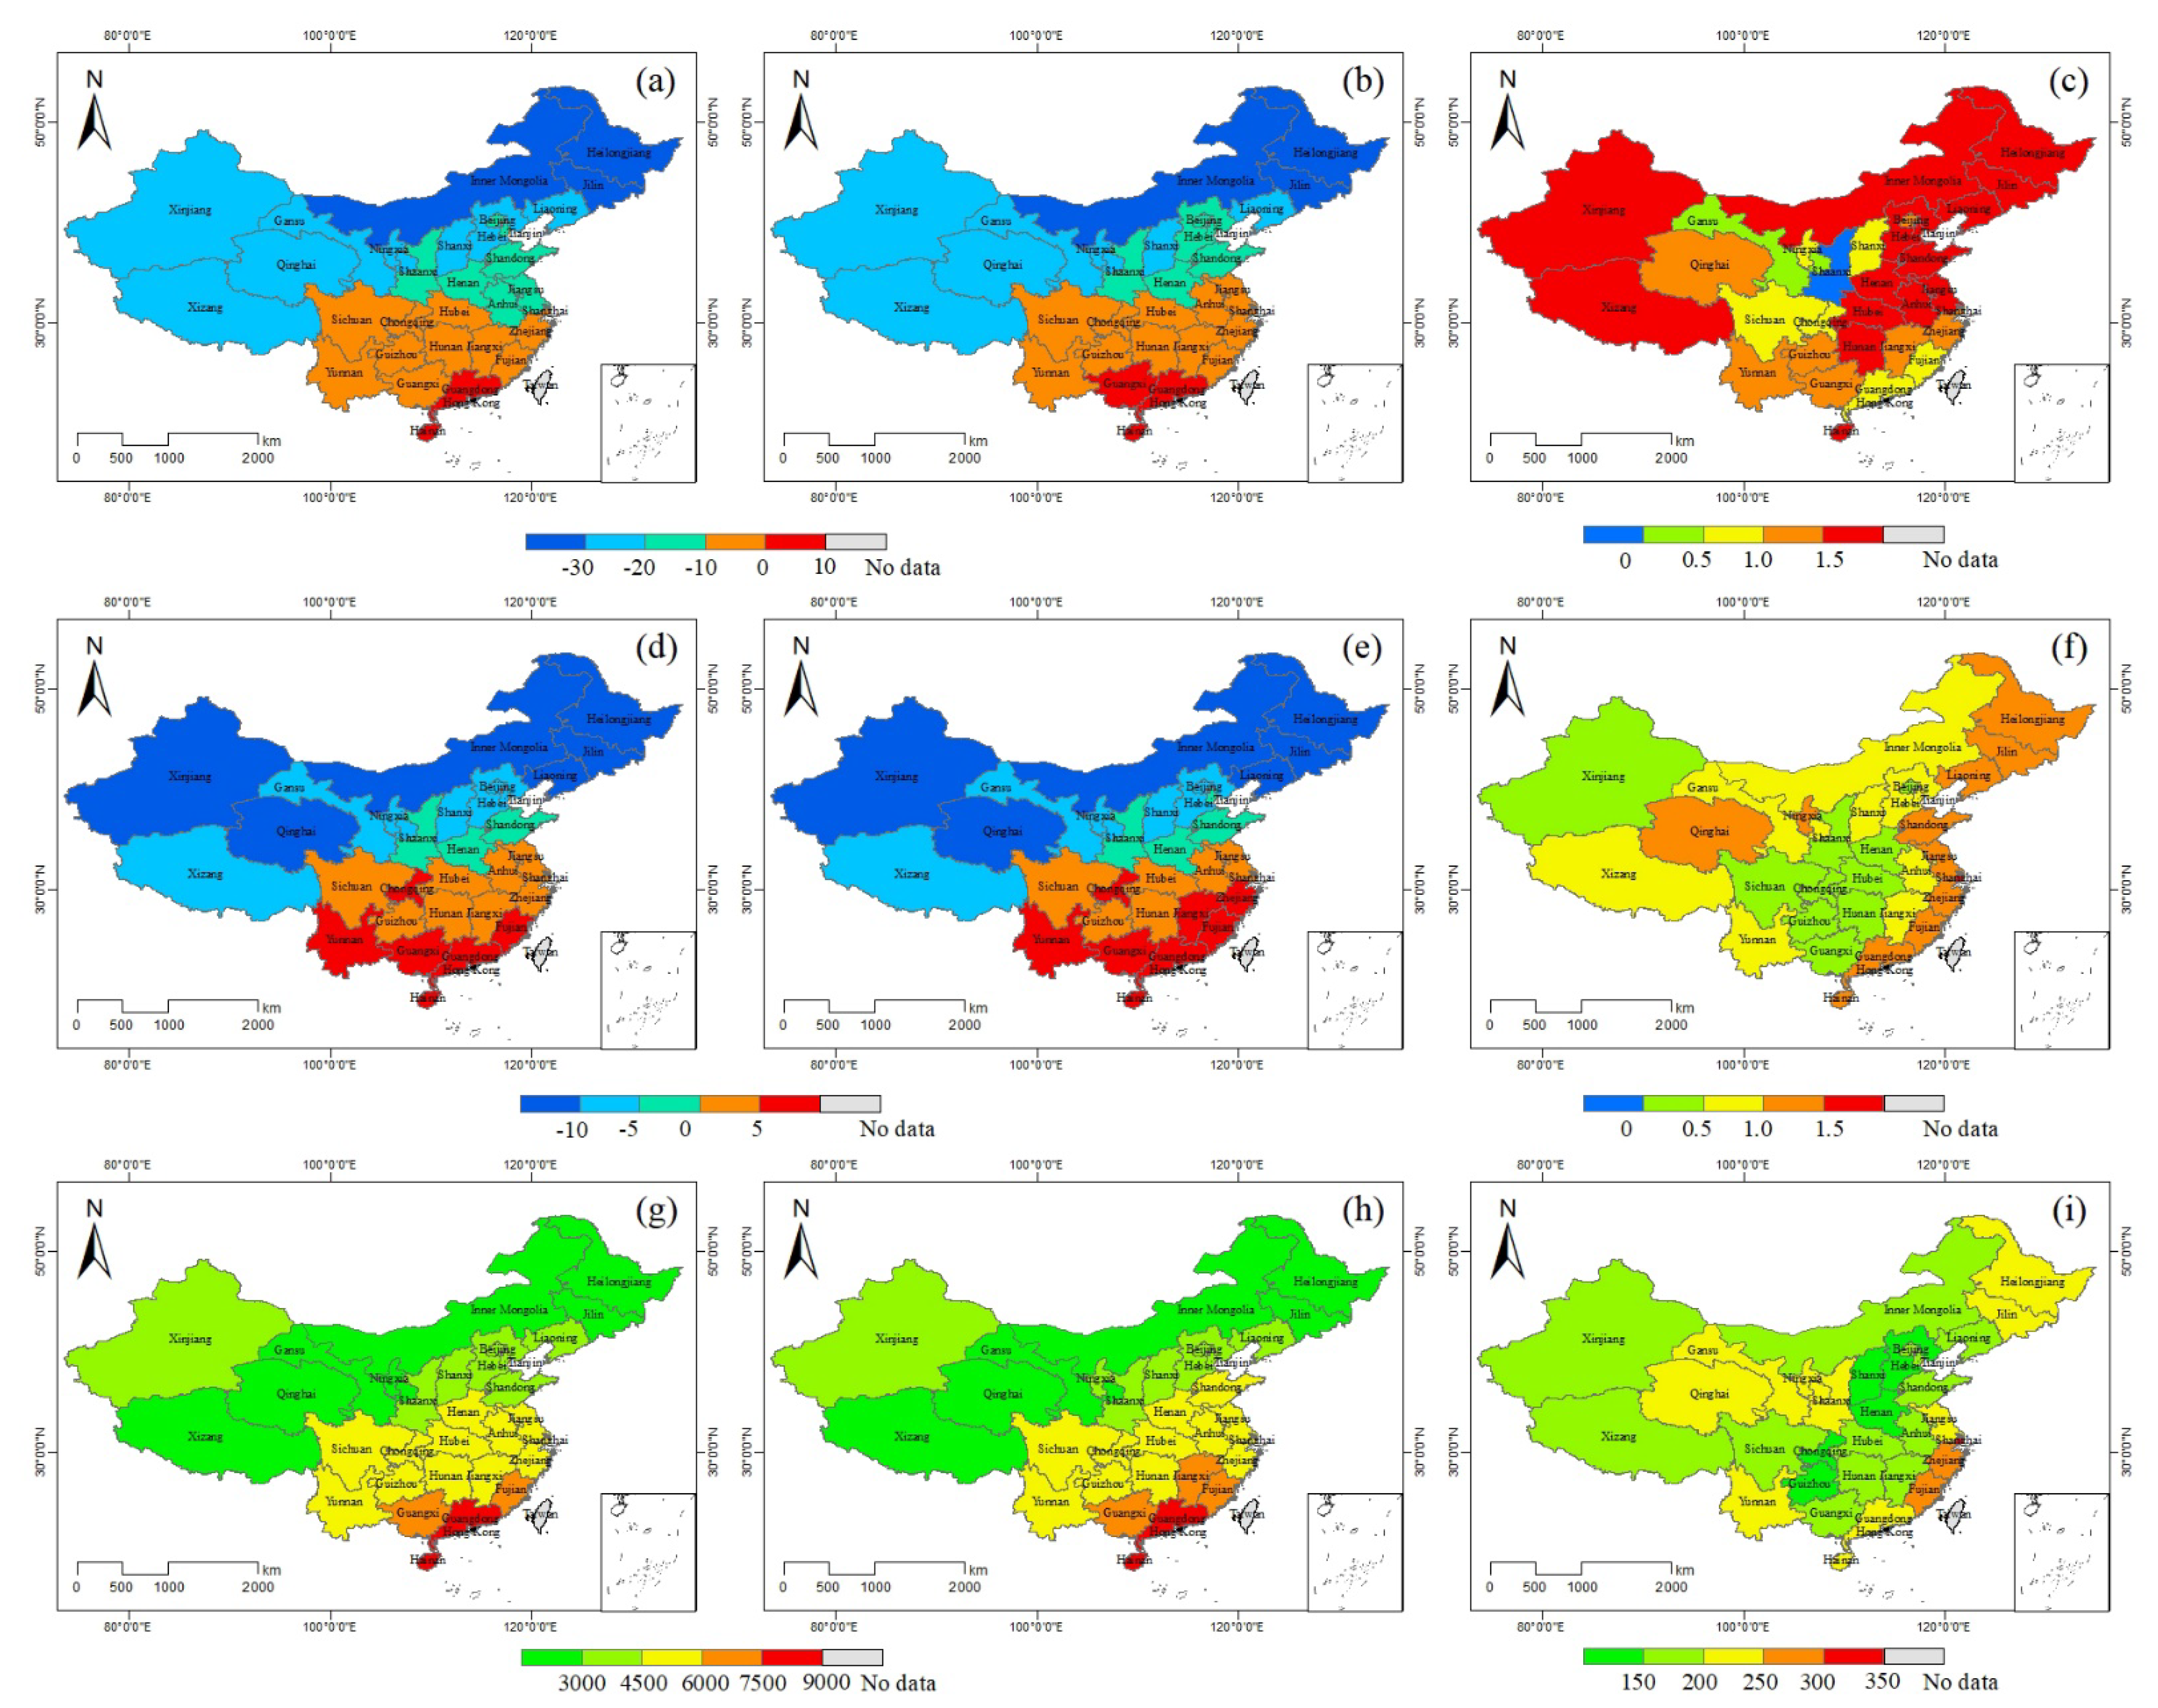
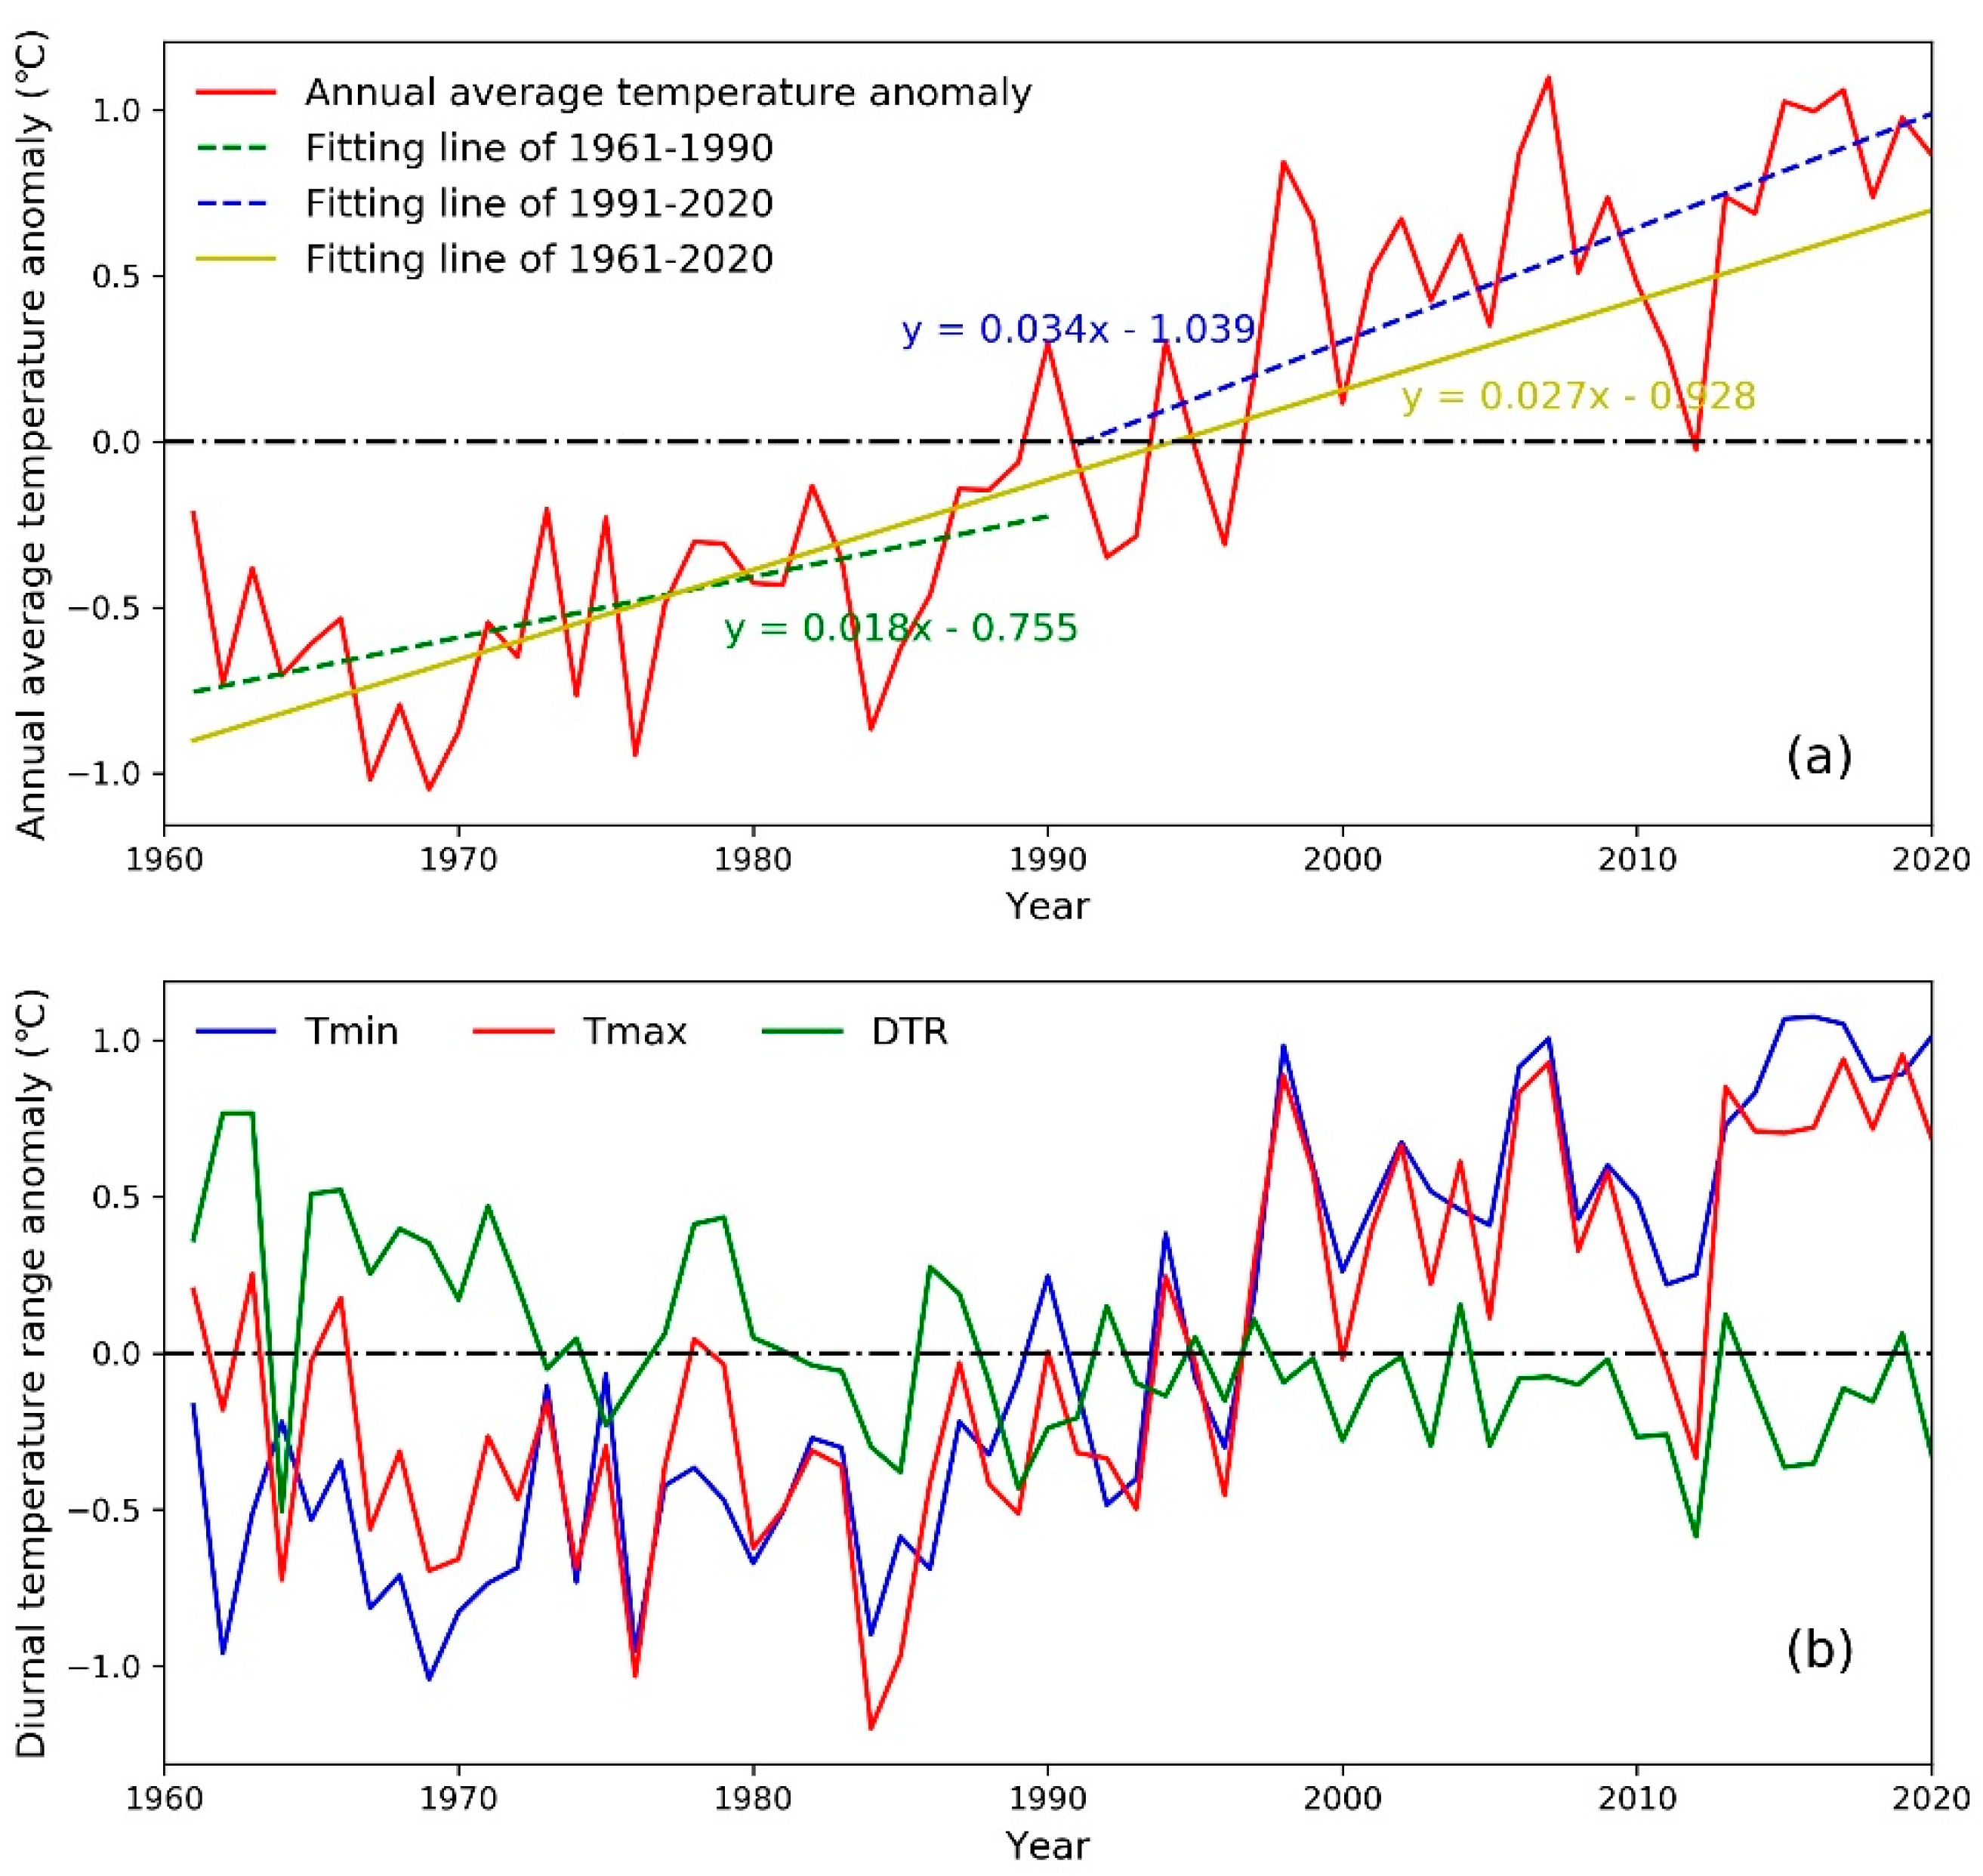
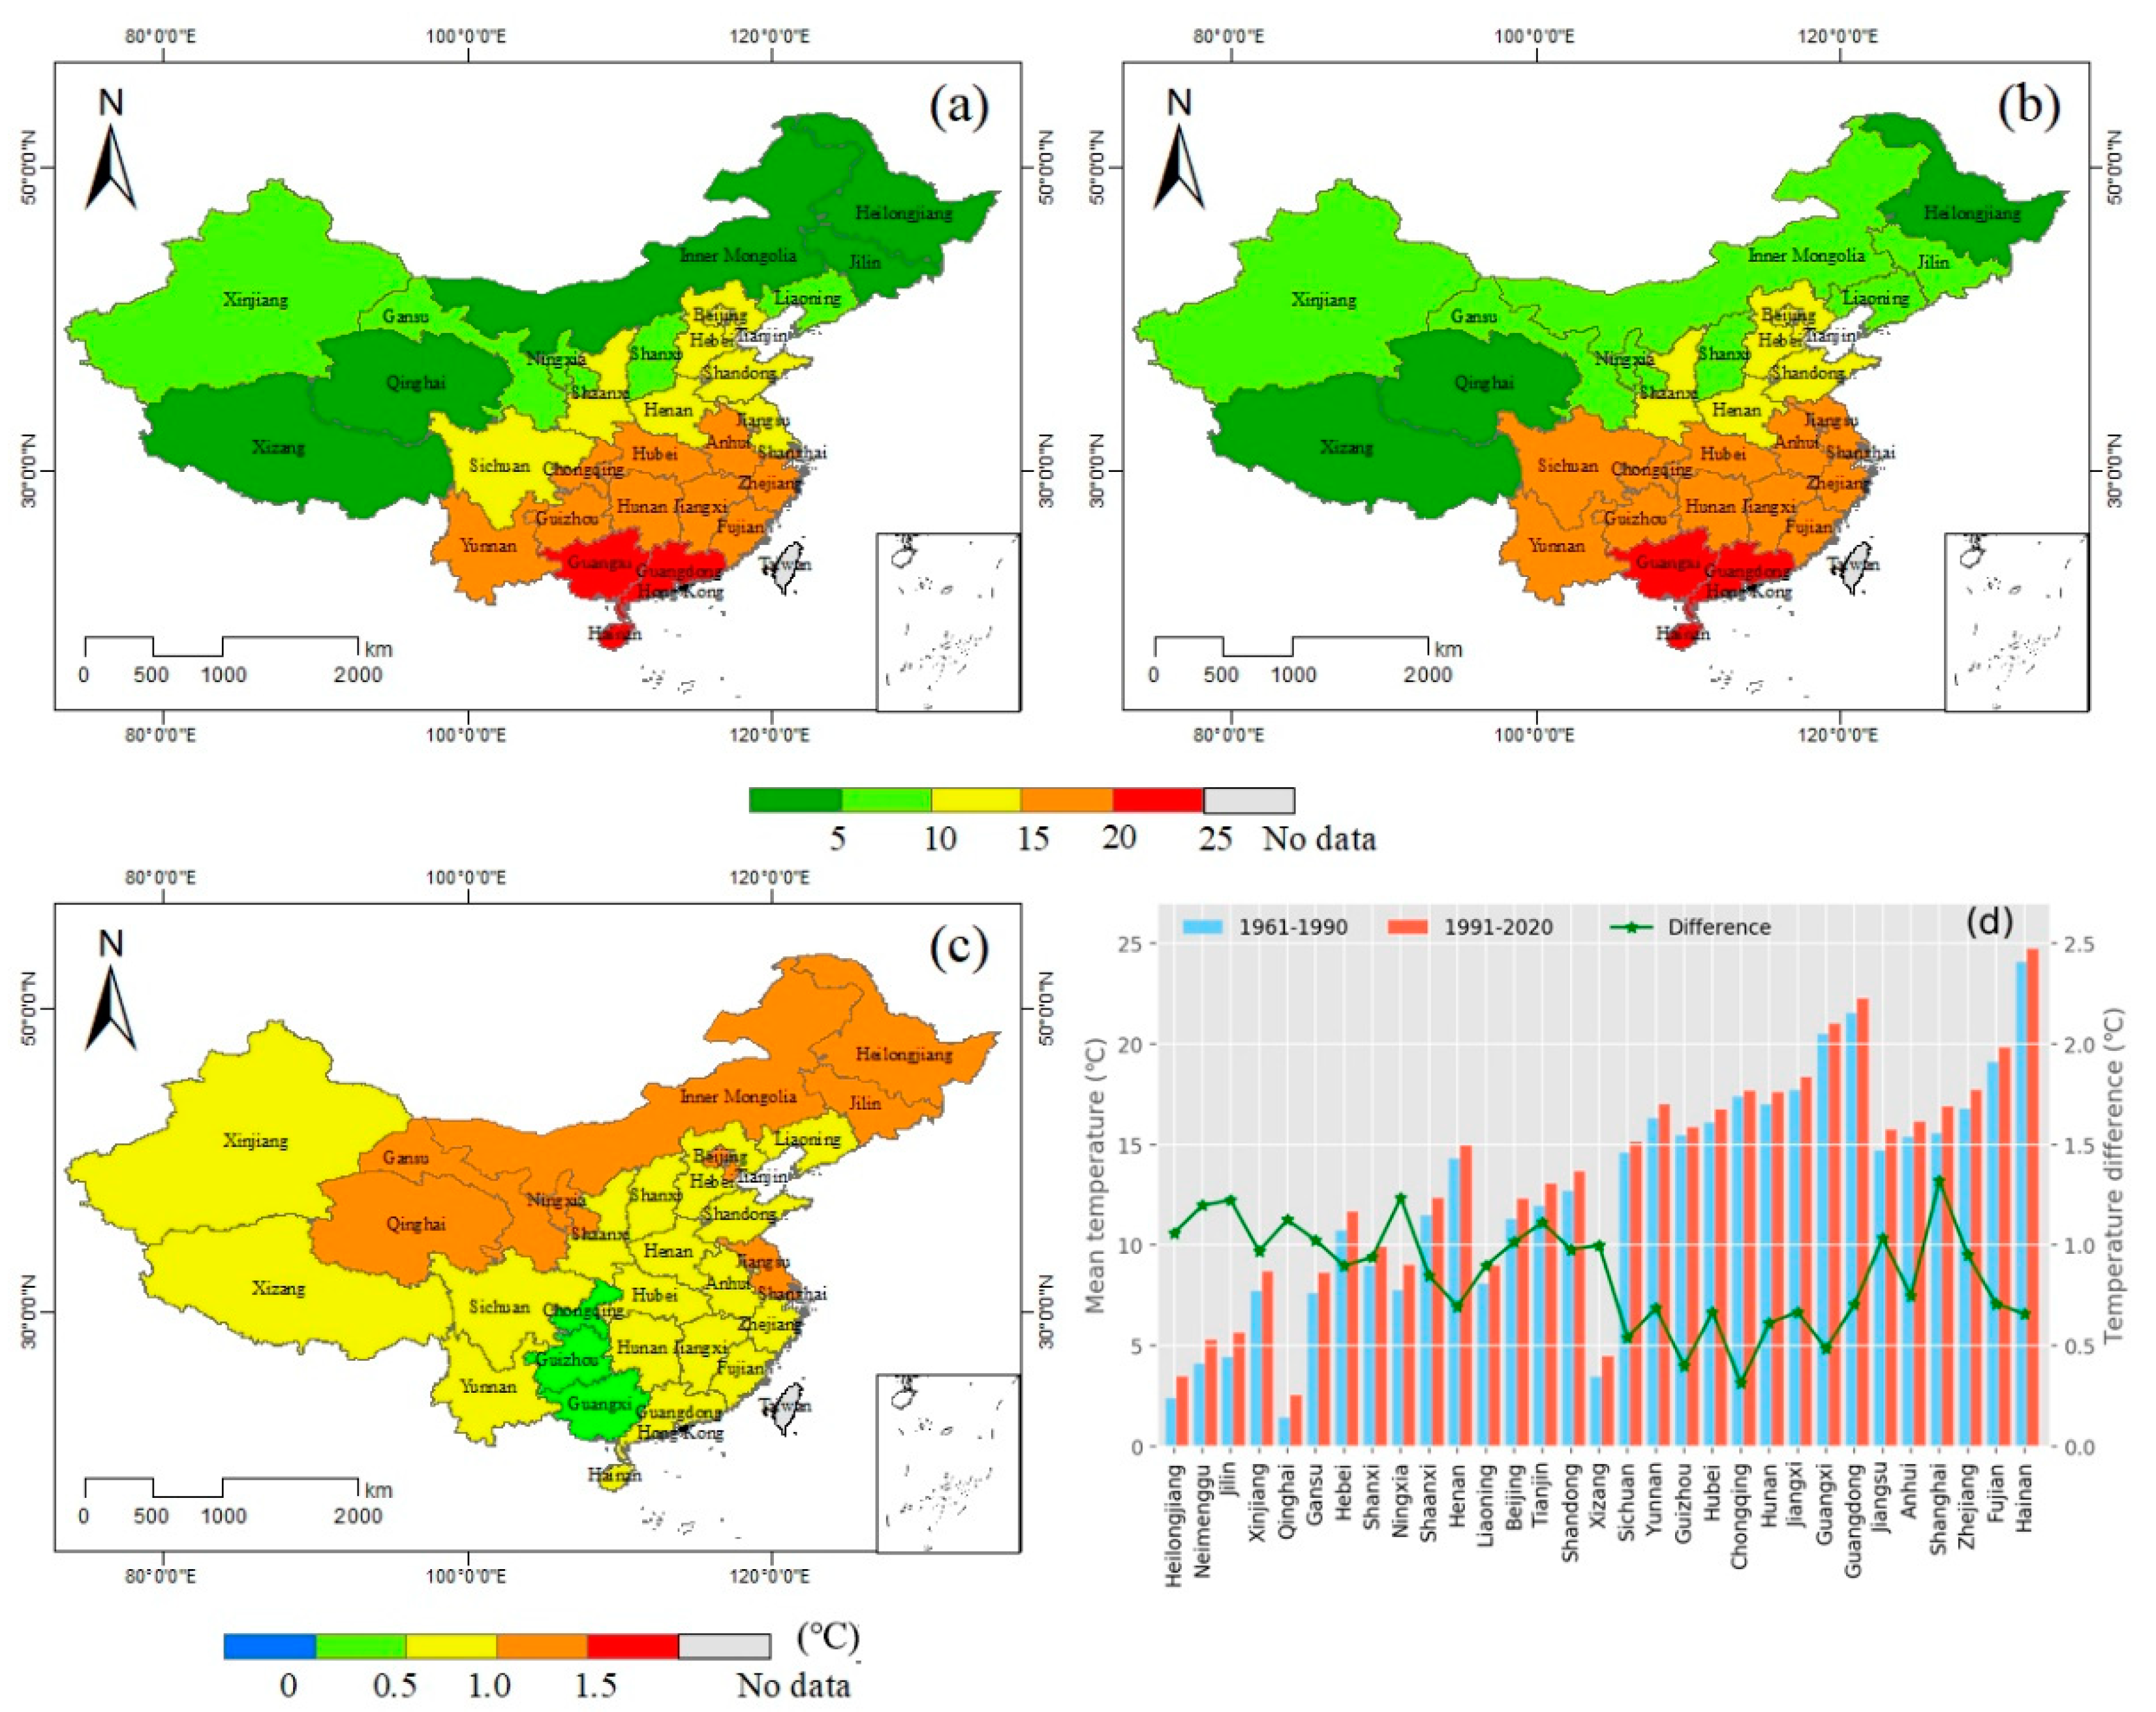
3.1. Temperature Changes of China in the Last 60 Years at the Regional Level

In this study, the temperature data from weather stations was interpolated to 0.01° to calculate annual average temperature for the regional scale. The annual average temperature anomaly (ATA) of China during 1961–2020 is shown in Figure 3a. From the figure we can see that there is a clear trend of increasing for ATA from 1960 to 2020 with a slope of 0.027 (yellow line in Figure 3a). From the 1960s to the 1970s, the annual average temperature in China showed a downward trend, and then increased significantly after 1980s. Especially since 1997, the annual average temperature continues to be higher than the multi-year average temperature. Moreover, the temperature increasing rate during 1991–2020 is 0.034 °C per year (blue line in Figure 3a)) which is significantly higher than that during 1961–1990 with the rate of 0.018 °C per year (green line in Figure 3a)). The diurnal temperature range (DTR) anomaly of China during 1961–2020 is shown in Figure 3b). The figure shows that there is generally a downward trend in both the annual mean daily minimum temperature (Tmin, blue line in Figure 3b)) and the daily maximum temperature (Tmax, red line in Figure 3b)) before 1985. After that, Tmin and Tmax gradually increased, and the increasing range of Tmin is greater than Tmax. Thus, the annual diurnal temperature range (DTR, green line in Figure 3b)) showed a decreasing trend, and the DTR of the last 30 years are generally lower than the average.
The extreme minimum temperature, the mean minimum temperature in the coldest month and the accumulated temperature with daily mean temperature greater than or equal to 10 °C of each province during two time periods (1961–1990 and 1991–2020) are presented in Figure 4. We found that the extreme minimum temperature of most provinces during 1991–2020 increased by more than 1 °C compared with the period of 1961–1990 (Figure 4c), and only Shaanxi province decreased about 0.6 °C. Moreover, the mean minimum temperature in the coldest month in all provinces during 1991–2020 increased, and about 60% of the provinces increased by more than 0.5 °C (Figure 4f). The provinces with an increase of more than 1 °C are mainly concentrated in the eastern and southern coastal areas. The accumulated temperature of each province is also increased during 1991–2020, and the increase in most provinces did not exceed 200 °C, only Zhejiang and Fujian increased more than 250 °C (Figure 4i).
Figure 5 compares the annual mean temperature of each province during the period of 1961–1990 and 1991–2020. There are obvious differences between the northern and southern provinces of China. The annual mean temperature of the northern provinces is generally lower than 15 °C, whereas that of the southern provinces is higher than 15 °C in both time periods. The temperature differences between the two time periods are shown in Figure 5c,d. The mean temperature of all provinces during the period of 1991–2020 increased compared with 1961–1990, and it increased by more than 0.5 °C in all regions except for Chongqing city, Guizhou and Guangxi provinces.

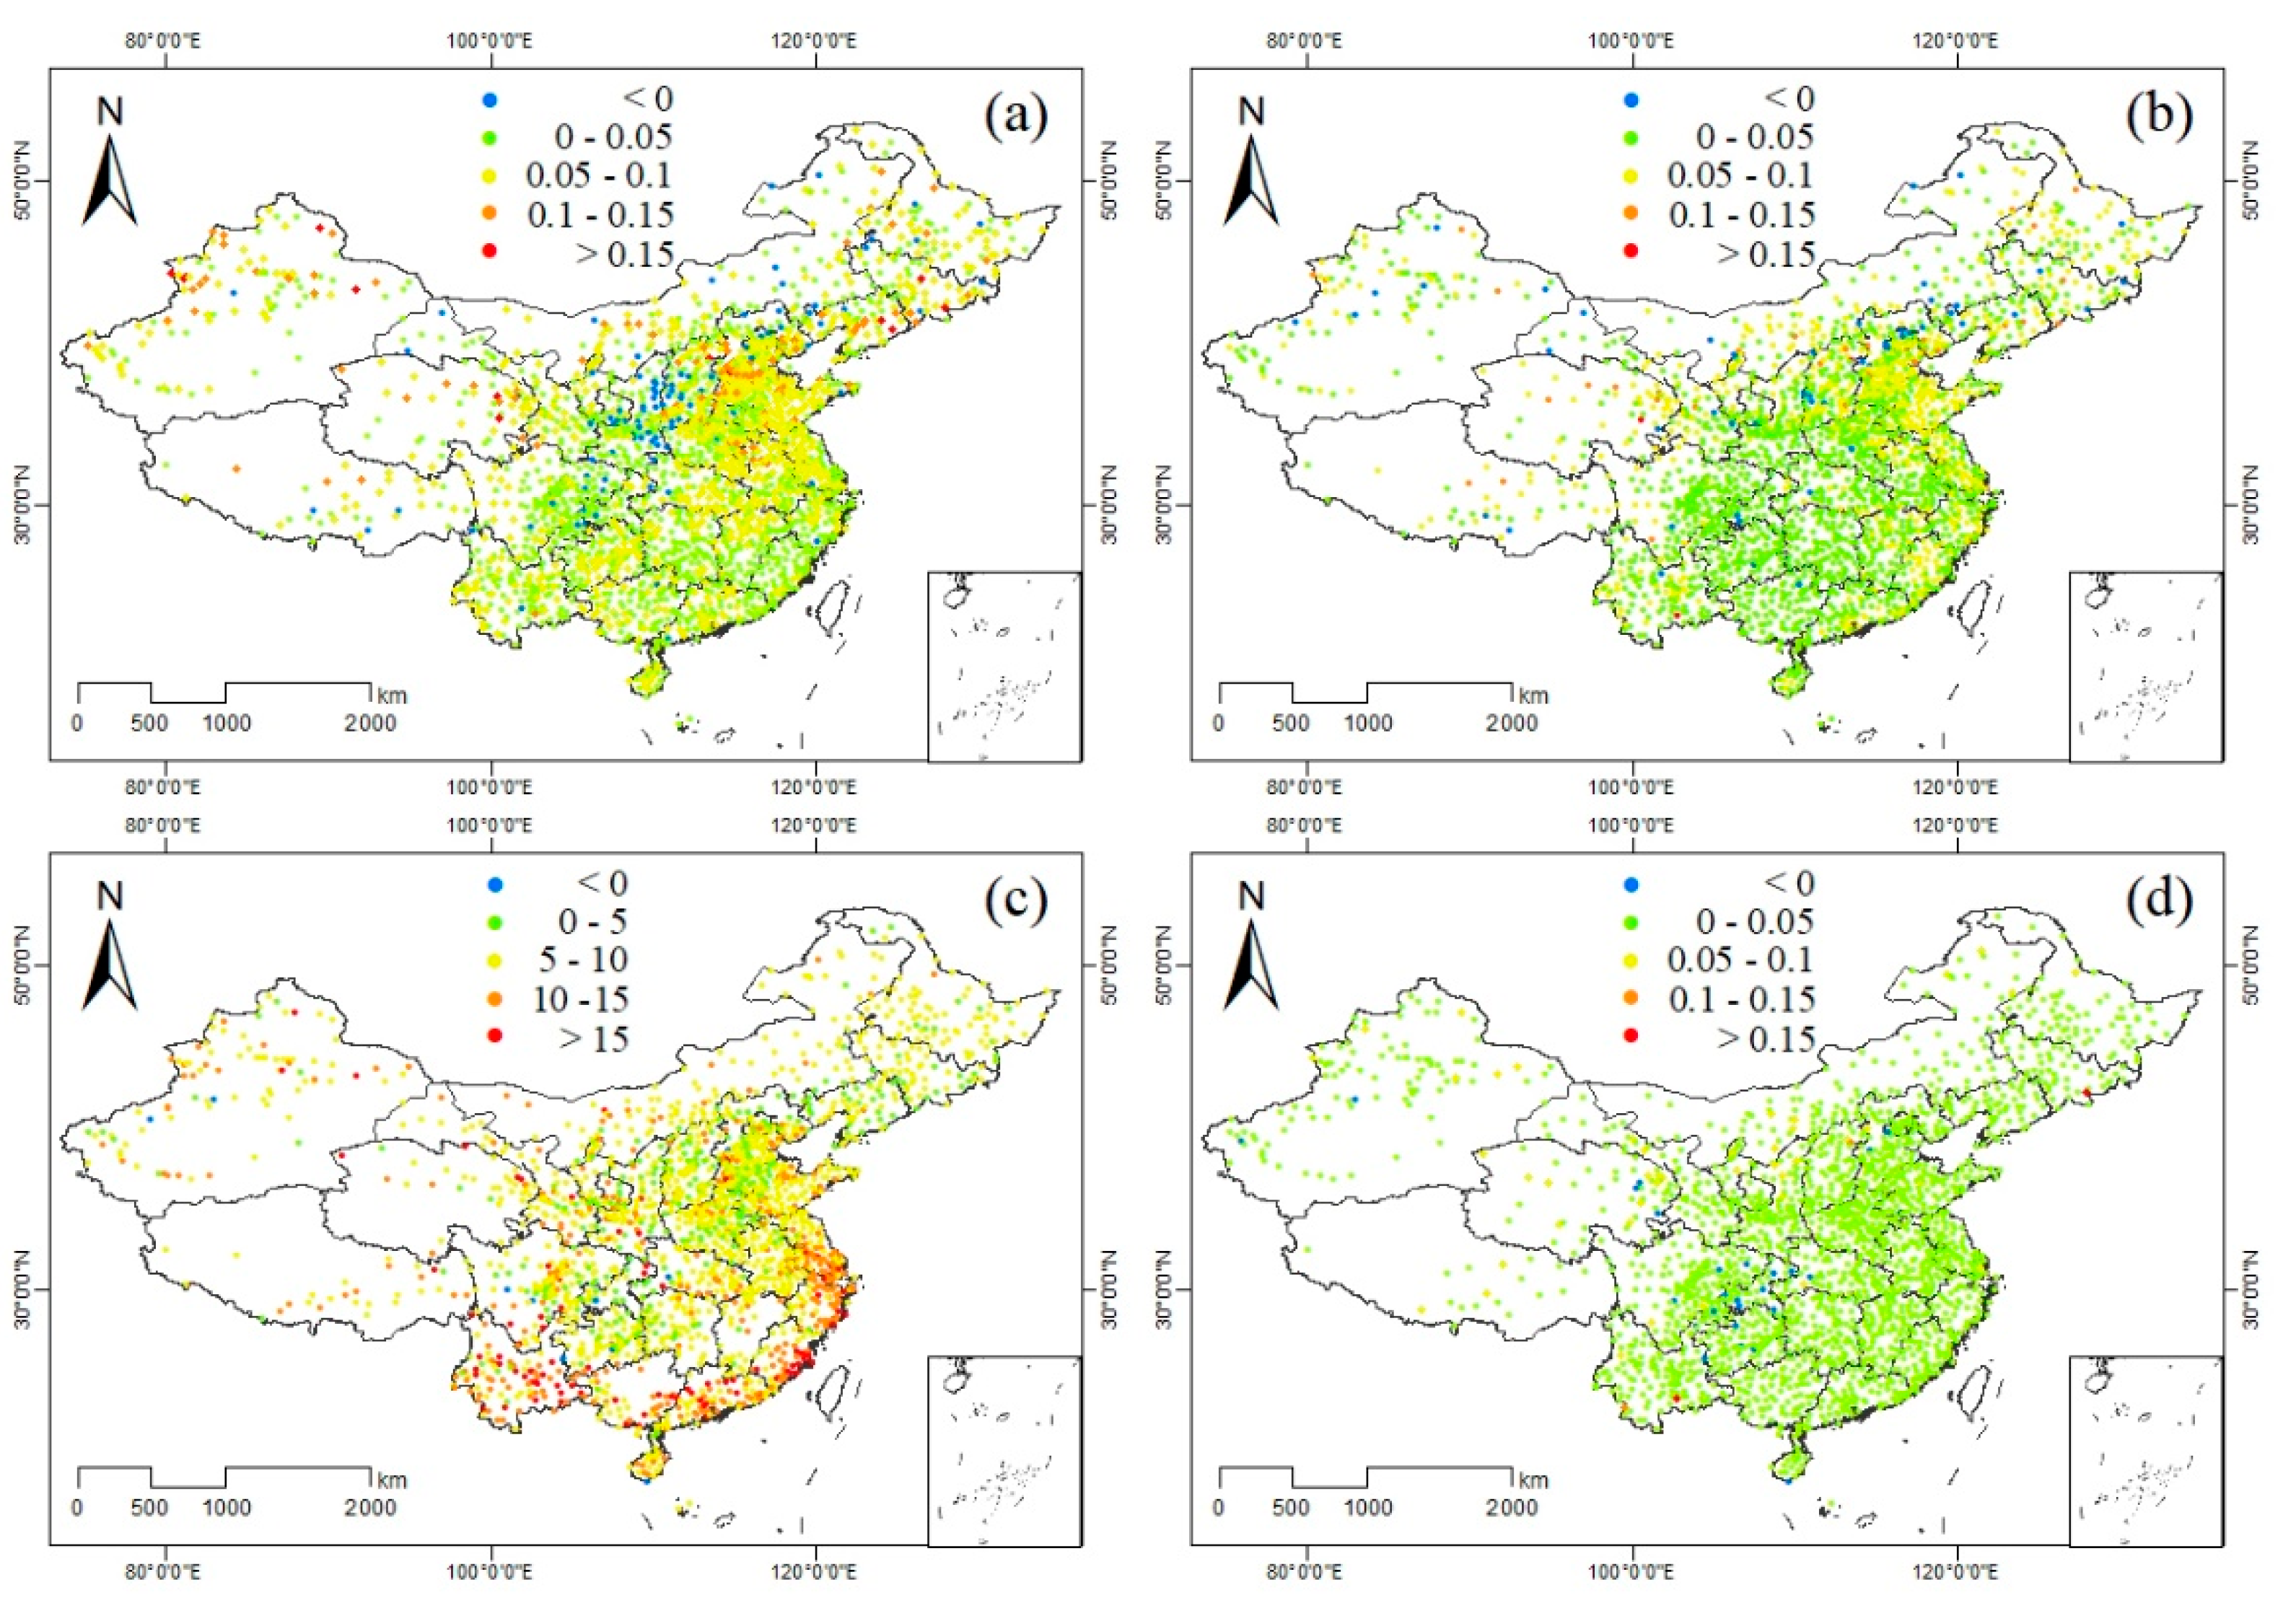
3.2. Temperature Changes of China in the Last 60 Years at the Station Level

The tendency rate of the extreme minimum temperature, mean minimum temperature in the coldest month, accumulated temperature with daily mean temperature greater than or equal to 10 °C and the annual mean temperature for each weather station over the past 60 years (1961–2020) was calculated, and those stations with a p value (significance level) of less than 0.1 were chosen to present the results (Figure 6). It is apparent that the tendency rate is negative of very few points, and a positive tendency rate illustrates that the temperature has been rising in the past 60 years around the country.
We also analyzed the change in the number of weather stations in China that meet various requirements (see Table 1) over the last 60 years (1961–2020). Figure 7 shows an increasing trend over the past 60 years. The number of weather stations where the accumulated temperature is greater than 2100 °C, 5300 °C and 7000 °C increased from 1968, 829, and 184 in 1961 to 2328, 1061, and 280 in 2020, respectively. Furthermore, the number of weather stations where the extreme minimum temperature is greater than −24 °C and mean minimum temperature in the coldest month is greater than −15 °C also increased from 1312 and 2038 in 1961 to 1605 and 2425 in 2020, respectively. These five indicators correspond to the determination criteria of the northern boundary of winter wheat, spring maize, double rice cropping system and triple rice cropping system. The increase in the number of weather stations which meet the requirements reflects the change of crop planting boundaries under climate change.

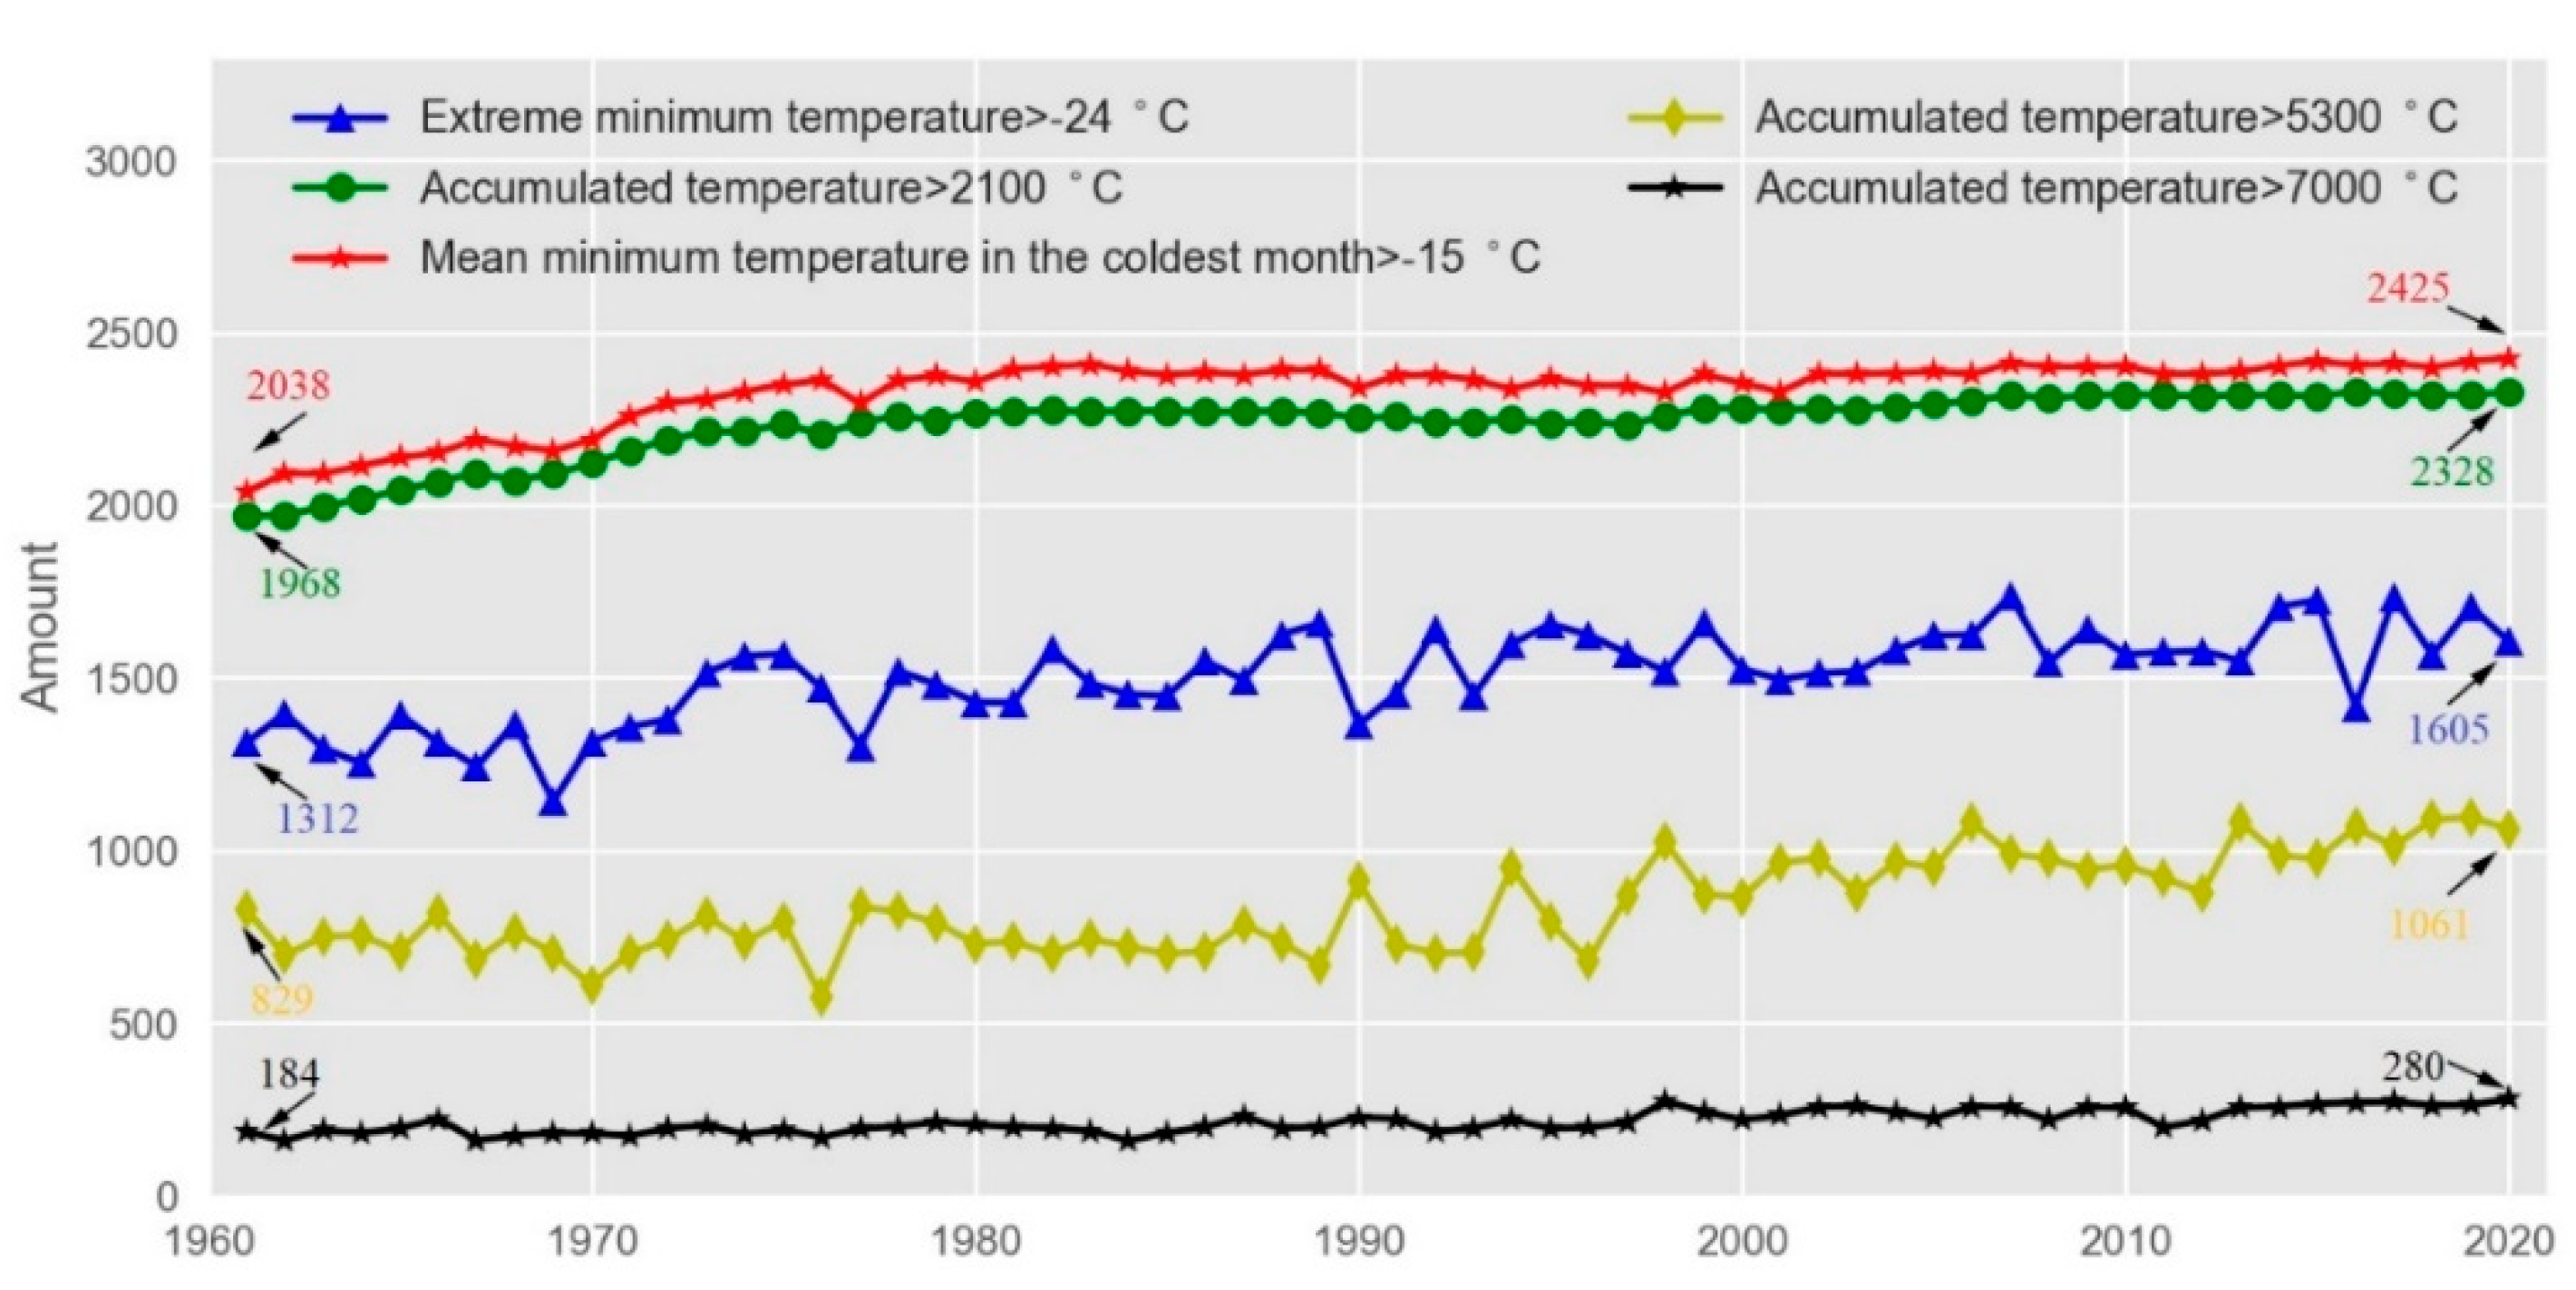
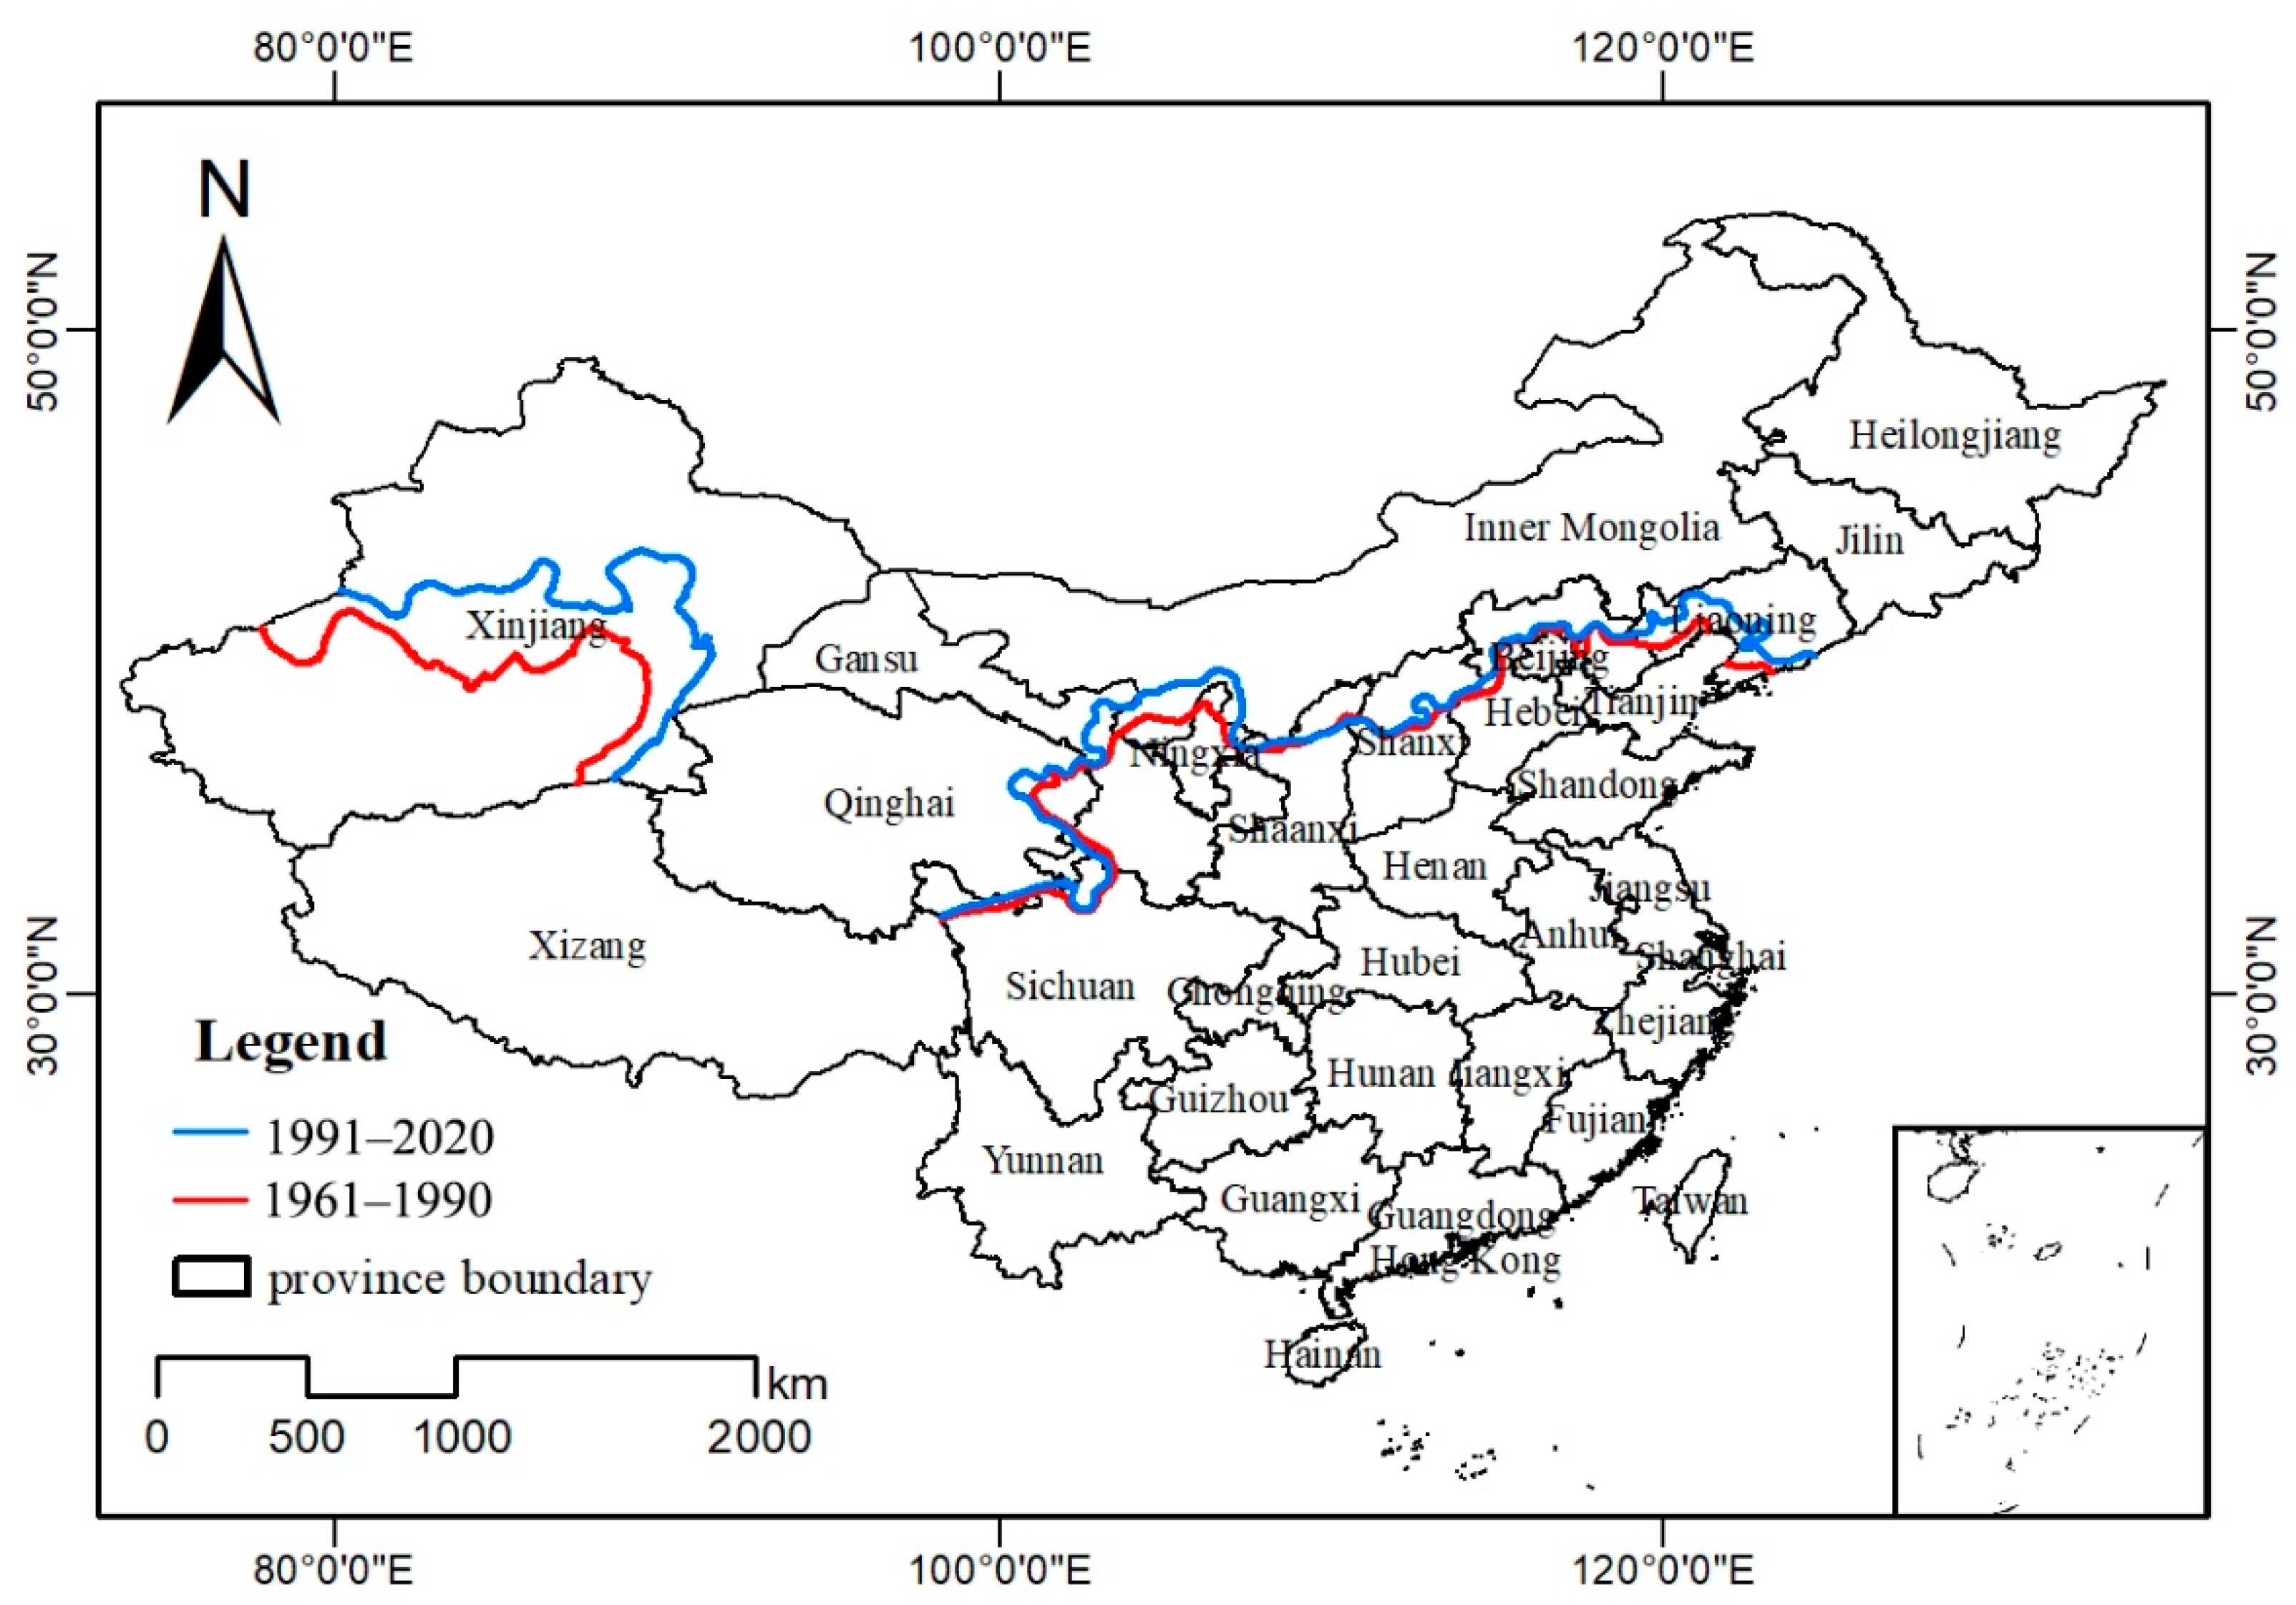
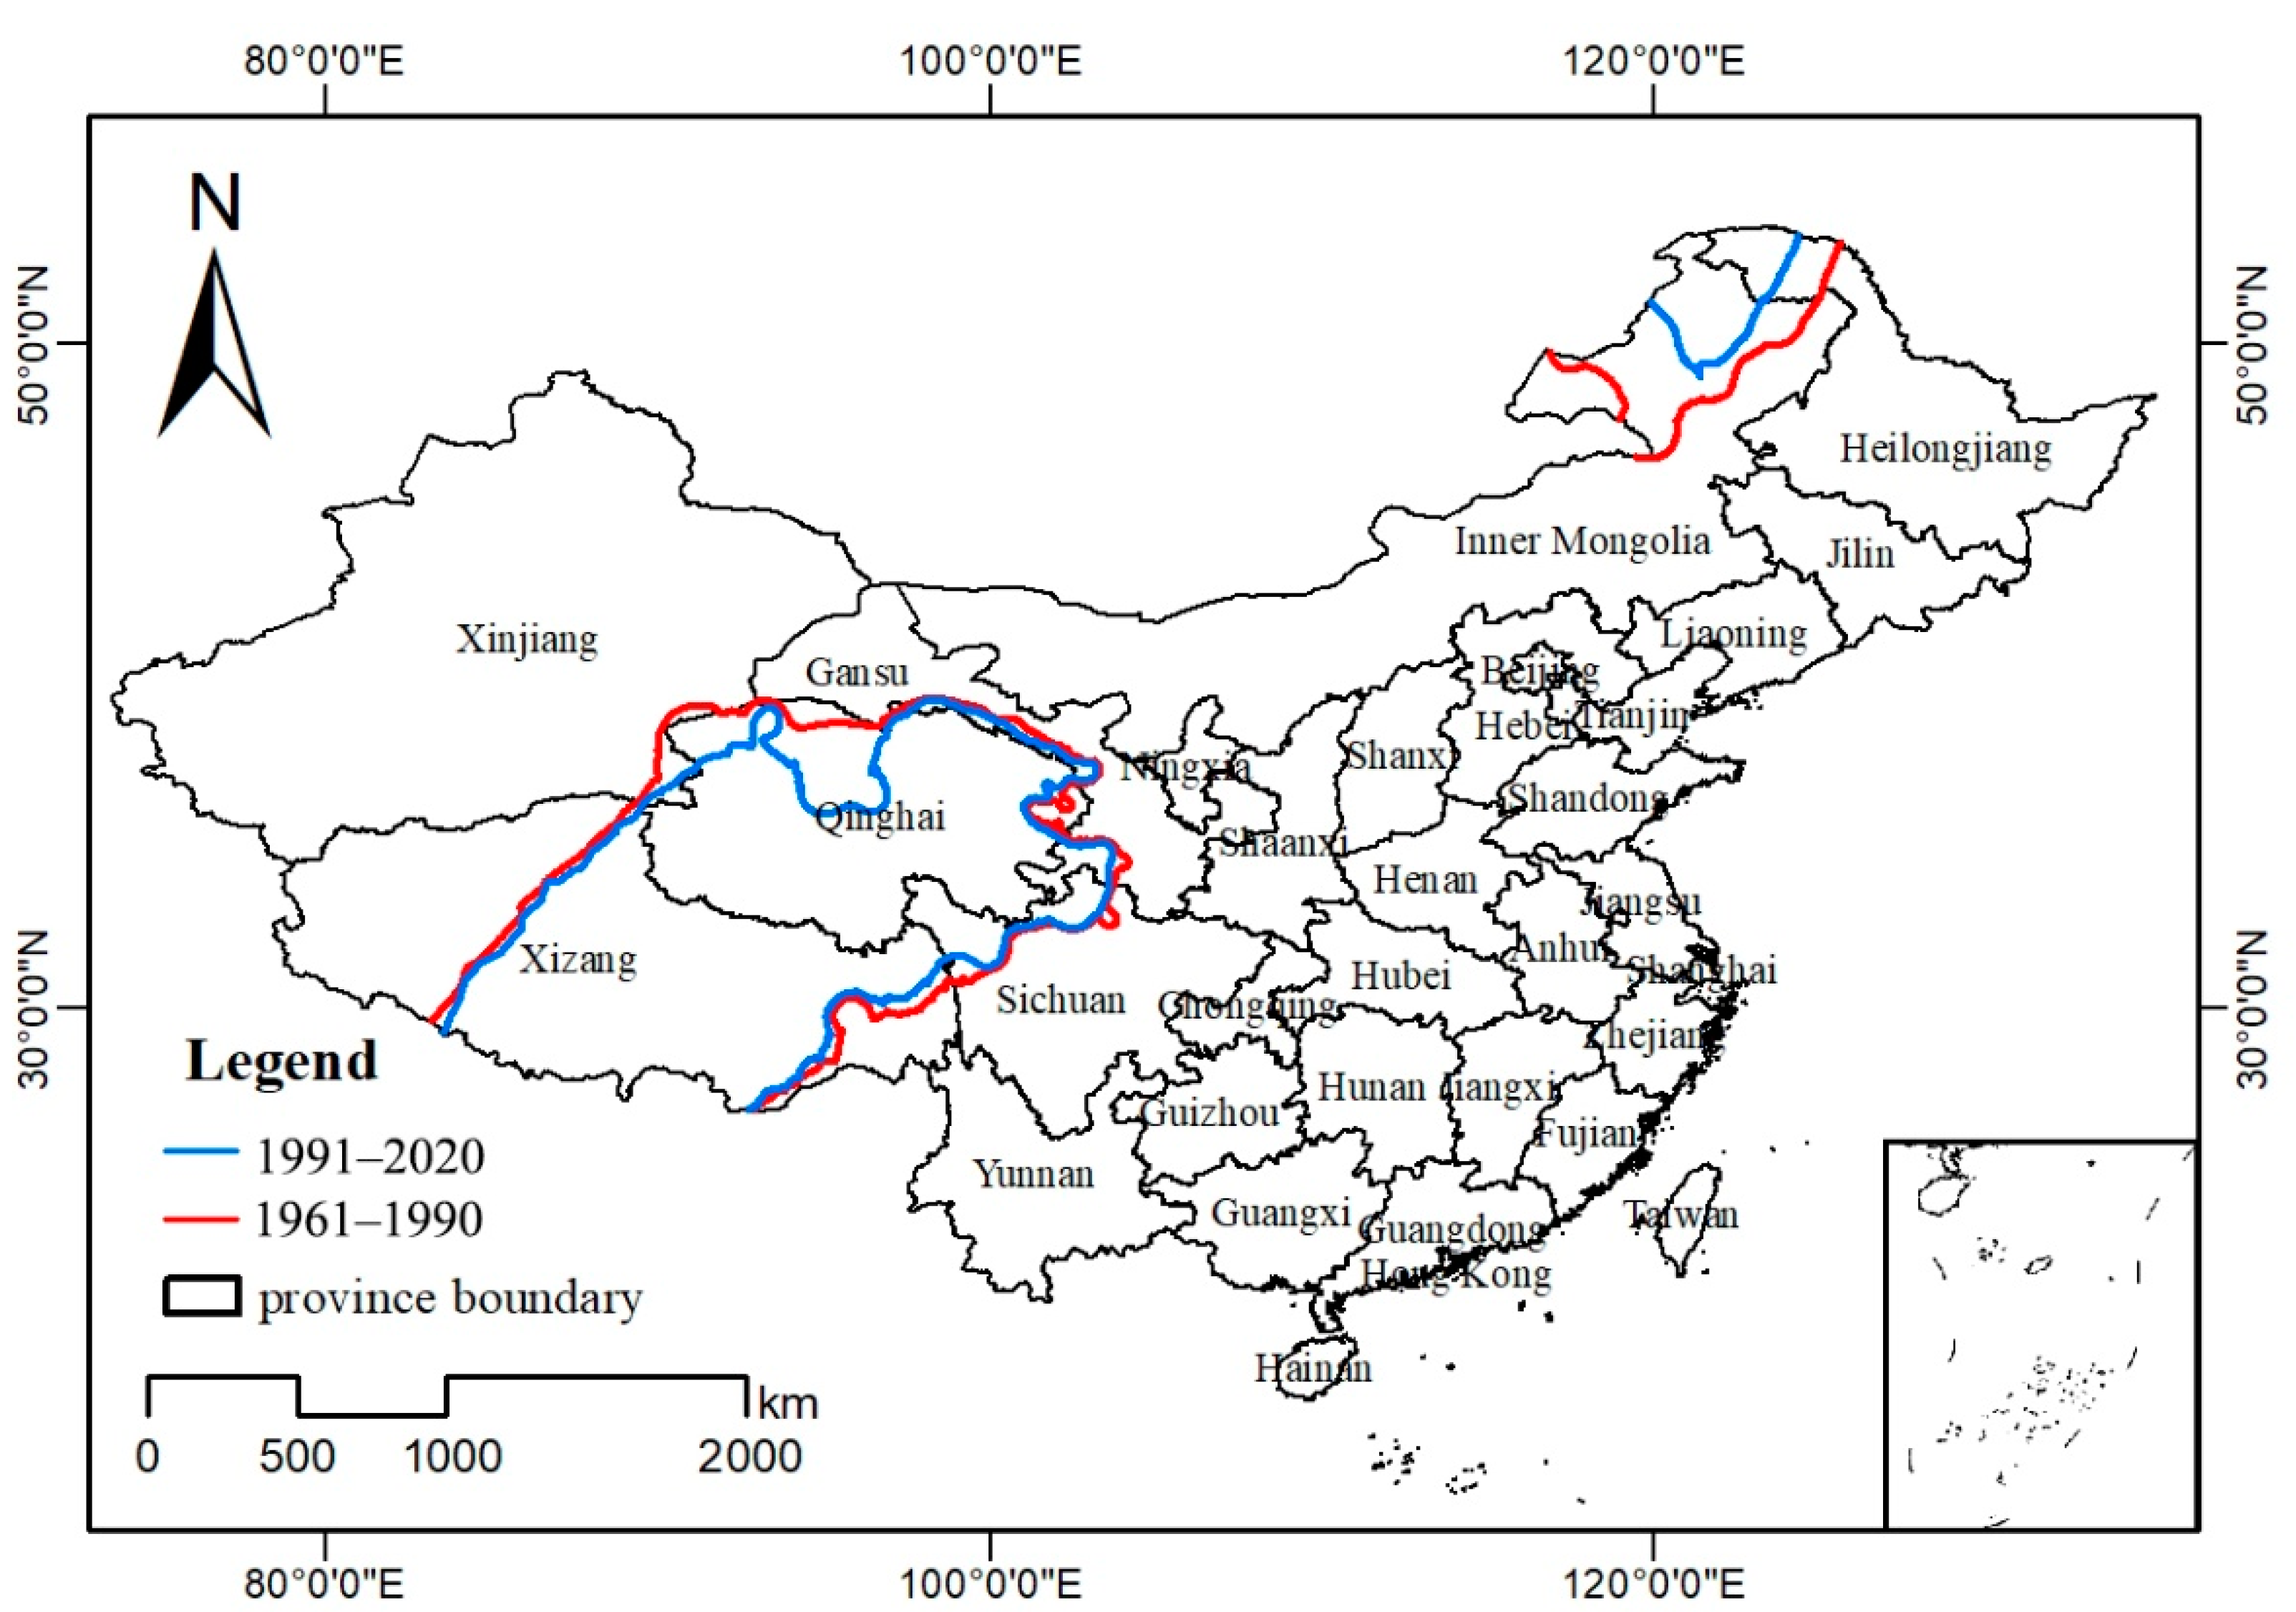
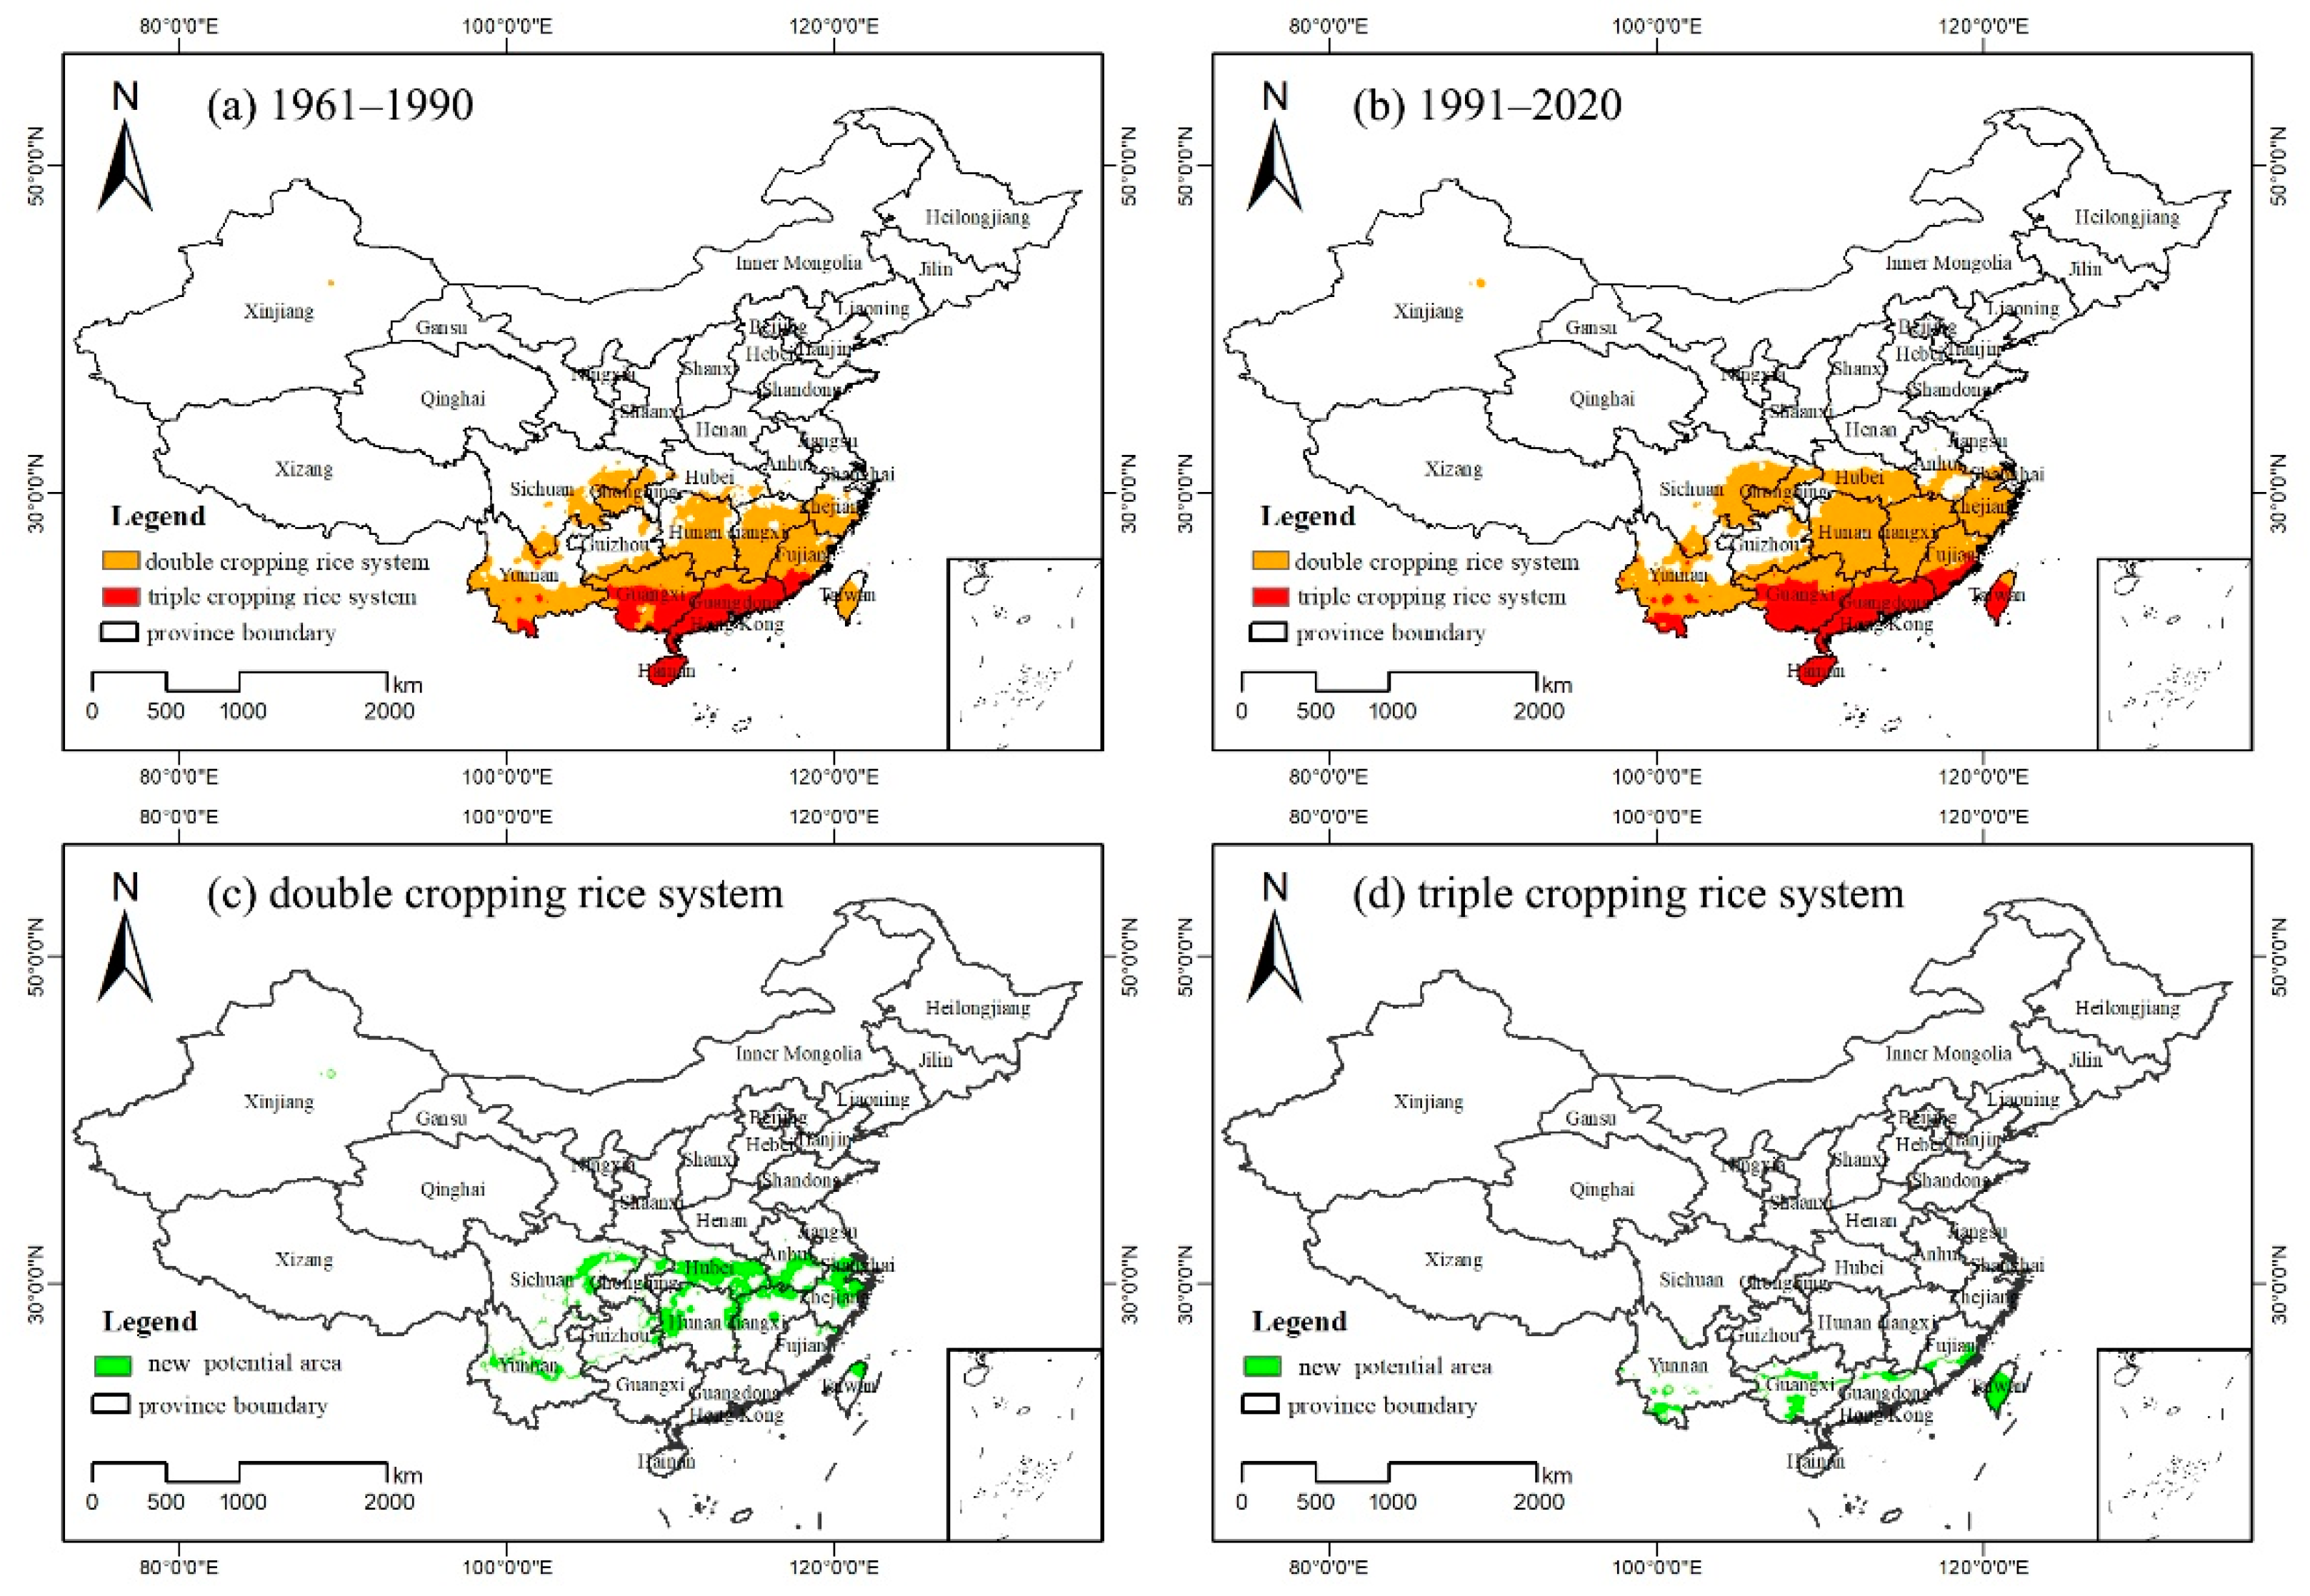
3.3. The Northern Boundary of Three Main Grain Crops and Its Displacement

As shown in Figure 8, the northern planting boundary of winter wheat in north central and northeastern China during 1991–2020 moved northward and extended westward compared to the period 1961–1990, and it tended to move northward and eastward in the Xinjiang province in varying degrees. This is mainly because of the climate warming and the temperature rise in the winter. The spatial displacement of winter wheat northern boundary is obvious in the Liaoning, Ningxia, Inner Mongolia, Gansu and Xinjiang province. The northern planting boundary of winter wheat moved from about 20 km to 200 km in north central and northeastern China. The average displacement in Liaoning province is about 100 km. The Inner Mongolia and Ningxia zones averagely moved 150 km northward, and the winter wheat boundary expanded about 50 km westward in Gansu province. The winter wheat boundary of Xinjiang province moved about 250 km northward on average, and expanded around 150 km eastward on average. In general, the winter wheat northern boundary moved northward, and in the western region, the winter wheat boundary expanded to high-altitude areas (e.g., the Qinghai–Tibet Plateau).
Figure 9 shows the potential planting boundaries of spring maize. In the northeast China, the northern planting boundary of spring maize is located in the northern Inner Mongolia and Heilongjiang province. During the period of 1991–2020, the boundary on average moved 200 km northward compared with the period of 1961–1990. In the western China, the boundary crossed the Sichuan, Gansu, Qinghai, Xinjiang and Xizang provinces. From Figure 3 we can find that the boundary of the period 1991–2020 has narrowed compared with the period of 1961–1990, which means that the boundary extended to the Qinghai–Tibet Plateau, and the maximum extended distance exceeded 300 km. This indicates that the spring maize potential boundary also showed a trend of expansion to high-altitude areas under the background of climate warming.
According to the identification criteria of suitable areas for double rice cropping system and triple rice cropping system (Table 1), the suitable planting area of the two time periods (1961–1990 and 1991–2020) are shown in Figure 10a,b. The double rice cropping system is mainly in Yunnan, Hunan, Jiangxi, Fujian and Zhejiang provinces and Chongqing city, whereas triple rice cropping system is mainly in Guangxi, Guangdong and Hainan provinces. The new potential area, which represents the increased potential suitable planting area during 1991–2020 compared with the period of 1961–1990, are shown in Figure 10c,d. It can be seen in the figure that the boundaries of double and triple rice cropping systems are both moved northward to different degrees. The northern boundary of double rice cropping system during moved from Hunan and Jiangxi provinces to the middle of Hubei province and the south of Anhui province, and it almost covered the whole Zhejiang province and moved to the south of Jiangsu province (Figure 10c). Overall, the northern boundary of double rice cropping system moved northward by about 150 km on average, and the western boundary extended to the middle of Sichuan province with an average distance of 50 km. Moreover, the northern planting boundary of triple rice cropping system averagely moved 20 km northward during the period of 1991–2020, and the new potential areas are now found in the south of Yunnan province and in the middle of Guangxi province (Figure 10d).

4. Discussion

4.1. Benefits of the Current Study

Global warming has extended the growing season of various crops by advancing the planting date and delaying the harvest date, which makes it possible to plant crops in a region that may not have been suitable before [26,27,28]. Based on this background, we integrated the daily temperature data of the past 60 years (1961–2020) from 2437 national meteorological stations of mainland China to evaluate the effect of climate warming on the potential planting boundaries of three main grain crops (winter wheat, spring maize, double and triple rice cropping systems), and analyzed the change of potential planting boundaries during two time periods (1961–1990 and 1991–2020).
Our results illustrate that the temperature in China has shown an obvious increasing trend over the past 60 years (Figure 3 and Figure 6), and the temperature increase rate and range during 1991–2020 are significantly higher than those during 1961–1990 (Figure 4 and Figure 5). Consequently, the increase in temperature is the main reason for the movement of the potential planting boundaries of different crops. The planting boundary results demonstrate that the potential planting boundary of winter wheat moved northward and extended westward in north central and northeast China under climate warming, and the most obvious displacement was found in the Liaoning, Inner Mongolia and Ningxia provinces (Figure 8). Meanwhile, the potential planting boundary of spring maize in northeast China moved northward (Figure 9). These results are consistent with previous studies [12,13,23]. In addition, our results also show that the potential planting boundary of winter wheat in Xinjiang province presented a trend of moving northward and eastward, and the boundary of spring maize in western China tended to move southward and eastward. Therefore, based on our research, we conclude that the potential planting boundary of winter wheat and spring maize in China tended to move northward and expand to high-altitude areas (the Qinghai–Tibet Plateau), and this finding is a supplement to the conclusions of previous studies. In contrast to winter wheat and spring maize, we have essentially reached a conclusion consistent with previous studies on the potential planting boundaries of double and triple rice cropping systems [14,28]. Their boundaries moved northward and westward to different degrees, and the northward shift amplitude was greater than the westward expansion amplitude (Figure 10).
These promising results illustrate that our study fully analyzed the impact of climate warming on the potential planting boundaries of three main grain crops in China over the past 60 years, which is very useful for agricultural policy makers or smallholders to make timely adjustments in crop management. Compared with previous related studies, an advantage of our study is that we used data from almost all national weather stations in China including national basic stations, national reference stations and national general stations, whereas most previous studies only used about 600 national basic stations. More dense site data helped in obtaining more accurate results when the temperature data at the site scale were interpolated to a regional scale (0.01° in this study). Moreover, most previous studies on the northern planting boundaries of the three main grain crops in China are analyzed based on the data before 2010, which may ignore the climate changes of the last decade. To fill this data gap, and for more accurate results, we update the meteorological data to 1961–2020 by considering the climatic conditions in the last ten years, which has been recognized as the warmest decade since 1850 [11].

4.2. Adaptions to Climate Change

Analyzing the adaption to climate change is vital for better understanding the impact of climate change on agriculture [29,30,31]. To reduce the impact of climate change on potential planting areas and maximize the use of thermal resources, adaption to climate change, which refers to adjustments in ecological, social, or economic system in response to actual or expected climatic stimuli and their effects or impacts [32,33,34,35], is urgently needed. Many stakeholders strive to build adaption capacity to climate change.
At the national level, several environmental-related policies, programs and strategies have been developed to support climate change adaptions [36,37]. China issued the China’s National Climate Change Program (CNCCP) in 2007 (http://www.gov.cn/gongbao/content/2007/content_678918.htm accessed on 1 July 2021), which determined the preliminary adaptation measures that could be taken to protect agriculture, water resources, and other assets, thus setting priorities for China’s climate change adaptation activities [38]. At the local government level, countermeasures are often more specific and practical. Many small-scale hydraulic engineering projects have been constructed by local governments over the past decades to guarantee the irrigation. This is an adaption to water shortage caused by the increasing evapotranspiration under climate warming [39,40]. Moreover, in response to temperature increase, the use of multiple cropping indices helps to adapt to climate change. For example, Liaoning province obtained higher yield by replacing early maturing variety maize to mid and late maturity [38]. At the farmer household level, people are adapting to climate change by changing crop cultivation time, and selecting different climate-oriented crop species and cultivars [41]. In summary, through joint efforts from the national level to the individual level, we can better mitigate and adapt to the impacts of climate change.

4.3. Uncertainties and Future Development

However, there are still some limitations to this study. One source of weakness in this study which could have affected the determination of potential planting boundaries was that we only involved the effect of temperature change, without considering other important meteorological factors. For example, precipitation is the main water resource of crops, especially in non-irrigated areas, and it should be properly considered when evaluating the potential planting boundaries of various crops [2]. Moreover, other factors including irrigation facilities, crop variety, socioeconomic and local policies, are all potential factors that may restrict planting boundary [12]. Therefore, future work is needed to fully consider these factors for a more accurate and comprehensive analysis of the potential planting boundaries of various crops. Another shortcoming of this study is that we ignored the potential impact of extreme weather events (e.g., extreme high temperature and chilling injury). Although we experienced the temperature increasing under the background of climate change, a strong annual variation of temperature has been observed (Figure 3) over the past few decades. As a consequence, global warming may have enhanced the frequency and intensity of extreme weather and climate events [42,43,44], which may cause extreme weather that may have a negative effect on potential planting boundaries [13]. Therefore, analysis of extreme weather conditions is strongly suggested in the future research. Furthermore, prediction of the potential planting boundaries of grain crops for future periods is essential and more meaningful, especially for agricultural policy makers. At present, many studies have evaluated the effect of climate change on planting limits under various future climate scenarios [2,6], in the future study, it would be useful to compare the possible impact of climate change on potential planting boundaries under different future climate scenarios. It would also be more interesting if a process-based crop growth model could be combined with future climate scenarios to evaluate the potential effect of climate change on crop yield simulations [45].

5. Conclusions

In this study, we analyzed the potential planting boundaries of three main crops in China during the periods of 1961–1990 and 1991–2020 under the background of climate warming. Our study shows that the extreme minimum temperature, mean minimum temperature in the coldest month and the accumulated temperature during the period of 1991–2020 significantly increased compared with those during the period of 1961–1990, both at the weather station level and the regional (province and national) level. The rising temperature caused a northward movement of the potential planting boundaries of these crops. Moreover, the boundaries of winter wheat and spring maize also showed a trend of expansion to high-altitude areas (e.g., the Qinghai–Tibet Plateau), and the boundaries of double and triple rice cropping systems present a western expansion. In general, the boundaries of winter wheat, spring maize, double and triple rice cropping systems changed significantly due to climate warming. Our study presents more accurate and recent results regarding the potential planting northern boundaries of the three main grain crops in China and demonstrates the effect of climate change on them, potentially providing a reference for policy makers seeking to pay more attention and assign greater priority to the design of agricultural strategies adapted for the sake of crops in sensitive regions.

Author Contributions

Conceptualization, W.Z. and S.F.; methodology, W.Z.; formal analysis, W.Z. and S.F.; data curation, Y.M., L.W., M.L. and J.Z.; writing—original draft preparation, W.Z.; writing—review and editing, S.F., R.Z. and X.G.; visualization, W.Z., Y.M.; funding acquisition, S.F. All authors have read and agreed to the published version of the manuscript.

Funding

This research was funded by the National Key Research and Development Program of China (Grant number: 2019YFC1510200), National Natural Science Foundation of China (Grant number: 42075193), and FengYun Research Plan (Grant number: FY-APP-2021.0301).

Institutional Review Board Statement

Not applicable.

Informed Consent Statement

Not applicable.

Data Availability Statement

Not applicable.

Acknowledgments

We would like to thank journal editors and anonymous reviewers for improving the manuscript.

Conflicts of Interest

The authors declare no conflict of interest.

Abbreviations

ATAAverage temperature anomaly
CMIP5Coupled Model Intercomparison Project Phase 5
CNCCPChina National Climate Change Program
DTRDiurnal temperature range
IDWInverse distance weight
RCP4.5Representative Concentration Pathway 4.5
TACC10Annual accumulated temperature with daily temperature greater than or equal to 10 °C
TbBase temperature
TEExtreme minimum temperature of the year
TmaxDaily maximum temperature
TMCMean minimum temperature in the coldest month
TminDaily minimum temperature

References

  1. IPCC. Climate Change 2021: The Physical Science Basis, Summary for Policymakers, Contribution of Working Group I to the Sixth Assessment Report of the Intergovernmental Panel on Climate Change; Cambridge University Press: Cambridge, UK, 2021; In Press. [Google Scholar]
  2. Sun, Z.; Jia, S.; Lv, A.; Yang, K.; Svensson, J.; Gao, Y. Impacts of climate change on growth period and planting boundaries of winter wheat in China under RCP 4.5 scenario. Earth Syst. Dynam. Discuss. 2015, 6, 2181–2210. [Google Scholar]
  3. Zhao, C.; Liu, B.; Piao, S.; Wang, X.; Lobell, D.B.; Huang, Y.; Huang, M.; Yao, Y.; Bassu, S.; Ciais, P.; et al. Temperature increase reduces global yields of major crops in four independent estimates. Proc. Natl. Acad. Sci. USA 2017, 114, 9326–9331. [Google Scholar] [CrossRef] [PubMed] [Green Version]
  4. IPCC. Climate Change 2013: The Physical Science Basis, Summary for Policymakers, Contribution of Working Group I to the Fifth Assessment Report of the Intergovernmental Panel on Climate Change; Cambridge University Press: Cambridge, UK; New York, NY, USA, 2013. [Google Scholar]
  5. Sun, Y.; Zhang, X.; Ren, G.; Zwiers, F.W.; Hu, T. Contribution of urbanization to warming in China. Nat. Clim. Chang. 2016, 6, 706–709. [Google Scholar] [CrossRef]
  6. Gao, J.; Yang, X.; Zheng, B.; Liu, Z.; Zhao, J.; Su, S. Does precipitation keep pace with temperature in the marginal double-cropping area of northern China? Eur. J. Agron. 2020, 120, 126126. [Google Scholar] [CrossRef]
  7. Zhuo, W.; Huang, J.; Gao, X.; Ma, H.; Huang, H.; Su, W.; Meng, J.; Li, Y.; Chen, H.; Yin, D. Prediction of winter wheat maturity dates through assimilating remotely sensed leaf area index into crop growth model. Remote Sens. 2020, 12, 2896. [Google Scholar] [CrossRef]
  8. Rehmani, M.I.A.; Ding, C.; Li, G.; Ata-Ul-Karim, S.T.; Hadifa, A.; Bashir, M.A.; Hashem, M.; Alamri, S.; Al-Zubair, F.; Ding, Y. Vulnerability of rice production to temperature extremes during rice reproductive stage in Yangtze River Valley, China. J. King Saud. Univ. Sci. 2021, 33, 101599. [Google Scholar] [CrossRef]
  9. Rehmani, M.I.A.; Wei, G.; Hussain, N.; Ding, C.; Li, G.; Liu, Z.; Wang, S.; Ding, Y. Yield and quality responses of two indica rice hybrids to post-anthesis asymmetric day and night open-field warming in lower reaches of Yangtze River delta. Field Crop. Res. 2014, 156, 231–241. [Google Scholar] [CrossRef]
  10. Climate Change Center of China Meteorological Administration. Blue Book on Climate Change in China 2020; Science Press: Beijing, China, 2020. [Google Scholar]
  11. Climate Change Center of China Meteorological Administration. Blue Book on Climate Change in China 2021; Science Press: Beijing, China, 2021. [Google Scholar]
  12. Yang, X.; Liu, Z.; Chen, F. The possible effect of climate warming on northern limits of cropping system and crop yield in China. Agric. Sci. Chi. 2011, 10, 585–594. [Google Scholar] [CrossRef]
  13. Liu, Z.; Yang, X.; Chen, F.; Wang, E. The effects of past climate change on the northern limits of maize planting in Northeast China. Clim. Chang. 2013, 117, 891–902. [Google Scholar] [CrossRef]
  14. Ye, Q.; Yang, X.; Liu, Z.; Dai, S.; Li, Y.; Xie, W.; Chen, F. The effects of climate change on the planting boundary and potential yield for different rice cropping systems in southern China. J. Integr. Agric. 2014, 13, 1546–1554. [Google Scholar] [CrossRef]
  15. Sanehkoori, F.H.; Pirdashti, H.; Bakhshandeh, E. Quantifying water stress and temperature effects on camelina (Camelina sativa L.) seed germination. Environ. Exp. Bot. 2021, 186, 104450. [Google Scholar] [CrossRef]
  16. Porter, J.R.; Gawith, M. Temperatures and the growth and development of wheat: A review. Eur. J. Agron. 1999, 10, 23–36. [Google Scholar] [CrossRef]
  17. Sanchez, B.; Rasmussen, A.; Porter, J.R. Temperatures and the growth and development of maize and rice: A review. Glob. Chang. Biol. 2014, 20, 408–417. [Google Scholar] [CrossRef] [PubMed]
  18. Wang, N.; Wang, E.; Wang, J.; Zhang, J.; Zheng, B.; Huang, Y.; Tan, M. Modelling maize phenology, biomass growth and yield under contrasting temperature conditions. Agric. For. Meteorol. 2018, 250, 319–329. [Google Scholar] [CrossRef]
  19. China Crop Climatic Division Cooperation Group. Climatic Regionalization of Agriculture, Forestry and Crop in China; China Meteorological Press: Beijing, China, 1987. [Google Scholar]
  20. Cui, D.; Cao, G.; Zhang, W.; Zhang, C. Climatical Ecological Divisions of Wheat in China; Science and Technology Press: Guizhou, China, 1991. [Google Scholar]
  21. Liu, X.; Han, X. China’s Multi-Cropping; Beijing Agricultural University Press: Beijing, China, 1987. [Google Scholar]
  22. Yang, Z.; Cai, Z.; Jing, X.; Zhang, S. Maize in Northeast Region of China; China Agriculture Press: Beijing, China, 2007. [Google Scholar]
  23. Zhao, J.; Yang, X.; Liu, Z.; Lv, S.; Wang, J.; Chen, F. The possible effects of global warming on cropping systems in China X. The possible impacts of climate change on climatic suitability of spring maize in the three provinces of Northeast China. Sci. Agric. Sin. 2014, 47, 3143–3156. [Google Scholar]
  24. National Agricultural Zoning Committee. Agricultural Resources and Regional Planning in China; Agriculture Press: Beijing, China, 1991. [Google Scholar]
  25. Qu, M. Agro-Climatic Internship Guide; Beijing Agricultural University Press: Beijing, China, 1991. [Google Scholar]
  26. Root, T.L.; Price, J.T.; Hall, K.R.; Schneider, S.H.; Rosenzweig, C.; Pounds, J.A. Fingerprints of global warming on wild animals and plants. Nature 2003, 421, 57–60. [Google Scholar] [CrossRef]
  27. Song, Y.; Linderholm, H.W.; Chen, D.; Walther, A. Trends of the thermal growing season in China, 1951–2007. Int. J. Climatol. 2010, 30, 33–43. [Google Scholar] [CrossRef]
  28. Ye, Q.; Yang, X.G.; Dai, S.W.; Chen, G.S.; Li, Y.; Zhang, C.X. Effects of climate change on suitable rice cropping areas, cropping systems and crop water requirements in southern China. Agric. Water Manag. 2015, 159, 35–44. [Google Scholar] [CrossRef]
  29. Tao, F.; Zhang, S.; Zhang, Z. Spatiotemporal changes of wheat phenology in China under the effects of temperature, day length and cultivar thermal characteristics. Eur. J. Agron. 2012, 43, 201–212. [Google Scholar] [CrossRef]
  30. Tao, F.; Zhang, Z.; Xiao, D.; Zhang, S.; Rötter, R.P.; Shi, W.; Liu, Y.; Wang, M.; Liu, F.; Zhang, H. Responses of wheat growth and yield to climate change in different climate zones of China, 1981–2009. Agric. For. Meteorol. 2014, 189, 91–104. [Google Scholar] [CrossRef]
  31. Zhang, S.; Tao, F.; Zhang, Z. Rice reproductive growth duration increased despite of negative impacts of climate warming across China during 1981–2009. Eur. J. Agron. 2014, 54, 70–83. [Google Scholar] [CrossRef]
  32. Burton, I.; Lim, B. Achieving adequate adaptation in agriculture. Clim. Change 2005, 70, 191–200. [Google Scholar] [CrossRef]
  33. IPCC. Climate Change 2001: Impacts, Adaptation and Vulnerability. Report of Working Group II; Cambridge University Press: Cambridge, UK, 2001. [Google Scholar]
  34. Tao, F.; Zhang, Z. Adaptation of maize production to climate change in North China Plain: Quantify the relative contributions of adaptation options. Eur. J. Agron. 2010, 33, 103–116. [Google Scholar] [CrossRef]
  35. Zhou, L.; Turvey, C. Climate change, adaptation and China’s grain production. China Econ. Rev. 2014, 28, 72–89. [Google Scholar] [CrossRef]
  36. NARCC (National Assessment Report on Climate Change). China’s Second National Assessment Report on Climate Change; China Science Press: Beijing, China, 2011. [Google Scholar]
  37. NARCC (National Assessment Report on Climate Change). China’s Third National Assessment Report on Climate Change. In Proceedings of the 20th Session of the Conference of the Parties to the United Nations Framework Convention on Climate Change. Lima, Peru, 1–12 December 2014.
  38. Ju, H.; Liu, Q.; Li, Y.; Long, X.; Liu, Z.; Lin, E. Multi-Stakeholder Efforts to Adapt to Climate Change in China’s Agricultural Sector. Sustainability 2020, 12, 8076. [Google Scholar] [CrossRef]
  39. Liu, C.; Huang, W.; Feng, S.; Chen, J.; Zhou, A. Spatiotemporal variations of aridity in China during 1961–2015: Decomposition and attribution. Sci. Bull. 2018, 63, 1187–1199. [Google Scholar] [CrossRef] [Green Version]
  40. Wu, D.; Fang, S.; Tong, X.; Wang, L.; Zhuo, W.; Pei, Z.; Wu, Y.; Zhang, J.; Li, M. Analysis of variation in reference evapotranspiration and its driving factors in mainland China from 1960 to 2016. Environ. Res. Lett. 2021, 16, 054016. [Google Scholar] [CrossRef]
  41. Yang, X.; Lin, E.; Ma, S.; Ju, H.; Guo, L.; Xiong, W.; Li, Y.; Xu, Y. Adaptation of agriculture to warming in Northeast China. Clim. Chang. 2007, 84, 45–58. [Google Scholar] [CrossRef]
  42. Abhayapala, R.; De Costa, J.; Malaviarachchi, W.; Kumara, A.; Suriyagoda, L.; Fonseka, R. Exploitation of differential temperature-sensitivities of crops for improved resilience of tropical smallholder cropping systems to climate change: A case study with temperature responses of tomato and chilli. Agr. Ecosyst. Environ. 2018, 261, 103–114. [Google Scholar] [CrossRef]
  43. Alexander, L.V.; Zhang, X.; Peterson, T.C.; Caesar, J.; Gleason, B.; Klein Tank, A.M.G.; Haylock, M.; Collins, D.; Trewin, B.; Rahimzadeh, F.; et al. Global observed changes in daily climate extremes of temperature and precipitation. J. Geophys. Res. 2006, 111, D05109. [Google Scholar] [CrossRef] [Green Version]
  44. Fang, S.; Qi, Y.; Yu, W.; Liang, H.; Han, G.; Li, Q.; Shen, S.; Zhou, G.; Shi, G. Change in temperature extremes and its correlation with mean temperature in mainland China from 1960 to 2015. Int. J. Climatol. 2017, 37, 3910–3918. [Google Scholar] [CrossRef]
  45. Zhuo, W.; Fang, S.; Gao, X.; Wang, L.; Wu, D.; Fu, S.; Wu, Q.; Huang, J. Crop yield prediction using MODIS LAI, TIGGE weather forecasts and WOFOST model: A case study for winter wheat in Hebei, China during 2009–2013. Int. J. Appl. Earth Obs. Geoinf. 2022, 106, 102668. [Google Scholar] [CrossRef]
Figure 1. The number of national weather stations in China from 1950 to 2020.
Agriculture 12 00746 g001
Figure 2. Study area and weather stations in China.
Agriculture 12 00746 g002
Figure 3. Annual average temperature anomaly (a) and diurnal temperature range anomaly (b) of China during 1961–2020. (Tmin: daily minimum temperature; Tmax: daily maximum temperature; DTR: diurnal temperature range).
Agriculture 12 00746 g003
Figure 4. The extreme minimum temperature (the first row: (ac)), mean minimum temperature in the coldest month (the second row: (df)) and accumulated temperature with daily mean temperature greater than or equal to 10 °C (the third row: (gi)) of each province during 1961–1990 (the first column: (a,d,g)) and 1991–2020 (the second column: (b,e,h)), along with their difference (the third column: (c,f,i)).
Agriculture 12 00746 g004
Figure 5. The mean temperature of each province in 1961–1990 (a) and 1991–2020 (b), and their difference (c). Histogram of the mean temperature of each province (d).
Agriculture 12 00746 g005
Figure 6. The tendency rate of (a) the extreme minimum temperature; (b) mean minimum temperature in the coldest month; (c) accumulated temperature with daily mean temperature greater than or equal to 10 °C; and (d) annual mean temperature for each weather station over the past 60 years (1961–2020) with the p value (significance level) is less than 0.1.
Agriculture 12 00746 g006
Figure 7. The amount of weather stations that meet a certain condition of each year during 1961–2020.
Agriculture 12 00746 g007
Figure 8. Potential northern planting boundary of winter wheat during the periods of 1961–1990 (red line) and 1991–2020 (blue line).
Agriculture 12 00746 g008
Figure 9. Potential northern planting boundary of spring maize during the period of 1961–1990 (red line) and 1991–2020 (blue line).
Agriculture 12 00746 g009
Figure 10. Potential suitable planting area of double rice cropping system (orange region) and triple rice cropping system (red region) during the period of (a) 1961–1990 and (b) 1991–2020, and new potential area of (c) double rice cropping system and (d) triple rice cropping system.
Agriculture 12 00746 g010
Table 1. Determination indices of potential northern planting boundary of three main grain crops in China.
Crop Type Determination Index Reference
Winter wheat
TMC > −15 ℃
−24 ℃ < TE < −22 ℃
[19,20,21]
Spring maize
TACC10 = i = t 1 i = t 2 T i , Ti ≥ 10 °C
TACC10 > 2100 °C
[22,23]
RiceDouble cropping system
TACC10 > 5300 °C
TACC10 > 7000 °C
[24]
Triple cropping system
Note: TMC represents mean minimum temperature in the coldest month; TE represents the extreme minimum temperature; TACC10 represents the annual accumulated temperature with daily temperature greater than or equal to 10 °C; Ti represents the daily mean temperature; t1 and t2 represent the starting and ending dates of the period with Ti steadily above 10 °C, respectively.
Publisher’s Note: MDPI stays neutral with regard to jurisdictional claims in published maps and institutional affiliations.

