
Winners and Losers of the CAP’s Rural Development Policy in Poland


Abstract
:1. Introduction
2. Literature Review
3. Materials and Methods
4. Results
5. Discussion
6. Conclusions
Author Contributions
Funding
Institutional Review Board Statement
Informed Consent Statement
Data Availability Statement
Conflicts of Interest
References
- Dwyer, J. Transformation for sustainable agriculture: What role for the second Pillar of CAP? Bio-Based Appl. Econ. J. 2013, 2, 29–47. [Google Scholar]
- Castaño, J.; Blanco, M.; Martinez, P. Reviewing Counterfactual Analyses to Assess Impacts of EU Rural Development Programmes: What Lessons Can Be Learned from the 2007–2013 Ex-Post Evaluations? Sustainability 2019, 11, 1105. [Google Scholar] [CrossRef] [Green Version]
- Papadopoulos, A.G. The Impact of the CAP on Agriculture and Rural Areas of EU Member States. Agrar. South J. Political Econ. 2015, 4, 22–53. [Google Scholar] [CrossRef]
- Vanni, F.; Cardillo, C. The effects of CAP greening on Italian agriculture. Politica Agricola Internazionale. Int. Agric. Policy 2013, 3, 7–21. [Google Scholar]
- EU Information Documents. Available online: https://ec.europa.eu/info/food-farming-fisheries/key-policies/common-agricultural-policy/rural-development/previous-rdp-periods_pl#ruraldevsupport200006 (accessed on 10 September 2021).
- Pavlis, E.S.; Terkenli, T.S.; Kristensen, S.B.; Busck, A.G.; Cosor, G.L. Patterns of agri-environmental scheme participation in Europe: Indicative trends from selected case studies. Land Use Policy 2016, 57, 800–812. [Google Scholar] [CrossRef]
- Miś, T. Pomoc dla młodych rolników z funduszy UE i ich wykorzystanie na przykładzie Podkarpacia (Aid for young farmers from EU funds and their use on the example of Podkarpacie). Cent. Doradz. Rol. W Brwinowie Oddział W Pozn. 2016, 2, 26–37. [Google Scholar]
- Bonfiglio, S.; Camaioni, B.; Coderoni, S.; Esposti, R.; Pagliacci, F.; Sotte, F. Are rural regions prioritizing knowledge transfer and innovation? Evidence from Rural Development Policy expenditure across the EU space. J. Rural Stud. 2017, 53, 78–87. [Google Scholar] [CrossRef]
- Camaioni, B.; Esposti, R.; Lobianco, A.; Pagliacci, F.; Sotte, F. How rural is the EU RDP? An analysis through spatial fund allocation. Bio-based. Appl. Econ. 2013, 2, 277–300. [Google Scholar]
- Biczkowski, M. Endogenous Potential of Rural Areas vs. the Structure And Allocation of Funds Under the 2007–2013 RDP. J. Agribus. Rural. Dev. 2019, 1, 5–14. [Google Scholar]
- Chaplin, H.; Davidova, S.; Gorton, M. Agricultural adjustment and the diversification of farm households and corporate farms in Central Europe. J. Rural Stud. 2004, 20, 61–77. [Google Scholar] [CrossRef]
- Chiappini, S.; Toccaceli, D. The relevance of district contexts in the UTILISATION of rural development policies: Experience from Italy. Int. Agric. Policy 2014, 4, 33–45. [Google Scholar]
- Dudu, H.; Smeets Kristkova, Z. Impact of CAP Pillar II Payments on Agricultural Productivity. In Proceedings of the XV EAAE Congress, ‘Towards Sustainable Agri-FoodSystems: Balancing between Markets and Society’, Parma, Italy, 28 August–1 September 2017. [Google Scholar]
- Kiryluk-Dryjska, E.; Więckowska, B. Territorial Clusters of Farmers’ Interest in Diversification in Poland: Geospatial Location and Characteristics. Sustainability 2020, 12, 5276. [Google Scholar] [CrossRef]
- Kiryluk-Dryjska, E.; Więckowska, B.; Sadowski, A. Spatial determinants of farmers’ interest in European Union’s pro-investment programs in Poland. PLoS ONE 2021, 16, e0248059. [Google Scholar] [CrossRef] [PubMed]
- Andersson, A.; Höjgård, S.; Rabinowicz, E. Evaluation of results and adaptation of EU Rural Development Programmes. Land Use Policy 2017, 67, 298–314. [Google Scholar] [CrossRef]
- Rizov, M.; Pokrivcak, J.; Ciaian, P. CAP Subsidies and Productivity of the EU Farms. J. Agric. Econ. 2013, 64, 537–557. [Google Scholar] [CrossRef]
- Gołębiewska, B.; Stefańczyk, J. Ocena składania i realizacji wniosków o pomoc z programu wspierającego młodych rolnikóe w ramach PROW w latach 2015–2016 (Assessment of the submission and implementation of applications for aid from the program supporting young farmers under the RDP in 2015–2016). Rocz. Nauk. Stowarzyszenia Ekon. Rol. I Agrobiz. 2017, 19, 46–51. [Google Scholar]
- Sprawozdanie z Działalności Agencji Restrukturyzacji i Modernizacji Rolnictwa za rok 2015, Warszawa. 2016. Available online: https://www.gov.pl/web/arimr/sprawozdania-z-dzialalnosci-agencji-restrukturyzacji-i-modernizacji-rolnictwa (accessed on 20 April 2022).
- Parlińska, A.; Parlińska, M.; Rembielak, G. Ocena wykorzystania środków PROW 2007–2013 na ułatwienie startu młodym rolnikom (Assessment of the use of RDP 2007–2013 funds to facilitate the start of young farmers). Pr. Nauk. Uniw. Ekon. We Wrocławiu- Probl. Ekon. I Społeczne 2014, 360, 188–197. [Google Scholar]
- Podlińska, O. Wykorzystanie środków w ramach PROW 2007–2013 w województwie mazowieckim (Use of Funds within Rural Development Programs (PROW) 2007–2013 in the Mazovian Province). Studia I Pr. WNEIZ US 2014, 37, 289–298. [Google Scholar]
- Cichalewska, P.; Brodecki, S. Wpływ Programu Rozwoju Obszarów Wiejskich 2007–2013 na konkurencyjność polskiego rolnictwa (The impact of the Rural Development Program 2007–2013 on the competitiveness of Polish agriculture). Studia Iuridica Agraria T 2012, 10, 355–366. [Google Scholar] [CrossRef] [Green Version]
- Iwaniuk, J. Zobowiązania rolnika, któremu przyznana została pomoc w ramach działania ‘Ułatwianie startu młodym rolnikom’ (Obligations of a farmer who has been granted aid under the measure ‘Facilitating the start of young farmers’). Wiadomości Rol. 2014, 11, 12–13. [Google Scholar]
- Babuchowska, K.; Marks-Bielska, R. Realizacja działania PROW 2007–2013 ‘Modernizacja gospodarstw rolnych’ w województwie lubelskim (Implementation of the RDP 2007–2013 measure ‘Modernization of agricultural holdings’ in the Lubelskie Voivodeship). Probl. Rol. Światowego 2011, 11, 7–16. [Google Scholar]
- Poczta, W.; Sieminski, P.; Sierszchulski, J. Przestrzenne zróżnicowanie aktywności rolników w pozyskiwaniu środków unijnych na rozwój gospodarstw rolnych w Wielkopolsce na przykładzie działania ‘Modernizacja gospodarstw rolnych’ (Spatial differentiation of farmers’ activity in obtaining EU funds for the development of farms in Wielkopolska on the example of the measure ‘Modernization of farms’). J. Agribus. Rural Dev. 2012, 3, 207–223. [Google Scholar]
- Żmija, K. Strategie różnicowania działalności gospodarczej przez rolników posiadających drobne gospodarstwa rolne (Strategies for diversifying economic activity by farmers with small farms). Rocz. Nauk. Stowarzyszenia Ekon. Rol. I Agrobiz. 2016, 18, 419–425. [Google Scholar]
- Rudnicki, R.; Wisniewski, L.; Kluba, M. Poziom i struktura przestrzenna rolnictwa Polskiego w świetle wyników Powszechnego Spisu Rolnego 2010 (The level and spatial structure of Polish agriculture in the light of the results of the 2010 General Agricultural Census). Rocz. Nauk. Stowarzyszenia Ekon. Rol. I Agrobiz. 2015, 17, 337–343. [Google Scholar]
- Sikorska-Wolak, I. Dywersyfikacja ekonomiczna gospodarstw rolnych jako przejaw przedsiębiorczych zachowań rolników (Economic diversification of farms as a manifestation of enterprising ones the behawior of farmers). Zesz. Nauk. SGGW W Warszawie. Ekon. I Organ. Gospod. Żywnościowej 2011, 93, 29–42. [Google Scholar]
- Camaioni, B.; Esposti, R.; Pagliacci, F.; Sotte, F. How Much Rural Is the CAP? Work Package 504 MS105 ‘Final Report on Task 504.3’; WWWforEurope Working Paper; WWWforEurope: Vienna, Austria, 2014; p. 51. [Google Scholar]
- Crescenzi, R.; Rodríguez-Pose, A. Reconciling top-down and bottom-up development policies. Environ. Plan. 2011, 43, 773–780. [Google Scholar] [CrossRef]
- Poczta, W.; Beba, P. Zgodność rozdysponowania środków polityki strukturalnej Wspólnej Polityki Rolnej z regionalnym zróżnicowaniem rozwoju wsi i rolnictwa w Polsce (Compliance of the distribution of funds from the structural policy of the Common Agricultural Policy with the regional diversification of the development of rural areas and agriculture in Poland). Rocz. Nauk. Stowarzyszenia Ekon. Rol. I Agrobiz. 2017, 19, 165–172. [Google Scholar]
- Zasada, I.; Weltin, M.; Reutter, M.; Verburg, P.H.; Piorr, A. EU’s rural development policy at the regional level—Are expenditures for natural capital linked with territorial needs? Land Use Policy 2018, 77, 344–353. [Google Scholar] [CrossRef]
- Crescenzi, R.; De Filippis, F.; Pierangeli, F. Tandem for Cohesion? Synergies and Conflicts between Regional and Agricultural Policies of the European Union; LEQS Paper No.; London School of Economics: London, UK, 2011; p. 40. [Google Scholar]
- Bartkowiak-Bakun, N. Identyfikacja Potencjału Rozwoju Obszarów Wiejskich Województwa Wielkopolskiego na Poziomie Lokalnym w Celu Lepszego i Zrównoważonego Wykorzystania Posiadanych Zasobów. Ekspertyza Współfinansowana ze Środków UE w Ramach Schematu II Pomocy Technicznej KSOW PROW 2014–2020, 2019 Poznań. Available online: https://wes.up.poznan.pl/sites/default/files/PUBLIKACJE/Identyfikacja_N.Bartkowiak_BakunKSOW.pdf (accessed on 10 April 2022).
- Kiryluk-Dryjska, E.; Beba, P.; Poczta, W. Local determinants of the Common Agricultural Policy rural development funds’ distribution in Poland and their spatial implications. J. Rural Stud. 2020, 74, 201–209. [Google Scholar] [CrossRef]
- Wojewodzic, T. Czynniki różnicujące absorbcję wybranych działań PROW 2007–2013 w makroregionie Małopolska i Pogórze (Factors differentiating the absorption of selected RDP 2007–2013 measures in the macroregion Małopolska and Pogórze). Rocz. Nauk. Stowarzyszenia Ekon. Rol. I Agrobiz. 2017, 18, 290–295. [Google Scholar]
- Wicki, L. Regionalne zróżnicowanie realizacji działania ‘Modernizacja gospodarstw rolnych’ w ramach PROW 2007–2013 (Regional diversification of the implementation of the measure ‘Modernization of agricultural holdings’ under RDP 2007–2013). Polityki Eur. Finans. I Mark. 2015, 14, 147–160. [Google Scholar]
- Poczta, W.; Bartkowiak, N. Regionalne zróżnicowanie rolnictwa w Polsce (Regional diversification of agriculture in Poland). J. Agribus. Rural Dev. 2012, 1, 95–109. [Google Scholar]
- Clayton, D.G.; Kaldor, J. Empirical Bayesian estimates of age-standardized relative risks for use in disease mapping. Biometrics 1987, 43, 671–681. [Google Scholar] [CrossRef] [PubMed]
- Anselin, L. Local indicators of spatial association—LISA. Geogr. Anal. 1995, 27, 93–115. [Google Scholar] [CrossRef]
- Klepacka, A.M.; Klepacki, B. Warunki społeczno-gospodarcze a poziom rozwoju ekonomicznego na przykładzie województwa podlaskiego (Socio-economic conditions and the level of economic development on the example of Podlaskie Voivodeship). Rocz. Nauk. Stowarzyszenia Ekon. Rol. I Agrobiz. 2013, 15, 130–135. [Google Scholar]
- Przygodzka, R. Przedsiębiorczość na obszarach wiejskich województwa podlaskiego–wczoraj i dziś (Entrepreneurship in rural areas of Podlaskie Voivodeship—yesterday and today.). In Instytucjonalne i Strukturalne Aspekty Rozwoju Rolnictwa i Obszarów Wiejskich. Księga Poświęcona Pamięci dr Hab. Adama Sadowskiego Profesora Uniwersytetu w Białymstoku, Red. Nauk; Przygodzka, R., Gruszewska, E., Eds.; Wydawnictwo Uniwersytetu w Białymstoku: Białystok, Poland, 2020; pp. 339–361. [Google Scholar]
- Rural Development Strategy for the Podkarpackie Voivodeship by 2030, 2019, Rzeszów, Poland. Available online: http://www.sejmik.podkarpackie.pl/attachments/article/3367/strategia%20Rozwoju%20Wojew%C3%B3dztwa%20Podkarpackiego%202030.pdf (accessed on 23 March 2022).
- Głębocki, B. Zróżnicowanie Przestrzenne Rolnictwa; Główny Urząd Statystyczny: Warszawa, Poland, 2014.
- Nowak, A.; Kamińska, A.; Różańska-Boczula, M. Przestrzenne zróżnicowanie potencjału produkcyjnego rolnictwa w Polsce (Spatial differentiation of the production potential of agriculture in Poland). Pr. Nauk. Uniw. Ekon. We Wrocławiu Ekon. 2014, 347, 363–372. [Google Scholar]
- Łukiewska, K.; Chrobocińska, K. Przestrzenne zróżnicowanie potencjału produkcyjnego rolnictwa w Polsce (Spatial differentiation of the production potential of agriculture in Poland). Rocz. Nauk. Ekon. Rol. I Rozw. Obsz. Wiej. 2015, 102, 56–65. [Google Scholar]


| Global Moran Results | ||
|---|---|---|
| Moran Global Index | p-Value | |
| Young farmer | 0.618 | <0.001 |
| Modernization of farms | 0.501 | <0.001 |
| Diversification | 0.488 | <0.001 |
| Micro-enterprises | 0.218 | <0.001 |
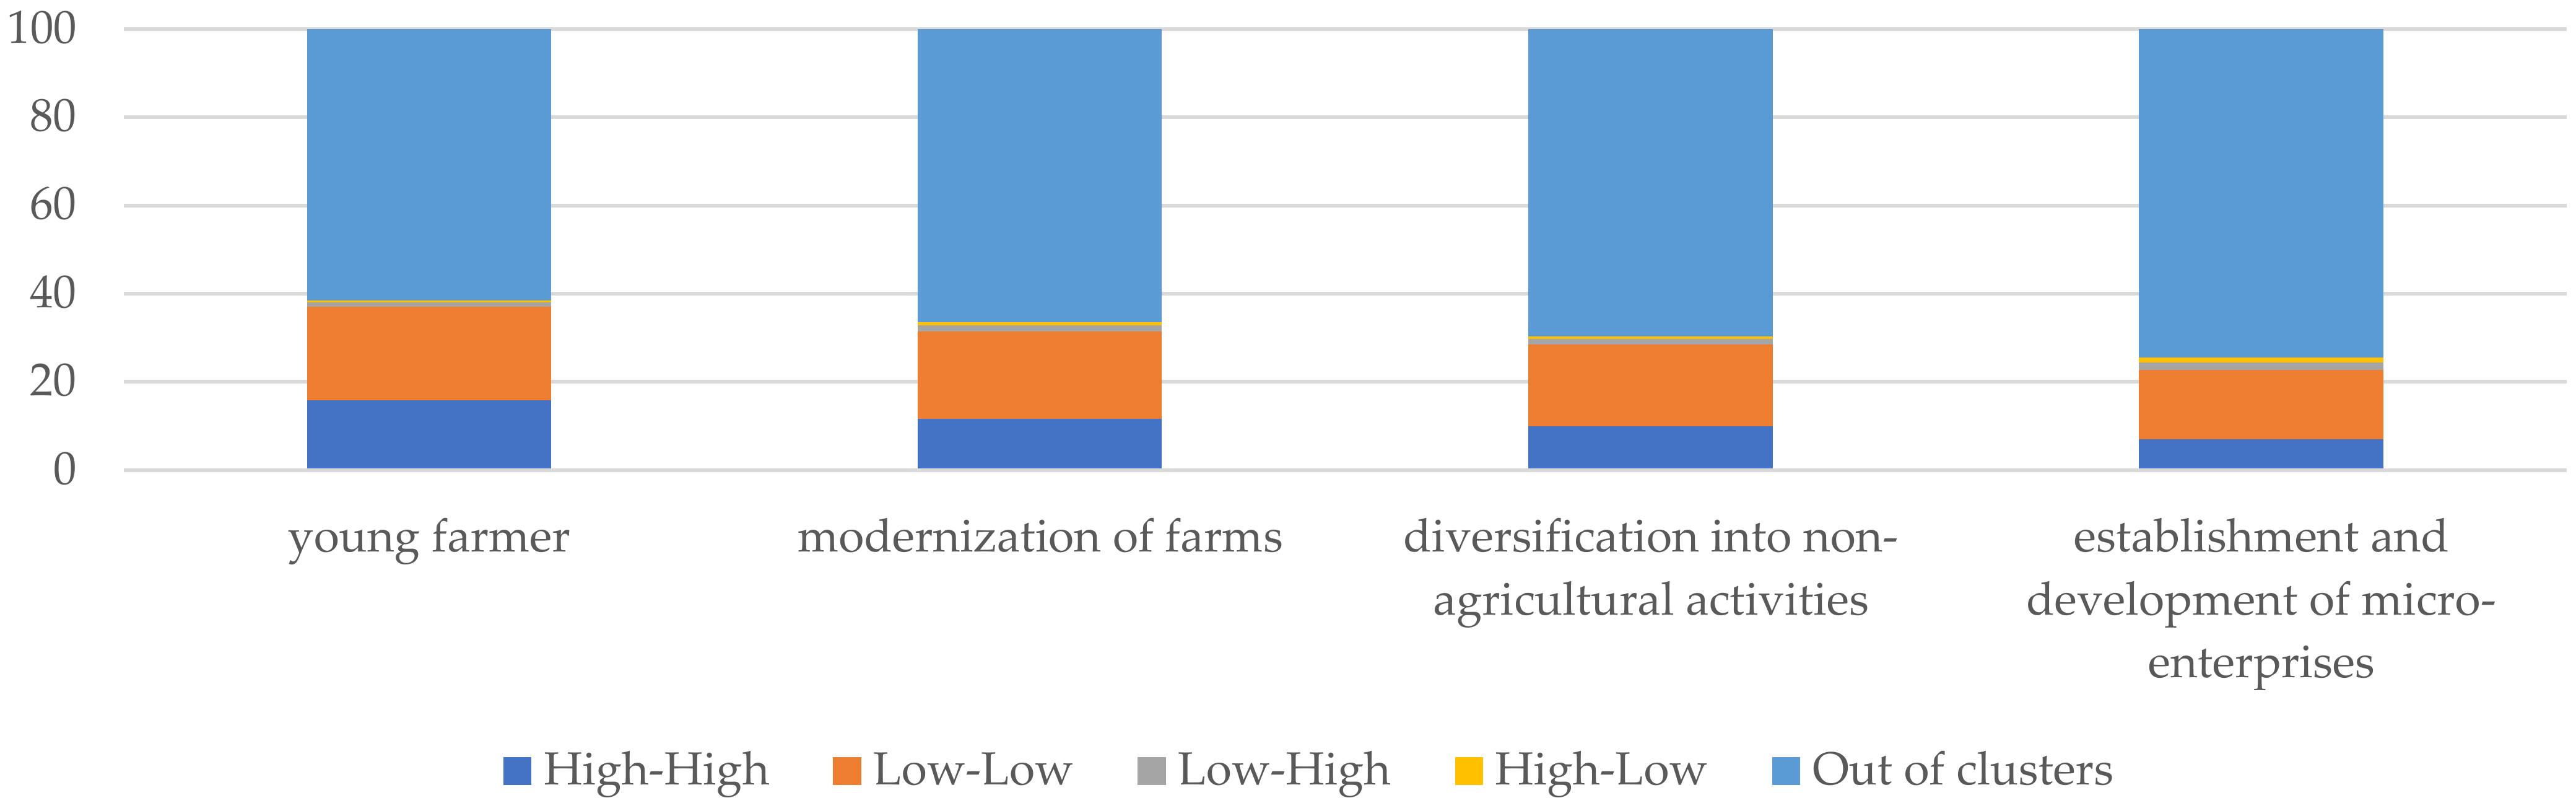
| High-High and High-Low | Low-Low and Low-High | ||
|---|---|---|---|
| High | Low | Out-of-Cluster | |
| Young farmer | 351 (16.4%) | 474 (22.1%) | 1317 (61.5%) |
| Modernization of farms | 264 (12.3%) | 454 (21.2%) | 1424 (66.5%) |
| Diversification | 225 (10.5%) | 424 (19.8%) | 1493 (69.7%) |
| Micro-enterprises | 174 (8.1%) | 374 (17.5%) | 1594 (74.4%) |
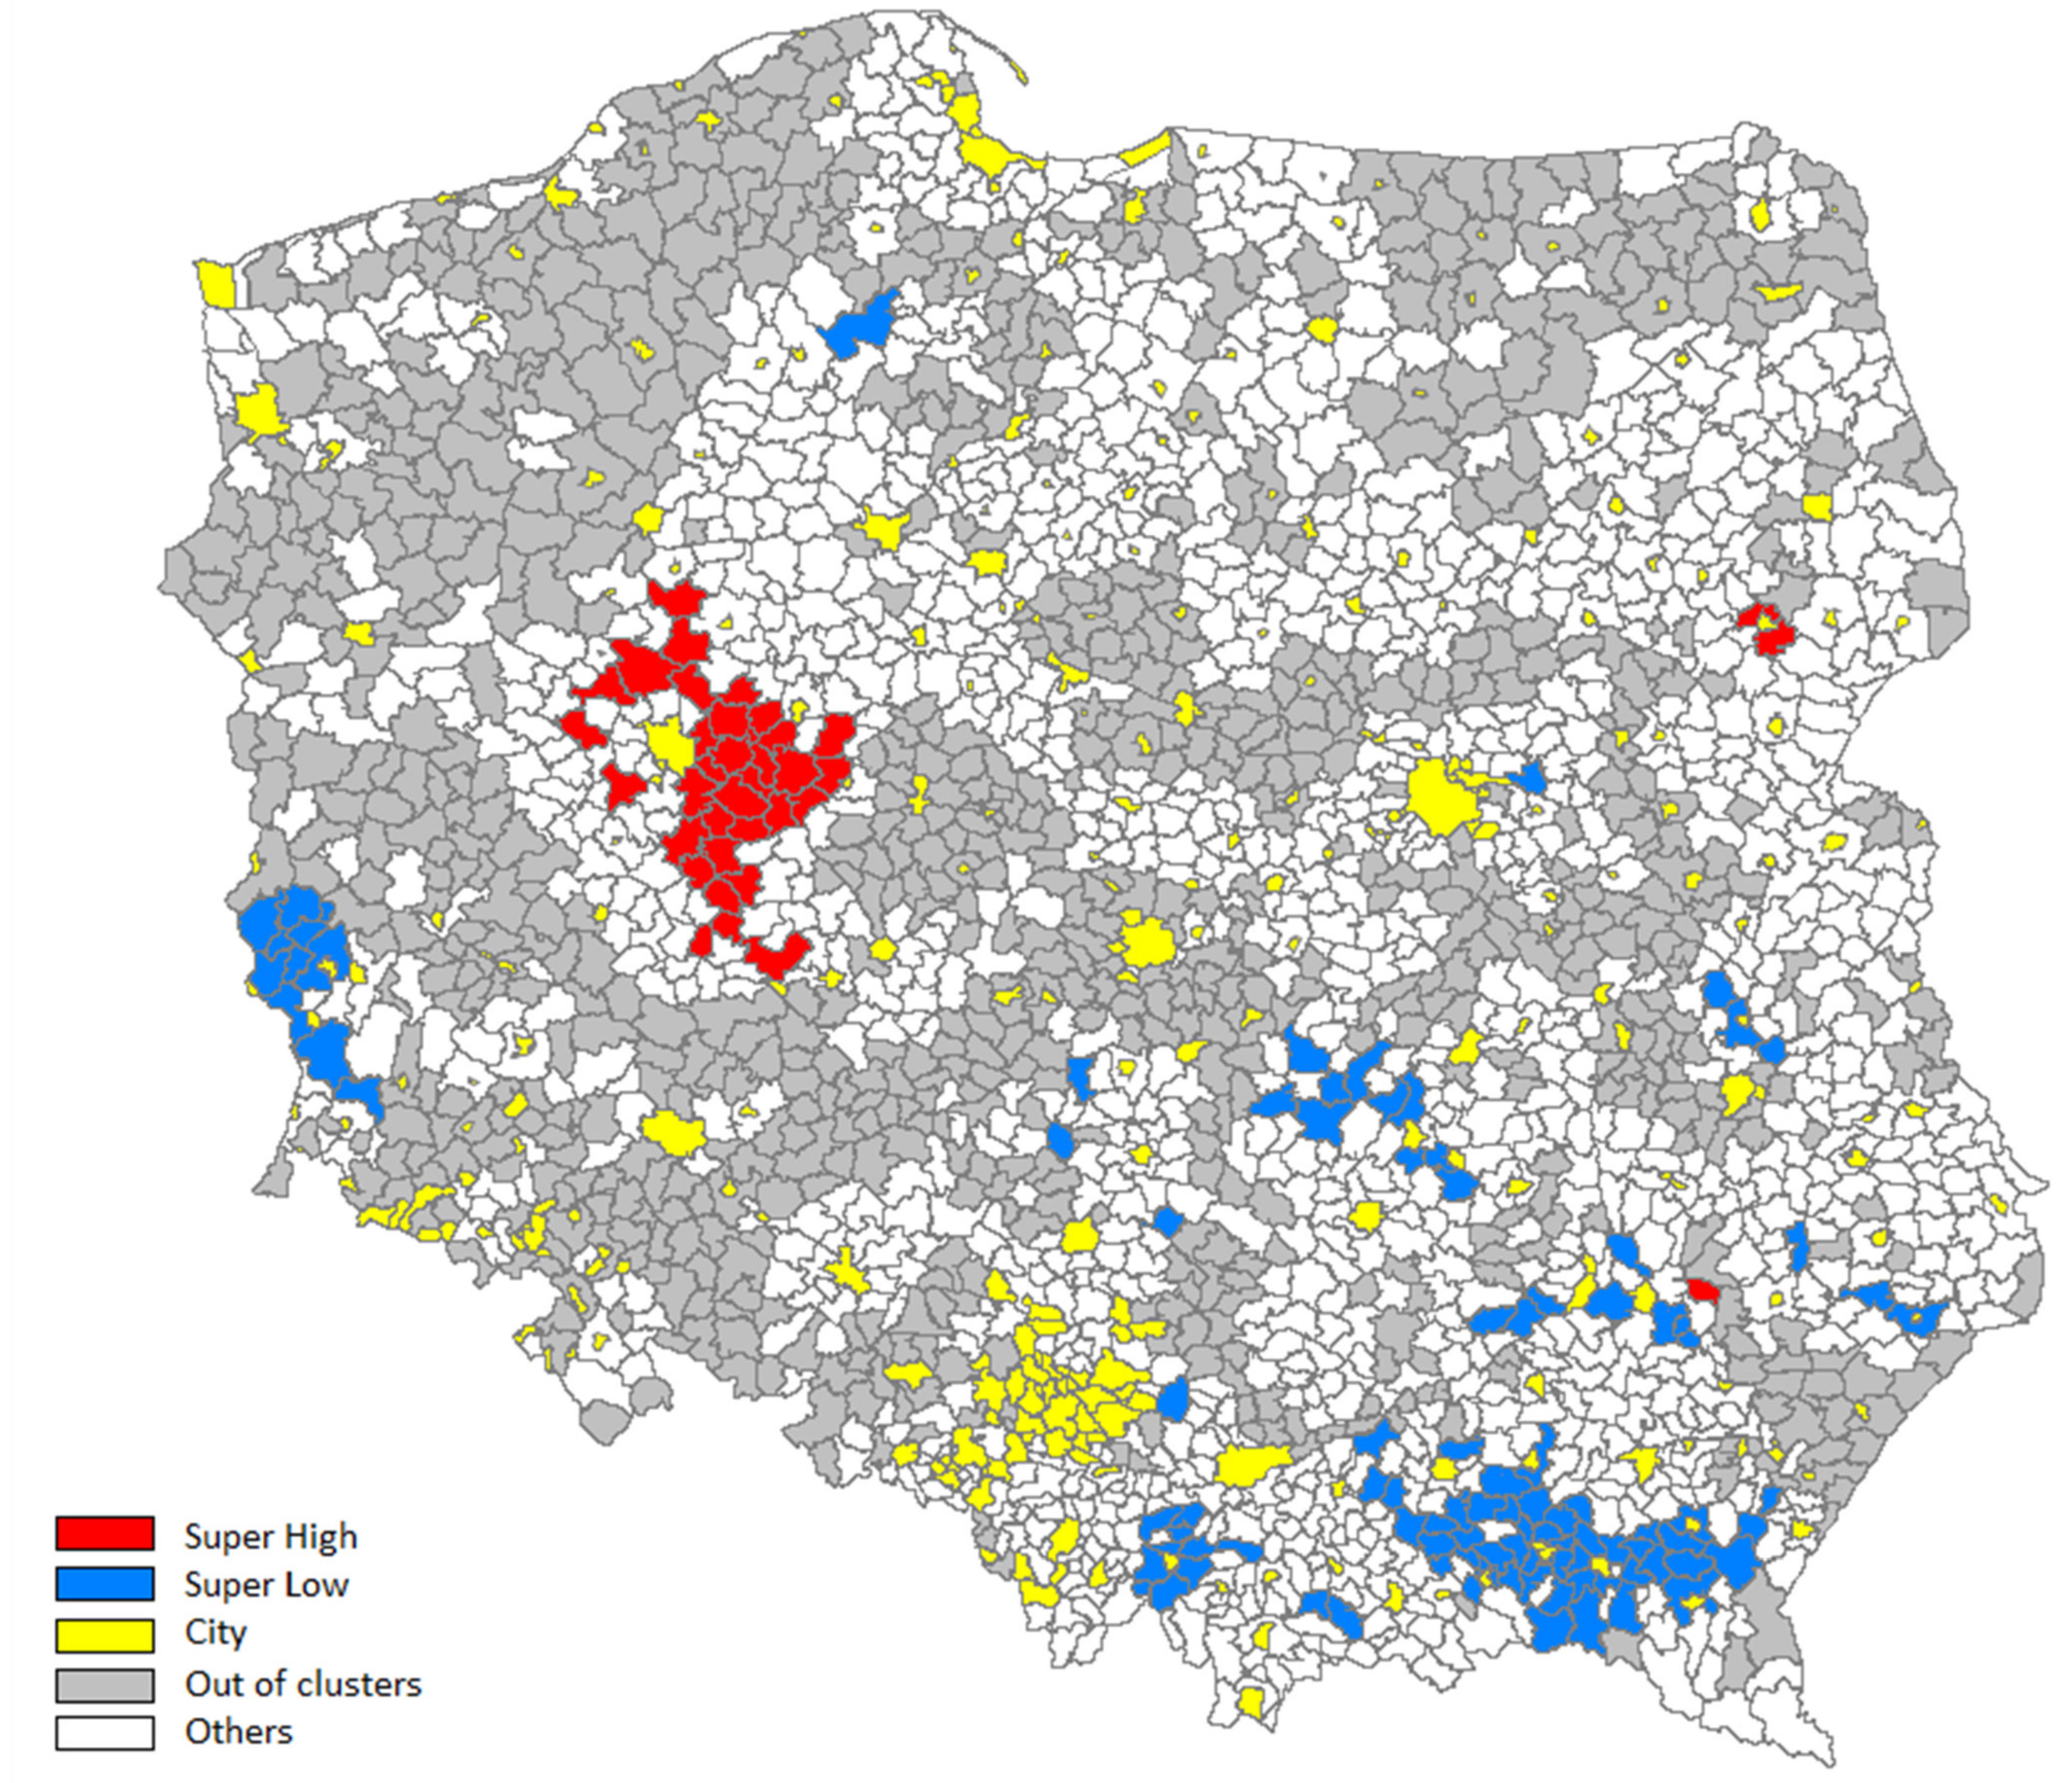
| Variable: Total Clusters | Count | % |
|---|---|---|
| Super Low (Low under four measures) | 98 | 4.6 |
| No Cluster | 826 | 38.6 |
| Super High (High under four measures) | 35 | 1.6 |
| Others (High and/or Low cluster in specific measures) | 1183 | 55.2 |
| Synthetic Factors | Municipality Group | Median (Q1–Q2) | Dunn–Bonferroni Post-Hoc | ||
|---|---|---|---|---|---|
| Super High vs. Super Low | Super High vs. out of Cluster | Super Low vs. out of Cluster | |||
| Farm structure | Super High | 0.73 (0.27; 1.15) | <0.0001 | <0.0001 | 0.1953 |
| Super Low | −0.21 (−0.55; −0.02) | ||||
| Out of cluster | −0.20 (−0.69; 0.77) | ||||
| Infrastructure | Super High | 0.23 (−0.11; 0.65) | 1.0000 | <0.0001 | <0.0001 |
| Super Low | 0.68 (−0.40; 1.43) | ||||
| Out of cluster | −0.38 (−0.66; −0.06) | ||||
| Organic agriculture | Super High | −0.70 (−0.94; −0.49) | 0.0026 | <0.0001 | 0.0003 |
| Super Low | −0.365 (−0.72; 0.04) | ||||
| Out of cluster | −0.16 (−0.45; 0.34) | ||||
| Demography | Super High | 0.55 (0.13; 1.00) | 0.0034 | 0.0002 | 1.0000 |
| Super Low | 0.04 (−0.38; 0.49) | ||||
| Out of cluster | −0.02 (−0.58; 0.57) | ||||
| Animal production | Super High | 1.49 (1.17; 2.21) | <0.0001 | <0.0001 | <0.0001 |
| Super Low | −0.99 (−1.13; −0.81) | ||||
| Out of cluster | −0.25 (−0.70; 0.32) | ||||
| Entrepreneurship | Super High | 0.45 (−0.04; 1.50) | <0.0001 | 0.0019 | <0.0001 |
| Super Low | −0.55 (−1.14; 0.08) | ||||
| Out of cluster | −0.01 (−0.51; 0.53) | ||||
| Agricultural land greening | Super High | 0.35 (−0.06; 0.6) | <0.0001 | 1.0000 | <0.0001 |
| Super Low | −1.07 (−1.39; −0.45) | ||||
| Out of cluster | 0.21 (−0.28; 0.77) | ||||
| Features | Municipality Group | |||
|---|---|---|---|---|
| Super Low | Super High | Out of Cluster | ||
| Features related to agricultural structures and production | ||||
| Share of utilized agricultural area belonging to farms with 5 or less hectares (%) | 60.1 | 5.6 | 22.5 | |
| Share of utilized agricultural area belonging to farms with 15 or more hectares (%) | 16.2 | 74.8 | 46.6 | |
| Average farm size (hectares) | 3.7 | 20.3 | 11.0 | |
| Average herd size in a farm (in large heads) | 1.2 | 18.4 | 6.0 | |
| Number of tractors per 1 farm | 0.4 | 1.3 | 0.8 | |
| Area of agricultural land per 1 tractor (hectares) | 8.0 | 14.1 | 12.5 | |
| Consumption of NPK fertilizers per 1 farm (in dt) | 2.9 | 38.1 | 19.5 | |
| Average sown area per farm (hectares) | 1.3 | 16.3 | 6.7 | |
| Share of industrial crops in total sown area (%) | 2.3 | 14.6 | 7.9 | |
| Organic faming | ||||
| Share of organic farms among total farms (%) | 0.7 | 0.5 | 1.1 | |
| Share of organic farms within total farm area (%) | 2.5 | 1.1 | 2.3 | |
| Infrastructure | ||||
| Primary schools (per 100 km2) | 6.9 | 3.6 | 3.9 | |
| Length of the water supply network (km per 100 km2) | 73.0 | 113.1 | 100.0 | |
| Length of the sewage network (km per 100 km2) | 77.9 | 51.1 | 44.3 | |
| Population connected to wastewater treatment plants in % of population | 47.4 | 63.6 | 52.7 | |
| Length of the gas supply network (km per 100 km2) | 106.0 | 62.6 | 45.5 | |
| Population connected to gas supply network in % of population | 43.7 | 37.0 | 19.0 | |
| Population per 1 km2 | 111.0 | 98.8 | 79.5 | |
| Demography | ||||
| Age dependency rate | 97.9 | 81.3 | 100.0 | |
| Live births per 1000 women | 39.8 | 46.9 | 41.4 | |
| Entrepreneurship | ||||
| Entities of the national economy per 1000 people | 66.8 | 98.1 | 74.1 | |
| Entities of the national economy per 1000 people at working age | 106.3 | 155.9 | 118.3 | |
| Agriculture land greening | ||||
| Relation of forested land to agricultural land | 0.2 | 0.0 | 0.1 | |
| Agricultural production space valorization index | 65.3 | 69.3 | 66.1 | |
| Region | Modernization of Farms | Young Farmer | Starting Non-Agricultural Activities | Entrepreneurship | Producers Groups |
|---|---|---|---|---|---|
| Dolnoslaskie | 20.06 | 7.49 | 1.79 | 0.67 | 1.61 |
| Kujawsko-Pomorskie | 29.08 | 21.43 | 2.47 | 1.53 | 1.15 |
| Lubelskie | 14.90 | 13.02 | 5.33 | 0.33 | 0.14 |
| Lubuskie | 25.99 | 7.37 | 3.30 | 2.30 | 1.39 |
| Łodzkie | 16.51 | 11.65 | 2.68 | 0.73 | 0.74 |
| Malopolskie | 6.84 | 5.53 | 2.85 | 0.20 | 0.06 |
| Mazowieckie | 11.00 | 13.65 | 2.75 | 0.68 | 0.33 |
| Opolskie | 24.83 | 15.29 | 1.33 | 1.29 | 3.65 |
| Podkarpackie | 5.84 | 2.33 | 2.95 | 0.28 | 0.28 |
| Podlaskie | 29.53 | 21.47 | 3.16 | 1.06 | 0.29 |
| Pomorskie | 24.03 | 15.93 | 3.59 | 1.84 | 1.15 |
| Slaskie | 9.43 | 4.78 | 2.30 | 0.81 | 0.26 |
| Swietokrzyskie | 14.11 | 11.43 | 4.04 | 0.31 | 0.07 |
| Warminsko-Mazurskie | 33.09 | 18.09 | 5.09 | 2.38 | 1.25 |
| Wielkopolskie | 17.48 | 17.58 | 3.96 | 2.03 | 3.26 |
| Zachodniopomorskie | 33.81 | 10.71 | 3.04 | 1.84 | 0.70 |
Publisher’s Note: MDPI stays neutral with regard to jurisdictional claims in published maps and institutional affiliations. |
© 2022 by the authors. Licensee MDPI, Basel, Switzerland. This article is an open access article distributed under the terms and conditions of the Creative Commons Attribution (CC BY) license (https://creativecommons.org/licenses/by/4.0/).
Share and Cite
Kiryluk-Dryjska, E.; Więckowska, B.; Smolińska, K. Winners and Losers of the CAP’s Rural Development Policy in Poland. Agriculture 2022, 12, 676. https://doi.org/10.3390/agriculture12050676
Kiryluk-Dryjska E, Więckowska B, Smolińska K. Winners and Losers of the CAP’s Rural Development Policy in Poland. Agriculture. 2022; 12(5):676. https://doi.org/10.3390/agriculture12050676
Chicago/Turabian StyleKiryluk-Dryjska, Ewa, Barbara Więckowska, and Kinga Smolińska. 2022. "Winners and Losers of the CAP’s Rural Development Policy in Poland" Agriculture 12, no. 5: 676. https://doi.org/10.3390/agriculture12050676
APA StyleKiryluk-Dryjska, E., Więckowska, B., & Smolińska, K. (2022). Winners and Losers of the CAP’s Rural Development Policy in Poland. Agriculture, 12(5), 676. https://doi.org/10.3390/agriculture12050676