Article

RZWQM2 Simulated Drip Fertigation Management to Improve Water and Nitrogen Use Efficiency of Maize in a Solar Greenhouse

1
School of Environmental Science and Engineering, Yangzhou University, Yangzhou 225127, China
2
School of Hydraulic Science and Engineering, Yangzhou University, Yangzhou 225127, China
3
Department of Agricultural Engineering, Faculty of Agricultural Technology and Fish Sciences, Al-Neelain University, Khartoum 12702, Sudan
4
Department of Bioresource Engineering, McGill University, Sainte-Anne-de-Bellevue, QC H9X 3V9, Canada
*
Author to whom correspondence should be addressed.
Agriculture 2022, 12(5), 672; https://doi.org/10.3390/agriculture12050672
Submission received: 20 March 2022 / Revised: 28 April 2022 / Accepted: 6 May 2022 / Published: 8 May 2022
(This article belongs to the Special Issue Precision Water Management in Dryland Agriculture)

Abstract

:
The drip fertigation technique is a modern, efficient irrigation method to alleviate water scarcity and fertilizer surpluses in crop production, while the precise quantification of water and fertilizer inputs is difficult for drip fertigation systems. A field experiment of maize (Zea mays L.) in a solar greenhouse was conducted to meet different combinations of four irrigation rates (I125, I100, I75 and I50) and three nitrogen (N) fertilizer rates (N125, N100 and N75) under surface drip fertigation (SDF) systems. The Root Zone Water Quality Model (RZWQM2) was used to assess the response of soil volumetric water content (VWC), leaf area index (LAI), plant height and maize yield to different SDF managements. The model was calibrated by the I100N100 scenario and validated by the remaining five scenarios (i.e., I125N100, I75N100, I50N100, I100N125 and I100N75). The predictions of VWC, LAI and plant height were satisfactory, with relative root mean square errors (RRMSE) < 9.8%, the percent errors (PBIAS) within ±6%, indexes of agreement (IoA) > 0.85 and determination of coefficients (R2) > 0.71, and the relative errors (RE) of simulated yields were in the range of 1.5–7.2%. The simulation results showed that both irrigation and fertilization had multiple effects on water and N stresses. The calibrated model was subsequently used to explore the optimal SDF scenarios for maximizing yield, water use efficiency (WUE) or nitrogen use efficiency (NUE). Among the SDF managements of 21 irrigation rates × 31 N fertilizer rates, the optimal SDF scenarios were I120N130 for max yield (10516 kg/ha), I50N70 for max WUE (47.3 kg/(ha·mm)) and I125N75 for max NUE (30.2 kg/kg), respectively. The results demonstrated that the RZWQM2 was a promising tool for evaluating the effects of SDF management and achieving optimal water and N inputs.

1. Introduction

Increasing water scarcity is one of the world’s most widespread concerns affecting agricultural production [1]. It was estimated that about 24% and 27% of the total agricultural area suffer high and very high agricultural drought hazard zones in the world, respectively [2]. Improving water use efficiency (WUE) is essential for alleviating water shortages. Besides water use, fertilizer remains another critical input determining crop root development and plant growth. However, fertilizer use efficiency is low all over the world, and fertilizers are lost at 40–70% (Nitrogen), 80–90% (Phosphorous) and 50–90% (Potassium) [3,4,5]. The excess fertilizer can cause the augmentation of nutrient pollution in soil and groundwater through leaching and runoff. Therefore, it is of practical significance to improve both water and fertilizer use efficiency in agricultural production.
The drip fertigation technique is a modern innovative irrigation method, which is verified to be an efficient irrigation method for reducing both water and fertilizer use [6,7]. This technique applies water and fertilizer in small quantities precisely at the crop root zone through a drip fertigation system. In the past decade, there has been growing interest in applying drip fertigation to lower value field crops, such as maize and cotton [8]. It was reported that drip fertigation could raise WUE by 30–40% [9] and improve nitrogen use efficiency (NUE) by ~29%, compared to traditional flood irrigation and fertilization [10]. However, the effect of drip fertigation on crop growth parameters seems to be not stable, e.g., leaf area index, plant height and yield. Zhou et al. [11] reported that leaf area index (LAI) affected by drip fertigation increased by 7–65%. Lamm et al. [8] summarized a number of maize experiments and demonstrated that maize yields with drip fertigation ranged widely from −51% to 30%, with an average positive increase of 4%, compared to other alternative irrigation systems. These large variations might be mainly because the management practices of water and fertilizers in drip fertigation were difficult to design accurately, e.g., water and fertilizer rates and irrigation scheduling [12,13]. A precise decision about water and fertilizer inputs is the key issue for increasing WUE and NUE without yield penalties.
Agricultural decision support tools are very useful for water and fertilizer decision-making, such as RZWQM2, DSSAT, WOFOST, APSIM, SWAP, and AquaCrop [14,15]. They need to simulate crop responses to water, and nutrient stresses precisely by integrating the physical, biological and chemical processes of an agricultural system [15,16]. Among them, the RZWQM2 (Root Zone Water Quality Model) was selected in this paper for the following reasons: (1) process-oriented model based on highly frequent spatial and temporal measurements of the driving variables, (2) DSSAT was coupled with RZWQM2, which provided a complete set of biophysical crop models when simulating crop growth and development and (3) RZWQM2 had advanced capabilities for evaluating limited irrigation strategies, such as time-segment water distribution limitations, evapotranspiration (ET) and soil water deficit-based irrigation plants [17]. Previous studies have shown the effectiveness of RZWQM2 on the simulation of the drip-irrigated field [18,19,20]. Qi et al. [18] simulated full and deficit irrigation by RZWQM2 and accurately predicted the dates of water stress occurrence and the responses of grain yield (error ≤5%), LAI, soil water content and daily ET with coefficients of determination (R2) ≥ 0.64 and model efficiencies (ME) ≥ 0.57. Gu et al. [19] applied a water stress-based irrigation scheduling in a drip-irrigated maize field by using RZWQM2 and provided water savings of as much as 16–35% with a negligible change in grain yield; about 0.03–3.81% decrease. Then, Chen et al. [20] and Zhang et al. [21] applied RZWQM2 to simulate the effects of drip irrigation rates and scheduling on maize phenology and investigated the optimum irrigation strategy with a maximum of 50% water savings. Other similar studies also suggested that the water stress-based irrigation regimes might save water use without yield penalty [22,23]. Meanwhile, the combined application of water and fertilizer in a drip fertigation system has multiple effects on water and nutrient distribution in the soil, which, therefore, influenced plant uptake and growth [24,25]. Thus, it is important to comprehensively consider both water and nitrogen (N) stress for exploring optimal irrigation and fertilization regimes in drip fertigation systems.
The objective of this study was to (1) test the performance of RZWQM2 in simulating soil volumetric water content (VWC), leaf area index (LAI), plant height, and maize yield under a series of surface drip fertigation (SDF) practices in a solar greenhouse; (2) evaluate the effects of irrigation and N fertilizer rates in a drip fertigation system on water and N stresses; (3) determine the optimal SDF managements for maximizing yield, WUE and NUE by using the calibrated model.

2. Materials and Methods

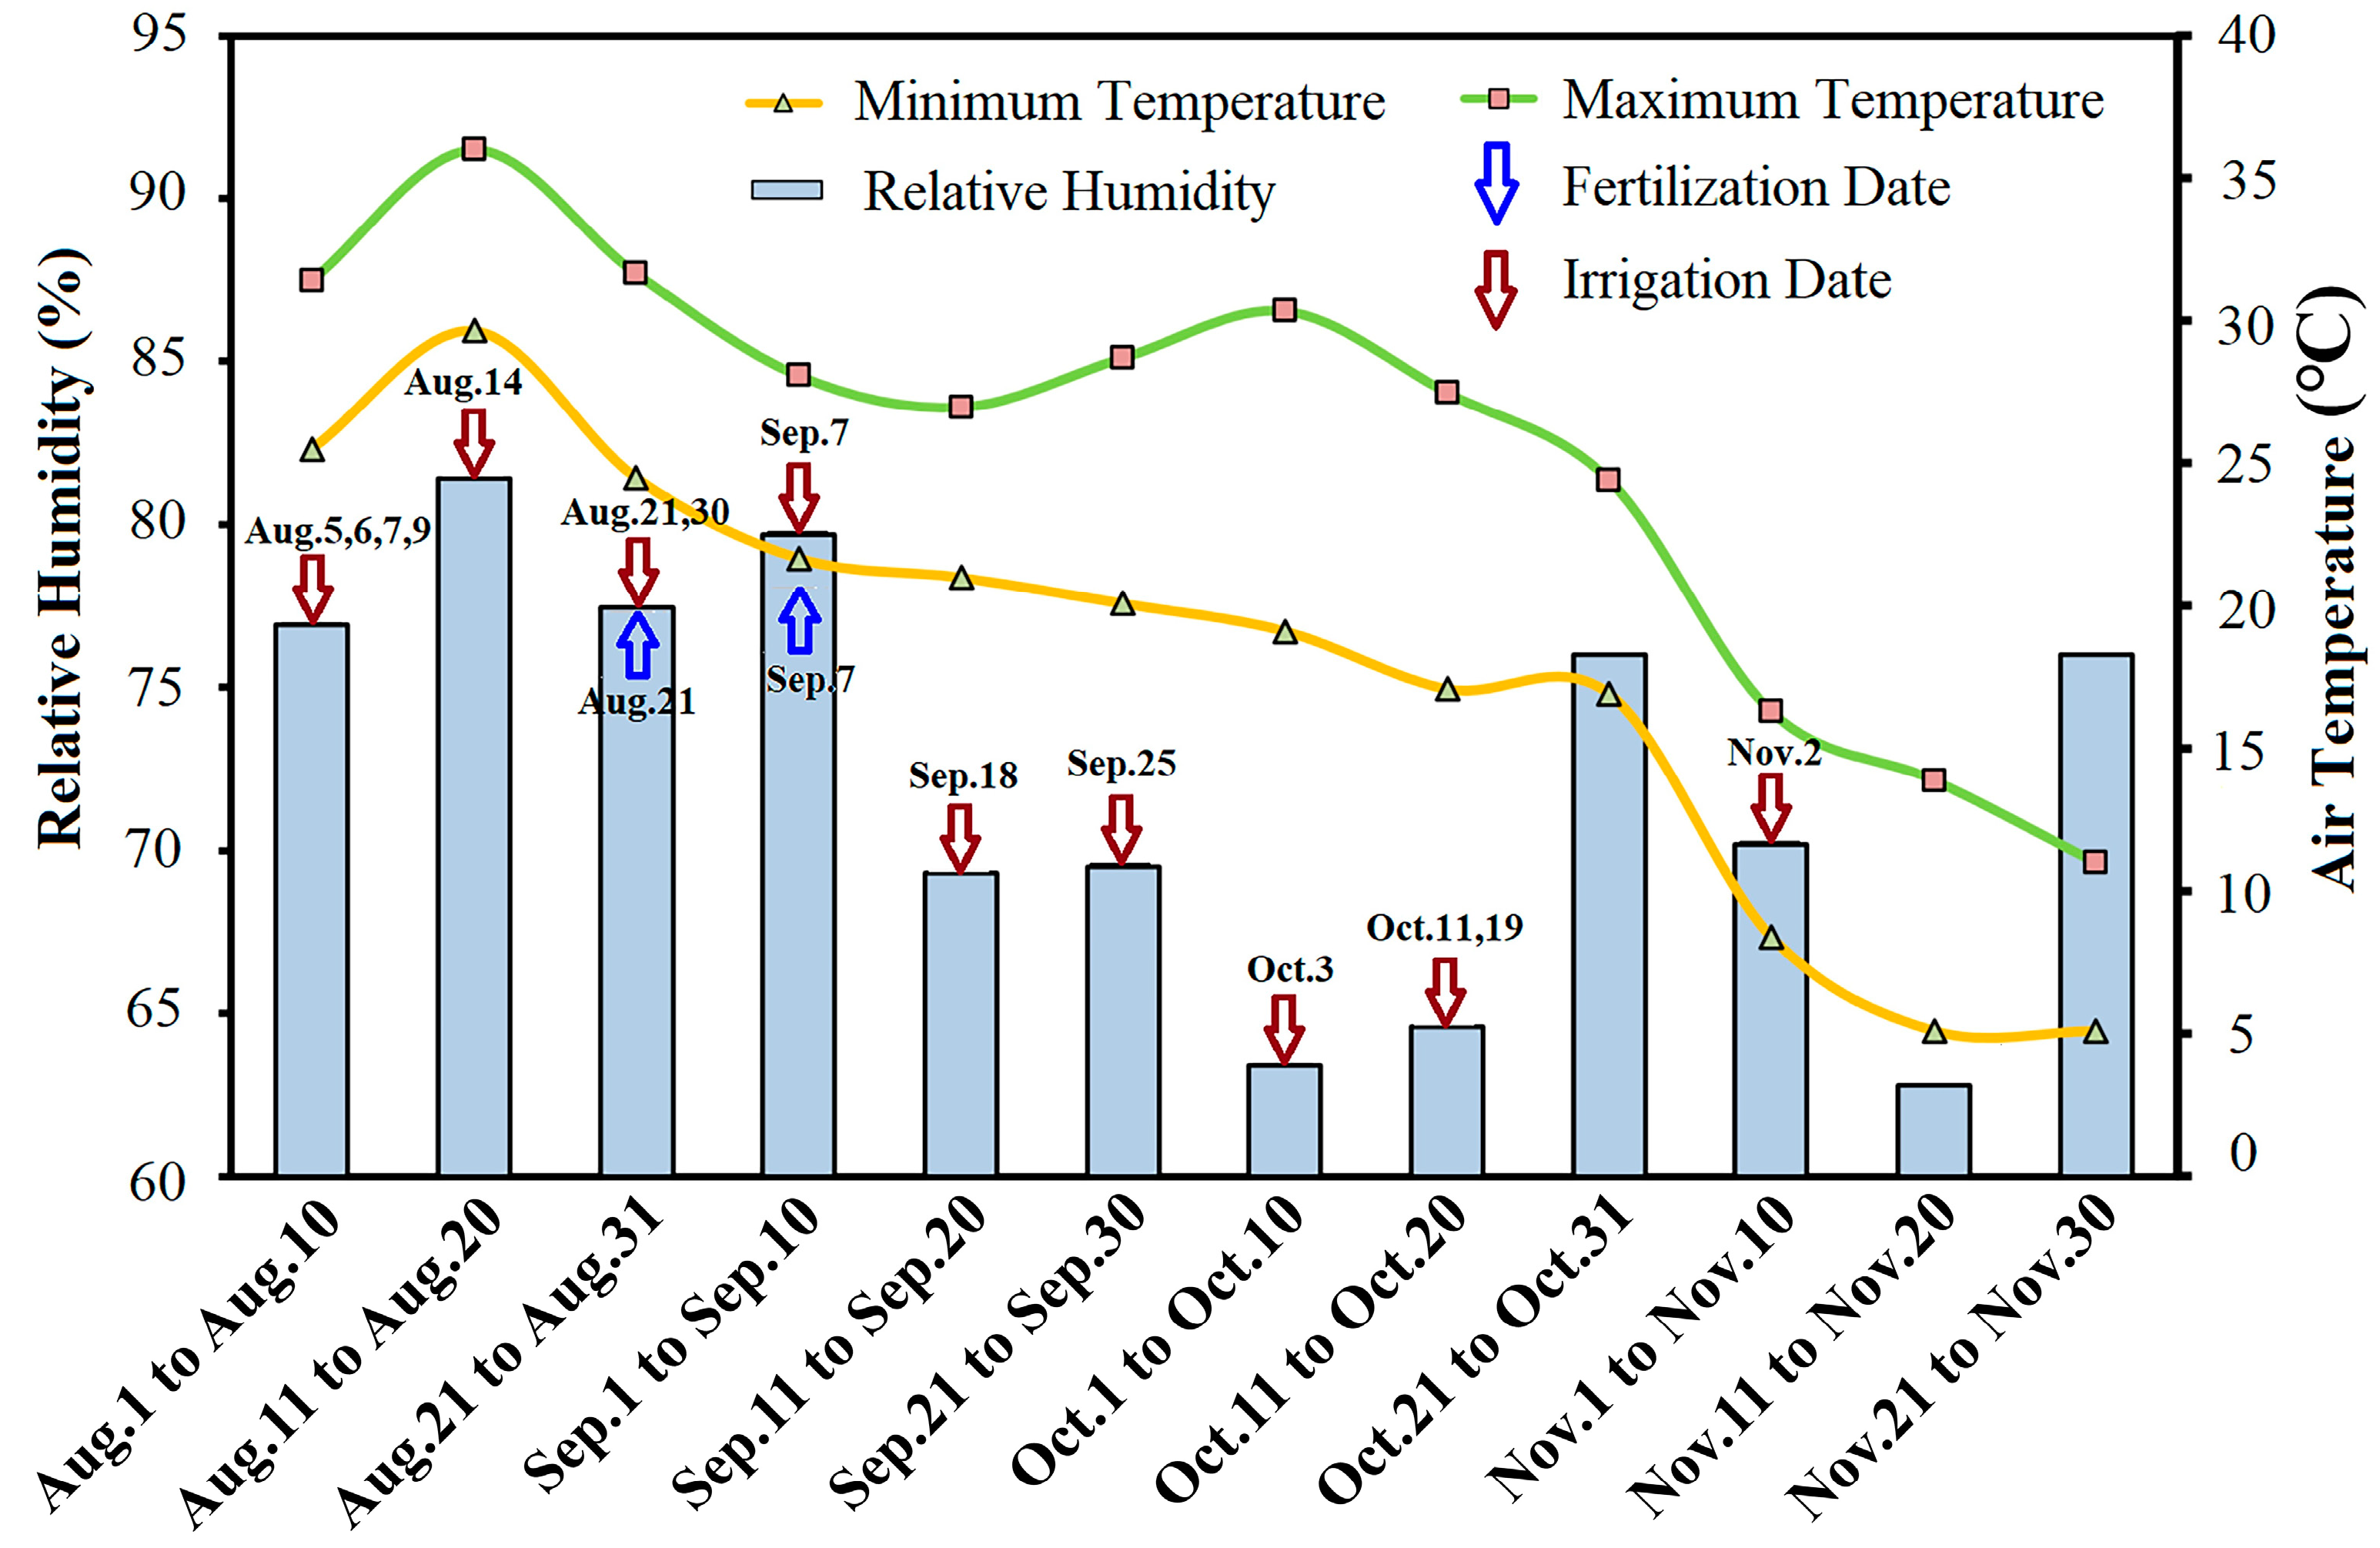
2.1. Experimental Data

The field experiment data were obtained during the 2012 growing season of maize (Zea mays L.) from 3 August to 5 November in a solar greenhouse at the Yangzhou University (32°23′ N, 119°25′ E) in Yangzhou, China. The climate in this area is a subtropical monsoon climate with an average altitude of 3.5 m and an average annual temperature of 15 °C. The soil type at this site is sandy loam, and the soil physicochemical properties are detailed in Table S1 (Supplementary Materials).
The field experiment was conducted with six surface drip fertigation (SDF) scenarios. The greenhouse layout and the experimental design of the field experiment are shown in Figure S1 (Supplementary Materials). Each scenario had four parallel and randomly arranged in a completely random design. Detailed information on the field experiment was reported in our previous study [26]. Briefly, a combination of four irrigation rates and three nitrogen (N) fertilizer rates were tested with SDF systems. The six scenarios in SDF systems applied were as follows: (1) the irrigation rate was set as 125% crop potential evapotranspiration (ET) and the N fertilizer rate was set as 100% local official recommended dose (LOD), named I125N100; (2) 100% ET and 100% LOD, named I100N100; (3) 75% ET and 100% LOD, named I75N100; (4) 50% ET and 100% LOD, named I50N100; (5) 100% ET and 125% LOD, named I100N125; (6) 100% ET and 75% LOD, named I100N75. Each scenario applied the same scheduling of irrigation and fertilization. The amounts and scheduling of irrigation and N fertilization in each scenario are shown in Table 1 and Figure 1.
Soil volumetric water contents (VWC) were measured at seven soil depths (viz., 0–5, 5–15, 15–25, 25–35, 35–45, 45–55, 55–65 cm) according to the weighing method. The leaf area index (LAI) was obtained by measuring the length and width of the leaf sample with a tape. The plant height was determined by weekly measurements of the distance from the ground to the tallest leaf. To estimate the yield in each scenario, randomly selected samples were weighed to obtain mean values and calculated per hectare. The crop samples for LAI, plant height and yield measurement were all measured in sextuplicate. Further, air temperature and relative humidity were determined by ventilated psychrometers (wet and dry bulb) (model VP1, Delta-T Devices, Cambridge, England), solar radiation was determined by pyranometers (model Middleton EP08-E, Brunswick Victoria, Australia).

2.2. Modeling

2.2.1. RZWQM2 Description

The RZWQM2 model (current version 4.2) coupled with the DSSAT (version 4.0) modules was applied in this study. The unsaturated soil water flow and redistribution in this model were simulated using the Richards equation [17]. The soil moisture retention curve is corrected by the Brooks–Corey equations [28]. The Shuttleworth–Wallace (S–W) ET model is used to calculate the atmosphere ET demand. The S–W ET model is an extension of the Penman–Monteith equation, but the former takes into account incomplete canopy cover and plant height in ET estimations. Plant water uptake was calculated using the Nimah–Hanks equation [29]. The water stress factor (WSF) is the indicator of water deficiency by calculating photosynthesis and factors of dry matter accumulation processes. Based on the ratio of root water uptake to ET, the formula for WSF is calculated as [30]:
WSF = ( R U ( L ) R L D ( L ) L ) / T p
where RU (L) and RLD (L) are the potential root uptake per unit root length and the root length density in soil layer L, respectively; L is the depth of the soil layer (cm); Tp is the potential transpiration (cm). WFS = 1 indicates no water stress, and WFS < 1 indicates some water stress.
The nitrogen stress factor (NSF) is used to simulate the effect of N shortages on plant growth processes, which is calculated as [17]:
NSF = ( A N C M N C ) / ( C N C M N C )
where CNC and MNC are the critical and minimum N concentrations (N-g/g); ANC is the actual N concentration (N-g/g). NFS ranges from 1 for no stress to 0 for complete stress.

2.2.2. Model Calibration and Validation

The RZWQM2 was employed to calibrate and validate against measured VWC, LAI, plant height and grain yield under the six SDF scenarios in the field experiment. The model was calibrated with data collected from the I100N100 scenario. The remaining five scenarios (i.e., I125N100, I75N100, I50N100, I100N125 and I100N75) were used to validate the model.
The daily weather data needed to run the model were obtained from the sensors in the solar greenhouse, which included min/max air temperature, relative humidity and solar radiation. The wind speed and precipitation in the solar greenhouse were set to zero in the model. The 180-cm-deep soil profile used in this model was divided into 10 horizons: 0–5, 5–15, 15–25, 25–35, 35–45, 45–55, 55–65, 65–100, 100–150 and 150–180 cm. The initial bulk density, particle size distribution and organic matter in the soil profile were set to the observations. The soil hydraulic parameters were calibrated based on the observed VWC data, as shown in Table 2. Moreover, the plant parameters were manually adjusted to fit the observed LAI, plant height and grain yield, as shown in Table 3.

2.2.3. Model Accuracy Statistics

Four statistics were used to evaluate the performance of RZWQM2 in simulating VWC, LAI and plant height relative to observations: relative root mean square error (RRMSE), the percent error (PBIAS), index of agreement (IoA) and determination of coefficient (R2). The calculation formulae are as follows:
RRMSE = 1 n i = 1 n ( O i P i ) 2 / O ¯
PBIAS = 100 i = 1 n ( O i P i ) / i = 1 n O i
IoA = 1 i = 1 n ( O i P i ) 2 / i = 1 n ( | P i P ¯ | + | O i O ¯ | ) 2
R 2 = [ i = 1 n ( O i O ¯ ) ( P i P ¯ ) ] 2 / i = 1 n ( O i O ¯ ) 2 i = 1 n ( P i P ¯ ) 2
where n is the number of observations, Oi and Pi are the measured and simulated values, respectively. O ¯ and P ¯ are the average measured and simulated values, respectively. Model performance is considered acceptable if RRMSE <30%, −15% < PBIAS < 15%, IoA > 0.7 and R2 > 0.7 [31,32]. Due to the relatively low number of grain yield values per scenario combination, the relative error (RE) was used to evaluate the model accuracy, which was calculated as RE = (PiOi)/Oi [33]. A Wilcoxon test was used to evaluate the statistical difference between the observed or simulated results of six scenarios. A p-value < 0.05 was considered statistically significant.

2.2.4. Quantification of Surface Drip Fertigation Management Effects using RZWQM

It is important for policymakers and decision-makers to predict the effects of SDF practices on yield, WUE and NUE. After calibrating and validating RZWQM2 with experimental data, the 21 × 31 SDF scenarios with different combinations of irrigation and fertilization practices were investigated by using RZWQM2: (i) 21 irrigation rates from 50% to 150% ET at 5% ET interval in SDF management; (ii) 31 N fertilization rates from 0% to 150% LOD at 5% LOD interval in SDF management. The WUE and NUE in these SDF scenarios were quantified as follows:
WUE = y i e l d / ( I M + Δ S W )
NUE = ( y i e l d N R y i e l d N R = 0 ) / ( N A + Δ S N )
where WUE (kg/(ha·mm)) and NUE (kg/kg) are the water use efficiency and the N use efficiency, respectively. IM (mm) and NA (kg/ha) are the total irrigation amount and total N fertilizer amount, respectively. △SW (mm) and △SN (kg/ha) are the difference between water and N stored in the soil between planting and harvest, respectively. The total consumed nitrogen (TCN) is the sum of NA and △SN.

3. Results and Discussion

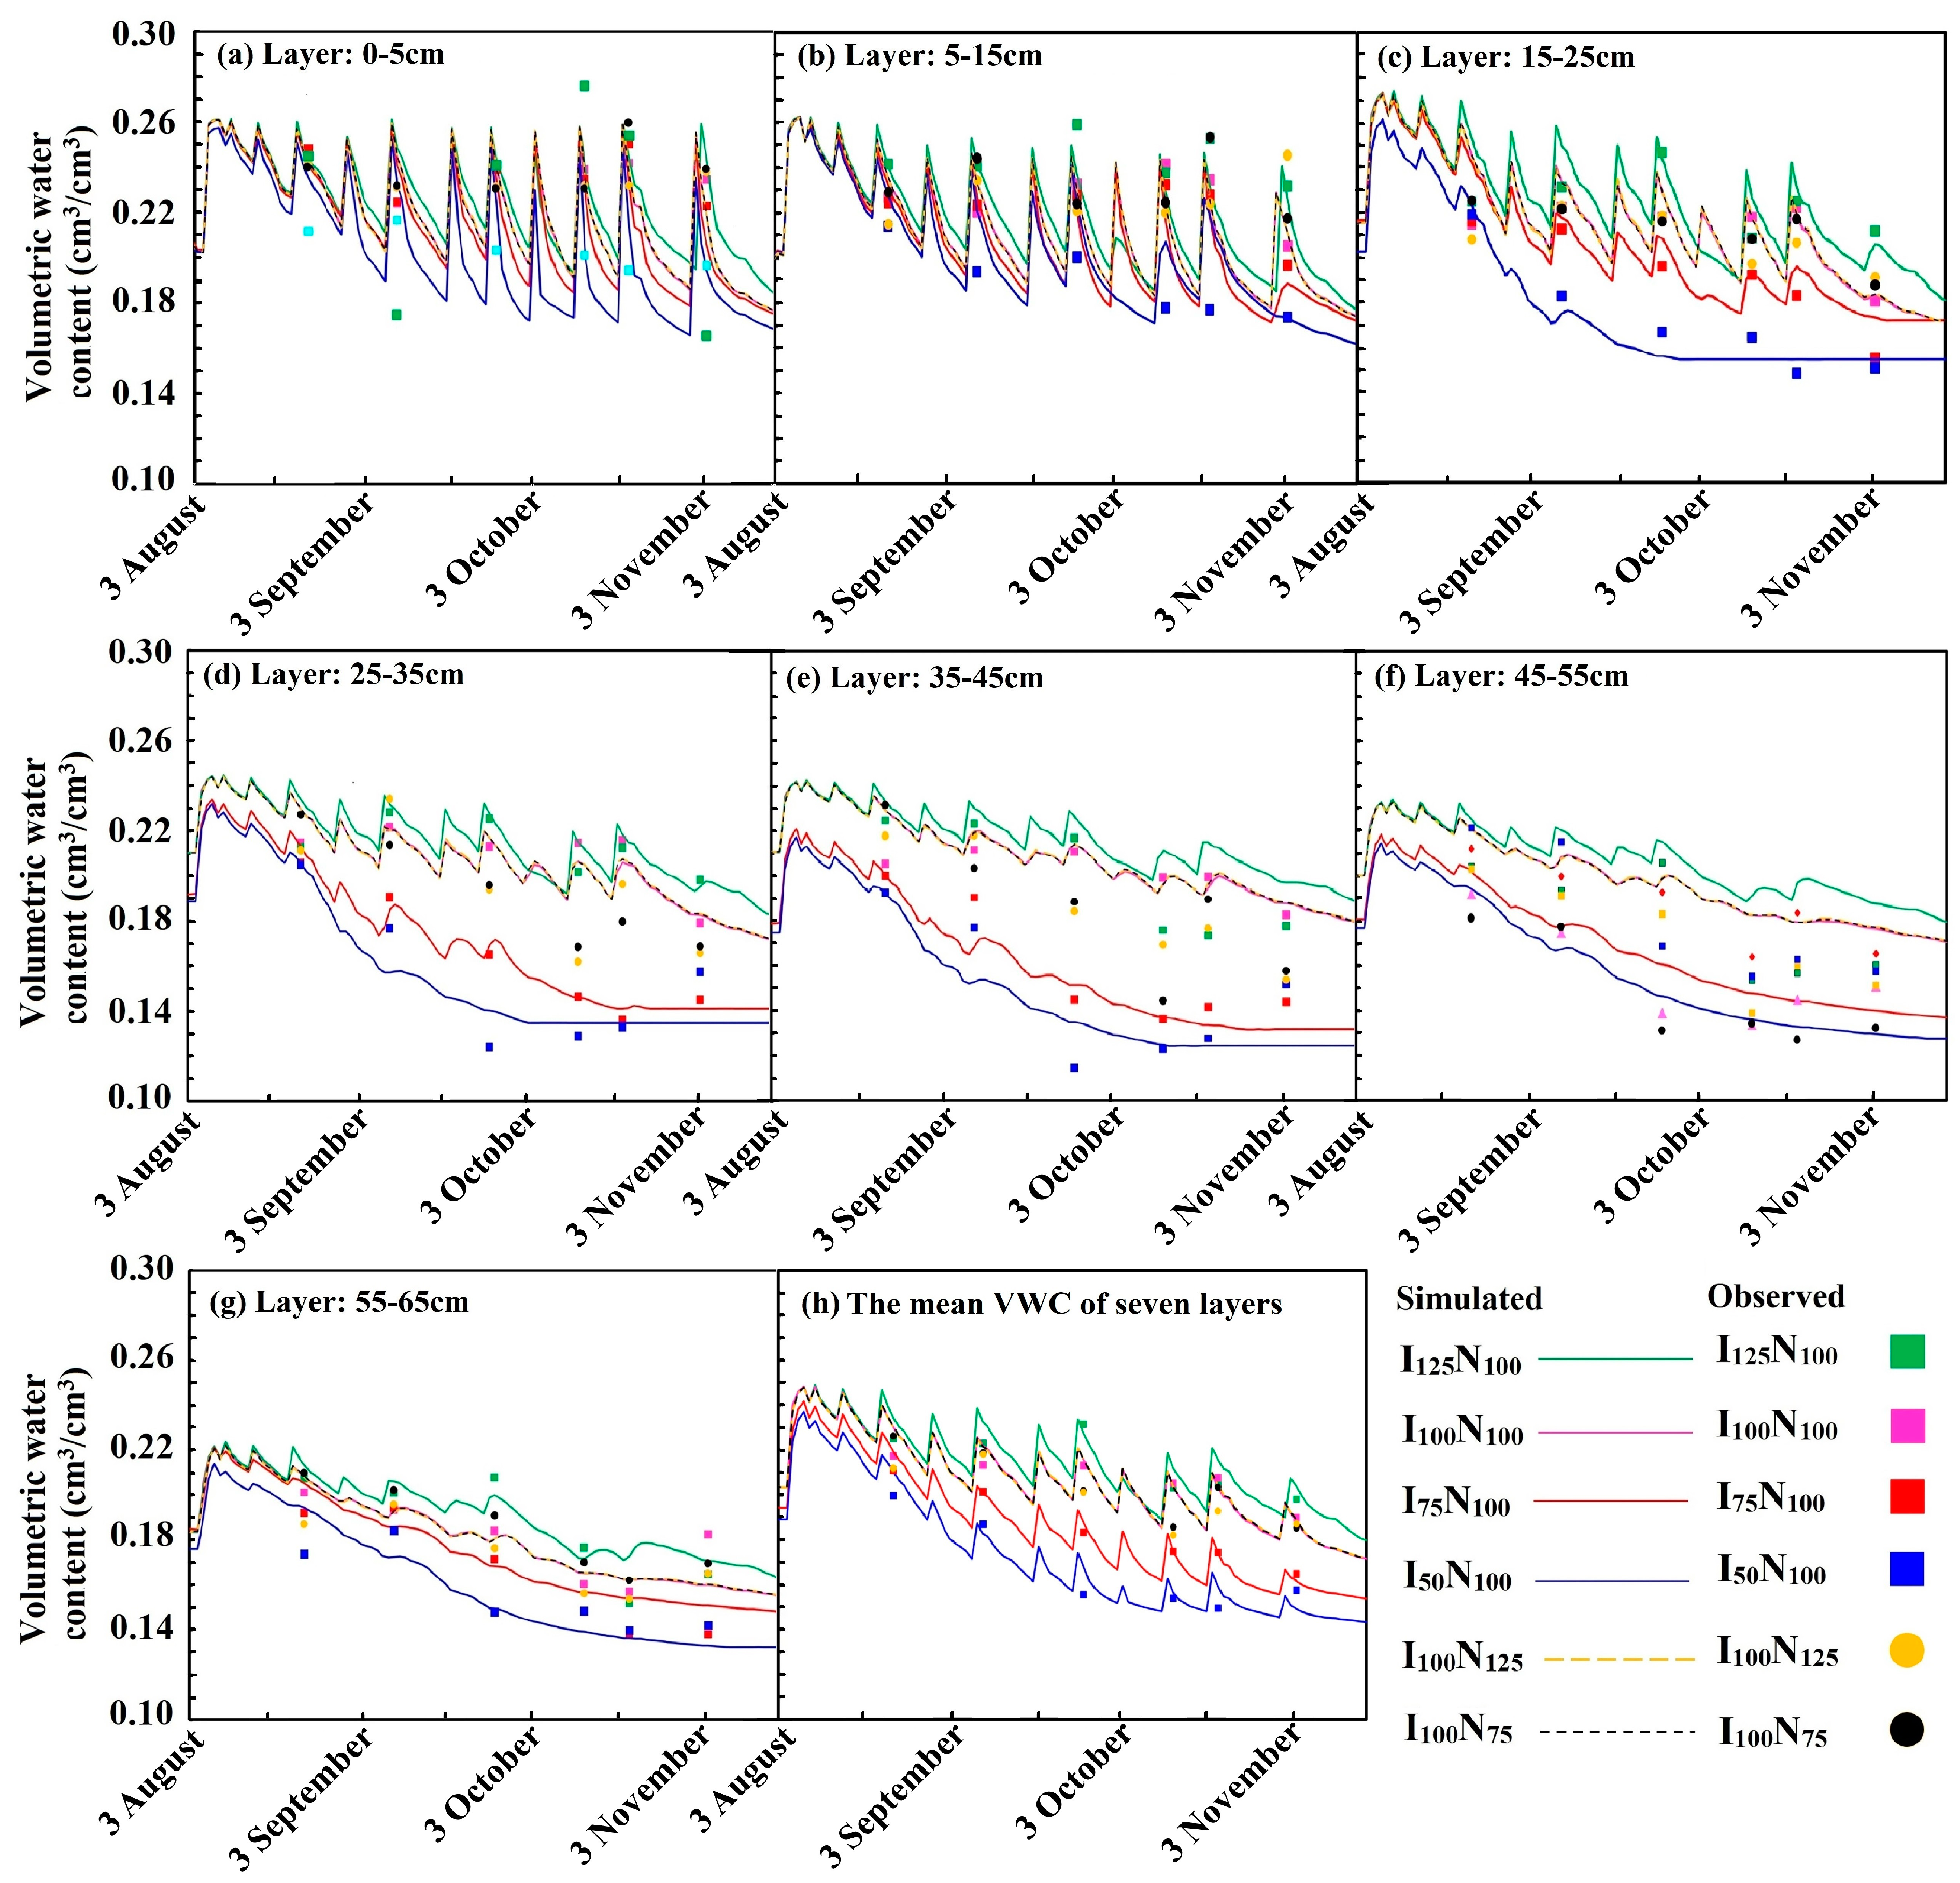
3.1. Soil Volumetric Water Content and Crop Growth

The daily observed and simulated VWC at seven soil depths are shown in Figure 2 and the simulated statistics are presented in Table 4. For all soil layers, the model satisfactorily predicted VWC with RRMSE < 9.8%, PBIAS within ±6%, IoA > 0.85 and R2 > 0.71.
Both the observed and simulated VWC values were significantly higher as the irrigation rates increased (p < 0.01) (Figure 2a–h), which followed the order I50N100 < I75N100 < I100N100 < I125N100. The mean observed VWC increased from 0.167 cm3/cm3 for I50N100 to 0.214 cm3/cm3 for I125N100 and the mean simulated VWC increased from 0.171 cm3/cm3 for I50N100 to 0.221 cm3/cm3 for I125N100 (Table 4). Similar trends were reported in most previous studies [13,20]. This phenomenon was because there was no recharge from groundwater and precipitation, and irrigation was the unique source of water recharge in the solar greenhouse [34]. For the upper soil layers (Figure 2a–c), the VWC values tended to have sharper peaks than deeper soil layers (Figure 2d–g) after irrigation events. It indicated that the deeper soil profile might have lower water retention capacity due to the larger bulk density and the smaller soil porosity structure of the deeper soils [35]. Comparing different N fertilizer rates, there were no significant differences in VWC among the I100N125, I100N100 and I100N75 scenarios (p > 0.05). It might be explained by the fact that the soil ET was not related to fertilizer rates [36].
Compared with the VWC, the simulated crop growth parameters (i.e., LAI and plant height) were in better agreement with the observations (Figure 3a,b and Table 4). The RRMSE, PBIAS, IoA and R2 of the observed and simulated values of LAI and plant height were <8.8%, within ±5.4%, >0.95 and >0.87, respectively. The statistical criteria were also better than those in previous studies [18,21]. Both the observed and simulated LAI of the I125N100 scenario were significantly larger than I100N100, I75N100 and I50N100 scenarios (p < 0.05), shown in Figure S2 (Supplementary Materials). The LAI was also significantly higher as the N fertilizer rates increased (p < 0.01), which followed the order I100N125 > I100N100 > I100N75. The phenomena were because adequate water and N increased the chlorophyll content and delayed the fading of crop leaves [37]. A similar phenomenon was found in Bu et al. [38] and Peng et al. [39]. In addition, the observed and simulated plant heights had no significant difference among the SDF scenarios (p > 0.05) (Figure 3b).
The RE values between the observed and simulated yields were in the range of 1.5–7.2% (Figure 3c), indicating the grain yield was also well-simulated. Meanwhile, the simulated yields were underestimated by a mean of 5.2% for the scenarios in the model. This might be attributed to higher soil temperatures prolonging the filling stage when the meristem was underground [40]; however, the soil temperature was not calibrated in the paper, and it was likely to be underestimated due to the greenhouse. As a result, the simulated yields might also be underestimated in this model. As demonstrated in Figure 3c, both observed and simulated yields significantly decreased as the irrigation rates decreased (p < 0.01). The simulated yields under the same fertilizer rates were 10,454 kg/ha for I125N100, 10,284 kg/ha for I100N100, 9578 kg/ha for I75N100 and 8972 kg/ha for I50N100. This might be attributable to the occurrence of water stress, which is caused by lower irrigation amounts [41]. The observed and simulated yields also significantly decreased as the N rates decreased (p < 0.01), viz., I100N125 > I100N100 > I100N75. The simulated yields under the same irrigation rates were 10446 kg/ha for I100N125, 10284 kg/ha for I100N100 and 9767 kg/ha for I100N75. This might be attributable to the occurrence of N stress, which resulted from lower N fertilizer amounts [42]. Additionally, the simulated yields in all six SDF scenarios were underestimated compared to the corresponding observed value. It might be that the low wind speed in the greenhouse reduced ET and led to higher temperatures, which might be negative for crop growth [43].

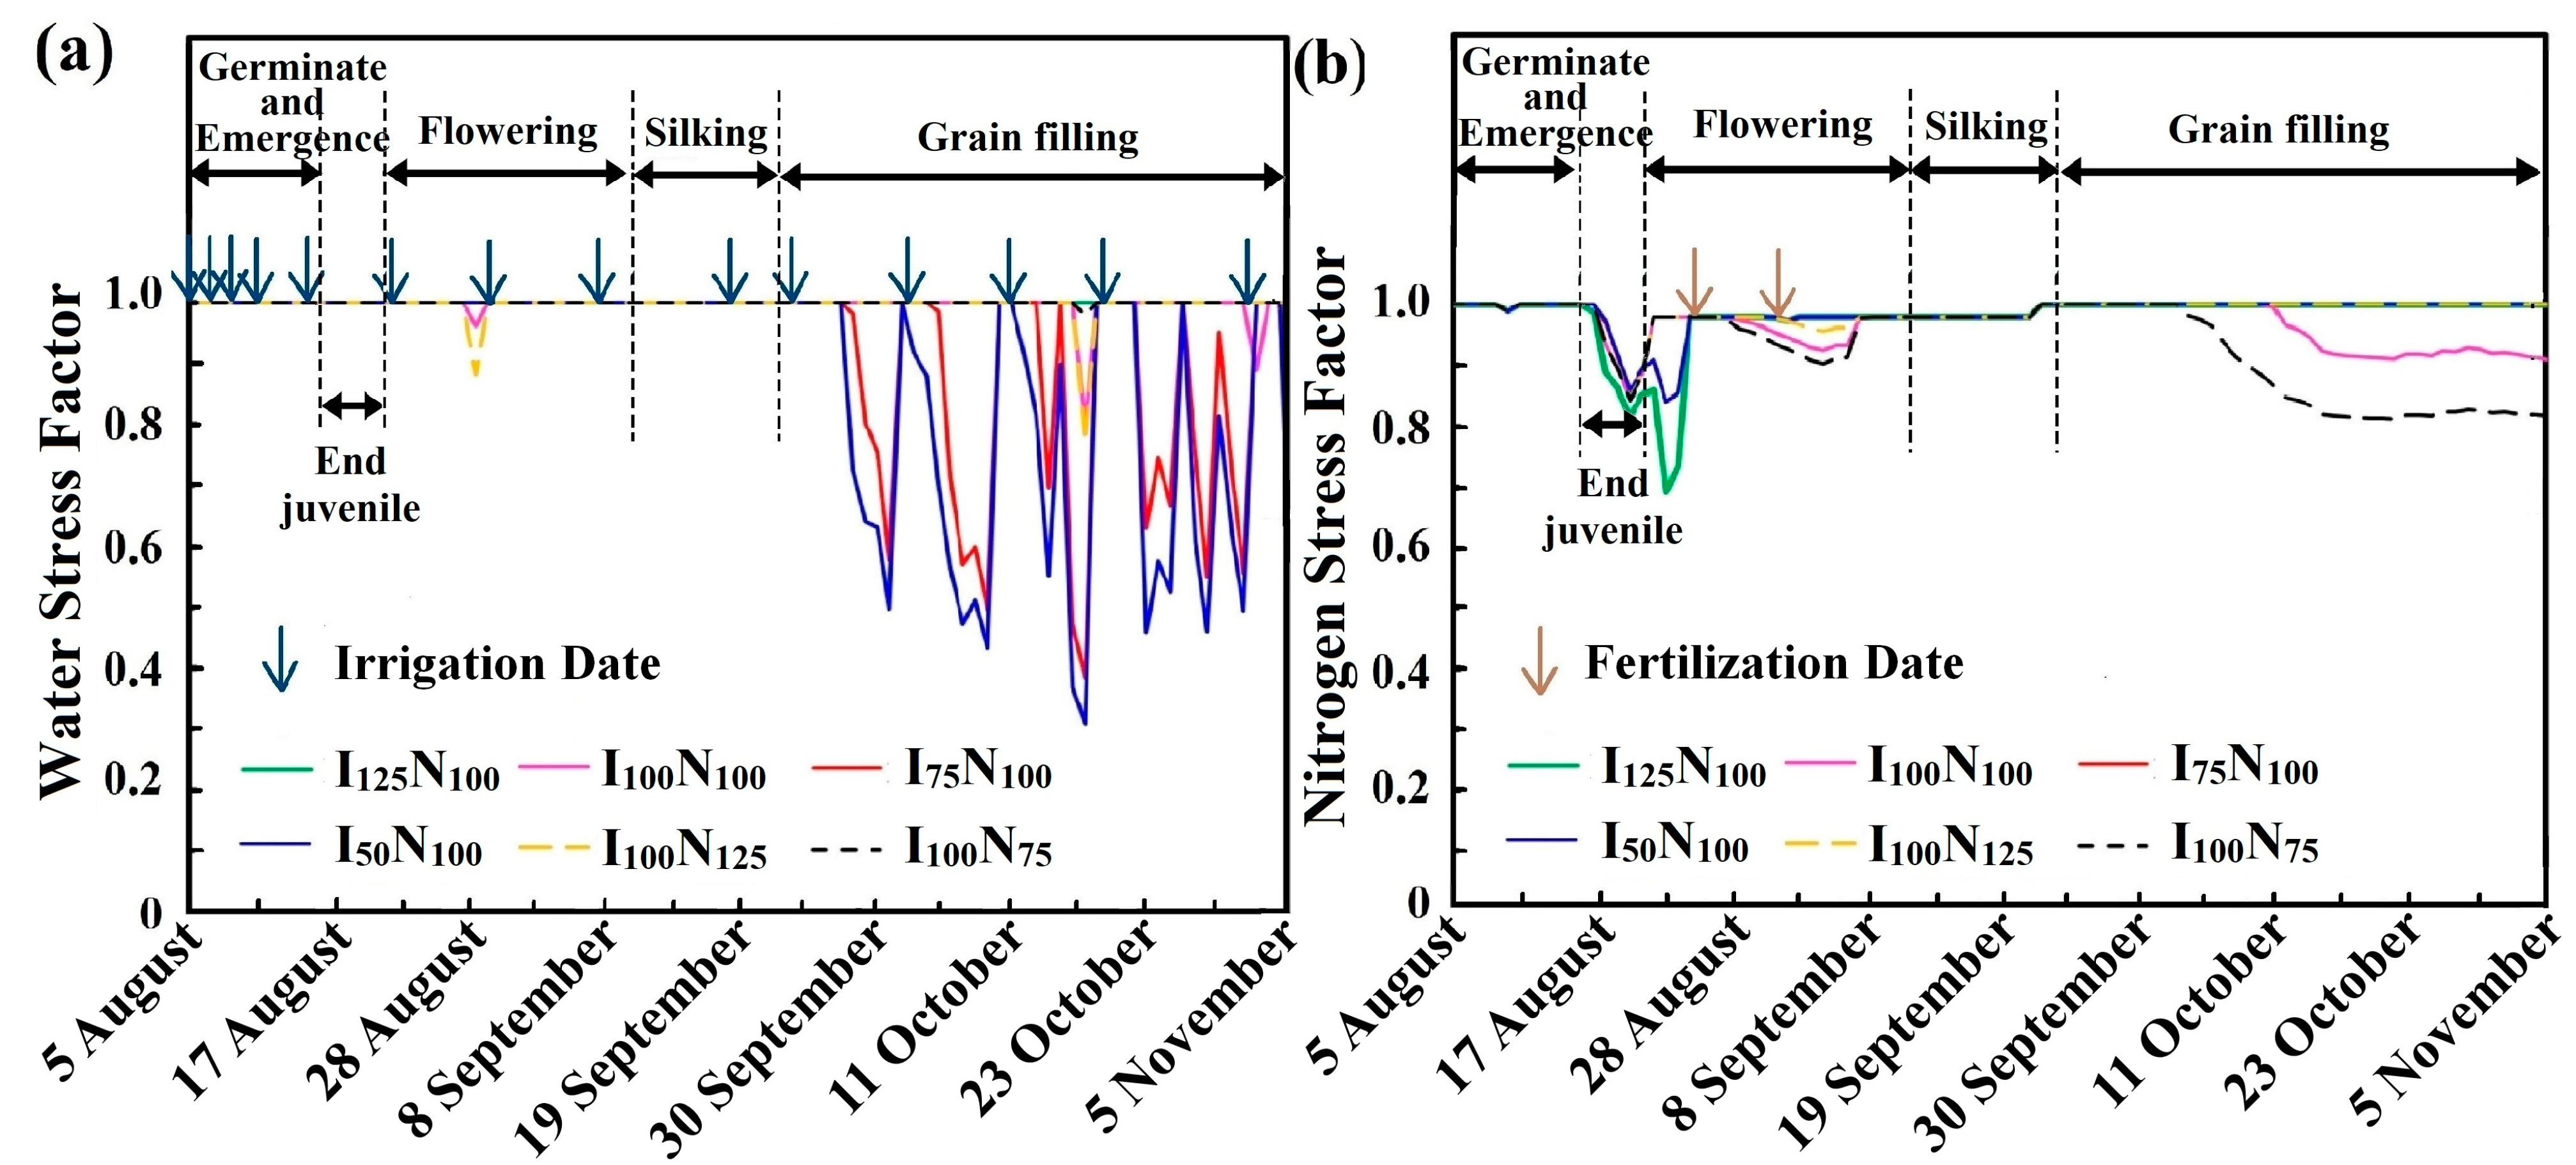
3.2. Water and N Stress Factors Simulation

The water stress factor (WSF) was simulated based on the ratio of potential root water uptake to potential plant transpiration in RZWQM2 (WSF < 1 indicates some water stress) [30]. As shown in Figure 4a, the computed WSF values decreased as the irrigation rates decreased, i.e., I125N100 > I100N100 > I75N100 > I50N100. The mean WSF from the planting to harvest was 1.00 for I125N100 (no stress), 0.99 for I100N100, 0.92 for I75N100 and 0.88 for I50N100. It indicated that the maize field would suffer more severe water stress if deficit irrigation strategies were adopted. It reconfirmed that the crop growing under a relatively high water stress would show a significant yield loss (p < 0.01) (Figure 3c). Meanwhile, the water stresses were removed or alleviated in a short period (1 day) after each irrigation event. However, water stress reoccurred soon if the irrigation amount was insufficient (i.e., I75N100 and I50N100), especially during the crop grain filling stage (23 September to 3 November). This might be because the crop grain filling stage of maize, which was the most vigorous and consumed the most water, would demand more than 30% water compared to other crop stages [44]. In this way, the simulated yield of I75N100 and I50N100 decreased by 15.8% and 18.3% compared to I125N100 (Figure 3c). Liu et al. [45] also reported that the optimization of irrigation in the crop’s late stages could alleviate water stress and results in a 16.3% yield increase and 4.9% water saving. Thus, policymakers and decision-makers could reschedule irrigation rates based on a water stress-based method to improve yield and WUE. Additionally, the number of days, forwhich WSF was less than 0.9, was 2 days for I100N125, 1 day for I100N100 and 0 days for I100N75. This slight difference was attributed to N stimulated crop growth, then the plant consumed more water [46].
The nitrogen stress factor (NSF) of maize was simulated based on critical and minimum N concentrations in RZWQM2; NSF < 1 also indicates some N stress [17]. As shown in Figure 4b, the NSF values decreased as the fertilizer rates decreased, i.e., I100N125 > I100N100 > I100N75, where I100N75 suffered from more serious N stress. This was the main reason for the decrease in the simulated yield of I100N100 and I100N75, which decreased by 1.6% and 7.3% compared to I100N125 (Figure 3c). These crop N stresses mainly occurred at the end of the juvenile stage (15 August to 21 August), flowering stage (21 August to 11 September) and crop grain filling stage (23 September to 5 November). These stages consumed more N than the germination and emergence stage (5 August to 15 August) and silking stage (11 September to 23 September) [47]. These results showed that the scheduling of N fertilizer should be optimized according to crop growth stages. Similar findings have been reported by Zhou et al. [11]. and Peng et al. [39]. Appropriately increasing the amount of N fertilizer could improve the photosynthetic capacity of maize at late growth stages and prolong the functional period of leaves, which led to an increase in yield [48]. Additionally, there was some degree of N stresses under the I100N100 scenario, indicating that the LOD was underestimated in this area. Thus, a nitrogen stress-based fertilization method was promising to optimize grain yield. Compared to the scenarios of different irrigation rates (i.e., I125N100, I100N100, I75N100 and I50N100), the NSF slightly increased with the decreased irrigation rates, the and I125N100 scenario was subjected to higher N stress than I100N100, I75N100 and I50N100. This was attributed to adequate irrigation, which stimulated crop growth while consuming more N and causing N stress [49]. In conclusion, the water and N inputs in the SDF system had the combined effects on crop water and N stress, and they should be synthetically considered for optimizing SDF management.

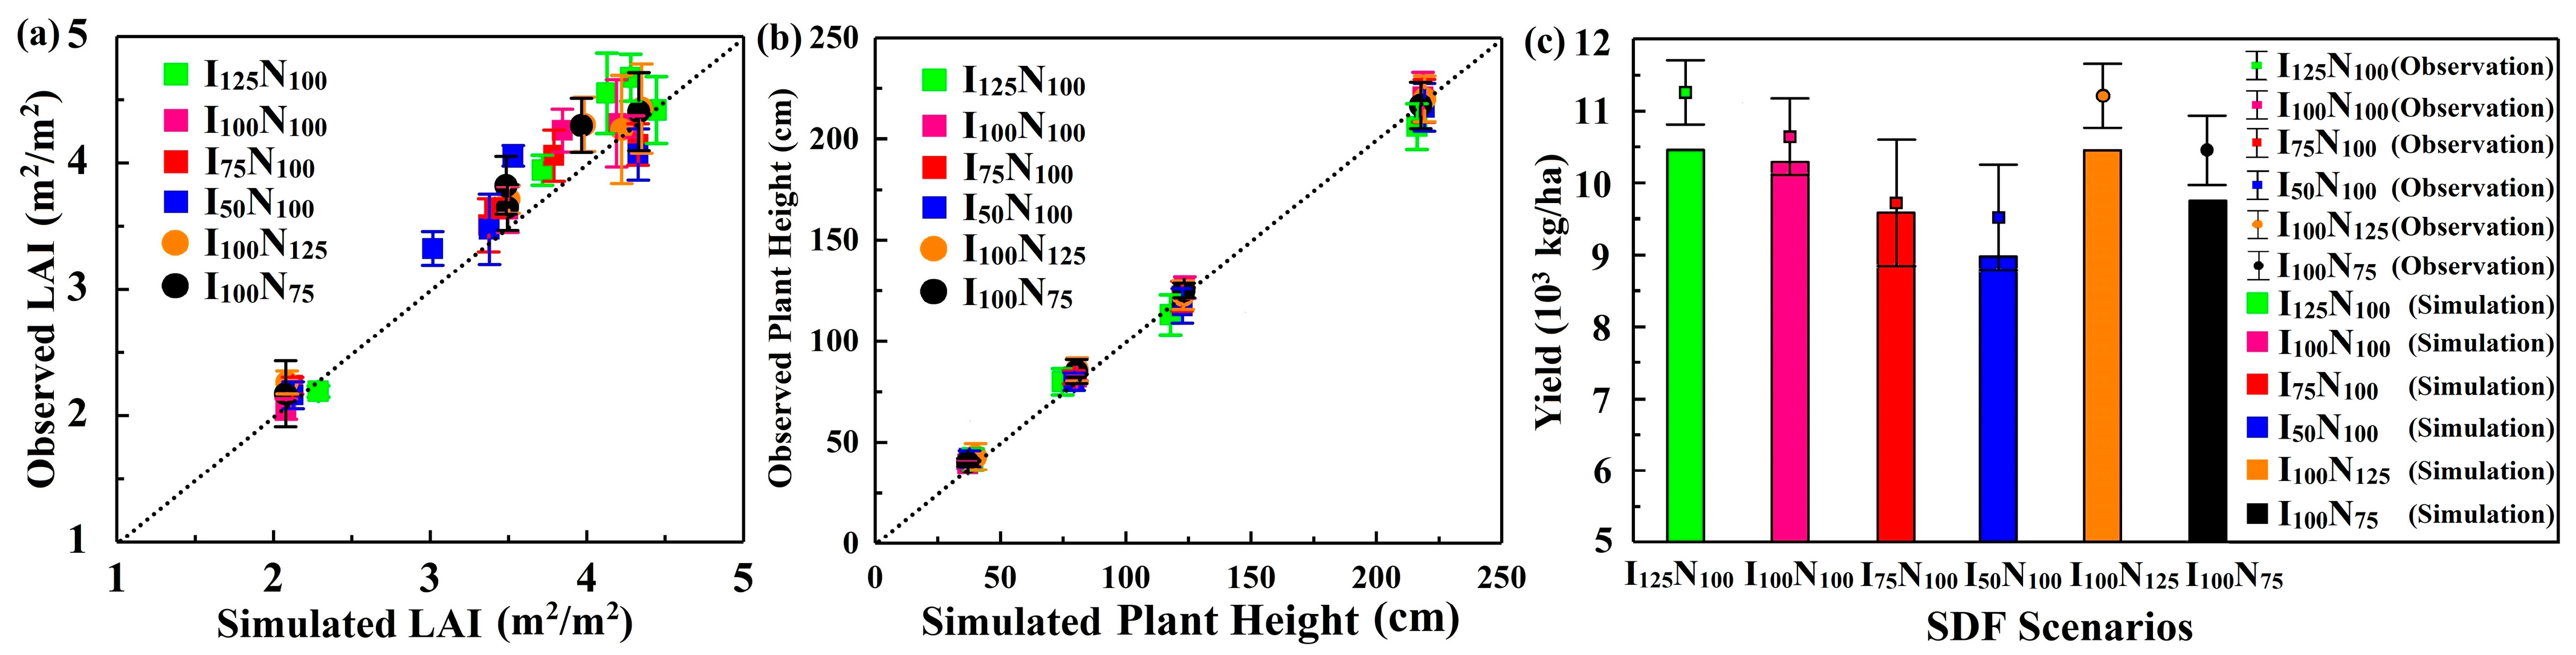
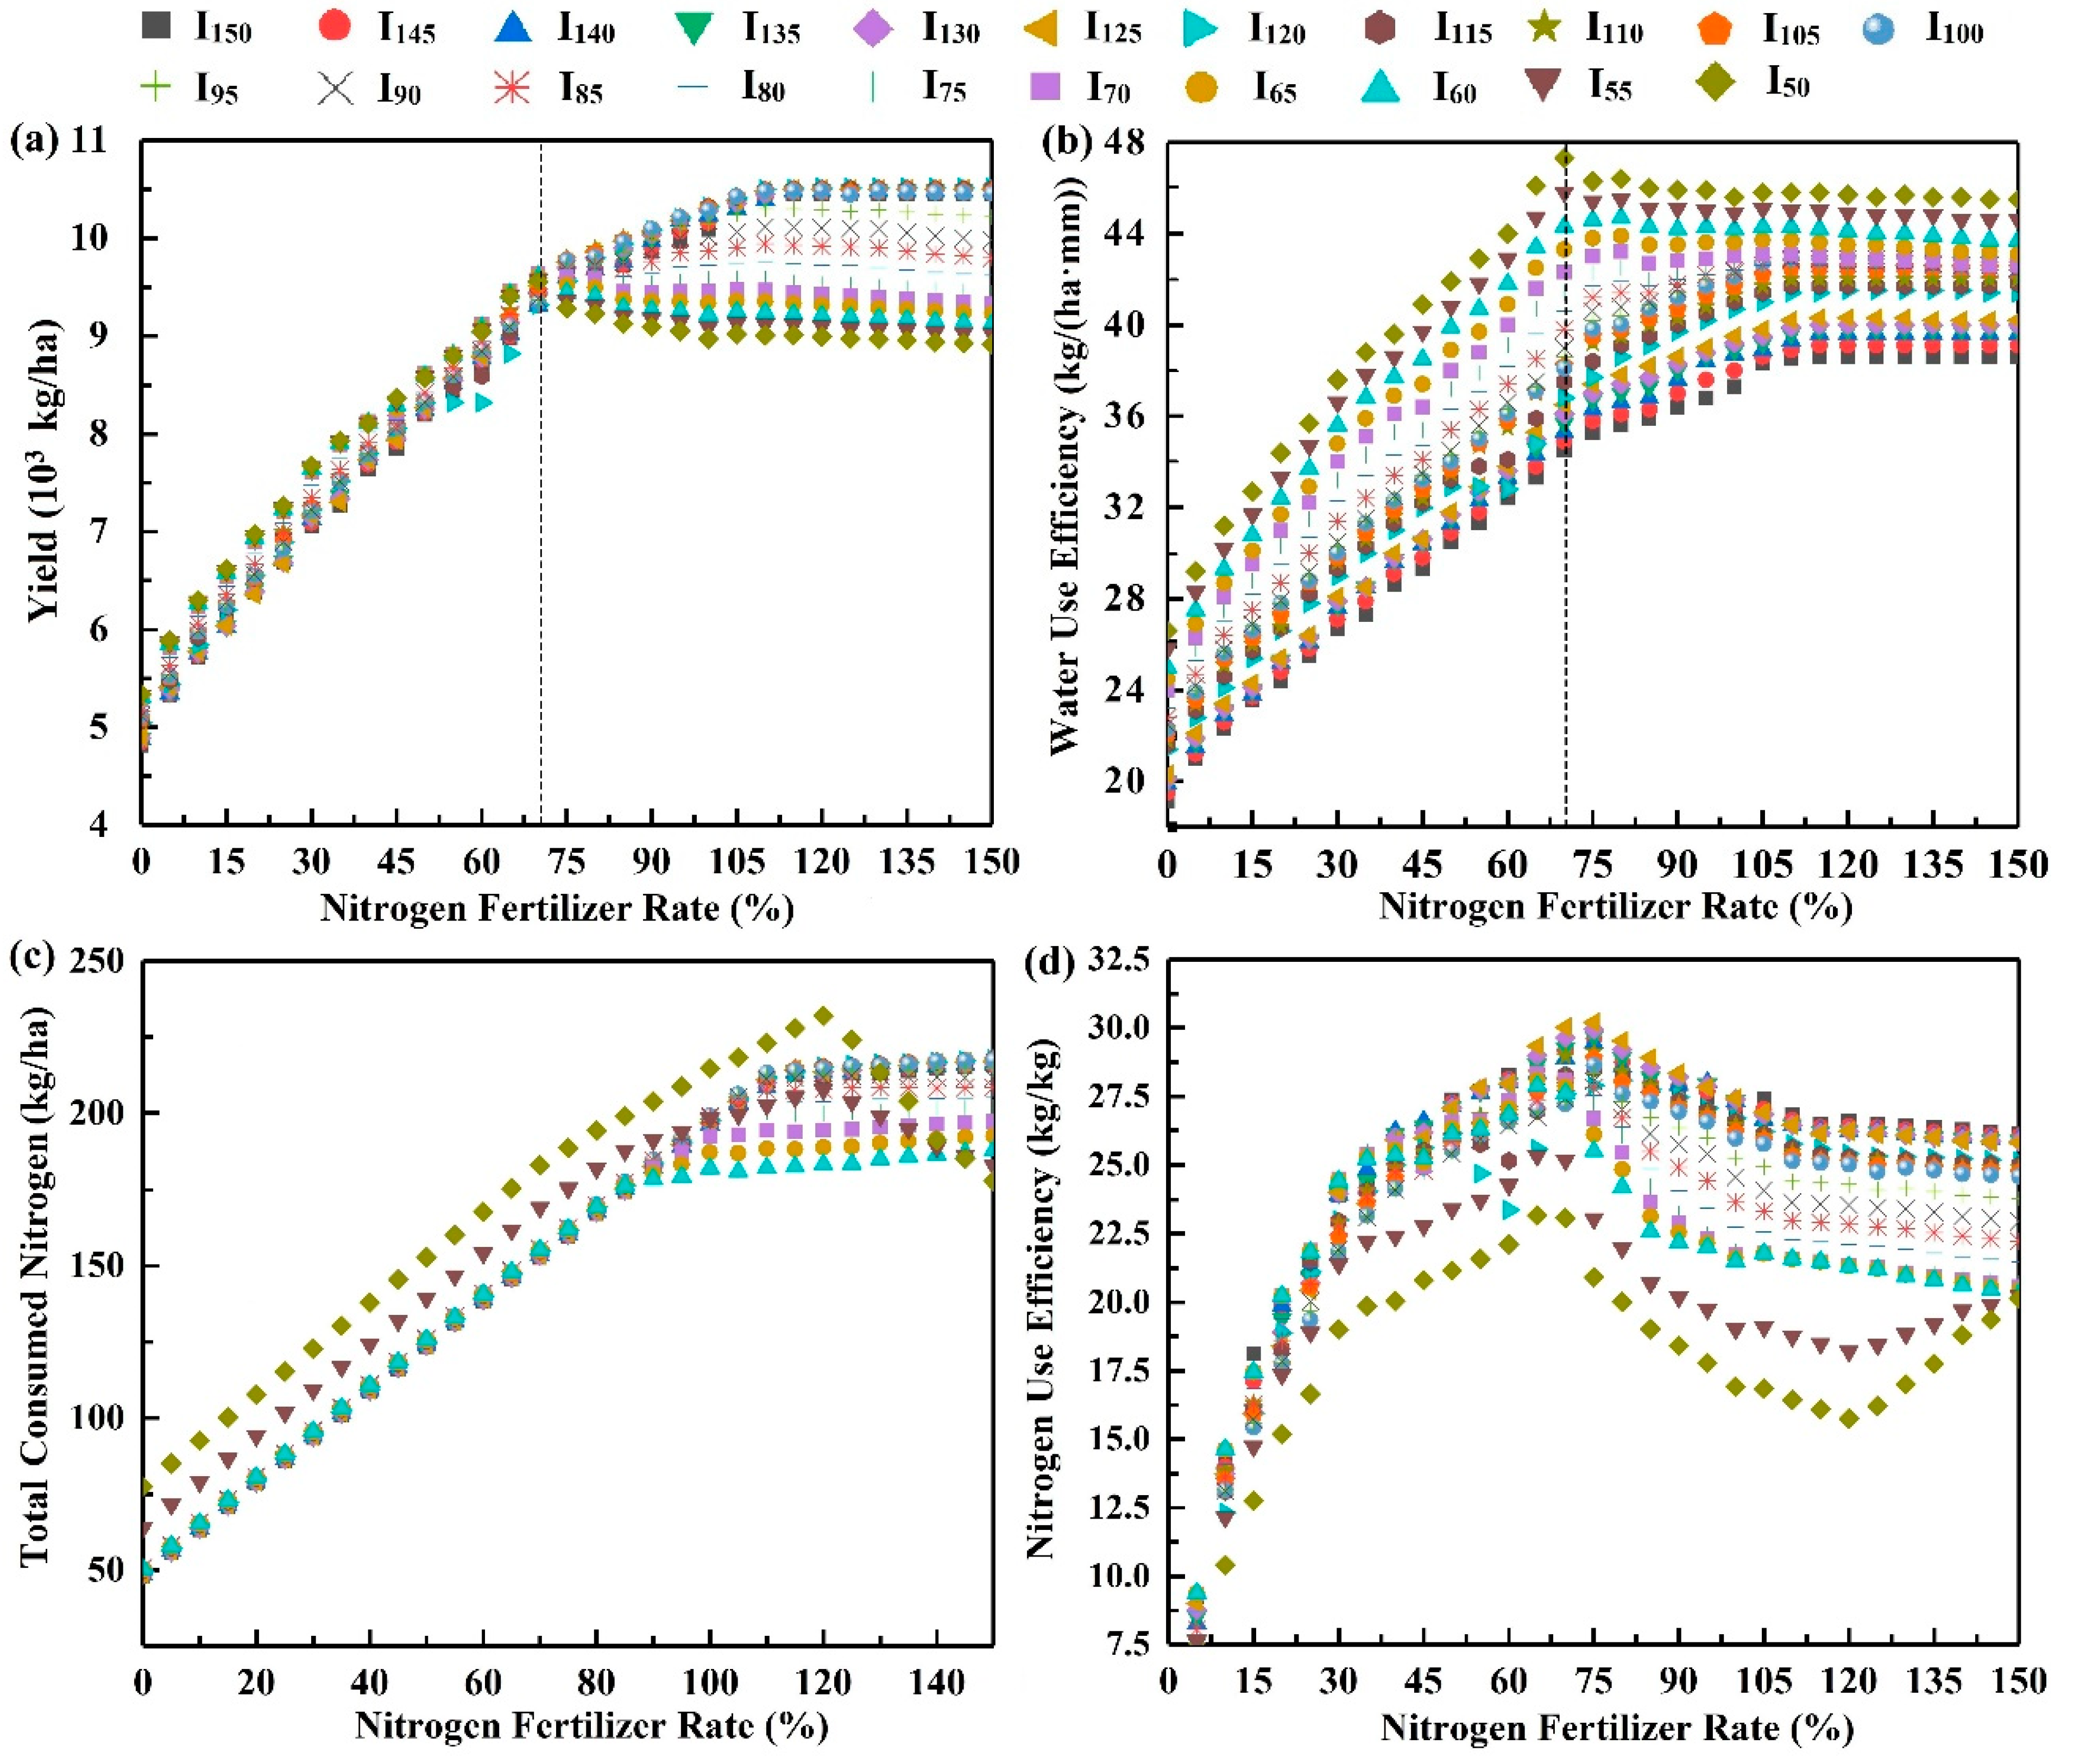
3.3. Quantification of Grain Yield, Water and Nitrogen Use Efficiency under the Influence of Surface Drip Fertigation Managements

After model calibration and validation, a combination of 21 × 31 SDF scenarios (21 irrigation rates × 31 N fertilizer rates) were simulated by using calibrated RZWQM2. As shown in Figure 5a, the simulated yields of each adequate irrigation rate (i.e., from I80 to I150) increased rapidly when N fertilizer rates increased from N0 to N100. Then, the yields remained basically stable and fluctuated within ±3.6% for adequate irrigation rates if the N fertilizer rates increased from N100 to N150. This plateau phenomenon might be because crop growth and grain filling had also entered a plateau period due to adequate water and N [50]. In this way, more N input was fertilizer-wasting without an increase in yield. The I120N130 scenario allowed the crop to achieve the highest yield potential (10,516 kg/ha, Table 5). A similar phenomenon was found in Chen et al. [50] and Xing et al. [51]. When the irrigation rates were lower than I80, the maximum yield generally appeared at a moderate N fertilizer rate (i.e., N70). It was found that the yield would decrease if N fertilizer rates raised from N70 to N150. It might be attributed to lower crop root nutrient uptake, which would emerge if N was higher than a certain level [52]. Therefore, excessive N fertilizer was also wasted.
Compared to different N fertilizer rates, the WUE in each irrigation rate increased rapidly from N0 to N70 (Figure 5b). This indicated that N fertilizer rates were the key controlling factor affecting WUE at the stage of low fertilization [53]. However, if the N fertilizer rates were higher than N70, the variation of WUE was limited and fluctuated within ±13.0%. This was because the yield remained basically stable at high fertilizer rates from N70 to N150 (Figure 5a). Meanwhile, compared to different irrigation rates under the same fertilization, WUE increased with the decreased irrigation rates. The optimal WUE appeared in the I50N70 scenario, with a value of 47.3 kg/(ha·mm) (Table 5). While the yield of I50N70 was 9559 kg/ha, which was lower than 10.0% of the highest yield potential in I120N130 (10516 kg/ha), this was an acceptable rate of yield reduction.
In the analysis of TCN and NUE (Figure 5c,d), the difference in TCN in each irrigation rate was caused by the N consumed in the soil (Equation (8)). It was found that TCN had positive correlations with irrigation rates under the same fertilization, except for I50 and I60. This phenomenon might be because more soil N would be overdrawn by the maize if the irrigation was adequate [54]. Moreover, among all scenarios, a peak value of NUE appeared at the rate of N70 or N75. This might be because the yield would stop increasing or even slightly decrease as the nitrate reductase activity of the maize reached its maximum at high N rates [55]. The maximum NUE was 30.2 kg/kg in the I125N75 scenario (Table 5). In this scenario, the yield and WUE were 9754 kg/ha and 37.4 kg/(ha·mm), respectively, which was lower than 7.8% of the highest yield and 26.5% of the highest WUE. The results above could be applied to obtain the optimum irrigation and fertilizer rates in this area.

4. Conclusions

The drip fertigation technique is widely used around the world to improve WUE and NUE. The performance of the RZWQM2 was satisfactory in simulating VWC, LAI, plant height and maize yield (Zea mays L.) under different drip fertigation practices in a solar greenhouse. Both water and N stresses were associated with the combination of water and N fertilizer inputs. Based on the calibrated model, the optimal SDF practices could be achieved for maximizing maize yield, WUE and NUE. In general, higher irrigation and fertilization rates increased the yield, and the yield was maximized under SDF management with both adequate irrigation and fertilization rates. Maximum WUE could be obtained in the SDF management with moderate irrigation and fertilization with some sacrifice in grain yield. Maximum NUE was found in the SDF management with adequate irrigation but low fertilization rates, and there was also an acceptable sacrifice in grain yield. The results provided optimum irrigation and fertilizer rates for a SDF system in this area and also demonstrated that the RZWQM2 was a promising tool for evaluating the effects of SDF management and achieving optimal water and N inputs.

Supplementary Materials

The following supporting information can be downloaded at: https://www.mdpi.com/article/10.3390/agriculture12050672/s1, Table S1: The soil physicochemical properties at the field experiment site; Figure S1: Drip fertigation system layout and experimental design in the solar greenhouse; Figure S2: The simulated leaf area index of the surface drip fertigation (SDF) scenarios.

Author Contributions

Conceptualization, H.C. and Z.Q.; methodology, Q.Y. and S.F.; software, Z.Q.; writing—original draft preparation, H.C., Q.Y. and F.L.; writing—review and editing, M.A.M.A., T.Z., W.C. and X.C. All authors have read and agreed to the published version of the manuscript.

Funding

This study was financially supported by the National Natural Science Foundation of China (Grant No. 42177365, 51809226 and 51909229), Jiangsu Agriculture Science and Technology Innovation Fund (JASTIF) (Grant No. CX(21)3071), the China Postdoctoral Science Foundation funded project (Grant No. 2018M632390) and the Department of Ecology and Environment of Jiangsu Province (Grant No. 2020020).

Institutional Review Board Statement

Not applicable.

Informed Consent Statement

Not applicable.

Data Availability Statement

The data that support the findings of this study are available on request from all authors.

Conflicts of Interest

The authors declare no conflict of interest.

References

  1. Rosa, L.; Chiarelli, D.D.; Rulli, M.C.; Dell’Angelo, J.; D’Odorico, P. Global agricultural economic water scarcity. Sci. Adv. 2020, 6, eaaz6031. [Google Scholar] [CrossRef] [PubMed]
  2. Geng, G.; Wu, J.; Wang, Q.; Lei, T.; He, B.; Li, X.; Mo, X.; Luo, H.; Zhou, H.; Lu, D. Agricultural drought hazard analysis during 1980–2008: A global perspective. Int. J. Climatol. 2016, 36, 389–399. [Google Scholar] [CrossRef]
  3. Giroto, A.S.; Guimarães, G.G.; Foschini, M.; Ribeiro, C. Role of slow-release nanocomposite fertilizers on nitrogen and phosphate availability in soil. Sci. Rep. 2017, 7, 46032. [Google Scholar] [CrossRef] [PubMed]
  4. Tarafder, C.; Daizy, M.; Alam, M.M.; Ali, M.R.; Islam, M.J.; Islam, R.; Ahommed, M.S.; Aly, M.A.S.; Khan, M.Z.H. Formulation of a hybrid nanofertilizer for slow and sustainable release of micronutrients. ACS Omega 2020, 5, 23960–23966. [Google Scholar] [CrossRef] [PubMed]
  5. Xin, X.; Judy, J.D.; Sumerlin, B.B.; He, Z. Nano-enabled agriculture: From nanoparticles to smart nanodelivery systems. Environ. Chem. 2020, 17, 413–425. [Google Scholar] [CrossRef]
  6. Ayars, J.; Phene, C.; Hutmacher, R.; Davis, K.; Schoneman, R.; Vail, S.; Mead, R.M. Subsurface drip irrigation of row crops: A review of 15 years of research at the Water Management Research Laboratory. Agric. Water Manag. 1999, 42, 1–27. [Google Scholar] [CrossRef]
  7. Tian, D.; Zhang, Y.; Mu, Y.; Zhou, Y.; Zhang, C.; Liu, J. The effect of drip irrigation and drip fertigation on N2O and NO emissions, water saving and grain yields in a maize field in the North China Plain. Sci. Total Environ. 2017, 575, 1034–1040. [Google Scholar] [CrossRef] [PubMed]
  8. Lamm, F.R. Cotton, tomato, corn, and onion production with subsurface drip irrigation: A review. Trans. ASABE 2016, 59, 263–278. [Google Scholar]
  9. Jensen, C.; Ørum, J.; Pedersen, S.; Andersen, M.; Plauborg, F.; Liu, F.; Jacobsen, S.E. A short overview of measures for securing water resources for irrigated crop production. J. Agron. Crop Sci. 2014, 200, 333–343. [Google Scholar] [CrossRef]
  10. Sandhu, O.; Gupta, R.; Thind, H.; Jat, M.; Sidhu, H. Drip irrigation and nitrogen management for improving crop yields, nitrogen use efficiency and water productivity of maize-wheat system on permanent beds in north-west India. Agric. Water Manag. 2019, 219, 19–26. [Google Scholar] [CrossRef]
  11. Zhou, B.; Sun, X.; Ding, Z.; Ma, W.; Zhao, M. Multisplit nitrogen application via drip irrigation improves maize grain yield and nitrogen use efficiency. Crop Sci. 2017, 57, 1687–1703. [Google Scholar] [CrossRef] [Green Version]
  12. Stanley, C.D.; Toor, G. Florida commercial horticultural production: Constraints limiting water and nutrient use efficiency. Horttechnology 2010, 20, 89–93. [Google Scholar] [CrossRef] [Green Version]
  13. Greaves, G.E.; Wang, Y.M. Effect of regulated deficit irrigation scheduling on water use of corn in southern Taiwan tropical environment. Agric. Water Manag. 2017, 188, 115–125. [Google Scholar] [CrossRef]
  14. Mottes, C.; Lesueur-Jannoyer, M.; Le Bail, M.; Malézieux, E. Pesticide transfer models in crop and watershed systems: A review. Agron. Sustain. Dev. 2014, 34, 229–250. [Google Scholar] [CrossRef]
  15. Tenreiro, T.R.; García-Vila, M.; Gómez, J.A.; Jimenez-Berni, J.A.; Fereres, E. Water modelling approaches and opportunities to simulate spatial water variations at crop field level. Agric. Water Manag. 2020, 240, 106254. [Google Scholar] [CrossRef]
  16. Rötter, R.; Appiah, M.; Fichtler, E.; Kersebaum, K.; Trnka, M.; Hoffmann, M. Linking modelling and experimentation to better capture crop impacts of agroclimatic extremes—A review. Field Crop Res. 2018, 221, 142–156. [Google Scholar] [CrossRef]
  17. Ahuja, L.; Rojas, K.; Hanson, J.D. Root Zone Water Quality Model: Modelling Management Effects on Water Quality and Crop Production; Water Resources Publications: Littleton, CO, USA, 2000; pp. 300–384. [Google Scholar]
  18. Qi, Z.; Ma, L.; Bausch, W.C.; Trout, T.J.; Ahuja, L.R.; Flerchinger, G.N.; Fang, Q. Simulating maize production, water and surface energy balance, canopy temperature, and water stress under full and deficit irrigation. Trans. ASABE 2016, 59, 623–633. [Google Scholar]
  19. Gu, Z.; Qi, Z.; Ma, L.; Gui, D.; Xu, J.; Fang, Q.; Yuan, S.; Feng, G. Development of an irrigation scheduling software based on model predicted crop water stress. Comput. Electron. Agric. 2017, 143, 208–221. [Google Scholar] [CrossRef]
  20. Chen, X.; Qi, Z.; Gui, D.; Gu, Z.; Ma, L.; Zeng, F.; Li, L.; Sima, M.W. A model-based real-time decision support system for irrigation scheduling to improve water productivity. Agronomy 2019, 9, 686. [Google Scholar] [CrossRef] [Green Version]
  21. Zhang, H.H.; Ma, L.W.; Douglas, M.K.R.; Han, M.; Trout, T.J. Modeling maize production under growth stage-based deficit irrigation management with RZWQM2. Agric. Water Manag. 2021, 248, 106767. [Google Scholar] [CrossRef]
  22. Fang, Q.X.; Ma, L.W.; Ahuja, L.R.; Trout, T.J.; Malone, R.; Zhang, H.H.; Gui, D.W.; Yu, Q. Long-term simulation of growth stage-based irrigation scheduling in maize under various water constraints in Colorado, USA. Front. Agric. Sci. Eng. 2017, 4, 172–184. [Google Scholar] [CrossRef]
  23. Chen, X.P.; Qi, Z.M.; Gui, D.W.; Sima, M.W.; Zeng, F.J.; Li, L.H.; Li, X.Y.; Gu, Z. Evaluation of a new irrigation decision support system in improving cotton yield and water productivity in an arid climate. Agric. Water Manag. 2020, 234, 106139. [Google Scholar] [CrossRef]
  24. Imakumbili, M.L.E.; Semu, E.; Semoka, J.M.R.; Abass, A.; Mkamilo, G. Managing cassava growth on nutrient poor soils under different water stress conditions. Heliyon 2021, 7, e07331. [Google Scholar] [CrossRef] [PubMed]
  25. Suman, S.; Spehia, R.; Sharma, V. Humic acid improved efficiency of fertigation and productivity of tomato. J. Plant Nutr. 2017, 40, 439–446. [Google Scholar] [CrossRef]
  26. Abdalhi, M.A.; Cheng, J.; Feng, S.; Yi, G. Performance of drip irrigation and nitrogen fertilizer in irrigation water saving and nitrogen use efficiency for waxy maize (Zea mays L.) and cucumber (Cucumis sativus L.) under solar greenhouse. Grassl. Sci. 2016, 62, 174–187. [Google Scholar] [CrossRef]
  27. Chuanyan, Z.; Zhongren, N. Estimating water needs of maize (Zea mays L.) using the dual crop coefficient method in the arid region of northwestern China. Afr. J. Agric. Res. 2007, 2, 325–333. [Google Scholar]
  28. Shrestha, S.; Manandhar, B. Evaluation of the Root Zone Water Quality Model (RZWQM) using field-measured data from the tropical zone, Thailand. Water Air Soil Poll. 2014, 225, 1–14. [Google Scholar] [CrossRef]
  29. Ahmed, I.; Rudra, R.; McKague, K.; Gharabaghi, B.; Ogilvie, J. Evaluation of the Root Zone Water Quality Model (RZWQM) for Southern Ontario: Part II. Simulating long-term effects of nitrogen management practices on crop yield and subsurface drainage water quality. Water Qual. Res. J. 2007, 42, 219–230. [Google Scholar] [CrossRef]
  30. Saseendran, S.A.; Trout, T.J.; Ahuja, L.R.; Ma, L.; McMaster, G.S.; Nielsen, D.C.; Andales, A.A.; Chavez, J.L.; Ham, J. Quantifying crop water stress factors from soil water measurements in a limited irrigation experiment. Agric. Syst. 2015, 137, 191–205. [Google Scholar] [CrossRef]
  31. Hanson, J.D.; Rojas, K.; Shaffer, M.J. Calibrating the root zone water quality model. Agron. J. 1999, 91, 171–177. [Google Scholar] [CrossRef]
  32. Ma, L.; Ahuja, L.; Nolan, B.; Malone, R.; Trout, T.; Qi, Z. Root zone water quality model (RZWQM2): Model use, calibration, and validation. Trans. ASABE 2012, 55, 1425–1446. [Google Scholar] [CrossRef]
  33. Cheng, H.; Shu, K.; Qi, Z.; Ma, L.; Jin, V.L.; Li, Y.; Schmer, M.R.; Wienhold, B.J.; Feng, S. Effects of residue removal and tillage on greenhouse gas emissions in continuous corn systems as simulated with RZWQM2. J. Environ. Manag. 2021, 285, 112097. [Google Scholar] [CrossRef] [PubMed]
  34. de Oliveira, H.F.E.; de Moura Campos, H.; Mesquita, M.; Machado, R.L.; Vale, L.S.R.; Siqueira, A.P.S.; Ferrarezi, R.S. Horticultural Performance of Greenhouse Cherry Tomatoes Irrigated Automatically Based on Soil Moisture Sensor Readings. Water 2021, 13, 2662. [Google Scholar] [CrossRef]
  35. Smagin, A.; Khakimova, G.; Khineeva, D.; Sadovnikova, N. Gravity factor of the formation of the field and capillary water capacities in soils and artificial layered soil-like bodies. Eurasian Soil Sci. 2008, 41, 1189–1197. [Google Scholar] [CrossRef]
  36. Krapfl, K.J.; Hatten, J.A.; Roberts, S.D.; Baldwin, B.S.; Rousseau, R.J.; Shankle, M.W. Soil Properties, Nitrogen Status, and Switchgrass Productivity in a Biochar-Amended Silty Clay Loam. Soil Sci. Soc. Am. J. 2014, 78, S136–S145. [Google Scholar] [CrossRef]
  37. Li, Y.; Shao, X.; Li, D.; Xiao, M.; Hu, X.; He, J. Effects of water and nitrogen coupling on growth, physiology and yield of rice. Int. J. Agric. Biol. Eng. 2019, 12, 60–66. [Google Scholar] [CrossRef] [Green Version]
  38. Bu, L.; Liu, J.; Zhu, L.; Luo, S.; Chen, X.; Li, S. Attainable yield achieved for plastic film-mulched maize in response to nitrogen deficit. Eur. J. Agron. 2014, 55, 53–62. [Google Scholar] [CrossRef]
  39. Peng, Y.; Li, Y.; Dai, C.; Fang, S.; Gong, Y.; Wu, X.; Zhu, R.; Liu, K. Remote prediction of yield based on LAI estimation in oilseed rape under different planting methods and nitrogen fertilizer applications. Agric. For. Meteorol. 2019, 271, 116–125. [Google Scholar] [CrossRef]
  40. Zou, Y.F.; Saddique, Q.; Dong, W.J.; Zhao, Y.; Zhang, X.; Liu, J.C.; Ding, D.Y.; Feng, H.; Wendroth, O.; Siddique, K.H.M. Quantifying the compensatory effect of increased soil temperature under plastic film mulching on crop growing degree days in a wheat–maize rotation system. Field Crop. Res. 2021, 260, 107993. [Google Scholar] [CrossRef]
  41. Gültaş, H.T.; Ahi, Y. Supplemental irrigation impact on yield and yield quality parameters of rapeseed. Agron. J. 2020, 112, 4207–4218. [Google Scholar] [CrossRef]
  42. Dogan, R.; Celik, N.; Yueruer, N. Requirement and application frequencies of nitrogen fertilizer on bread wheat variety, Arpathan-9. Asian J. Chem. 2008, 20, 3069–3078. [Google Scholar]
  43. Ganguly, A.; Ghosh, S. Model development and experimental validation of a floriculture greenhouse under natural ventilation. Energy Build. 2009, 41, 521–527. [Google Scholar] [CrossRef]
  44. Kuscu, H.; Demir, A.O. Yield and water use efficiency of maize under deficit irrigation regimes in a sub-humid climate. Philipp. Agric. Sci. 2013, 96, 32–41. [Google Scholar]
  45. Liu, C.; Qi, Z.; Gu, Z.; Gui, D.; Zeng, F. Optimizing irrigation rates for cotton production in an extremely arid area using RZWQM2-simulated water stress. Trans. ASABE 2017, 60, 2041–2052. [Google Scholar] [CrossRef] [Green Version]
  46. Celette, F.; Gary, C. Dynamics of water and nitrogen stress along the grapevine cycle as affected by cover cropping. Eur. J. Agron. 2013, 45, 142–152. [Google Scholar] [CrossRef]
  47. Zalud, Z.; Pokorny, E.; Stralkova, R.; Podesvova, J. Estimation of winter wheat nitrogen stress using the CERES crop model. Rostlinna Vyroba 2001, 47, 253–259. [Google Scholar]
  48. Kim, S.H.; Sicher, R.C.; Bae, H.; Gitz, D.C.; Baker, J.T.; Timlin, D.J.; Reddy, V.R. Canopy photosynthesis, evapotranspiration, leaf nitrogen, and transcription profiles of maize in response to CO2 enrichment. Glob. Chang. Biol. 2006, 12, 588–600. [Google Scholar] [CrossRef]
  49. Gholinezhad, E.; Aynaband, A.; Ghorthapeh, A.H.; Noormohamadi, G.; Bernousi, I. Study of the effect of drought stress on yield, yield components and harvest index of sunflower hybrid Iroflor at different levels of nitrogen and plant population. Not. Bot. Horti Agrobot. 2009, 37, 85–94. [Google Scholar]
  50. Nematpour, A.; Eshghizadeh, H.R.; Zahedi, M. Comparing the Corn, Millet and Sorghum as Silage Crops Under Different Irrigation Regime and Nitrogen Fertilizer Levels. Int. J. Plant Prod. 2021, 15, 351–361. [Google Scholar] [CrossRef]
  51. Xing, Y.Y.; Mi, F.Y.; Wang, X.K. Effects of different nitrogen fertilizer types and application rates on maize yield and nitrogen use efficiency in Loess Plateau of China. J. Soil. Sediments 2022, 16, 1–21. [Google Scholar] [CrossRef]
  52. Wang, Z.; Li, J.; Li, Y. Effects of drip system uniformity and nitrogen application rate on yield and nitrogen balance of spring maize in the North China Plain. Field Crop Res. 2014, 159, 10–20. [Google Scholar] [CrossRef]
  53. Srivastava, R.K.; Panda, R.K.; Chakraborty, A.; Halder, D. Enhancing grain yield, biomass and nitrogen use efficiency of maize by varying sowing dates and nitrogen rate under rainfed and irrigated conditions. Field Crop Res. 2018, 221, 339–349. [Google Scholar] [CrossRef]
  54. El Zemrany, H.; Cortet, J.; Lutz, M.P.; Chabert, A.; Baudoin, E.; Haurat, J.; Maughan, N.; Félix, D.; Défago, G.; Bally, R. Field survival of the phytostimulator Azospirillum lipoferum CRT1 and functional impact on maize crop, biodegradation of crop residues, and soil faunal indicators in a context of decreasing nitrogen fertilisation. Soil Biol. Biochem. 2006, 38, 1712–1726. [Google Scholar] [CrossRef]
  55. Loussaert, D.; Clapp, J.; Mongar, N.; O’Neill, D.P.; Shen, B. Nitrate Assimilation Limits Nitrogen Use Efficiency (NUE) in Maize (Zea mays L.). Agronomy 2018, 8, 110. [Google Scholar] [CrossRef] [Green Version]
Figure 1. Mean relative humidity, max/min temperature, irrigation and fertilization scheduling in the field experiment during the experimental period.
Agriculture 12 00672 g001
Figure 2. Observed and simulated soil volumetric water content (VWC, cm3/cm3) for each SDF scenario at the depths of 0–5 (a), 5–15 (b), 15–25 (c), 25–35 (d), 35–45 (e), 45–55 (f), 55–65 cm (g) and the mean values of the seven layers (h). The I100N100 scenario was the calibration phase. The remaining five scenarios (i.e., I125N100, I75N100, I50N100, I100N125 and I100N75) were the validation phase. Other notations used in this table are the same as those in Table 1.
Agriculture 12 00672 g002
Figure 3. The simulated versus observed LAI (a), plant height (b) and maize yield (c) under six SDF scenarios. The error bars of the observed LAI, plant height and yield were in the range of 2.0–12.0%, 2.1–15.1% and 4.0–9.1%, respectively. Other notations used in this figure are the same as those in Table 1.
Agriculture 12 00672 g003
Figure 4. The WSF (a) and NSF (b) response to six SDF scenarios. WFS: water stress factor. NSF: nitrogen stress factor. WFS and NSF = 1 indicate that there is no water and N stress, respectively. WFS and NSF < 1 indicate some water and N stress. Other notations used in this table are the same as those in Table 1.
Agriculture 12 00672 g004
Figure 5. Simulated yield (a), WUE (b), TCN (c) and NUE (d) under different simulated SDF scenarios. WUE: water use efficiency, TCN: total consumed nitrogen, NUE: nitrogen use efficiency. Other notations used in this table are the same as those in Table 1.
Agriculture 12 00672 g005
Table 1. Irrigation and N fertilizer rates in six surface drip fertigation (SDF) scenarios.
ScenariosIrrigation RatesTotal Irrigation Amounts (mm)N Fertilizer RatesTotal N Fertilizer Amounts (kg/ha)
I125N100125% ET243.1100% LOD151
I100N100100% ET205.8100% LOD151
I75N10075% ET166.6100% LOD151
I50N10050% ET128.0100% LOD151
I100N125100% ET205.8125% LOD189
I100N75100% ET205.875% LOD113
Note: ET: crop potential evapotranspiration, which was calculated by the Penman–Monteith equation [27]. LOD: local official recommended dose. Irrigation water and N fertilizer rates were set to different ET and LOD levels, respectively. The N fertilizer in the form of NKP fertilizers (10-5-5 and 15-15-15) was applied in each scenario.
Table 2. Calibrated RZWQM2 soil hydraulic parameters for the experimental sites.
Depth
(cm)
Soil Water RetentionVertical Ksat
(cm/h)
Soil Root Growth Factors
θ (cm)λθsθrθ1/3θ15
0–5−8.960.170.350.100.240.173.151.00
5–15−17.000.330.370.130.220.163.220.90
15–30−7.380.350.470.150.230.173.460.80
30–45−23.890.160.280.110.220.171.810.70
45–60−10.470.180.300.130.220.182.830.50
60–90−5.530.150.310.100.210.162.830.30
90–120−6.790.220.320.110.200.142.330.15
120–150−16.680.300.400.070.200.123.020.05
150–179−14.650.320.400.040.170.082.590.01
Note: θ: bubbling pressure, λ: pore size distribution index, θs: saturated water content, θr: residual water content, θ1/3: 33 kPa water content, θ15: 1500 kPa water content, Ksat: saturated hydraulic conductivity. The other required parameters were computed using the RZWQM2 default constraint for all layers.
Table 3. Calibrated crop development parameters for maize (Zea mays L.).
ParameterDescriptionValue
P1Thermal time from seedling emergence to the end of the juvenile phase (°C·days).120
P2Delay in development for each hour that day length is above 12.5 h (days/hr).0.875
P5Thermal time from silking to physiological maturity (°C·days).800
G2Maximum possible number of kernels per plant.800
G3Kernel filling rate during linear grain filling stage under optimum conditions (mg/day).10
PHINTPhylochron interval between successive leaf tip appearance (°C·days).60
MaxMaximum plant height at maturity (cm).320
PBPlant biomass at half of maximum height (g/plant [<=100] OR kg/ha [>100]).60
Table 4. Statistical criteria (i.e., RRMSE, PBIAS, IoA and R2) results obtained by comparing the observed and simulated VWC (cm3/cm3), LAI and plant height for each SDF scenario.
ScenariosVWCLAIPlant Height
ObVWCSimVWCRRMSEPBIASIoAR2RRMSEPBIASIoAR2RRMSEPBIASIoAR2
I125N1000.2140.2218.6%−3.1%0.870.747.1%4.7%0.970.965.7%−1.6%1.001.00
I100N1000.2080.2115.3%−1.4%0.940.813.6%3.4%0.990.971.9%1.9%1.001.00
I75N1000.1850.1866.1%−0.8%0.970.915.5%3.2%0.980.952.3%1.5%1.001.00
I50N1000.1670.1719.4%−2.3%0.940.838.8%4.1%0.950.873.2%−0.8%1.001.00
I100N1250.2000.2119.8%−6.0%0.850.725.1%4.4%0.990.993.4%1.9%1.001.00
I100N750.2040.2118.7%−3.5%0.880.716.2%5.4%0.980.982.5%1.8%1.001.00
Note: VWC: soil volumetric water content (cm3/cm3), ObVWC and SimVWC: the observed and simulated average value of VWC, respectively, LAI: leaf area index (m2/m2). Other notations used in this table are the same as those in Table 1.
Table 5. Optimal SDF scenarios obtained by maximizing yield, WUE and NUE.
ScenarioYield (kg/ha)WUE (kg/(ha·mm))TCN (kg/ha)NUE (kg/kg)
I120N13010516 *41.521625.3
I50N70955947.3 *18323.1
I125N75975437.416130.2 *
Note: water use efficiency, TCN: total consumed nitrogen, NUE: nitrogen use efficiency, *: the highest potential value of yield, WUE or NUE. Other notations used in this table are the same as those in Table 1.
Publisher’s Note: MDPI stays neutral with regard to jurisdictional claims in published maps and institutional affiliations.

