Article

Evaluation of the Equations to Predict Net Energy Requirement for Lactation in the Cattle Feeding System: Based on the Literature Database

1
Division of Animal & Dairy Sciences, Chungnam National University, Daejeon 34134, Korea
2
Dairy Science Division, National Institute of Animal Science, Rural Development Administration, Cheonan 31000, Korea
*
Author to whom correspondence should be addressed.
Agriculture 2022, 12(5), 654; https://doi.org/10.3390/agriculture12050654
Submission received: 31 March 2022 / Revised: 25 April 2022 / Accepted: 29 April 2022 / Published: 30 April 2022

Abstract

:
The net energy requirement for lactation (NEL) equals the milk energy, which is the sum of the energy content from the energy-yielding nutrients in milk. The specific nutrients and their calories, however, vary depending on the feeding system. The objective of this study was to evaluate NEL prediction equations used in cattle feeding systems. A total of 11 equations from 6 feeding systems were assessed. For evaluation, a database was constructed based on the literature, and data for three nutrients (lactose, fat, and protein) were used to evaluate the equations. The equations were classified into three tiers based on the variables: Tier 1 (all three nutrients), Tier 2 (fat and protein), and Tier 3 (fat). NEL predicted by the equations were comparatively evaluated based on a reference value computed using Tyrrell and Reid’s equation. All equations showed high predictivity (in order, Tier 1, 2, and 3). Tier 1 equations showed a nearly perfect fit; however, for accurately predicting NEL, at least Tier 2 equations are recommended. The predictivity of theoretically derived equations was as high, or higher, as the predictivity of empirical equations. Thus, empirical development of an accurate equation to predict NEL, which requires a large amount of data, can be avoided.

1. Introduction

Predicting the nutrient requirement for animals is important for supplying nutrients without excess or deficiency. In particular, accurate prediction of the net energy requirement for lactation (NEL) is crucial because it is directly related to the productivity of dairy cows. The NEL requirement is defined as the energy contained in the milk and contributed by milk nutrients [1]. Thus, to the best of our knowledge, all the cattle feeding systems compute NEL based upon the milk energy estimated from the composition and energy content of the energy-yielding nutrients (i.e., lactose, fat, and protein). However, there are differences in the assumptions for the caloric value of each nutrient, depending on the feeding system.
Feeding systems model the caloric value, or heat of combustion, on individual milk nutrients using either an empirical or a theoretical approach. In the empirical approach, the energy value of each nutrient is estimated by regressing the gross energy of milk against a linear equation for milk nutrients. The Japanese, Scandinavian, and French feeding systems have accepted this concept for calculating milk energy [2,3,4]. On the other hand, the mean of the measured heat of combustion is used for the energy value of each nutrient in the theoretical approach. The feeding systems in the United States (Cornell net carbohydrate and protein system; CNCPS, and the 2001 dairy National Research Council [NRC] system) use this approach [5,6]. The two approaches can give similar values in some cases. For example, an equation constructed using a regression equation without the y-intercept by the Commonwealth Scientific and Industrial Research Organization (CSIRO) estimates the energy of lactose as 3.94 Mcal/kg [7], which is similar to the value of 3.95 Mcal/kg used in a theoretical equation by the dairy NRC. Nonetheless, because of the differences in the method for determining the caloric value of each nutrient and variations in the concentration of milk nutrients in the data used to construct an empirical model, the caloric values for milk nutrients and the predicted NEL will vary depending on the feeding system.
In addition, feeding systems provide several equations to estimate the energy of milk using different sets of nutrients: (1) all three major milk nutrients (i.e., lactose, milk protein, and milk fat); (2) milk protein and milk fat; (3) milk fat. The equation without lactose is the most commonly applied because lactose, unlike milk fat and protein, is less frequently analyzed in the field [6]. Moreover, the lactose composition in milk is less varied according to animal factors [6,8], and its caloric value is relatively constant since lactose is a homogeneous nutrient. On the contrary, milk fat and milk protein are heterogeneous nutrients, and their content in milk varies significantly. The caloric value of fat and protein can also differ substantially depending on the fatty acid composition and the ratio of casein, whey, and non-protein nitrogen (NPN) [6]. Despite differences in the number of nutrients and the energy value fpr each nutrient used to estimate milk energy between feeding systems, their predictivity has not been evaluated.
Therefore, this study evaluated the milk energy prediction equations in various cattle feeding systems. The evaluation was performed using a literature database for dairy cows constructed by collecting data from articles published in the Journal of Dairy Science over the last five years.

2. Materials and Methods

2.1. Construction of a Literature Database

A dataset was developed for systematic review and meta-analysis following the preferred reporting items for systematic reviews and meta-analyses (PRISMA) framework [9]. The adequacy of the screening procedure was evaluated through a discussion with internal reviewers. Experimental data were extracted from the literature and were initially inputted by one reviewer. A second reviewer independently verified the accuracy of the records. Finally, a third reviewer assessed the data suitability by comparing it with conventional or common values.
The selected papers in this study were those published in the Animal Nutrition section of the Journal of Dairy Science (http://www.journalofdairyscience.org/; accessed on 10 December 2020) from 2016 to 2020. We obtained 886 papers from 60 issues. Experimental data were collected if they met the following inclusion criteria. The study should conduct in vivo feeding experiments with live cattle; in other words, in vitro, in situ, and in silico data were not included. The experiments should have been conducted under normal conditions without the use of growth promoters or antibiotics. Only papers reporting all information on dry matter intake (DMI), milk production and composition (lactating cows only), body weight (BW), average daily gain (ADG), and the major feed ingredients and chemical composition of the experimental diet were included. We obtained 1185 observations from 288 articles. The descriptive statistics of the literature database constructed in this study are presented in Supplementary Table S1.

2.2. Evaluation of Milk Energy Prediction Equations

From the literature database, only data containing all information on lactose (Lact, %), milk crude protein (MilkP, %), and milk fat (MilkF, %) were selected for evaluation (n = 935). If milk protein was reported as milk true protein, it was converted into crude protein by dividing it by 0.93 [6]. The descriptive statistics for the database used to evaluate the milk energy content are shown in Table 1.
For the evaluation of each equation, the heat of combustion for milk, along with the composition of lactose, milk protein, and milk fat content, was required; however, most studies in the database did not report the heat of combustion for milk. Therefore, the reference milk energy content was calculated using the equation provided in Tyrrell and Reid [10]. In their study, gross energy and the composition of components were measured for 600 milk samples. Six equations were empirically constructed, which have been widely used to estimate milk energy. Among these equations, the equation with milk fat, milk protein, and lactose that reported the highest coefficient of determination (R2) of 0.99, the smallest standard error of estimate of 0.008 Mcal/kg, and the smallest coefficient of variation (CV) of 1.22% was chosen to estimate reference milk energy values in this study. The equation is as follows:
Milk energy = 0.0917 × MilkF + 0.0531 × MilkP + 0.0476 × Lact − 0.0258
Eleven equations from the CNCPS (New York, NY, USA), the 2001 dairy NRC (Washington DC, USA), CSIRO (Melbourne, Australia), Japan feeding standards for dairy cows (Tokyo, Japan), Nordic feed evaluation system (NorFor, Scandinavia), and Institut National de la Recherche Agronomique (INRA; Paris, France) were included in the evaluation. Each equation was classified into three tiers based on the included variables (Table 2). Four equations that require the composition of all three nutrients (Lact, MilkP, and MilkF) were classified as Tier 1 (Equations (3), (6), (8), and (10)). Three equations in which the energy from lactose is assumed to be constant were classified as Tier 2 (Equations (4), (11), and (12)). Four equations that used only milk fat to predict milk energy were classified as Tier 3 (Equations (2), (5), (7), and (9)).
The milk energy (Mcal/L) calculation equations that we evaluated are as follows:
CNCPS [5]
Milk energy = 0.0962 × MilkF + 0.3512
NRC [6]
Milk energy = 0.0929 × MilkF + 0.0547 × MilkP + 0.0395 × Lact
Milk energy = 0.0929 × MilkF + 0.0547 × MilkP + 0.192
Milk energy = 0.0969 × MilkF + 0.360
CSIRO [7]
Milk energy = 0.0911 × MilkF + 0.0586 × MilkP + 0.0394 × Lact
Milk energy = 0.1090 × MilkF + 0.2921
Japan [2]
Milk energy = 0.0869 × MilkF + 0.0516 × MilkP + 0.0344 × Lact + 0.0707
Milk energy = 0.0913 × MilkF + 0.3678
NorFor [3]
Milk energy = 0.0916 × MilkF + 0.0578 × MilkP + 0.0398 × Lact + 0.0075
Milk energy = 0.0916 × MilkF + 0.0578 × MilkP + 0.1876
INRA [4]
Milk energy = 0.0933 × MilkF + 0.0524 × MilkP + 0.1915
Although the INRA equation expresses milk protein on a true protein basis, it was modified to a crude protein basis in this study, assuming 93% of milk crude protein is true protein [6].

2.3. Statistical Analysis
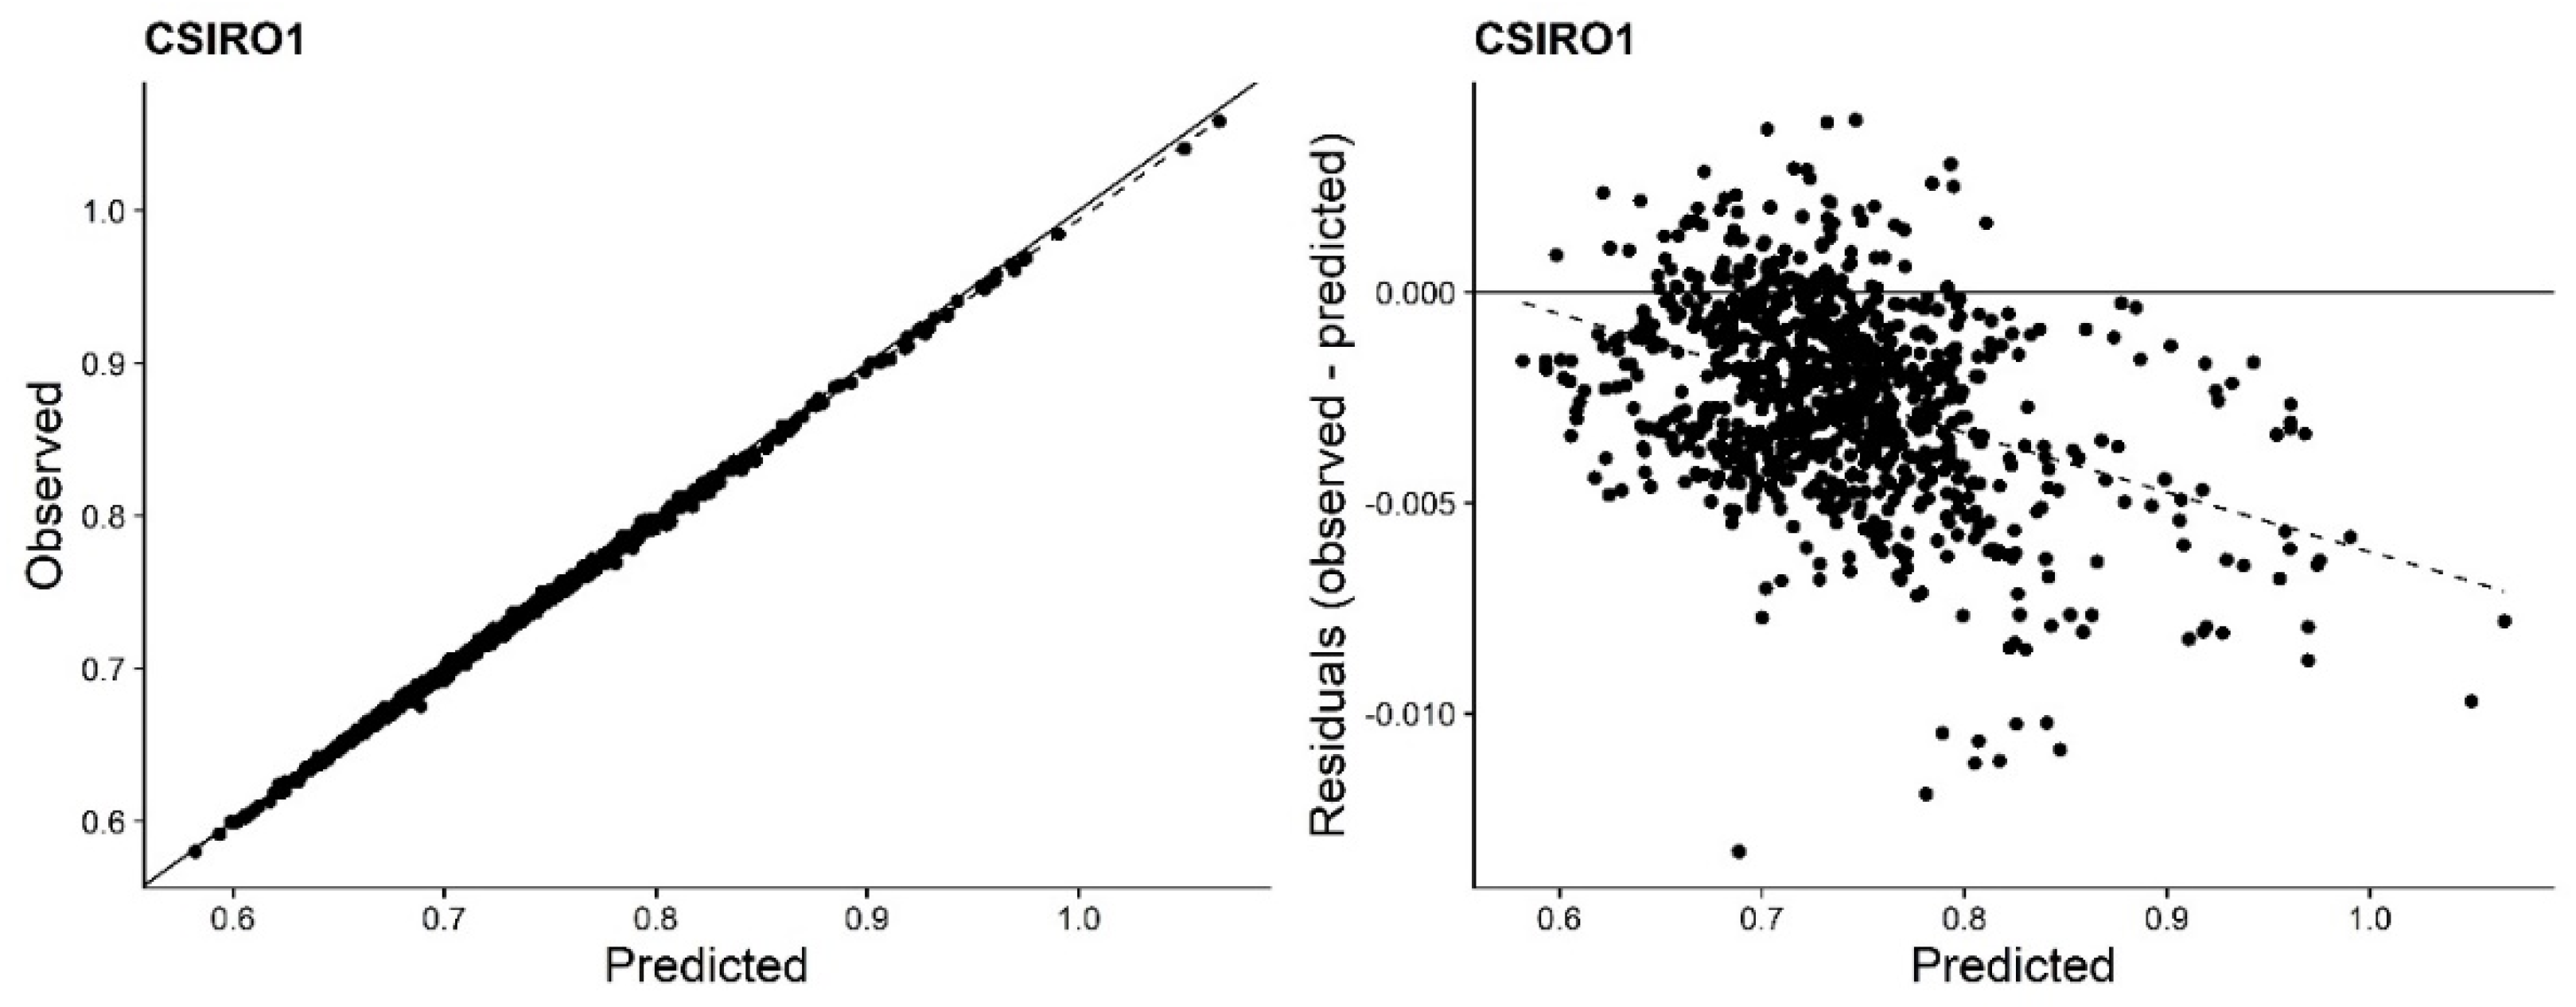
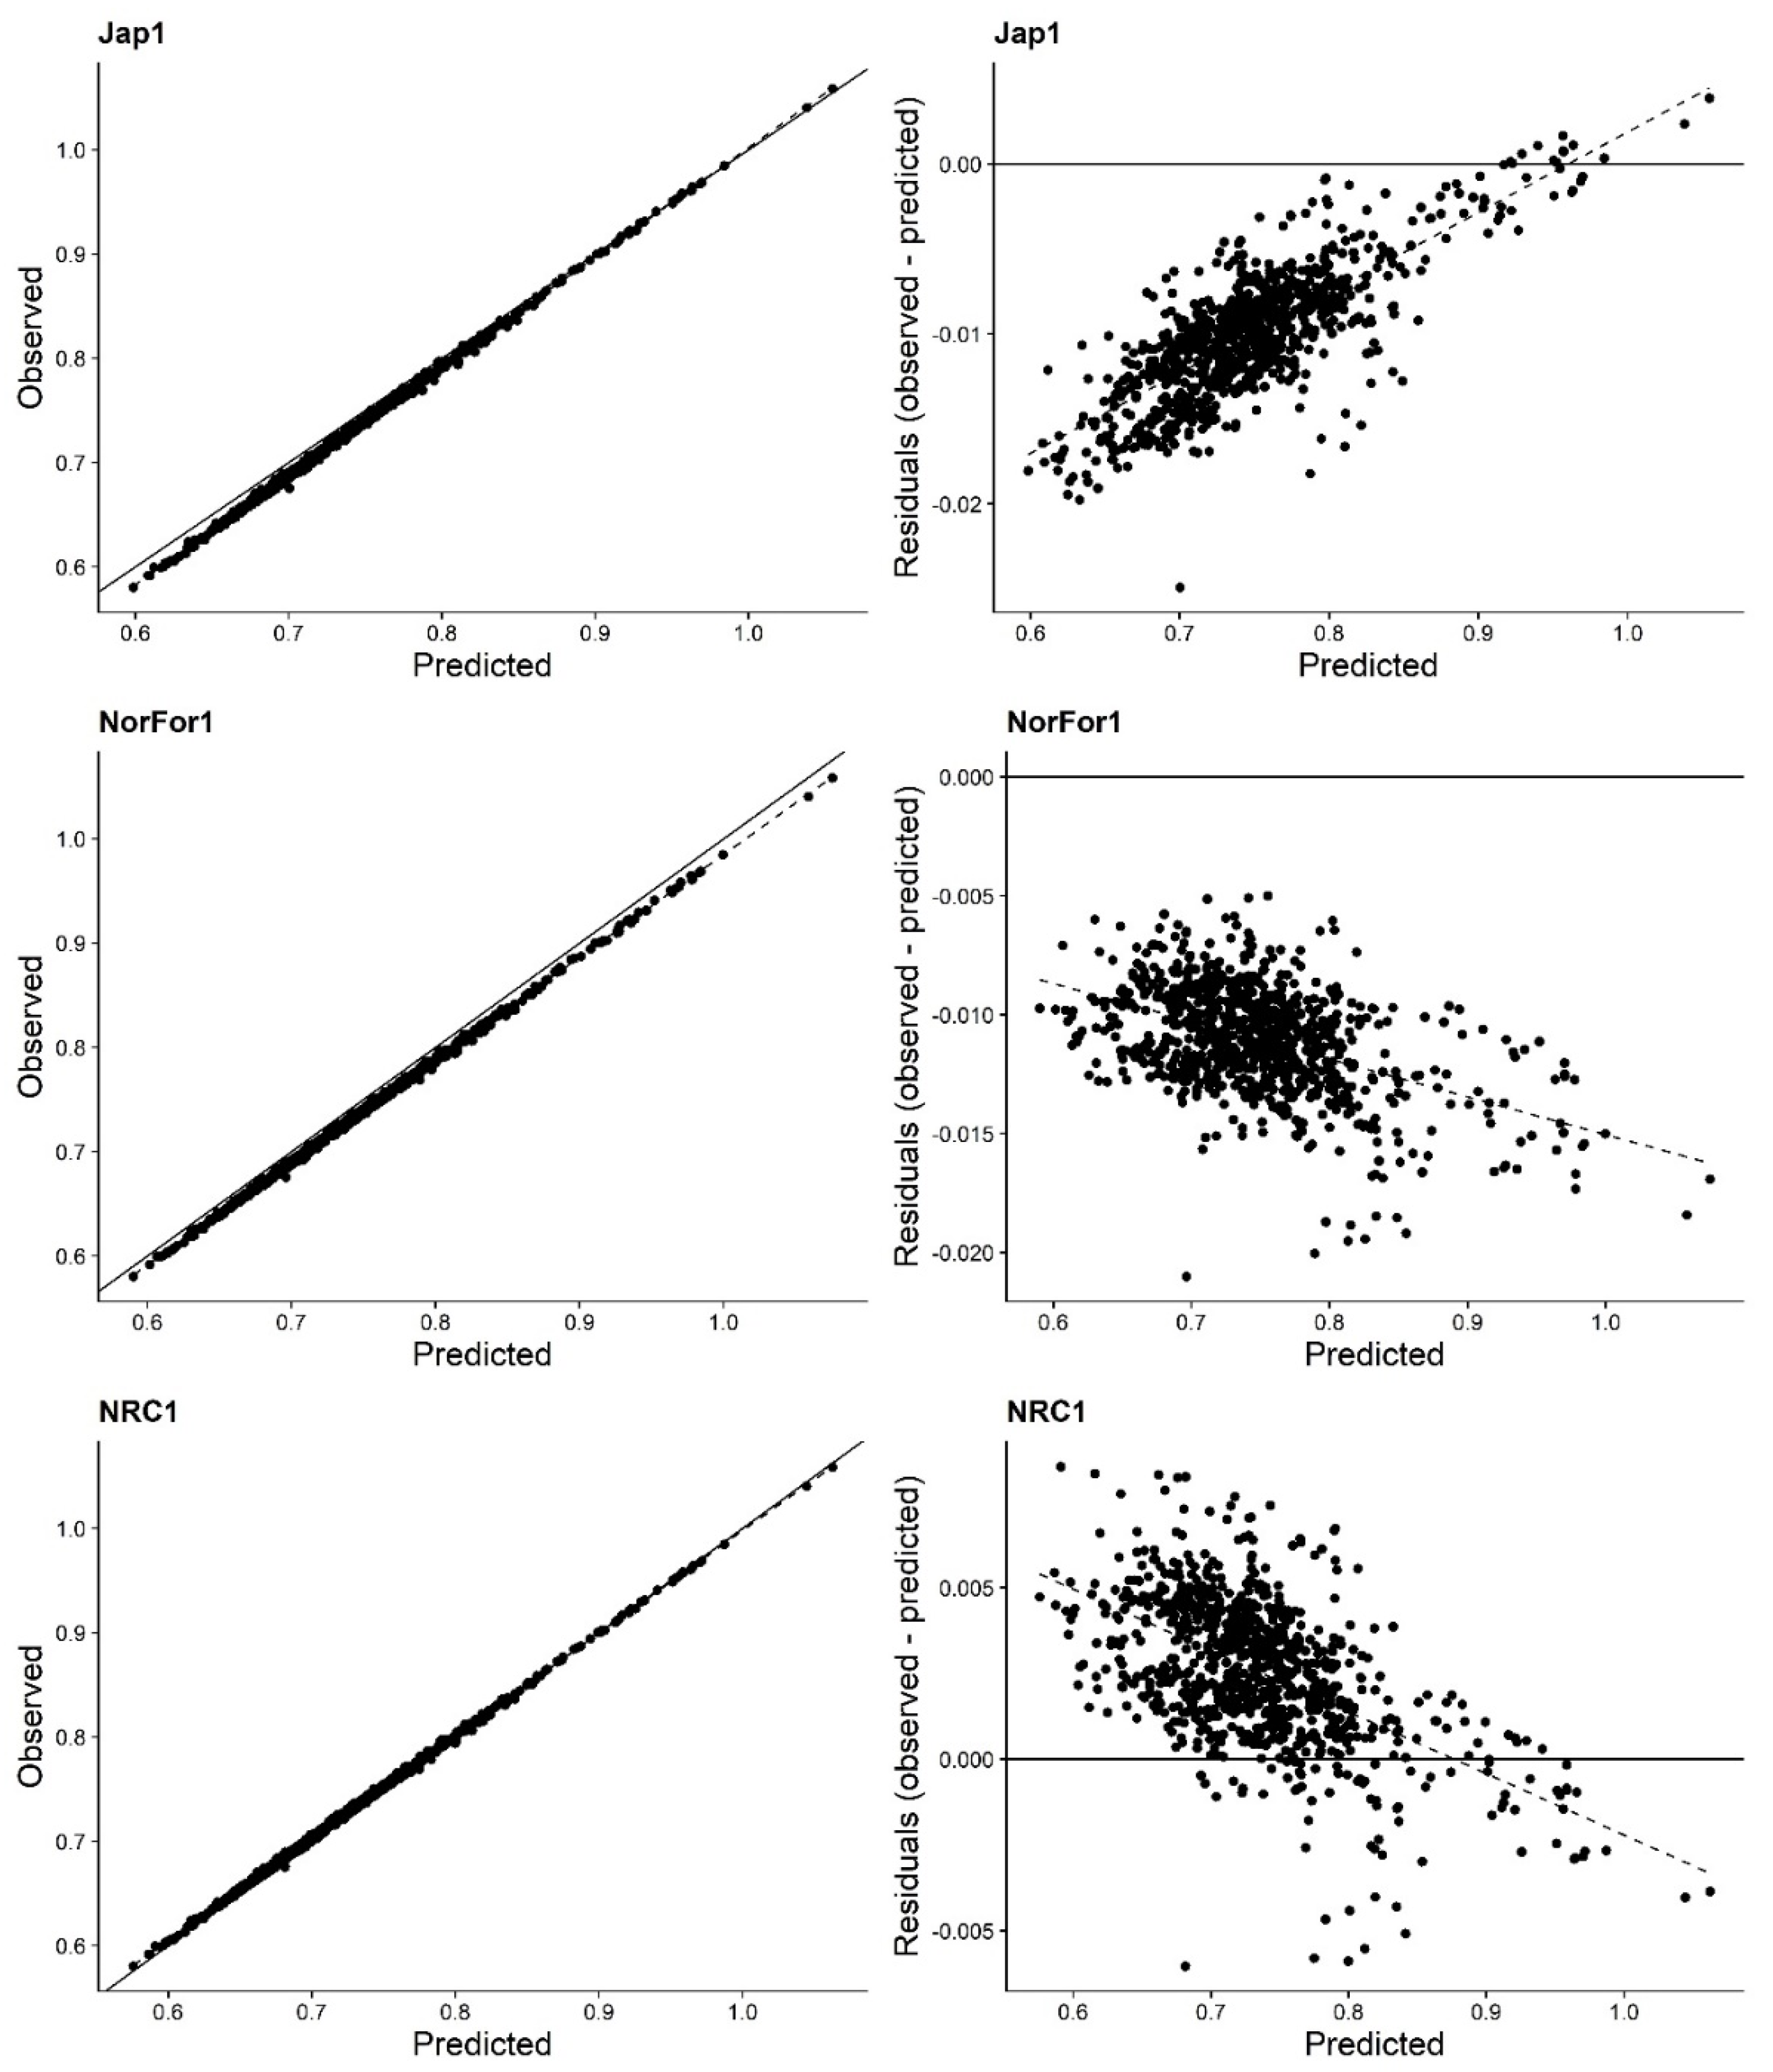
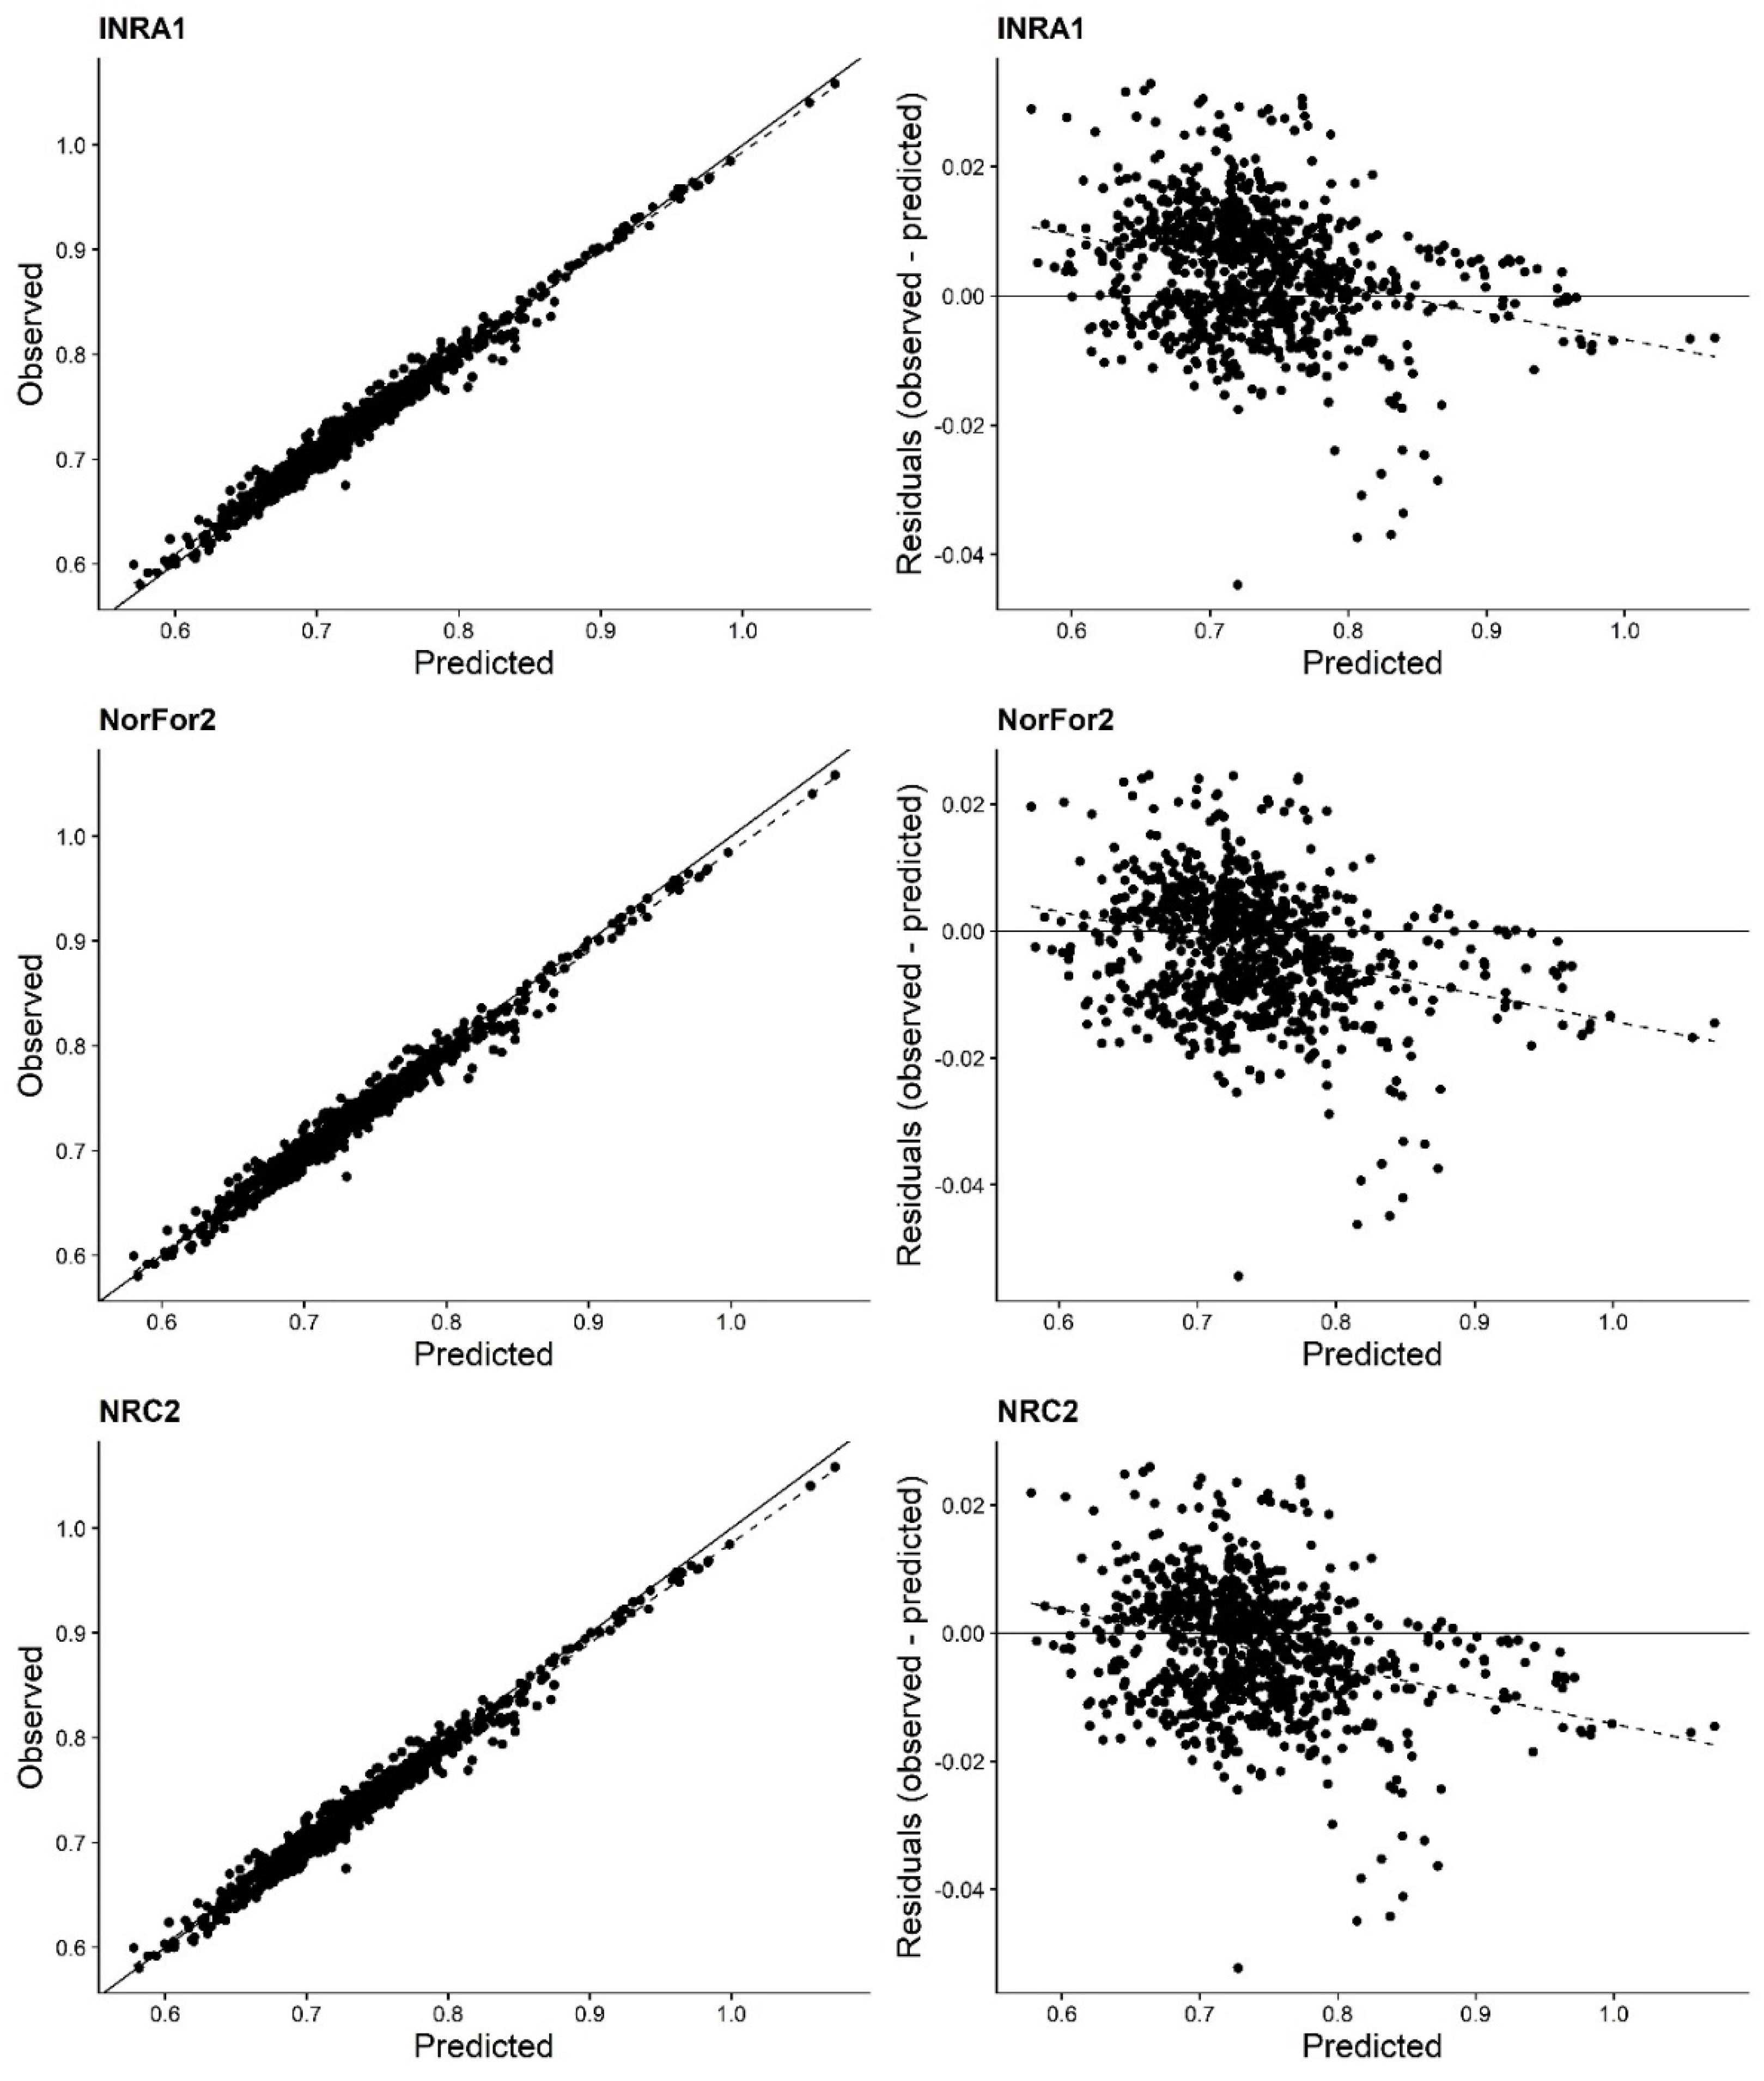
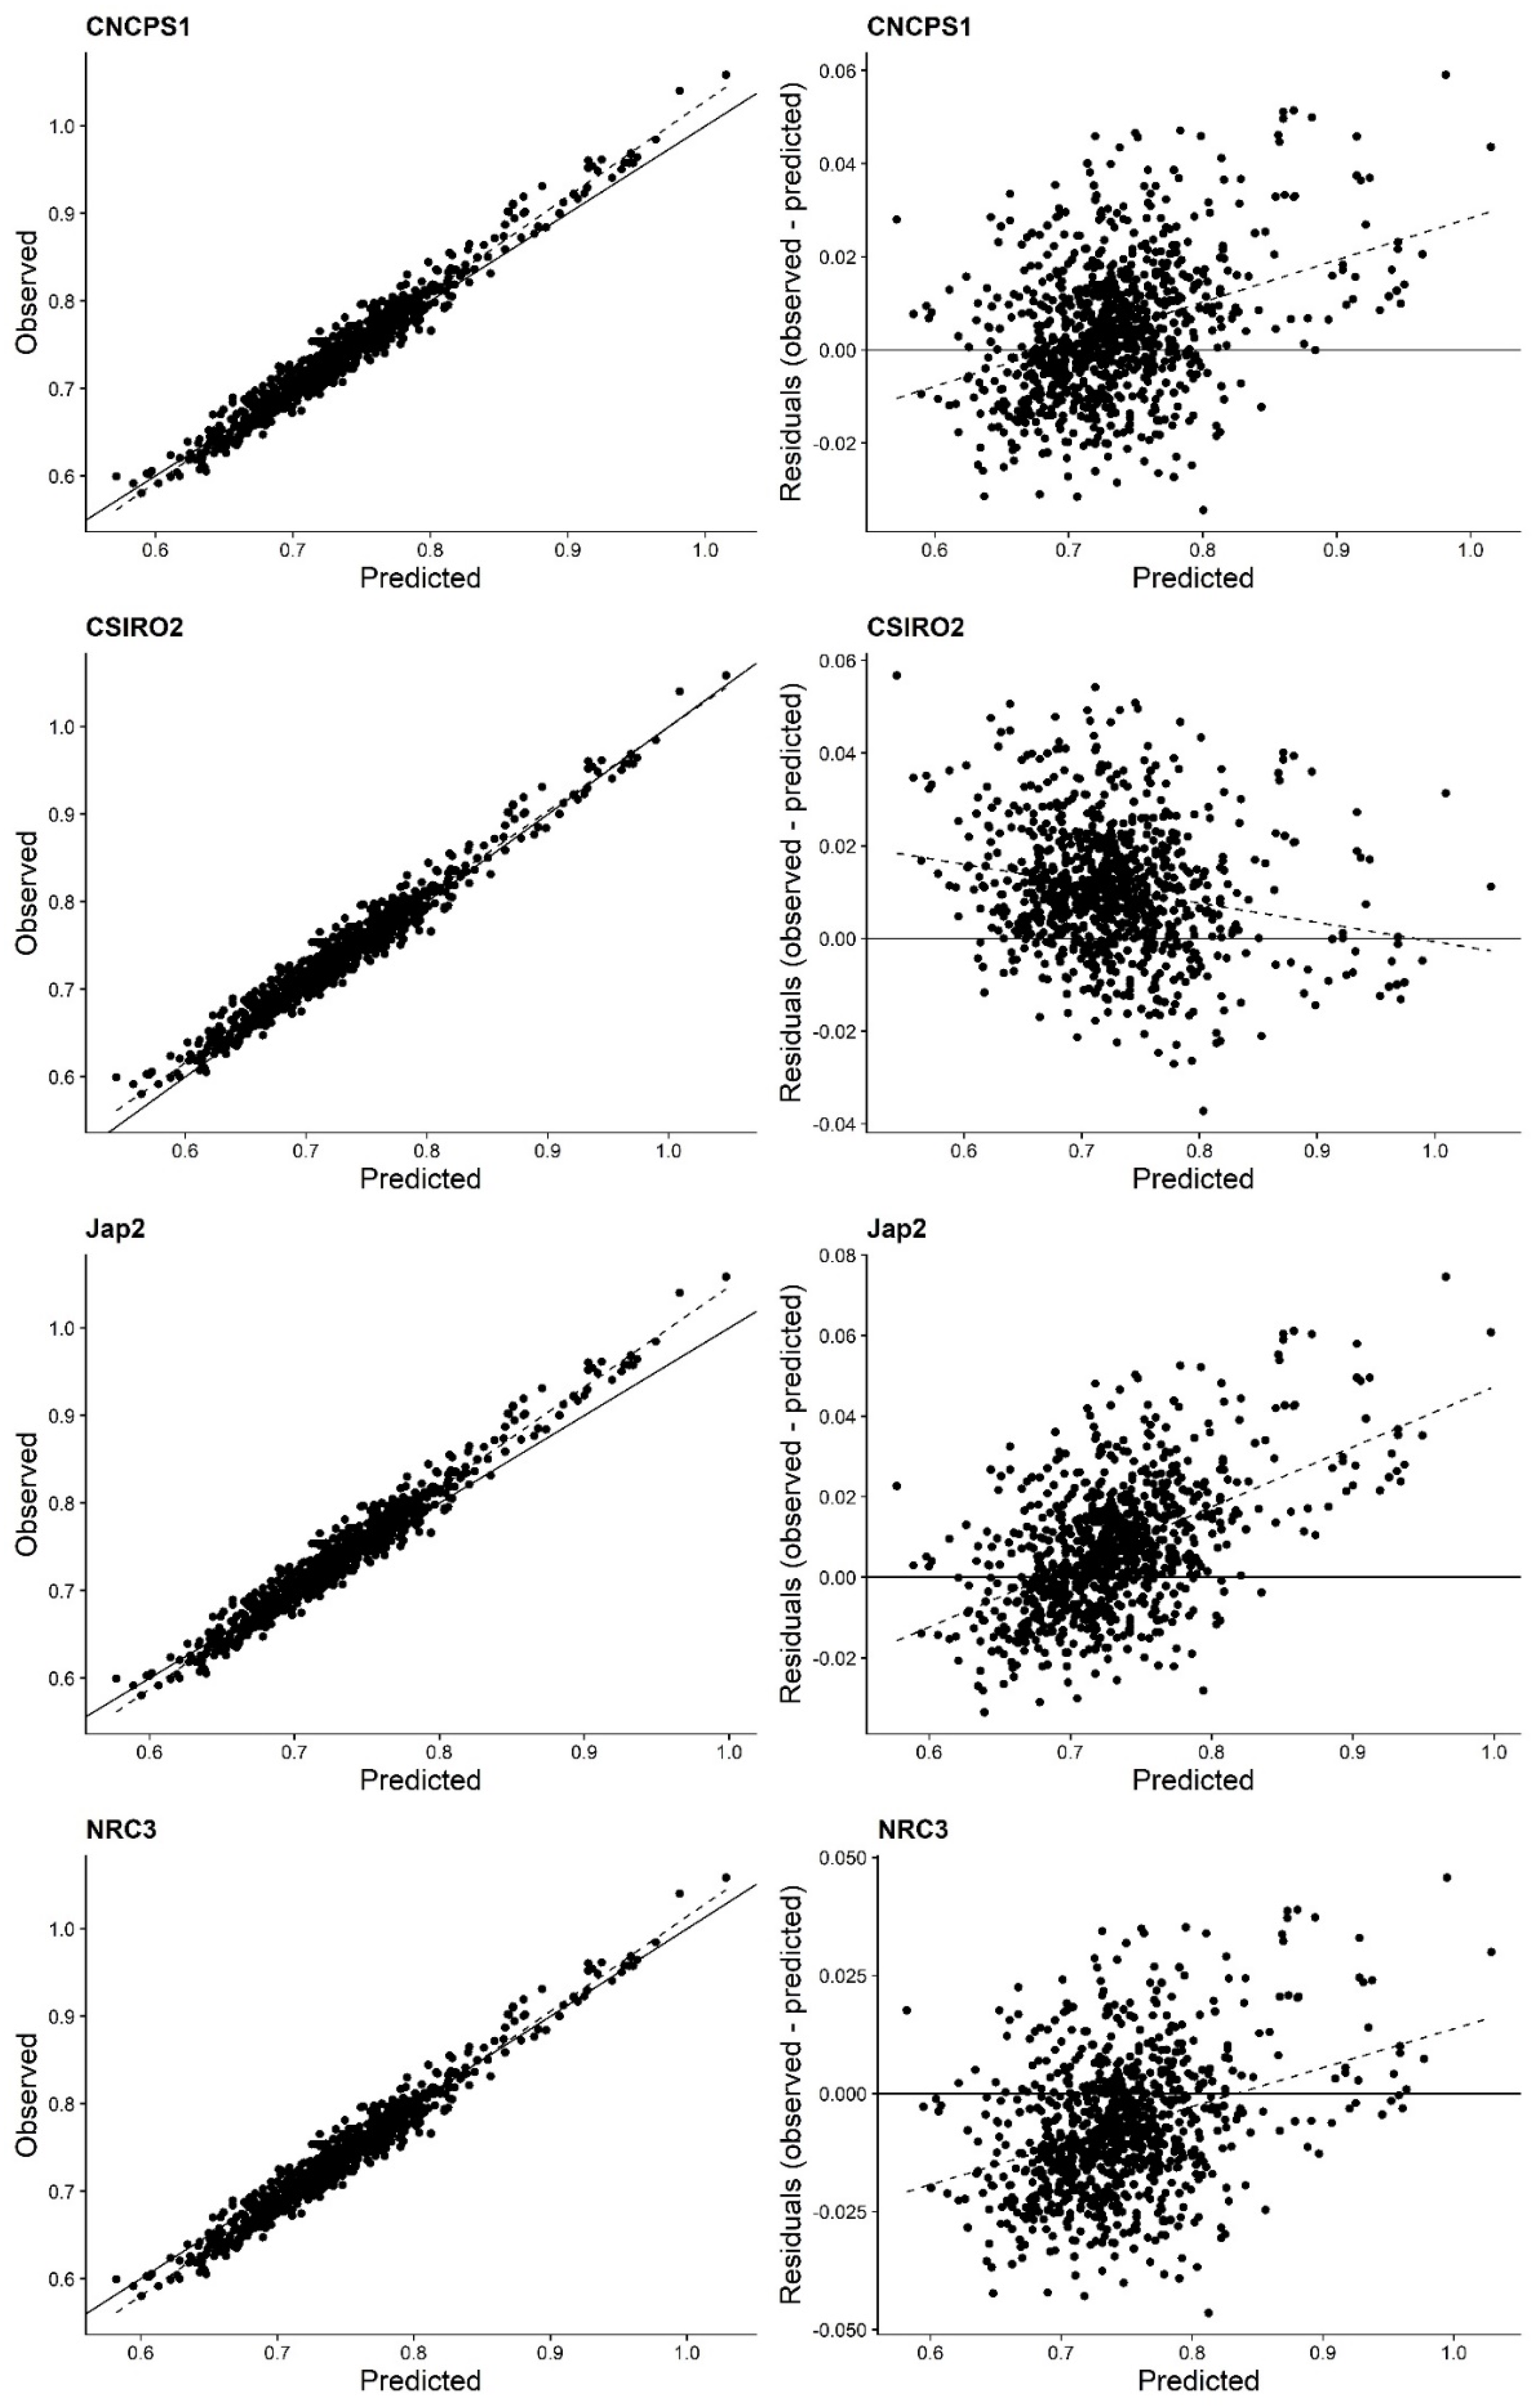
All statistical analyses were performed using R software (R Core Team, 2020; version 4.0.3, R Foundation for Statistical Computing, Vienna, Austria). Descriptive statistics were performed using the psych package and plotted using the ggplot2 and cowplot packages in R. We selected R2 to assess the precision and root mean square error of prediction (RMSEP) to determine the accuracy. The mean square error of prediction (MSEP) was partitioned into mean, slope, and random biases, and their significance was determined [11]. The concordance correlation coefficient (CCC) was also used to assess precision and accuracy [12].

3. Results

Analyzing a total of 935 experimental observations confirmed that there were large variations in the proportion of milk components, the largest of which applied to milk fat, followed by milk protein and lactose (Table 1). Milk fat concentrations ranged from 2.29 to 6.90%, and the coefficient of variation (CV) was 15.2%. The concentration ranges for milk crude protein and lactose were 2.63 to 4.67% with a CV of 8.7% and 3.69 to 5.31% with a CV of 4.2%, respectively. The concentrations of milk components were significantly correlated; the highest Pearson correlation coefficient (r) was found for milk fat and protein (r = 0.74, Table 3). Lactose concentration was negatively correlated with protein (r = −0.27) and fat (r = −0.17) concentrations in milk. When milk energy was computed using the Tyrrell and Reid equation (Equation (1)), it was highly correlated with milk fat (r = 0.98), as expected. Milk energy was also highly correlated with milk protein (r = 0.74) and poorly correlated with lactose concentration (r = −0.06).
Tier 1 equations, which all used lactose, milk protein, and milk fat as prediction variables and were included in the NRC, NorFor, CSIRO, and Japan systems accurately and precisely predicted the reference milk energy values (R2 = 1.00, RMSEP = 0.01). Among these equations, the NRC equations had the lowest RMSEP of less than 1% of the observed mean with a CCC of 1.0 (Table 4). A large part of the error in the equations from the CSIRO, Japan, NorFor, and NRC was the mean bias, which measured 53%, 88%, 96%, and 59% of RMSEP, respectively (Table 4). Slope bias was significant in all Tier 1 equations. As for the CSIRO equation, the residual value (observed—predicted) became negative as the predicted milk energy increased (Figure 1). The Japan models showed a negative residual when the predicted milk energy was less than 0.96 Mcal/kg, but a positive residual was noted when it was more than 0.96 Mcal/kg (Figure 1). The NorFor equation overestimated milk energy for all milk energy ranges, and the residual increased as the predicted milk energy value increased. The NRC equation showed a positive residual when the predicted milk energy was less than 0.88 Mcal/kg and a negative residual when it was more than that.
Tier 2 equations, which used milk protein and milk fat as variables, were included in the NRC, NorFor, and INRA systems. All three Tier 2 equations showed high and similar predictivity, with R2 = 0.98, RMSEP = 0.01, and CCC = 0.99. Although the mean and slope biases were significant, the bias was mostly random in the Tier 2 equations (Table 4). The Tier 2 models showed a positive residual when the predicted milk energy was low and a negative residual as the predicted value increased. The inflection point was 0.83, 0.67, and 0.68 Mcal/kg for the INRA, NorFor, and NRC equations, respectively (Figure 2).
Tier 3 equations, which used only one variable, milk fat, were included in the NRC, CNCPS, CSIRO, and Japan feeding systems. The Tier 3 equations also showed high prediction ability (R2 = 0.96, RMSEP = 0.02). The CNCPS equation had the lowest RMSEP of 0.01 (2.03% of the observed mean) and the highest CCC value (0.97, Table 4). Random bias accounted for most of the bias in all equations (Table 4). Among the Tier 3 equations, the CNCPS, Japan, and NRC equations showed a negative trend when the predicted milk energy values were lower than 0.69, 0.68, and 0.83 Mcal/kg, respectively, and then a positive residual beyond that. The CSIRO equation showed a positive trend when milk energy values were lower than 0.98 Mcal/kg and a negative residual when they were higher than that (Figure 3).

4. Discussion

Accurate estimation of the energy requirements for milk production is essential for lactating cows. All ruminant feeding systems estimate the net energy requirement for lactation by using the composition of energy-yielding nutrients in milk and their caloric values; however, there are differences in the number of nutrients included in the equation and the caloric value for each nutrient.
Each feeding system has developed its own milk energy prediction equations using an empirical or theoretical approach and applies them to estimate NEL. The CNCPS uses Equation (2), an empirical equation that estimates milk energy based on only the milk fat content. In the NRC, both theoretical (Equations (3) and (4)) and empirical approaches (Equation (5)) were used. Equations (3) and (4) use the mean caloric value of milk components (i.e., lactose, fat, and protein) in consideration of the average protein composition (casein, whey, and NPN) and the fatty acid composition in milk [6]. Equation (4) is a specific case of Equation (3) that assumes 4.85% lactose in milk. Equation (5) was adopted from Tyrrell and Reid [10]. The two Australian equations are both empirical equations. The Tier 1 CSIRO equation (Equation (6)) was derived by regression of milk energy, measured by bomb calorimetry, and milk nutrients without the y-intercept [13]. The other CSIRO equation (Equation (7)) is an empirical equation developed by Crovetto and Honing [14] using Jersey and Friesian cow data. The Japanese feeding standard contains Tier 1 (Equation (8)) and Tier 3 (Equation (9)) equations, both of which were empirically derived using domestic data [2]. Scandinavia’s NorFor system adopted the empirical equation estimating energy-corrected milk (ECM) developed by Sjaunja [15]. Equation (11) is simply a specific case of Equation (10) when the lactose content in milk is assumed as 4.53%, which is different from the value of 4.85% used by the NRC (2001). The INRA equation in this study (Equation (12)) is a modified version of the original equation: milk energy (Mcal/kg) = [0.42 + {0.053 × (milk fat − 4.0)} + (0.032 × {milk true protein − 3.1)}] × 1.760 [4]. The INRA has set the caloric value of standard milk, composed of 4.0% fat and 3.1% true protein, as 0.74 Mcal/kg. After rearranging this equation, it appears that the calories for milk fat and crude protein (true protein/0.93) are 9.33 and 5.24 Mcal/kg, respectively.
All equations, irrespective of their empirical or theoretical derivation, showed high predictivity; even those equations using only milk fat as a variable successfully predicted milk energy accurately (R2 > 0.96, RMSEP < 0.02). Despite very high predictivity, significant mean and slope biases were observed in all Tier 1 equations. The mean bias was particularly large for the Japanese Tier 1 equation (Table 4), which may be due to a larger constant—the minimum milk energy value—although the caloric values for the milk components were lower than the other equations in this study. In addition, the Japanese Tier 1 equation had a positive slope bias, unlike the other three Tier 1 equations (i.e., CSIRO, NorFor, and NRC), which showed a negative slope bias. A negative slope bias implies that the equations tend to overpredict milk energy when it is high. This may be due to the high caloric value for milk protein in these equations compared to Tyrrell and Reid’s equation. When the data were divided into three groups according to milk energy content (low, <0.74; medium, 0.74~0.90; high, ≥0.90 Mcal/kg), there were significant differences among the groups for the mean concentration of milk fat and protein (p < 0.01; Table 5). Compared to the low energy group, the high energy group had 1.26- and 1.64-fold higher milk protein and fat concentrations, respectively. Therefore, when using equations that assume high caloric values for milk protein and fat, the predicted energy values will always be high for high-energy milk.
The Tier 2 equations, which assume a constant lactose content, also showed high predictivity. The Tier 2 equations from NorFor and NRC are special cases of the corresponding Tier 1 equations that assume a lactose content of 4.53% and 4.85%, respectively. Milk lactose concentration is known to be relatively constant because water moves to the udder by osmotic pressure according to the lactose concentration [16,17]. However, the lactose content of milk varies with breed, parity, stage of lactation, and dietary energy level [18,19], and its variation in our database was not trivial. The range for lactose concentration was 1.62%p, and thus, assuming the caloric value of lactose is 3.95 Mcal/kg, a difference of 0.064 (3.95 × 1.62% × 0.01) Mcal/kg milk can occur, which is equivalent to a NEL of 2.24 Mcal/d for a dairy cow producing 35 kg of milk per day. Nevertheless, a constant milk lactose concentration seems a practically feasible assumption based on our findings that the correlation between lactose concentration and milk energy was low (−0.06, Table 3), and the mean lactose concentration did not differ between the milk energy groups (Table 5).
Tier 3 equations include only milk fat for predicting NEL. Since milk fat concentration is highly correlated with milk energy (Table 3), milk energy can be estimated accurately even when only milk fat content is known. Milk fat is the most important nutrient for assessing milk energy because (1) it has the largest caloric value per unit, (2) it is the most variable nutrient, and (3) milk fat has been used as a primary nutrient to evaluate the value of milk in the past, such as 4% FCM [20]. Compared with Tier 2 equations, however, the extent of the mean and slope biases were twice as large for Tier 3 equations. Tier 3 equations assume a constant milk protein content; however, milk protein content varies considerably depending on the stage of lactation, energy intake, protein intake, and season [18,21]. The range of milk protein concentration observed in our database was 2.04%p. Assuming the caloric value of milk protein is 5.47 Mcal/kg, a maximum difference of 0.112 (5.47 × 2.04% × 0.01) Mcal/kg is equivalent to a NEL of 3.91 Mcal/d for a dairy cow producing 35 kg of milk per day. Moreover, the high energy milk group had 0.81%p higher milk protein concentration than the low energy milk group. Therefore, although milk fat can explain most variations in milk energy, it is recommended that at least Tier 2 equations are used to predict NEL accurately.

5. Conclusions

We conclude that all the tested equations for estimating the amount of milk energy had high predictivity since R2 was higher than 0.96 and RMSEP was lower than 0.02 Mcal/kg, and they are applicable in the field depending on the availability of information about the composition of the milk. Nevertheless, at least Tier 2 equations, which use both milk protein and milk fat content to predict milk energy, are recommended for accurately predicting the NEL for lactating dairy cows. The predictivity of the NRC equations, which were theoretically derived from the caloric values for each milk component, was as high, or higher, than the predictivity of the empirical equations. Since the latter requires a large amount of data for development, this effort can be avoided when developing an equation to accurately predict NEL.

Supplementary Materials

The following supporting information can be downloaded at: https://www.mdpi.com/article/10.3390/agriculture12050654/s1, Table S1: Descriptive statistics of the literature database for dairy cattle (n = 1185).

Author Contributions

Conceptualization, S.J. and S.S.; methodology, S.J. and S.S.; validation, S.J., H.K. and S.S.; formal analysis, S.J.; investigation, H.K.; resources, S.P.; data curation, S.J., H.K. and S.S.; writing—original draft preparation, S.J. and H.K.; writing—review and editing, S.S.; visualization, S.J.; supervision, S.P. and S.S.; project administration, S.P. and S.S. All authors have read and agreed to the published version of the manuscript.

Funding

This research was funded by the Cooperative Research Program for Agriculture Science and Technology Development (project no. PJ01425003), Rural Development Administration, Republic of Korea.

Institutional Review Board Statement

Not applicable.

Data Availability Statement

Not applicable.

Conflicts of Interest

The authors declare no conflict of interest.

References

  1. Eastridge, M.L. Energy in the New Dairy NRC; The Ohio State University: Columbus, OH, USA, 2002. [Google Scholar]
  2. Central Association of Livestock Industry. Japanese Feeding Standard for Dairy Cattle; Agriculture, Forestry and Fisheries Research Council Secretariat: Tokyo, Japan, 2017. [Google Scholar]
  3. Volden, H. NorFor-: The Nordic Feed Evaluation System; Springer Science & Business Media: Berlin/Heidelberg, Germany, 2011; Volume 30. [Google Scholar]
  4. Noziere, P.; Sauvant, D.; Delaby, L. INRA Feeding System for Ruminants; Wageningen Academic Publishers: Wageningen, The Netherlands, 2018. [Google Scholar]
  5. Fox, D.G.; Tedeschi, L.; Tylutki, T.; Russell, J.; Van Amburgh, M.; Chase, L.; Pell, A.; Overton, T. The Cornell Net Carbohydrate and Protein System model for evaluating herd nutrition and nutrient excretion. Anim. Feed. Sci. Technol. 2004, 112, 29–78. [Google Scholar] [CrossRef]
  6. NRC. Nutrient Requirements of Dairy Cattle: 2001; National Academies Press: Washington, DC, USA, 2001. [Google Scholar]
  7. Primary Industries Standing Committee. Nutrient Requirements of Domesticated Ruminants; CSIRO Publishing: Collingwood, Australia, 2007. [Google Scholar]
  8. Toledo-Alvarado, H.; Vazquez, A.I.; de Los Campos, G.; Tempelman, R.J.; Gabai, G.; Cecchinato, A.; Bittante, G. Changes in milk characteristics and fatty acid profile during the estrous cycle in dairy cows. J. Dairy Sci. 2018, 101, 9135–9153. [Google Scholar] [CrossRef] [PubMed]
  9. Moher, D.; Liberati, A.; Tetzlaff, J.; Altman, D.G.; Group, P. Preferred reporting items for systematic reviews and meta-analyses: The PRISMA statement. PLoS Med. 2009, 6, e1000097. [Google Scholar] [CrossRef] [PubMed] [Green Version]
  10. Tyrrell, H.; Reid, J. Prediction of the energy value of cow’s milk. J. Dairy Sci. 1965, 48, 1215–1223. [Google Scholar] [CrossRef]
  11. Bibby, J. Prediction and Improved Estimation in Linear Models; Wiley: Berlin, Germany, 1977. [Google Scholar]
  12. Lawrence, I.; Lin, K. A concordance correlation coefficient to evaluate reproducibility. Biometrics 1989, 45, 255–268. [Google Scholar]
  13. Perrin, D.R. The calorific value of milk of different species. J. Dairy Res. 1958, 25, 215–220. [Google Scholar] [CrossRef]
  14. Crovetto, G.; Honing, Y.V.D. Prediction of the energy content of milk from Friesian and Jersey cows with normal and high fat concentration. Z. Tierphysiol. Tierernährung Futterm. 1984, 51, 88–97. [Google Scholar] [CrossRef]
  15. Sjaunja, L. A Nordic proposal for an energy-corrected milk (ECM) formula. In Proceedings of the 27th Session International Committee for Recording and Productivity of Milk Animals, Paris, France, 2–6 July 1990. [Google Scholar]
  16. Costa, A.; Lopez-Villalobos, N.; Sneddon, N.; Shalloo, L.; Franzoi, M.; De Marchi, M.; Penasa, M. Invited review: Milk lactose—Current status and future challenges in dairy cattle. J. Dairy Sci. 2019, 102, 5883–5898. [Google Scholar] [CrossRef] [PubMed]
  17. NASEM. Nutrient Requirements of Dairy Cattle, 8th ed.; The National Academies Press: Washington, DC, USA, 2021. [Google Scholar]
  18. Fox, P.F.; Uniacke-Lowe, T.; McSweeney, P.L.H.; O’Mahony, J.A. Dairy Chemistry and Biochemistry, 2nd ed.; Springer: London, UK, 2005. [Google Scholar]
  19. Lim, D.H.; Mayakrishnan, V.; Ki, K.S.; Kim, Y.; Kim, T.I. The effect of seasonal thermal stress on milk production and milk compositions of Korean Holstein and Jersey cows. Anim. Biosci. 2021, 34, 567–574. [Google Scholar]
  20. Gaines, W.L. The Energy Basis of Measuring Milk Yield in Dairy Cows; Illinois Agricultural Experiment Station: Urbana, IL, USA, 1928. [Google Scholar]
  21. Walker, G.; Dunshea, F.; Doyle, P. Effects of nutrition and management on the production and composition of milk fat and protein: A review. Aust. J. Agric. Res. 2004, 55, 1009–1028. [Google Scholar] [CrossRef]
Figure 1. Plots of observed versus predicted milk energy (Mcal/L) and observed minus predicted (residual) versus predicted milk energy (Mcal/L) using Tier 1 equations. The dotted lines represent the regression lines. CSIRO, Commonwealth Scientific and Industrial Research Organization; Jap, Japan; NorFor, Nordic feed evaluation system (Scandinavia); NRC, National Research Council.
Agriculture 12 00654 g001aAgriculture 12 00654 g001b
Figure 2. Plots of observed versus predicted milk energy (Mcal/L) and observed minus predicted (residual) versus predicted milk energy (Mcal/L) using Tier 2 equations. The dotted lines represent the regression lines. INRA, Institut National de la Recherche Agronomique; NorFor, Nordic feed evaluation system (Scandinavia); NRC, National Research Council.
Agriculture 12 00654 g002
Figure 3. Plots of observed versus predicted milk energy (Mcal/L) and observed minus predicted (residual) versus predicted milk energy (Mcal/L) using Tier 3 equations. The dotted lines represent the regression lines. CNCPS, Cornell Net Carbohydrate and Protein System; CSIRO, Commomwealth Scientific and Industrial Research Organization; Jap, Japan; NRC, National Research Council.
Agriculture 12 00654 g003
Table 1. Descriptive statistics of the literature database used for the final model evaluation (n = 935).
VariablesnMeanMedianMinMax
No. of animals per treatment93514.212.04.093.0
Days in milk (day)892138.7143.09.5357.0
Days in pregnancy (day)486.086.086.086.0
Parity number2952.82.41.012.0
Body weight (kg)935637.6645.8374.1804.9
Average daily gain (kg/day)4950.090.14−5.003.43
Milk yield (kg/day)93534.334.69.058.3
Milk composition (%)
Lactose9354.734.753.695.31
Fat9353.973.912.296.90
Crude protein9353.273.232.634.67
Dry matter intake (kg/d)93522.622.711.232.0
Forage intake (kg/d)90412.412.24.322.0
Dietary composition (%)
Dry matter60550.450.313.589.6
Organic matter67492.492.583.598.9
Crude protein88916.516.610.726.8
Neutral detergent fiber90033.332.620.260.8
Fat5893.833.701.648.90
Ash6747.637.501.1016.5
Starch60323.223.90.238.2
Dietary energy (Mcal/kg)
Total digestible nutrients (%)4071.072.060.278.4
Gross energy2064.374.403.944.37
Digestible energy963.093.072.683.09
Metabolizable energy1472.732.732.392.73
Table 2. Parameters of the equations to predict milk energy (Mcal/kg) according to the tiers.
Parameters 1
Group 2System 3abcε
Tyrrell and Reid 44.765.319.17−0.0258
Tier 1CSIRO3.945.869.11
Japan3.445.168.690.0707
NorFor3.985.789.160.0075
NRC3.955.479.29
Tier 2INRA 5.249.330.1915
NorFor 5.789.160.1876
NRC 5.479.290.1920
Tier 3CNCPS 9.620.3512
CSIRO 10.900.2921
Japan 9.130.3678
NRC 9.690.3600
1 Milk energy (Mcal/L) = [a × lactose (%) + b × milk protein (%) + c × milk fat (%)]/100 + ε; a is calories from lactose, b is calories from milk protein, c is calories from milk fat, ε is y intercept. 2 Tier 1: lactose, milk protein, and milk fat; Tier 2: milk protein and milk fat; Tier 3: milk fat. 3 CSIRO, Commonwealth scientific and industrial research organization (Australia); Japan, Japan feeding standards for dairy cow; NorFor, Nordic feed evaluation system (Scandinavia); NRC, Nutrients requirement of dairy cattle (USA); INRA, Institut national de la recherche agronomique (France); CNCPS, Cornell net carbohydrate and protein system (USA). 4 Milk energy = 0.0917 × MilkF + 0.0531 × MilkP + 0.0476 × Lact − 0.0258 [10].
Table 3. Coefficient of correlation (r) of milk energy and milk nutrients (lactose, milk fat, and milk protein).
Milk Energy 1LactoseMilk FatMilk Protein
Milk energy1.00
Lactose−0.061.00
Milk fat0.98−0.171.00
Milk protein0.74−0.270.631.00
1 Milk energy = 0.0917 × MilkF + 0.0531 × MilkP + 0.0476 × Lact − 0.0258 (Tyrrell and Reid, 1965).
Table 4. Evaluation of precision, accuracy, prediction error, and source of bias of the different milk energy prediction models (n = 935).
Tier 1 1Tier 2 1Tier 3 1
Item 3CSIRO1Japan1NorFor1NRC1INRA1NorFor2NRC2CNCPS1CSIRO2Japan2NRC3
Observed Mean0.740.740.740.740.740.740.740.740.740.740.74
Predicted Mean0.740.750.750.730.730.740.740.730.730.730.74
R 21.001.001.001.000.980.980.980.960.960.960.96
RMSEP0.000.010.010.000.010.010.010.010.020.020.02
RMSEP, % observed mean0.461.461.530.451.421.411.372.032.352.332.17
Mean Bias, % RMSEP52.6187.9796.0059.1014.988.186.377.8938.2916.7521.28
Slope Bias, % RMSEP7.347.340.8612.586.627.738.6512.282.5122.759.06
Random Bias, % RMSEP40.054.693.1428.2778.4084.0984.9879.8359.2060.5069.66
Mean bias0.00−0.01−0.010.000.000.000.000.000.010.01−0.01
p-value<0.01<0.01<0.01<0.01<0.01<0.01<0.01<0.01<0.01<0.01<0.01
Slope bias−0.010.05−0.02−0.02−0.04−0.04−0.040.09−0.040.150.08
p-value<0.01<0.01<0.01<0.01<0.01<0.01<0.01<0.01<0.01<0.01<0.01
CCC1.000.990.991.000.990.990.990.970.970.960.97
1 Tier 1: lactose, milk protein, and milk fat; Tier 2: milk protein and milk fat; Tier 3: milk fat. 2 CSIRO, Commonwealth scientific and industrial research organization (Australia); Japan, Japan feeding standards for dairy cow; NorFor, Nordic feed evaluation system (Scandinavia); NRC, Nutrients requirement of dairy cattle (USA); INRA, Institut national de la recherche agronomique (France); CNCPS, Cornell net carbohydrate and protein system (USA). 3 RMSEP, root mean square error of prediction; CCC, concordance correlation coefficient.
Table 5. Content of milk components by milk energy (low, medium, and high).
Group 1
ComponentLowMediumHighSEMp-Value
Lactose4.744.724.680.0360.05
Protein3.133.423.940.038<0.01
Fat3.584.345.860.059<0.01
1 Low, Milk energy < 0.74 Mcal/kg; Medium, 0.74 Mcal/kg < Milk energy < 0.90 Mcal/kg; High, Milk energy > 0.90 Mcal/kg. The cutoff values of 0.74 Mcal/kg and 0.90 Mcal/kg are 1/3 and 2/3 of the value of maximum—minimum of milk energy in the database, respectively.
Publisher’s Note: MDPI stays neutral with regard to jurisdictional claims in published maps and institutional affiliations.

