Abstract
Using discrete element simulation to reveal the interaction between seed and seed metering devices (SMD) is an important method for developing SMDs. However, due to the lack of discrete element modeling (DEM) parameters of adzuki bean seeds (ABS) in existing literature, it is difficult to develop a suitable SMD. In this study, the DEM parameters of ABS were determined by a combination of physical tests and virtual calibration. Initially, the intrinsic parameters, contact parameters, and angle of repose (AOR) of ABS were measured. The parameters significantly affected AOR were then screened out by Plackett–Burman test. Furthermore, the Steepest Ascent test was used to determine the optimal interval value of significant parameters. Finally, the optimal values of significant parameters were obtained by the Box–Behnken test with an AOR of 23.93° and an error of 0 as targets. The results showed that the coefficient of static friction of ABS–ABS, coefficient of static friction of ABS-photosensitive resin plate, and coefficient of rolling friction of ABS–ABS significantly affected the AOR, and their optimal values were 0.302, 0.282, and 0.043, respectively. The verification test showed that the relative error between simulated and measured values of AOR was 0.67%. This indicated that the determined DEM parameters were accurate and reliable. The results from the study can provide a reference for the selection of DEM parameters in the mechanized seeding process of ABS.
1. Introduction
China is the country with the largest output of adzuki beans in the world. In 2018, the planting area of adzuki bean was 182.44 thousand hectares, and the yield was 0.28 million tons [1]. At present, adzuki bean planting in China mainly depends on manual operation, which is costly and inefficient. The development of adzuki bean sowing machinery is an important way to solve this problem. As a core component, a seed metering device (SMD) directly affects the performance of sowing machinery. The development of high-performance SMDs is essential to improve the sowing quality and efficiency and increase agricultural production.
Accurate modeling of the seed–SMD interaction will allow optimization of the SMD without performing expensive and time-consuming field tests which may only be undertaken at certain times of the year [2,3,4]. The discrete element modeling (DEM), which is a discontinuum numerical method for modeling the mechanical behavior of granular materials, is a relevant approach for modeling the metering process of adzuki bean seeds (ABS). In recent years, the operation process of an SMD has been simulated using the DEM to reveal the complex interaction of key components and seeds, which can be performed without relying on expensive and time-consuming physical tests [5,6,7]. Establishing a simulation model in EDEM software requires the input of specific parameter values, such as density, Poisson’s ratio, shear modulus, coefficient of restitution, friction factor, etc. [8]. Due to individual differences in materials, test errors, and other factors, it is difficult to obtain the accurate DEM parameters only by direct measurement, i.e., DEM parameters have generally been determined by a combination of physical measurement and virtual calibration.
The angle of repose (AOR) test is an effective method to calibrate the DEM parameters [9]. Wang et al. [10] calibrated the friction parameters between corn seeds with the measured AOR as the target value, and it was found that the simulation stacking angle profile was closer to the actual one. Ghodki et al. [11] used the measured soybean height and AOR as the response values to calibrate the soybean DEM parameters; the simulated particle height and AOR values had relative errors of 3.73% and 2.77%, respectively. Ma et al. [12] established the regression model between saliency parameter and AOR based on the response surface method and solved the alfalfa seed DEM parameters through the non-dominated sorting genetic algorithm. Liao et al. [13] calibrated the parameters of the discrete element contact model of feed rape stalk through response surface analysis and optimization with a minimum relative error of simulated AOR as the target; it was found that the relative error between simulated and measured AOR was 1.83%. Cao et al. [14] calibrated the rapeseed DEM parameters using a combination of measurement and simulation, and the relative error between simulated and measured values of the qualified rate of sowing was 0.15%. At present, researchers at home and abroad have measured and calibrated the DEM parameters of some seeds. However, there are few reports on the measurement and calibration of DEM parameters of ABS.
In this study, the DEM parameters interval values and AOR of ABS were measured by physical measurements. On this basis, Plackett–Burman test, Steepest Ascent test and Box–Behnken test were used to calibrate the specific values of DEM parameters. The accuracy of the DEM parameters after calibration was validated by comparing the simulated and measured AOR values. It is expected to provide a basis for the selection of DEM parameters in the mechanized seeding process of ABS.
2. Materials and Methods
2.1. Materials
The adzuki bean seeds (ABS) tested were cultivated by Lvbao Co., Ltd., China, in September 2020. The purity and germination rates were more than 96% and 85%, respectively. The thousand-grain weight, particle density, and moisture content (wet basis) were 127 g, 1323 kg m−3, and 13.19%, respectively.
2.2. Physical Tests
The purpose of the physical tests was to provide the basis for the value of the DEM parameters of ABS. The DEM parameters of ABS mainly include intrinsic parameters and contact parameters. Photosensitive resin materials have been widely used for 3D printing SMDs in previous studies [15,16,17]. Therefore, the photosensitive resin plate (PRP) was selected as the contact material. The intrinsic parameters are triaxial size, Poisson’s ratio, and shear modulus of ABS; contact parameters include coefficient of restitution, coefficient of static friction, and coefficient of rolling friction between ABS–ABS and ABS–PRP. The AOR test of ABS was performed for subsequent calibration.
2.2.1. Triaxial Size, Poisson’s Ratio and Shear Modulus
Using an electronic vernier caliper (Mitutoyo Co., Ltd., Japan) with an accuracy of 0.01 mm, 250 ABS were selected randomly for the measurement of its 3D sizes (i.e., L, W, T), as shown in Figure 1a. Each size was measured 3 times to obtain the average value. After testing, the L, W and T were 6.54 ± 0.522, 5.63 ± 0.289, and 5.22 ± 0.300 mm, respectively, and they all met the normal distribution. Therefore, the ABS in the simulation was generated according to the normal distribution.
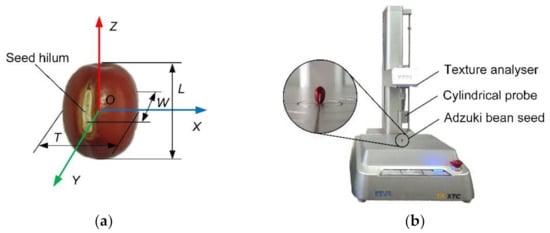
Figure 1.
Intrinsic parameter measurement. (a) triaxial size measurement position; (b) compression test.
The compression test of ABS was carried out using a TA.XTC-18 texture analyzer (BosinTech Co., Ltd., Shanghai, China), as shown in Figure 1b. The measurement process is as follows: the 20 ABS were randomly selected, and the original sizes of L, W, and T were recorded [15]. The ABS was placed vertically under the center of a TA/36 cylindrical probe before compression. The test type was full texture test. Moreover, the travel speed and the trigger point values were 0.1 mm s−1 and 20 gf, respectively. The loading was stopped when the ABS was broken. After the completion of the experiment, the length deformation of the ABS and the maximum loading pressure were read by the texture analyzer. The thickness of the cracked ABS was measured by using the electronic vernier caliper, and the deformation was calculated [13,18,19]. The formulas for calculating Poisson’s ratio, elastic modulus, cross-sectional area, and shear modulus of ABS are as follows:
where, ν is Poisson’s ratio of ABS, εx is the transverse strain of ABS, εy is the longitudinal strain of ABS, ∆T is the deformation in the thickness direction of ABS (mm), ∆L is the deformation in the length direction of ABS (mm), E is the elastic modulus of ABS (MPa), σ is the maximum compressive stress of texture analyzer (MPa), F is the maximum compressive forces from texture analyzer (N), S is the cross-sectional area of ABS before the test (mm2), π is the circumference ratio, G is shear modulus of ABS (MPa).
The measurement results showed that Poisson’s ratio and shear modulus of ABS was 0.25 ± 0.104 and 14.53 ± 1.730 MPa, respectively.
2.2.2. Coefficient of Restitution
The ABS–ABS coefficient of restitution was measured by a double pendulum device [20]. The measurement principle is shown in Figure 2.
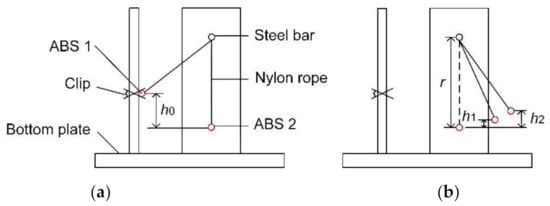
Figure 2.
Schematic of double pendulum test of ABS–ABS collision. (a) before collision; (b) after collision.
As shown in Figure 2, ABS 1 and ABS 2 were both drilled and connected by nylon rope. The upper end of the nylon rope was fixed on a steel rod. During the test, the ABS 1 was clamped by the clamp, and the ABS 2 was naturally suspended at the lowest point. The relative height h0 of ABS 1 and ABS 2 was 220 mm, referring to the distance between the seeding port of the spoon-type seed metering device and the bottom of the shell [21]. ABS 1 was released at an initial speed of 0 and collided with ABS 2 when it moved to the lowest point. Both ABS 1 and 2 swung around a steel rod with a radius of 450 mm (r). The vertical distances of ABS 1 and 2 between the lowest and highest points were h1 and h2, respectively (Figure 2). The test process was recorded by an I-SPEED TR high-speed camera (Olympus Co., Ltd., Tokyo, Japan). During the measurement, 20 groups (40 ABS) were randomly selected for collision analysis. After the test was completed, both h1 and h2 were read in the post-processing software I-SPEED Viewer.
According to definition of coefficient of restitution, ABS–ABS coefficient of restitution is calculated as follows:
where, e1 is the coefficient of restitution of ABS–ABS, ν1′ is the instantaneous speed of ABS 1 before the collision (m s−1), ν1″ is the instantaneous speed of ABS 1 after the collision (m s−1), ν2 is the instantaneous speed of ABS 2 after the collision (m s−1), g is the acceleration of gravity (m s−2).
By calculation, the coefficient of restitution of ABS–ABS was 0.22 ± 0.115.
The collision bounce test was used to measure the coefficient of restitution between ABS and PRP [19] (Figure 3).
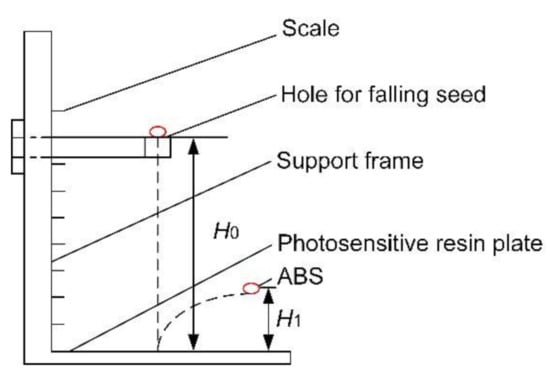
Figure 3.
Schematic of ABS–PRP collision.
The vertical distance H0 from the hole to the PRP was 220 mm. During the measurement, 20 ABS were randomly selected, and each ABS bounced up after the hole fell freely and collided with the PRP. The process of the test was recorded by a high-speed camera. After the completion of the experiment, the maximum bounce height H1 (mm) of 20 ABS after collision was read in the post-processing software I-SPEED Viewer.
The coefficient of restitution of ABS–PRP can be expressed as the ratio of normal velocity between ABS and PRP after collision and before collision [22]. The calculation formula is as follows:
where, e2 is the coefficient of restitution of ABS–PRP; v1 is the velocity of ABS after the collision (m s−1); v0 is the velocity of ABS before the collision (m s−1).
By calculation, the coefficient of restitution of ABS–PRP was 0.50 ± 0.099.
2.2.3. Coefficient of Static Friction and Coefficient of Rolling Friction
The shape of ABS is similar to ellipsoid, and it is difficult to determine the coefficient of static friction of a single ABS as it is easy to roll on the slope. Seven ABS were randomly selected to make a small seed group. The ABS was bonded to the surface of cardboard (150 × 200 mm) to form a large seed group. The coefficient of static friction was measured by the slope method [15]. The measuring materials and devices are shown in Figure 4.
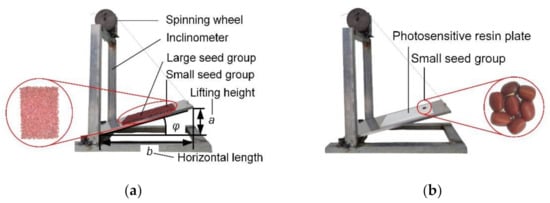
Figure 4.
Measurement of coefficient of static friction. (a) coefficient of static friction of ABS–ABS; (b) coefficient of static friction of ABS–PRP.
When measuring the coefficient of static friction between seeds, the inclined plane was placed horizontally, the large seed group was fixed on the inclined plane, and the small seed group was placed on the surface of the large seed group. The spinning wheel was slowly rotated, and when the small seed group had a downward trend, the inclined plane lifting height a (mm) and the horizontal length b (mm) were recorded. Five groups of small seed group were prepared and measured, respectively. When measuring the coefficient of static friction of ABS–PRP, the large seed group was replaced by the PRP, and other operations were carried out according to the measurement method of interspecific coefficient of static friction.
The calculation formula of coefficient of static friction is as follows [19]:
where, f is the coefficient of static friction; φ is the angle between the inclined plane and the horizontal plane (°).
By calculation, the coefficient of static friction of ABS–ABS was 0.41 ± 0.179, and the coefficient of static friction of ABS–PRP was 0.39 ± 0.165.
The measurement of coefficient of rolling friction was similar to that of coefficient of static friction. When measuring the coefficient of rolling friction of ABS–ABS, the inclined plane was placed horizontally, the large seed group was fixed on the inclined plane, and an ABS was placed on the surface of the large seed group (Figure 5). The spinning wheel was slowly rotated, and when the seed had a rolling trend, the inclined plane lifting height a and the horizontal length b were recorded. A total of 10 ABS were randomly selected for measurement. When measuring the coefficient of rolling friction of ABS–PRP, the large seed group could be replaced by PRP.
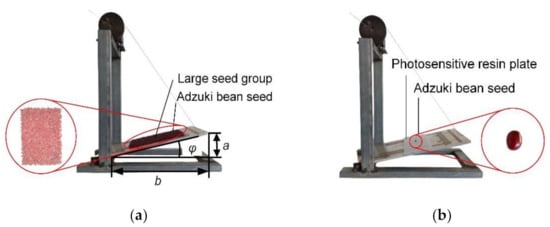
Figure 5.
Measurement of coefficient of rolling friction. (a) coefficient of rolling friction of ABS–ABS; (b) coefficient of rolling friction of ABS–PRP.
By calculation, the coefficient of rolling friction of ABS–ABS was 0.05 ± 0.030, and the coefficient of rolling friction of ABS–PRP was 0.05 ± 0.028.
2.2.4. Angle of Repose
The cylinder and plate were made by 3D printing of photosensitive resin material. According to the ABS size and accumulation pre-test of ABS, it was determined that the inner diameter and height of the cylinder were 39 and 300 mm, respectively, and the length and width of the plate were 300 mm. When measuring, the cylinder was placed on a horizontally fixed plate. A total of 2000 ABS were poured into the cylinder inlet and let fall freely. When ABSs in the cylinder were completely stationary, the cylinder was lifted vertically at a speed of 0.005 m s−1 through a universal testing machine fixture, thus forming a nearly conical seed pile on the flat plate, as shown in Figure 6a. The camera was used to take the front and side views of the seed pile. Four AOR in two directions were measured each time (Figure 6b,c). A total of five experiments were carried out. The average values were reported.
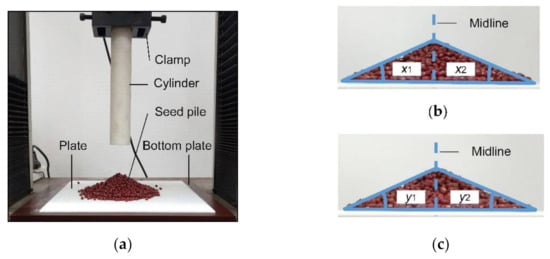
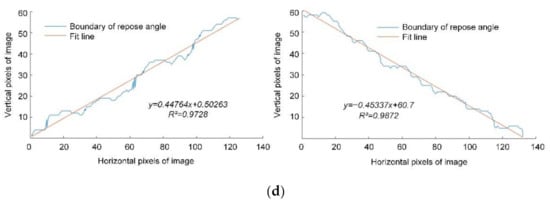
Figure 6.
Measurement of AOR. (a) AOR measuring device; (b) front view; (c) side view; (d) AOR boundary fitting.
Based on image processing method [23,24], the collected AOR images were grayed out, binarized, hole filled, boundary extracted, linearly fitted, and inverse tangent solved by MATLAB. The AOR of ABS was obtained as 23.93 ± 0.950°. The boundary fitting of AOR of ABS is shown in Figure 6d.
2.3. Modeling in EDEM Software
2.3.1. Simulation Parameters Setting
According to the measured triaxial size distribution of ABS, the size of ABS was generated with normal distribution in the simulation. In order to ensure that the ABS size distribution generated in the simulation did not exceed the measured range, the standard deviation took the minimum value of the normalized triaxial size standard deviation (average: 1; standard deviation: 0.05).
The intrinsic and contact parameters of the simulation test are shown in Table 1. The density, Poisson’s ratio, shear modulus of PRP, and the density of ABS were obtained from existing studies [25]. The remaining parameters were measured by physical experiments. In addition, each simulation time step was set to 20% Rayleigh time step, and the mesh size was 3 times the minimum spherical element radius [8].

Table 1.
Simulation parameters.
2.3.2. AOR Measurement Model
Existing studies have shown that using a small number of spherical elements to build a non-spherical particle model can achieve a higher simulation accuracy [26,27]. In this study, the discrete element model of ABS was constructed using the combination of 10 spheres, as shown in Figure 7a. According to the measured triaxial size distribution of adzuki bean seeds, the seed size of adzuki bean was generated with normal distribution in the simulation. In order to ensure that the adzuki bean seed size distribution generated in the simulation did not exceed the measured range, the standard deviation took the minimum value of the normalized triaxial size standard deviation (average: 1; standard deviation: 0.05).
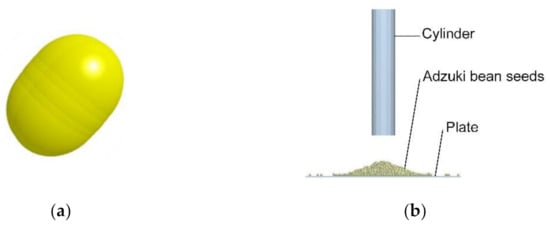
Figure 7.
AOR simulation test. (a) ABS model; (b) AOR measurement model.
The SOLIDWORKS2017 software was used to establish a 3D model of the AOR measuring equipment for the test at a ratio of 1:1, and the 3D model was saved as STEP format and imported into the EDEM2020 software. There was no adhesion between the seeds and between the ABS and the contact material, and the influence of factors such as electricity and heat were not involved. Therefore, the Hertz–Mindlin (no slip) contact model was selected for the simulation [28,29]. A Polygon plane was established at the center of the cylindrical feed port plane to generate ABS. The type of pellet factory was dynamic, the total number of pellets was 2000, and the generation rate was 1000 s−1. After 2 s, the ABS was generated, and the simulation model was run for 2 s to make the system reach equilibrium. The cylinder was lifted vertically at the speed of 0.005 m s−1, particles flowed slowly from the bottom of the cylinder, eventually formed a stable AOR on the PRP, as shown in Figure 7b. The simulation AOR was also calculated using the MATLAB boundary fitting method.
2.4. Simulation Parameters Calibration
In this paper, the simulation parameters were calibrated using the AOR test. In order to screen out the parameters that have a significant effect on the AOR, the Plackett–Burman test was carried out using the Design–Expert software. The minimum and maximum values of experiment parameters were coded as level −1 and +1, respectively. With the simulated AOR of ABS as the response value, the Poisson’s ratio and shear modulus of ABS, the coefficient of restitution, coefficient of static friction, and coefficient of rolling friction between ABS–ABS, and ABS–PRP were calibrated.
In order to reduce the value range of the significant parameters, on the basis of the Plackett–Burman test, the relative error between the simulated AOR and the measured AOR was used as the evaluation index, and the Steepest Ascent test was carried out on the selected significant parameters.
Based on the design principle of Box–Behnken and the results from Plackett–Burman and Steepest Ascent test, three levels of significant parameters were determined: high (+1), medium (0), and low (−1). The second-order regression model between AOR-significance parameters and AOR error-significance parameters were established by Design–Expert software to solve the optimal combination of significance parameters.
3. Results and Discussion
3.1. Plackett–Burman Test
The test parameters and results of Plackett–Burman are shown in Table 2 and Table 3. The ANOVA of the test results was carried out using Design–Expert software. Table 4 showed that the effects of the friction factors on the AOR were all positive, i.e., the AOR increased with the friction factors. Only the coefficient of static frictions of ABS–ABS and ABS–PRP and the coefficient of rolling friction of ABS–ABS had a significant influence on simulated AOR. The reason was that ABS was similar to ellipsoids, and the movement between seeds was mainly sliding and rolling during the accumulation process, and the movement between ABS–PRP was mainly sliding. In addition, in the AOR test, the deformation of ABS and PRP was extremely small, there was no obvious elastic collision between ABS–ABS and ABS–PRP, and the bottom layer of ABS rolled less on the PRP. The above facts resulted in an insignificant effect of the parameters on the AOR, including Poisson’s ratio and shear modulus of ABS and PRP, coefficient of restitution of ABS–ABS and ABS–PRP, and coefficient of rolling friction of ABS–PRP. It can be speculated that the AOR size is not only related to the material properties of the particles but also related to the complex motion state of the particles during the accumulation process.
Table 2.
Plackett–Burman test parameters.
Table 3.
Design scheme and results of Plackett–Burman test.
Table 4.
Significant analysis of Plackett–Burman test parameters.
3.2. Steepest Ascent Test
The design scheme and results of the Steepest Ascent test are shown in Table 5. All non-significant test parameters adopted the measured average value, and other test parameters were selected according to Table 1. As can be seen from Table 5, with the increase in X5, X6, and X7, the simulated AOR increased continuously, and the relative error of the AOR decreased first and then increased. The lowest relative error (1.59%) was associated with the third simulation, indicating more feasible ranges were 0.2–0.4 for X5, 0.2–0.4 for X6, and 0.02–0.06 for X7, respectively. The determined ranges were then used in the following Box–Behnken test.
Table 5.
Design scheme and results of Steepest Ascent test.
3.3. Box–Behnken Test
In the Box–Behnken test (Table 6), all non-significant test parameters adopted the measured average value, and other test parameters were selected according to Table 1. The Box–Behnken test was fitted by multiple linear regression by Design–Expert, and the second-order regression equation of simulation AOR (θ3) was obtained:
Table 6.
Design scheme and results of Box–Behnken test.
The second-order regression equation of error (δ3) of simulated and measured AORs are as follows:
The ANOVA (Table 7) showed that X5, X6, X7, X52, and X62 had an extremely significant influence on the AOR, X5X7 had a significant influence on the AOR, and X5X6, X6X7, X72 had no significant influence on the AOR. The p values of the regression model (<0.0001) and that (0.9502 > 0.05) of the lack of fit indicated that the model fitted well and there was no lack of fit occurred. The coefficient of determination was R2 = 0.99, and the adjusted coefficient of determination was R2adj = 0.98, indicating that the regression model could match the results well. Moreover, the Adequate Precision was 34, which further showed the regression model had good precision and could be used to navigate the design space.
Table 7.
ANOVA of Box–Behnken test.
The results of the ANOVA of AOR error were almost the same as these of AOR. The regression model of the AOR error was well fitted, and no lack of fit occurred, which could be used for the AOR error prediction analysis.
It can be seen from Table 7 that the interaction term X5X7 has a significant effect on the AOR and AOR errors. Figure 8a shows the influence of interaction factors between the coefficient of static friction of ABS–ABS X5 and the coefficient of rolling friction of ABS–ABS X7 on the AOR (θ3). With the increase in X5 or X7, AOR showed an upward trend. When either of X5 and X7 takes a smaller value, θ3 increases more slowly with the increase in another factor, and when either of X5 and X7 takes a larger value, θ3 increases faster with the increase in another factor. As can be seen from Figure 8b, the interaction between X5 and X7 has similar effects on the AOR error δ3 and the AOR θ3.
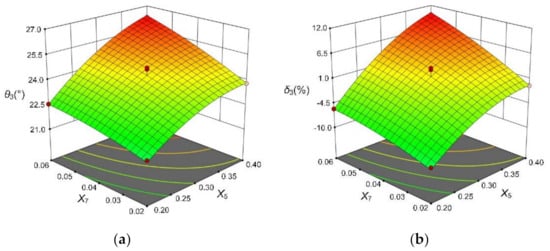
Figure 8.
The influence of significant interaction term on the AOR and AOR error. (a) the influence of X5X7 on the AOR; (b) the influence of X5X7 on the AOR error.
Based on the Box–Behnken test, through the Design–Expert constraint solving tool, an AOR value of 23.93° and an AOR error value of 0 were taken as the objectives. The results showed that the optimal simulation combination of significant parameters was a coefficient of static friction of ABS–ABS of 0.302, coefficient of static friction of ABS–PRP of 0.282, and coefficient of rolling friction of ABS–ABS of 0.043.
For different granular materials, the influence of physical parameters on the AOR was not completely consistent. We found that the coefficient of static friction of ABS–ABS and ABS-contacting materials and the coefficient of rolling friction of ABS–ABS had a significant effect on the AOR, which was consistent with the research results by Liu et al. [8]. It was possible that the shape, size, and modeling methods of the granular materials are similar. However, Ma et al. [12] and Hou et al. [19] reported that the coefficient of restitution of particles was the significant factor affecting the AOR. In addition, Shi et al. [30] believed that the Poisson’s ratio of jujube had a significant effect on the AOR. This may be due to the different shape, size, and moisture content of the granular materials.
3.4. Verification Test
In order to verify the accuracy of ABS DEM parameters, the determined parameters were used as the EDEM simulation parameters, and five tests were performed. The simulated AOR values of the ABS were 23.87°, 23.98°, 24.36°, 23.19°, 23.45°, respectively (Figure 9). The two-sample T-test was performed on the simulated and measured AOR values and p of 0.479 (>0.05), indicating that the simulated and measured AOR values after calibration was not significantly different. The relative error of simulated and measured AOR values under the optimal parameter combination was 0.67%, indicating the DEM parameters after calibration had good accuracy.
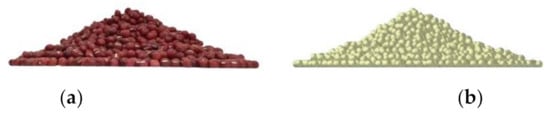
Figure 9.
Comparative test of AOR of ABS. (a) physical test; (b) simulation test.
4. Conclusions
The purpose of this paper was to determine the DEM parameters required for the mechanized seeding process of ABS and to provide technical support for the development of an adzuki bean seed metering device. The interval values of the intrinsic parameters and contact parameters of ABS, and the specific values of the AOR were measured through tests. Through the Plackett–Burman and Steepest Ascent test, the optimal value range of significant influencing parameters of AOR was determined: coefficient of static friction of ABS–ABS of 0.2–0.4, coefficient of static friction of ABS–PRP of 0.2–0.4, coefficient of rolling friction of ABS–ABS of 0.02–0.06. Box–Behnken test showed that optimal values of significant parameters were 0.302, 0.282, and 0.043, respectively, for the coefficient of static friction of ABS–ABS, coefficient of static friction of ABS–PRP, and coefficient of rolling friction of ABS–ABS, respectively. The validation test illustrated that the relative error between simulated and measured values of AOR was 0.67%, indicating that the determined DEM parameters were accurate and reliable. This paper fills the research gap of DEM parameters in the mechanized seeding process of ABS and provides strong data support for the development of an adzuki bean seed metering device.
Author Contributions
Conceptualization, Y.L.; data curation, Y.L.; formal analysis, Y.L.; funding acquisition, Y.H.; investigation, G.M.; methodology, Y.L.; project administration, Y.H.; resources, S.Z.; software, P.L.; supervision, Y.H.; validation, Y.L.; visualization, Y.L.; writing—original draft, Y.L.; writing—review and editing, Y.L. All authors have read and agreed to the published version of the manuscript.
Funding
This research was funded by the National Natural Science Foundation of China (No. 31971802), and the Key Research and Development Program of Shaanxi Province, China (No. 2019ZDLNY02-03).
Institutional Review Board Statement
Not applicable.
Informed Consent Statement
Not applicable.
Data Availability Statement
Not applicable.
Conflicts of Interest
The authors declare no conflict of interest.
References
- Yin, Z.C. Establishment and Application of Mathematical Models for Nitrogen, Phosphorus and Potassium Fertilization on Mung Bean and Adzuki Bean. Ph.D. Thesis, Jilin University, Changchun, China, 2020. [Google Scholar]
- Guo, H.P.; Cao, Y.Z.; Song, W.Y.; Zhang, J.; Wang, C.L.; Wang, C.S.; Yang, F.Z.; Zhu, L. Design and simulation of a garlic seed metering mechanism. Agriculture 2021, 11, 1239. [Google Scholar] [CrossRef]
- Yu, Q.X.; Liu, Y.; Chen, X.B.; Sun, K.; Lai, Q.H. Calibration and experiment of simulation parameters for panax notoginseng seeds based on DEM. Trans. CSAM 2020, 51, 123–132. [Google Scholar]
- Zhang, T.; Liu, F.; Zhao, M.Q.; Liu, Y.Q.; Li, F.L.; Ma, Q.; Zhang, Y.; Zhou, P. Measurement of physical parameters of contact between soybean seed and seed metering device and discrete element simulation calibration. J. China Agric. Univ. 2017, 22, 86–92. [Google Scholar]
- Wang, J.W.; Tang, H.; Wang, J.F.; Li, X.; Huang, H.N. Optimization design and experiment on ripple surface type pickup finger of precision maize seed metering device. Intl. J. Agric. Biol. Eng. 2017, 10, 61–71. [Google Scholar]
- Wang, Y.B.; Li, H.W.; Wang, Q.J.; He, J.; Lu, C.Y.; Liu, K.H. Design and experiment of wheat mechanical shooting seed-metering device. Trans. CSAM 2020, 51, 73–78. [Google Scholar]
- Zhao, J.; Zheng, C.; Zhang, J.G.; Han, D.L.; Nian, Y.K.; Sun, N. Parameter optimization and experiment of differential filling groove single grain seed-metering device for wheat. Trans. CSAM 2020, 51, 65–74. [Google Scholar]
- Liu, F.Y.; Zhang, J.; Li, B.; Chen, J. Calibration of parameters of wheat required in discrete element method simulation based on repose angle of particle heap. Trans. CSAE 2016, 32, 247–253. [Google Scholar]
- Coetzee, C.J. Review: Calibration of the discrete element method. Powder Technol. 2017, 310, 104–142. [Google Scholar] [CrossRef]
- Wang, Y.X.; Liang, Z.J.; Zhang, D.X.; Cui, T.; Shi, S.; Li, K.H.; Yang, L. Calibration method of contact characteristic parameters for corn seeds based on EDEM. Trans. CSAE 2016, 32, 36–42. [Google Scholar]
- Ghodki, B.M.; Patel, M.; Namdeo, R.; Carpenter, G. Calibration of discrete element model parameters: Soybeans. Comput. Part. Mech. 2019, 6, 3–10. [Google Scholar] [CrossRef]
- Ma, W.P.; You, Y.; Wang, D.C.; Yin, S.J.; Huan, X.L. Parameter calibration of alfalfa seed discrete element model based on RSM and NSGA—II. Trans. CSAM 2020, 51, 136–144. [Google Scholar]
- Liao, Y.T.; Wang, Z.T.; Liao, Q.X.; Wan, X.Y.; Zhou, Y.; Liang, F. Calibration of discrete element model parameters of forage rape stalk at early pod stage. Trans. CSAM 2020, 51, 236–243. [Google Scholar]
- Cao, X.L.; Li, Z.H.; Li, H.W.; Wang, X.C.; Ma, X. Measurement and calibration of the parameters for discrete element method modeling of rapeseed. Processes 2021, 9, 605. [Google Scholar] [CrossRef]
- Wu, M.C.; Cong, J.L.; Yan, Q.; Zhu, T.; Peng, X.Y.; Wang, Y.S. Calibration and experiments for discrete element simulation parameters of peanut seed particles. Trans. CSAE 2020, 36, 30–38. [Google Scholar]
- Shen, H.; Zhang, J.J.; Chen, X.H.; Dong, J.X.; Huang, Y.X.; Shi, J.T. Development of a guiding-groove precision metering device for high-speed planting of soybean. Trans. ASABE 2021, 59, 1113–1122. [Google Scholar] [CrossRef]
- Xue, P.; Xia, X.Y.; Gao, P.Y.; Ren, D.; Hao, Y.J.; Zheng, Z.Q.; Zhang, J.C.; Zhu, R.X.; Hu, B.; Huang, Y.X. Double-Setting Seed-Metering Device for Precision Planting of Soybean at High Speeds. Trans. ASABE 2019, 62, 187–196. [Google Scholar] [CrossRef]
- Shi, L.R.; Sun, W.; Zhao, W.Y.; Yang, X.P.; Feng, B. Parameter determination and validation of discrete element model of seed potato mechanical seeding. Trans. CSAE 2018, 34, 35–42. [Google Scholar]
- Hou, Z.F.; Dai, N.F.; Chen, Z.; Qiu, Y.; Zhang, X.W. Measurement and calibration of physical property parameters for Agropyron seeds in a discrete element simulation. Trans. CSAE 2020, 36, 46–54. [Google Scholar]
- González-Montellano, C.; Fuentes, J.M.; Ayuga-Téllez, E.; Ayuga, F. Determination of the mechanical properties of maize grains and olives required for use in DEM simulations. J. Food Eng. 2012, 111, 553–562. [Google Scholar] [CrossRef]
- Cao, C.M.; Qin, K.; Wang, A.M.; Sun, Y.; Zhou, M.; Li, W.Y. Design and experiment on rice hill seeder with air-blowing special hole and scoop-wheel. Trans. CSAM 2015, 46, 66–72. [Google Scholar]
- Liu, W.Z.; He, J.; Li, H.W.; Li, X.Q.; Zheng, K.; Wei, Z.C. Calibration of simulation parameters for potato minituber based on EDEM. Trans. CSAM 2018, 49, 125–135. [Google Scholar]
- Frączek, J.; Złobecki, A.; Zemanek, J. Assessment of angle of repose of granular plant material using computer image analysis. J. Food Eng. 2007, 83, 17–22. [Google Scholar] [CrossRef]
- Jia, F.G.; Han, Y.L.; Liu, Y.; Cao, Y.P.; Shi, Y.F.; Yao, L.N.; Wang, H. Simulation prediction method of repose angle for rice particle materials. Trans. CSAE 2014, 30, 254–260. [Google Scholar]
- Li, Y.H.; Wei, Y.N.; Yang, L.; Zhang, D.X.; Cui, T.; Zhang, K.L. Design and experiment of mung bean precision seed-metering device with disturbance for promoting seed filling. Trans. CSAM 2020, 51, 43–53. [Google Scholar]
- Markauskas, D.; Kačianauskas, R.; Džiugys, A.; Navakas, R. Investigation of adequacy of multi-sphere approximation of elliptical particles for DEM simulations. Granul. Matter 2010, 12, 107–123. [Google Scholar] [CrossRef]
- Pasha, M.; Hare, C.; Ghadiri, M.; Gunadi, A.; Piccione, P.M. Effect of particle shape on flow in discrete element method simulation of a rotary batch seed coater. Powder Technol. 2016, 296, 29–36. [Google Scholar] [CrossRef] [Green Version]
- Balevičius, R.; Sielamowicz, I.; Mróz, Z.; Kačianauskas, R. Investigation of wall stress and outflow rate in a flat-bottomed bin: A comparison of the DEM model results with the experimental measurements. Powder Technol. 2011, 214, 322–336. [Google Scholar] [CrossRef]
- González-Montellano, C.; Ramírez, Á.; Gallego, E.; Ayuga, F. Validation and experimental calibration of 3D discrete element models for the simulation of the discharge flow in silos. Chem. Eng. Sci. 2011, 66, 5116–5126. [Google Scholar] [CrossRef]
- Shi, G.K.; Li, J.B.; Ding, L.P.; Zhang, Z.Y.; Ding, H.Z.; Li, N.; Kan, Z. Calibration and tests for the discrete element simulation parameters of fallen jujube fruit. Agriculture 2022, 12, 38. [Google Scholar] [CrossRef]
Publisher’s Note: MDPI stays neutral with regard to jurisdictional claims in published maps and institutional affiliations. |
© 2022 by the authors. Licensee MDPI, Basel, Switzerland. This article is an open access article distributed under the terms and conditions of the Creative Commons Attribution (CC BY) license (https://creativecommons.org/licenses/by/4.0/).