Article

Measuring Food Loss and Waste Costs in the Italian Potato Chip Industry Using Material Flow Cost Accounting

1
Department of Economics, Management and Business Law, University of Bari Aldo Moro, 70124 Bari, Italy
2
Department of Agricultural, Environmental & Development Economics, Ohio State University, Columbus, OH 43210, USA
*
Author to whom correspondence should be addressed.
Agriculture 2022, 12(4), 523; https://doi.org/10.3390/agriculture12040523
Submission received: 2 February 2022 / Revised: 4 April 2022 / Accepted: 5 April 2022 / Published: 7 April 2022

Abstract

:
Material flow cost accounting (MFCA) represents an innovative tool to identify inefficiencies in the use of resources in agribusiness, measuring either mass flows or costs incurred along the entire supply chain. The purpose of the article is to estimate the meso-level ecological and economic impacts of food loss and waste in the Italian salty snack sector before and during the COVID-19 lockdown by applying MFCA. Furthermore, in the light of the European Commission Delegated Decision 2019/1597, it aims to assess whether MFCA is a suitable tool to support food waste management along the entire food supply, discussing implications for researchers, academics and managers, as well as for public authorities. The research explores potato chip production from the agricultural stage (either considering plant cultivation and harvest) to the final consumption stage. The functional unit is 1 ton of unpackaged chips produced. The Italian lockdown spurred an intense upsurge in snacking activities (i.e., the consumption of salty snacks), justifying the need to investigate an agri-food segment often overlooked from an economic, resources and waste management perspective. It emerges that the “chips system” generates production valued at EUR 461 million (78%) and costs associated with food loss and waste that exceed EUR 131 million (22%), revealing an economically important potential for savings through a reduction in undesirable negative material flows, or through the valorization of previously hidden material losses according to circular economy paradigms. This suggests that the company-level adoption of appropriate material and financial accounting systems could enhance both internal savings and collective benefits towards sustainable resources and waste management.

1. Introduction

The agribusiness sector, defined as the “…sum of all operations involved in manufacture and distribution of farm supplies, production operations on the farm, and the storage, processing, and distribution of farm commodities…” [1], is currently under increased pressure from industry dynamics, urbanization, climate change and food price variability [2], as well as disasters and crises (e.g., the COVID-19 pandemic) [3]. Food security is central to the United Nations Sustainable Development Goals [4], which try to address the world hunger problem, as well as to promote more responsible (and sustainable) consumption and production behaviors. These targets aim to reduce climate change and economic and social inequalities on a global scale [5], and to enhance prudent natural resource management [6].
The agri-food sector is responsible for over a quarter (13.7 gigatons of CO2 equivalent, 26%) of global greenhouse gas emissions [7], with food loss and waste (FLW) accounting for a large fraction of the damage. For example, more than 1.3 billion tons of still-edible food is thrown away along the entire supply chain, with related environmental burdens assessed at more than 3.3 gigatons of CO2 equivalent (i.e., 6% of global greenhouse gas emissions) [8]. Furthermore, FLW causes substantial social (i.e., reduction in resources available for human nutrition) and economic (i.e., financial losses at the business and household level) damages. It is estimated that FLW is valued at more than 1 trillion dollars [4] and is associated with substantial resource losses (more than 250 km3 of blue water and approximately 1.4 billion hectares of land [8,9]). This causes agricultural resource depletion and job losses while limiting food availability and accessibility [3].
The present research applies material flow cost accounting (MFCA) to estimate the impact of FLW within the Italian potato chip sector before and during the COVID-19 lockdown. The lockdown spurred an intense upsurge in snacking activities (i.e., the consumption of salty snacks), justifying the need to investigate this often-overlooked agri-food segment from an economic, resource and waste management perspective [10,11]. Through the adoption of the mass balance approach suggested by the European Commission (Delegated Decision 2019/1597 [12]) to estimate FLW, the authors assess whether MFCA is a suitable tool to support food waste management along the entire food supply chain. The article presents the results obtained from this application of MFCA, critically assesses the advantages and disadvantages of MFCA, and discusses implications for researchers, academics and managers, as well as for public authorities in the field of FLW accounting.

2. Literature Review on Food Loss and Waste Measurement Methodologies

The amount of FLW research has increased sharply in the last ten years as a consequence of the introduction of the SDGs in 2015 and the implementation of the European monitoring framework for the circular economy [5,13]. Furthermore, a plethora of FLW measurement studies were conducted after the introduction of the European Commission Delegated Decision 2019/1597 [12] related to the identification of common methodologies and minimum quality requirements for the homogeneous assessment of food waste quantities and composition. At the European level, five measurement methodologies have been proposed: (i) food diaries; (ii) direct measurement; (iii) questionnaires, surveys and interviews; (iv) mass balance approaches; and (v) waste composition analyses.
In recent years, a significant number of authors have applied food diaries to investigate households’ consumption and wastage behaviors, highlighting possible correlations between shopping behaviors, prevention strategies and food waste quantities [14,15]. Furthermore, several academics have appealed to direct measurement, focusing on nutritional loss [16] and environmental impacts due to waste in households and at food service outlets [17,18]. An increasing number of researchers have implemented questionnaires, surveys and interviews to investigate weaknesses and strengths in food waste management, from primary production to manufacturing [19,20], retail [21] and final consumption [22], whereas a few researchers have implemented mass balance approaches to investigate FLW issues along the entire food supply chain [23]. Nevertheless, the use of mass balance approaches in sustainability studies has been recently re-evaluated, with some authors [24] emphasizing their value for increasing sustainable resource conservation and cleaner production due to their ability to leverage substance flow analysis (SFA) to calculate and analyze resource and waste indicators [25] at local and global levels. Recent research has also discussed the efficacy of the mass balance approach to compare before and during the onset of COVID-19 [26], enhance environmental sustainability [27] and find resilient strategies in the post-pandemic era [28]. Last, some authors have highlighted its utility for collecting data towards the construction of the food waste index, which “…measure tons of wasted food per capita, considering a mixed stream of products from processing through to consumption…” [29].
Although several studies have explored the environmental impacts of FLW through the adoption of life cycle assessment [30,31], few authors have investigated their financial and social “weight” using MFCA. Exceptions include Christ and Burritt [32], who applied MFCA to identify potential improvements in financial viability and environmental performance for the restaurant industry, and May and Guenther [33], who used MFCA to support investment decisions in the berry pomace industry. In terms of environmental entrepreneurship, defined as “…the process of discovering, evaluating, and exploiting economic opportunities of market failures which detract from sustainability, including those that are environmentally relevant…” [34], some authors have applied MFCA to manufacturing systems such as snack producers [35], health service industries [36], wastewater treatment plants [37] or the textile industry [38]. Furthermore, MFCA has been included among the environmental management accounting tools, which are essential to monitor and evaluate environmentally related impacts on economic systems by assessing the “monetary environmental information” in past, present and future financial stocks and flows [39]. However, despite standardization at the international level, a broader awareness and appreciation of MFCA’s applicability to analysis at the local and global scale is still missing in academic, managerial and governmental circles. Therefore, applying MFCA to FLW can increase conceptual and practical knowledge among practitioners in the agri-food sector.

3. Materials and Methods

3.1. The Material Flow Cost Accounting Model

The MFCA model, standardized by the ISO14051, is a tool that traces and quantifies the stocks and flows of materials within a certain organization in physical units (e.g., mass, volume), as well as in terms of the associated costs [40,41]. Compared with conventional cost accounting, MFCA isolates energy, material and other overhead costs (e.g., CO2 transportation emissions) associated with resources (consumed and wasted), allowing a more appropriate evaluation of explicit and hidden cost flows. Considering the high transversality of the mass balance approach on which it relies (i.e., material flow analysis), defined as a “systematic assessment of the state and change of materials flows and stock in space and time” [42], MFCA could be applied to investigate single products (i.e., micro-level), industrial sectors (i.e., meso-level), or entire economic systems (i.e., macro-level), rendering it useful for manufacturing companies as well as primary and service industries [31]. It has been successfully applied to food [43] and non-food sectors [44], providing significant conceptual [45] and managerial [46,47] insights. The present research applies a systematic approach to investigate the Italian potato chip industry (NACE 10.31-Processing and preserving of potatoes) by following a pattern of investigation similar to Hendriks et al. [48]: (i) define materials and hidden flows (i.e., water, energy and transportation emissions) across the “chips system” (Figure 1); (ii) measure material flows (explicit and hidden) in terms of weight (i.e., material flow analysis); (iii) measure material costs (explicit and hidden ones) in terms of natural resources, logistics (i.e., transportation) and disposal costs (MFCA); and (iv) evaluate and interpret results.

3.2. Definitions, Boundaries and Functional Units

As proposed by FAO [49], the present research distinguishes between food loss and food waste, defining food loss as “…the decrease in the quantity or quality of food resulting from decisions and actions by food suppliers in the chain, excluding retailers, food service providers and consumers…” and food waste as “…the decrease in the quantity or quality of food resulting from decisions and actions by retailers, food service providers and consumers.” Moreover, following Hartikainen et al. [50], and in line with the aim of the research, the authors resort to the term “side streams”, which encompass foods still expected to be consumed by humans, contaminated foods, foods used as feed and foods left in field, composted or sent to waste treatment.
To cope with the challenges of developing a model able to represent a real system as accurately as possible without compromising comprehension [51], the present MFCA model analyzes potato chip production from the agricultural stage (both considering plant cultivation and harvest) to the final consumption stage, taking into consideration households’ consumption and food waste. Furthermore, considering the high volatility of packaging and retail costs (e.g., maintenance, fixed assets, clean-in-place system, taxes and human resources), these costs are excluded from the analysis [33]. Furthermore, it is assumed that all retail sales result in household consumption, since food consumption at food service outlets stopped during the lockdown [52]. The functional unit is defined as 1 ton (t) of unpackaged chips produced (i.e., final product), with packaging falling out of the boundaries of this study. To provide a comprehensive outlook on the Italian experience, results are projected to the entire retail sales volume of potato chips in Italy [53]. Assuming a closed economy scenario (i.e., all chip production consumed domestically), it is possible to assess the effectiveness of the methodology towards the achievement of international goals, as well adhering to European Commission Proposals (Delegated Decision 2019/1597 [12]), which require FLW measurement along the entire supply chain to be conducted at least every 4 years.

3.3. Material Flows, Cost Categories and General Assumptions

Figure 1 illustrates the “chips system”, providing a clear differentiation between input and output flows along the entire food supply chain, whereas Table 1 illustrates the data inventory.
In terms of inputs, the agricultural production stage includes measures of seeds, fertilizers and water, whereas for the transportation stage (either from land to the industrial plants and from the industrial plants to the retail stores) the required energy (diesel) was calculated assuming the latest transport technologies, 100 km as the needed transportation distance, and reliance on medium-sized trucks (7–9 t) [54]. At the manufacturing stage, additional ingredients such as a mix of vegetable oils and salt were considered. As far as outputs, the authors considered steam (i.e., water loss contained in the tubers at processing) and CO2 emissions during transportation. Food loss (i.e., non-harvested tubers, lost tubers, substandard tubers and skins and scraps) and food waste (i.e., wasted chips at households) were measured in tons of tubers. Food waste in terms of the mix of vegetable oils was considered, whereas salt losses were not recorded since salt is inconsequential in terms of weight. Data were collected from national and international reports [54,55,56], as well as from selected scientific articles [57,58,59]. The average tuber composition, as defined by Sablani and Mujumdar [60], was considered: water (75–78%), proteins (2%), carbohydrates (16–22%), lipids (0.1–0.15%), cellulose (0.4–0.6%), ash (0.3–2) and dietary fiber (2%).
Following Gustavsson et al. [61], household food waste was hypothesized to be 9%. Costs were classified into material costs (i.e., raw materials, operating materials and water), energy costs (i.e., fuel for transportation), waste management costs (i.e., disposal costs) and additional costs (i.e., CO2 emissions) as defined by the ISO [40]. Price data were collected as average prices from national reports and tariffs [55,56,62,63,64,65,66,67], and from international reports [68] and statistics [53,69,70]. Waste management costs (i.e., energetic recovery in waste incineration plants) were assessed according to May and Guenther [33]. The pricing of CO2 emissions from energy use was estimated at 60 EUR/t of CO2, which currently represents a mid-range benchmark of carbon costs in 2020, and a low-end benchmark for carbon costs in 2030 [68]. The price of chips as a final product was evaluated as an average of the best-selling varieties (i.e., classic chips) of the main Italian companies (i.e., San Carlo and Amica Chips), which represent more than 80% of the Italian chips market [71,72,73].
To explore the possible impacts of the COVID-19 lockdown on the MCFA outcomes, two scenarios were developed to mirror conditions pre- and post-lockdown. Using national statistics [73] and reports [74,75,76,77] to track price trends around the time of the lockdown, the first uses lower average prices (i.e., before the Italian lockdown, s.c. “Scenario 1”) and the second uses higher average prices (e.g., during the Italian lockdown, s.c. “Scenario 2”). This helps clarify the “economic weight” of FLW with reference to small price variations in the raw materials, energy and additional resources values. Table 2 illustrates the different material costs in both scenarios. With respect to consumption and waste behavior among final users, the authors assumed equal rates before and during the lockdown. In line with the measurement of other financial indicators at the European level [78], such a choice reflects the intended purpose of the MFCA of estimating FLW economic costs before and during the lockdown, without accounting for changes in household consumption and waste patterns.
Mass balance and cost assessment calculations were processed through STAN 2.6. (SubsTance flow ANalysis) [79]. It assumes that uncertain quantities are normally distributed on the basis of their mean and standard deviation values (standardized uncertainties). STAN 2.6. solves data contradictions by data reconciliation on the basis of two necessary conditions: the system of equations is over determined, with more independent equations than unknown variables, and some of the given data are normally distributed. Therefore, STAN 2.6. performs a statistical test to check if the necessary adjustments can be explained by random errors, applying a 95% confidence interval to the weight values. If reconciled values are detected to lie outside of the 95% confidence interval (mean value ± 2 × standard uncertainty) the model is likely to contain gross errors. Otherwise, the model is assessed to be reliable [80,81,82].

4. Results

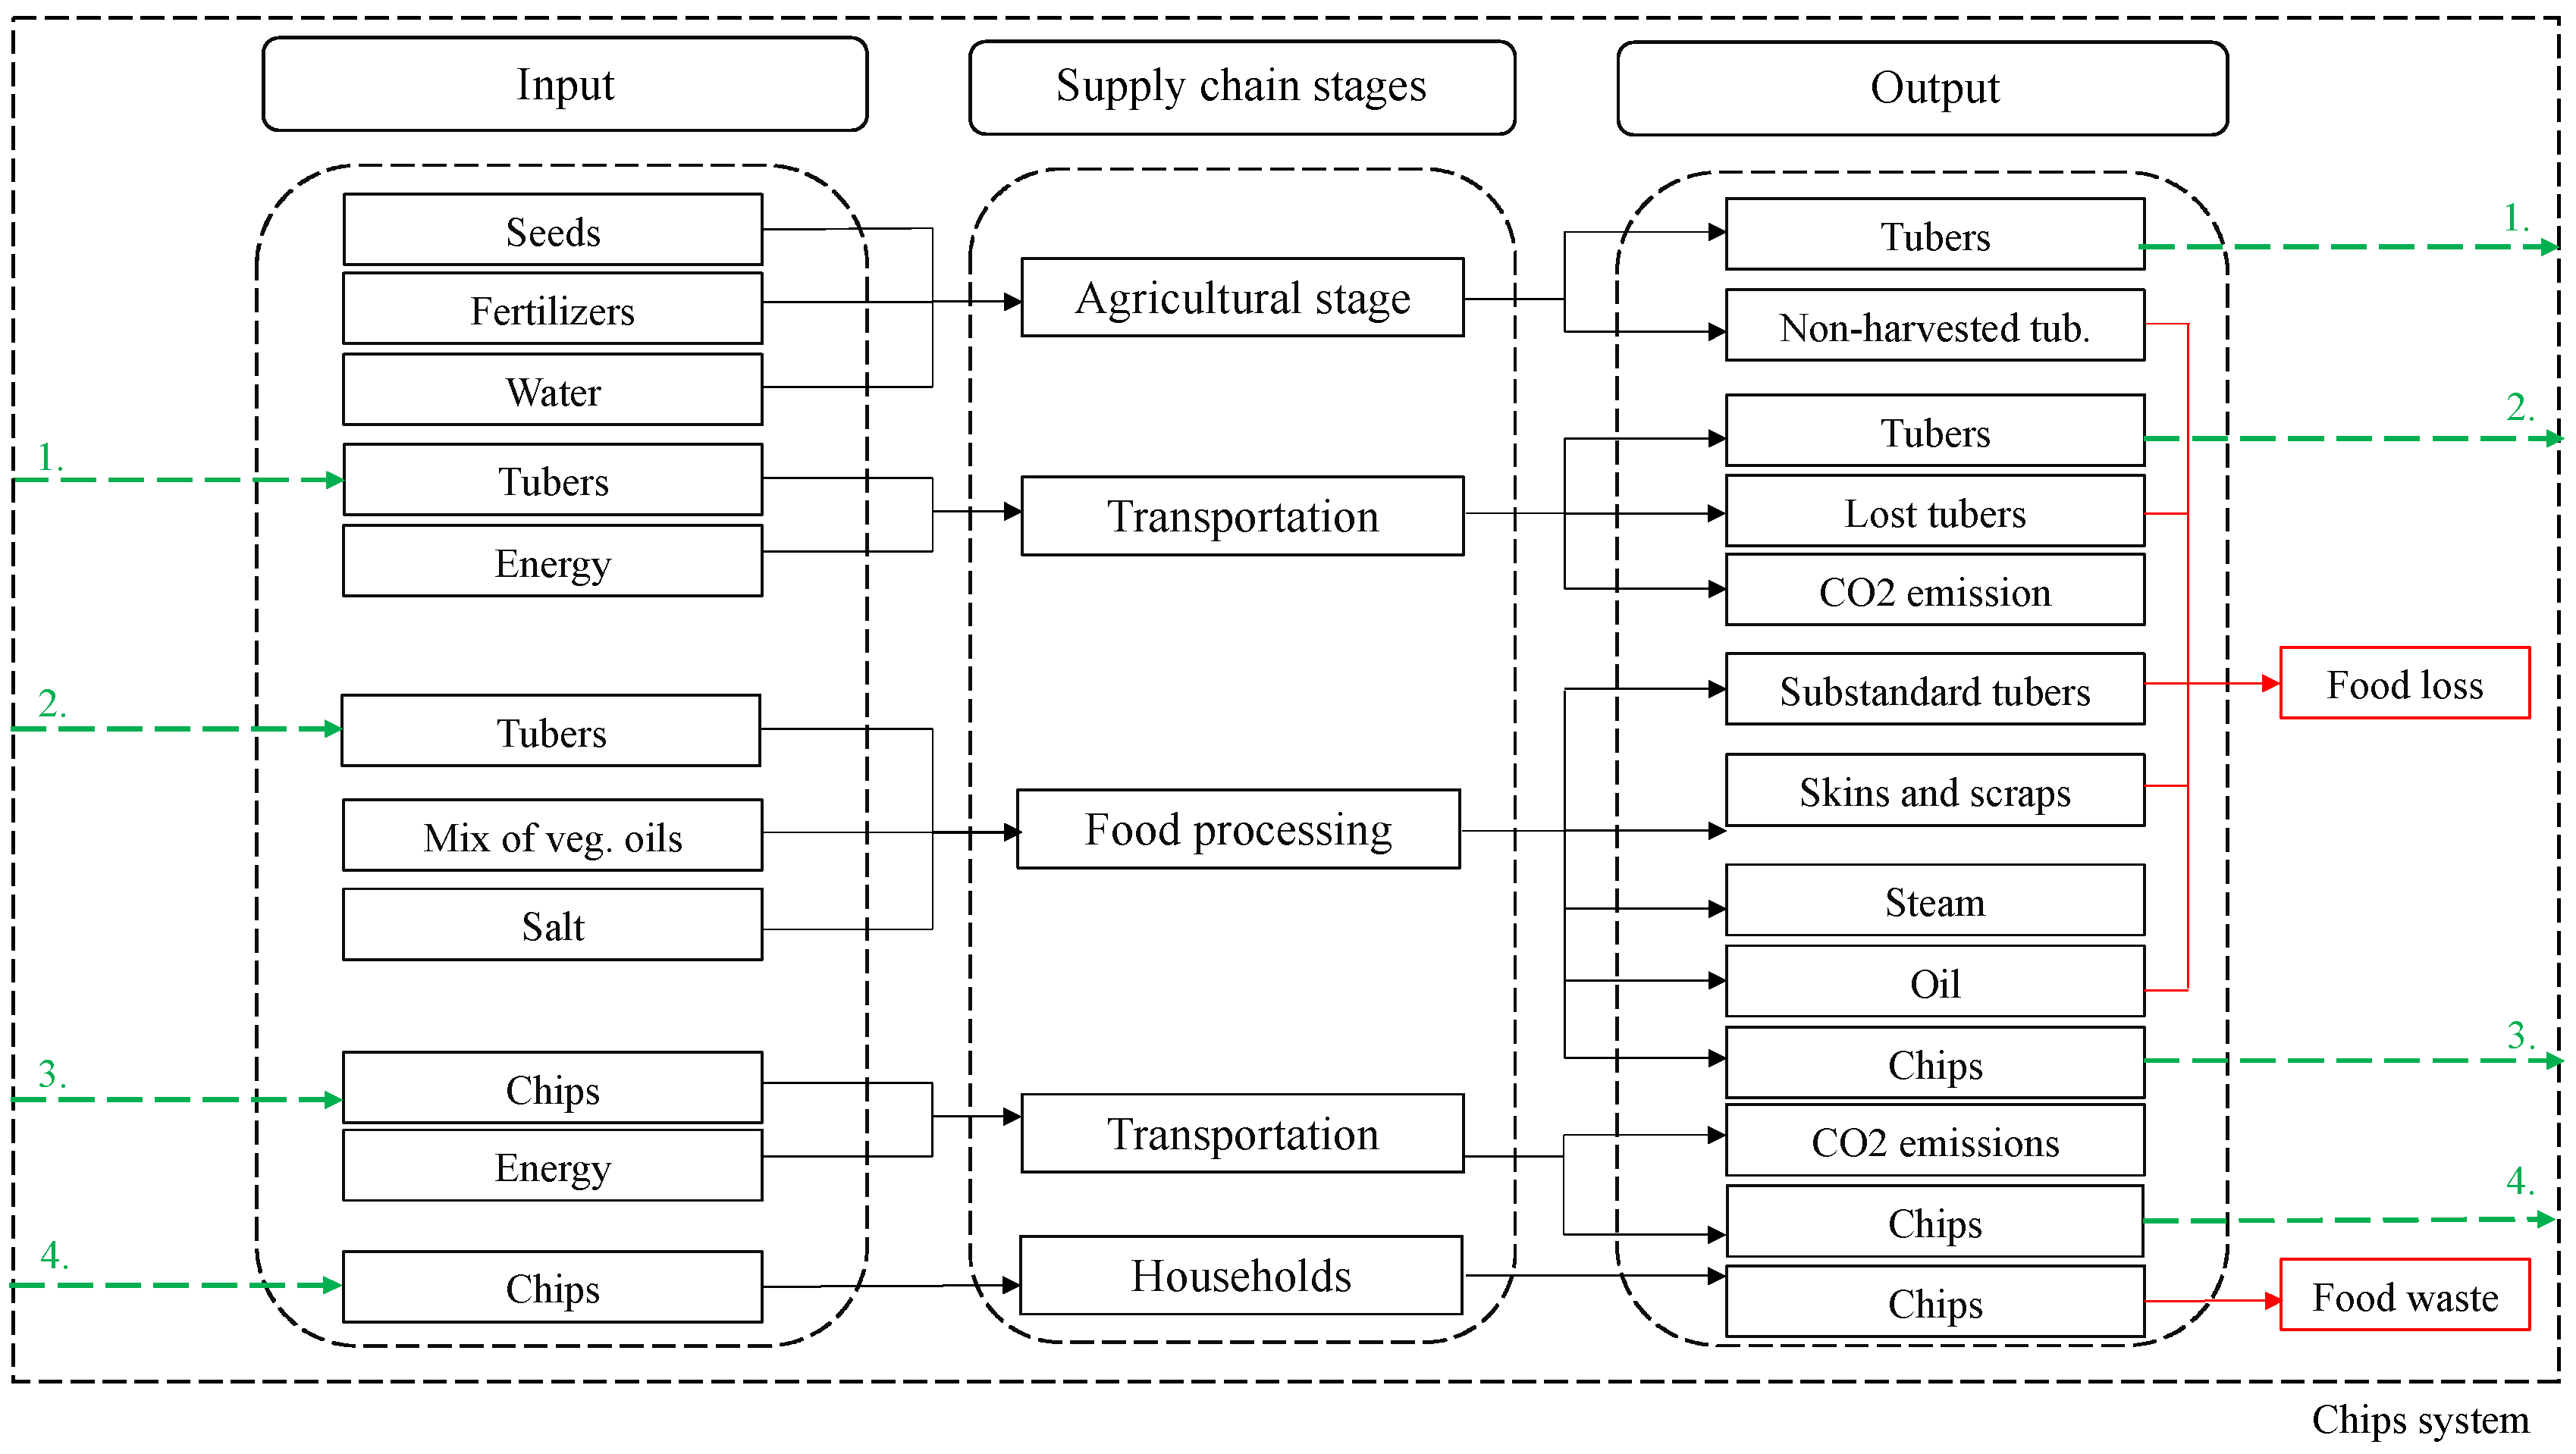
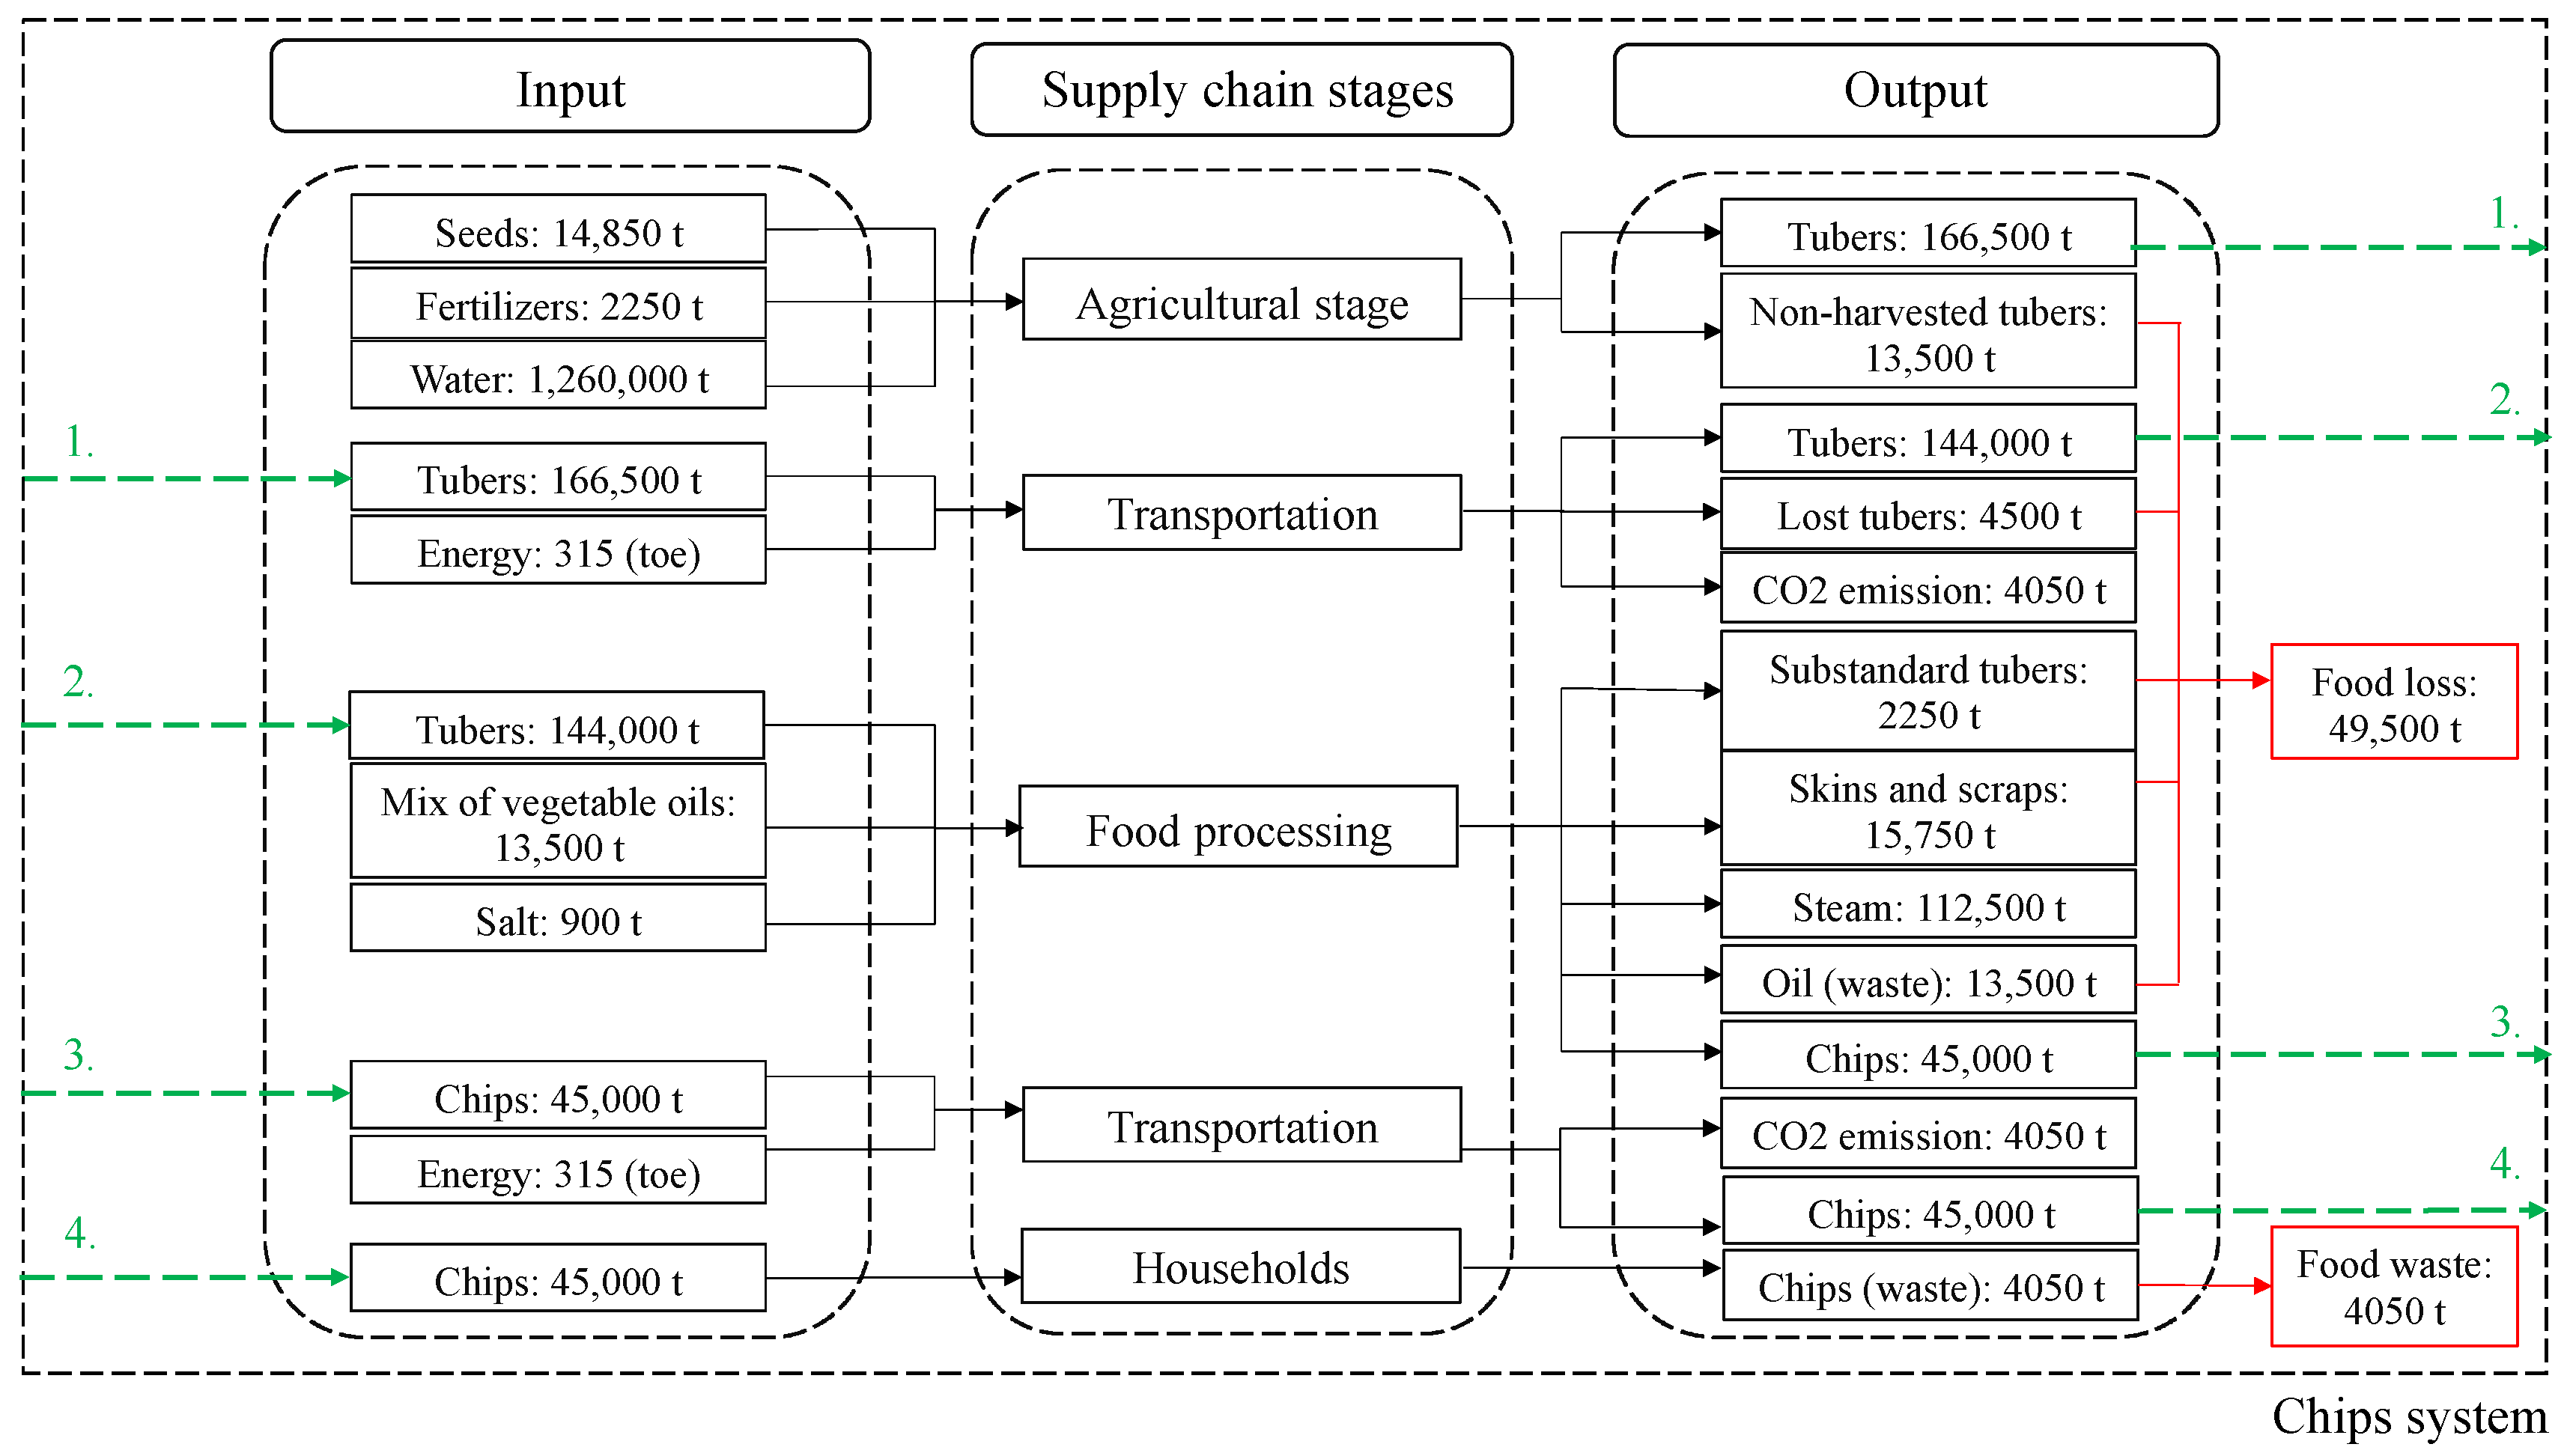
4.1. Material Flow Analysis for the Italian Potato Chip Industry

The first step to measuring the economic cost of FLW involves applying the mass balance approach, which systematically investigates the state of and change in material flows and stocks in terms of weight. Figure 2 illustrates the material flow analysis assessed for the entire Italian experience, considering the retail chips volume as the material basis for calculations.
In terms of weight, seeds (14,850 t), fertilizers (2250 t) and water (1,260,000 t) are required to produce an amount of approximately 180,000 t of tubers, of which approximately 7.5% are left in the field (i.e., “non-harvested tubers”), and are therefore deemed food loss. Furthermore, additional energy (315 t) is required during transportation, with an environmental impact of more than 4050 t of CO2 emissions. Along the distribution from the farm to the industrial plant, it is estimated that 4500 t (less than 2%) of tubers are lost, increasing the amount of food loss. At the food processing stage, the remaining tubers (144,500 t) are cut, washed, dried and cooked and then combined with a mix of vegetable oils (13,500 t) composed of peanut, sunflower and corn oils and salt (900 t). These materials are turned into chips by pre-frying, drying, depressing and frying. At this point, substandard tubers (2250 t that are removed because of deviations from the weight, size and quality standards required by the processors), as well as skins and scraps (15,750 t) and exhausted oil (13,500 t), contribute to the food loss tally, whereas an amount of steam (112,500 t) is generated due to the evaporation of the water lost during the processing of the tubers. Last, after an additional transportation stage, chips are distributed to households, leading to consumer intake (40,950 t) and waste (4050 t).

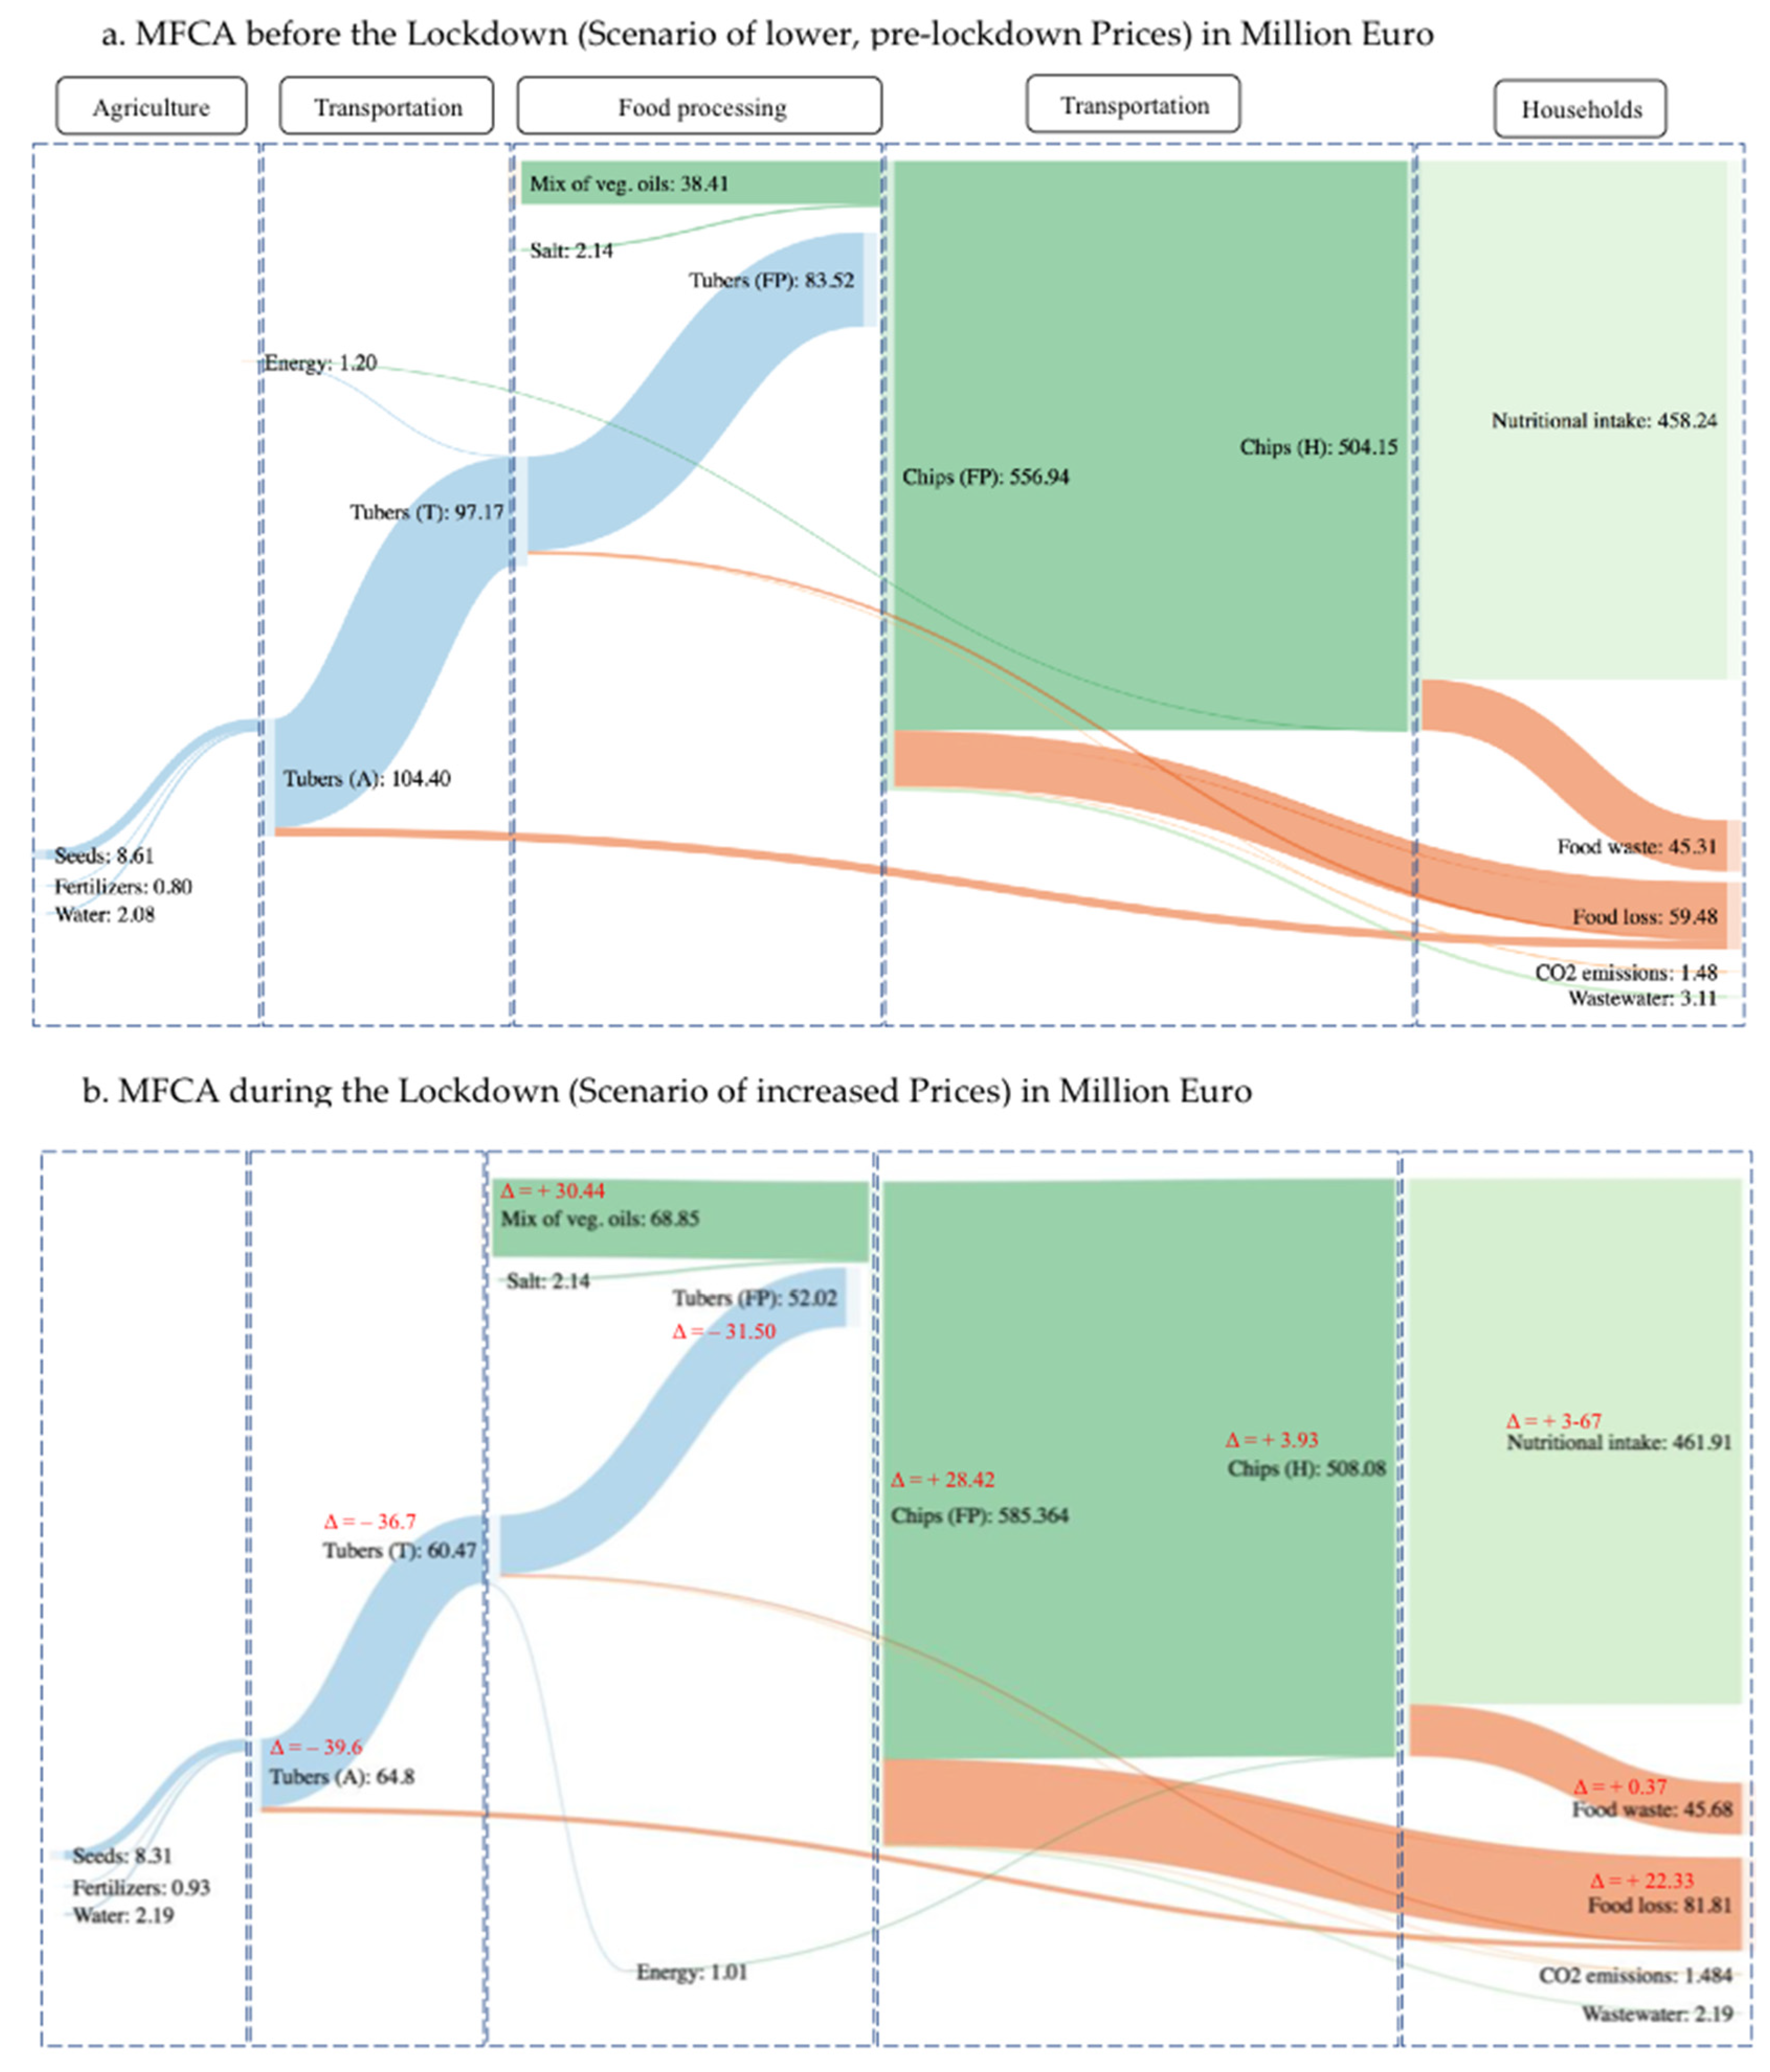
4.2. Material Flow Cost Accounting before and during the Lockdown

The first scenario (Figure 3a), featuring lower, pre-lockdown prices for most materials (see average variations before and during the pandemic as highlighted in Table 2), provides several insights about material costs. Indeed, raw materials (at the agricultural stage) valued at approximately EUR 11.50 million generate more than EUR 104.40 million of tubers, of which over EUR 97 million are transported towards to the food processing stage, whereas EUR 7.4 million are embedded (and lost) within non-harvested tubers (food loss). Further financial costs are embedded in goods disposed at the food processing stage, where more than EUR 52 billion (approximately 10% of the Italian revenue) are thrown away in terms of substandard tubers, skins and scraps, and the mix of vegetable oils. Last, an additional amount of lost revenue is recorded by households, yielding food-waste-related costs of more than EUR 45 million (roughly 9% of the Italian chips revenue).
In the second scenario (Figure 3b), which reflects increased average prices during the pandemic, the estimated total cost of raw materials is EUR 11.43 million, which generates tubers valued at EUR 64.8 million. However, at the harvesting and post-harvesting stages, more than EUR 4.30 million of non-harvested tubers are lost, representing approximately 7% of the farmers’ revenue at the agricultural stage. Furthermore, during the food processing stage, EUR 8.50 million is lost in terms of substandard tubers and skins and scraps, whereas more than EUR 68.85 million is lost through exhausted oils. The projected revenue of chips at distribution amounts to more than EUR 585.36 million. However, considering household food waste, more than EUR 45.60 million is disposed of as uneaten final products by consumers (equivalent to 7.80% of companies’ revenue). In total, roughly EUR 82 million is lost during the agricultural, transportation and food processing stages, whereas approximately EUR 46 million is disposed at the household level, for an amount of more than EUR 128 million or about 28% of the EUR 462 million of chips that actually contribute to “nutritional intake” [23].
Although both scenarios may seem similar in absolute values, a small variation in the cost of raw materials (i.e., tubers and a mix of vegetable oils) and final products (i.e., chips) generates a large variation in the final cost of FLW. A huge reduction in the tubers’ price (−38%) is more than compensated for by a sharp increase in the price of the mix of vegetable oils (+78), as well as by a small increase in chips’ price (+0.8%). When summed across the supply chain, the results from Figure 3a,b suggest an increase in FLW costs from EUR 104.80 million pre-pandemic to EUR 128 million (+22%) post-pandemic.
Table 3 lists the ratio of costs associated with food loss and food waste to the costs of inputs (i.e., seeds, fertilizers, water, mix of vegetable oils, salt and energy for transportation), intermediate inputs (e.g., tubers at the agricultural stage), and finished products either at distribution or by households (in terms of nutritional intake). Ratios were calculated to show how two economic values relate to each other (i.e., how many times one value can contain another value) and to allow researchers and businesses to compare data over time. For example, the ratio of 111.72% in Table 3 is calculated as the ratio of EUR 59.48 M of food loss (Figure 3, far right) to the sum of costs for seeds, fertilizer, water, energy, salt and oils (Figure 3, left and center columns, equaling EUR 53.24 M). The food loss to tubers ratio, estimated in the second scenario, represents the highest value (126%), meaning that the financial loss occurring within households compared with the agricultural stage value represents one of the main economic concerns. Moreover, the food loss to input ratio, estimated in the first scenario, represents the second highest value (111.72%). The third most critical loss was estimated in the second scenario, the food loss to input ratio being nearly 100% (i.e., food loss costs are equal to raw material costs). Of course, ratios essentially depend on input prices, therefore the value of FLW itself varies as the market fluctuates. However, as a common consideration to both scenarios, larger figures signal a higher priority for private or social action: the more the value of the ratio approaches 0, the more virtuous the system, since it means that FLW costs are considerably lower than raw material costs.
Although some changes in food consumption and food waste habits have occurred during the COVID-19 lockdown, as suggested by several national and international authors [83,84], such variations have not been accounted for in the present analysis. The research focus has been on changes in the price of raw materials before and during the lockdown, holding constant the consumption and waste behavior among final consumers.

5. Discussion

5.1. Managerial Implications

MFCA allows the identification of the most critical phases in the production–distribution–consumption chain, focusing on either the social or the environmental burdens, but also on the economic ones, letting businesses operating in a given sector improve their economic and social performances towards the enhancement of environmental entrepreneurship [34]. The material and the economic reporting proceed on two parallel tracks. Although they start from the same material basis, the MFCA functioning differs for some key assumptions from the material flow analysis [41,45]. First of all, it does not expect a balance between entry (input) and exit (output) costs, with the difference attributable to the companies’ revenue. Furthermore, unlike the weight-based mass balance approach, MFCA seems to be more attractive and interesting to individual businesses, since their interest is in profit, cost and income values rather than social or environmental waste-related “hidden” costs. Therefore, as a preliminary consideration, MFCA represents a transversal tool which allows the user to define (and graphically display) different information in a systematic, complete and complementary way.
For instance, the chips industry could appear as a relatively virtuous sector in terms of raw materials and final products. The information deriving from the loss of 49,000 t of food losses along the entire food supply chain, although significant in terms of weight, seems to be not easily usable by companies. However, from the MFCA results, one can identify the economic cost equal to EUR 81.81 million, being on average 1650 EUR/t of wasted tubers, which represents salient and actionable information for businesses. Considering the different stages of the food supply chain, MFCA provides in-depth data for each stage, outlining the main inefficiencies in food processing and households’ consumption, estimated at approximately EUR 70 million and EUR 45 million, respectively. The first amount should motivate the companies involved in the production of chips (i.e., farms, transport companies and processing industries) to improve the efficiency of their waste management, enhancing the collection and reuse/recovery of the organic fraction.
The second set of data, albeit aggregated, should suggest to families that still edible food has its own economic cost which, in the long run, can become substantial. Nevertheless, food-waste-related economic costs are not limited to “production-waste” but expand into “waste-disposal”, representing an additional cost for business (i.e., income losses) and for the entire community (i.e., disposal costs).
As supposed by May and Guenther [33], waste management costs towards energetic recovery are equal to 15 EUR/t, which would sum to EUR 742,500 for food loss and EUR 60,750 for food waste, whereas the cost to collect and recycle this waste [85] would be EUR 841,500 and EUR 68,850, respectively. However, if food loss and waste are shipped to a landfill, their waste management costs increase to over 120 EUR/t [86], equivalent to more than EUR 5.69 million and EUR 465,750, respectively. In terms of landfill costs, approximately 25% can be attributed to current taxes placed on landfill shipments, whereas 75% can be attributed to typical landfill gate fees. It can be stated that food loss and waste cause two impacts: one in terms of production costs, and another in terms of disposal costs. However, considering the costs of food loss and waste as calculated through MFCA, different businesses can make an informed choice among dissimilar disposal alternatives (e.g., waste to energy recovery, recycling and landfilling). Of course, businesses may be unable to ignore the environmental costs deriving from the different disposal choices and may consider landfilling as a “nonrealistic option” to reach sustainable development [12].
Furthermore, companies could analyze MFCA results that distinguish between “positive” and “negative” products, where “negative” products are those associated with waste production. Therefore, such results could represent a comprehensive and clear communication instrument, for either internal or external company stakeholders, helping the workforce and consumers to understand the associated opportunities for reuse and recycling from material and financial perspectives. To this extent, the chips system faces a positive production of over EUR 461 million (78%), whereas a negative production exceeds EUR 131 million (22%). In quantitative terms, the number of negative flows highlighted in the chips system seems to be in line with the average quantities (20–30%) outlined by previous studies [41,87], revealing a substantial potential for savings through a reduction in undesirable negative material flows, or through the valorization of previously hidden material losses within a circular economy approach.
However, MFCA is a method that identifies theoretical potential savings, but does not provide practical solutions [88], which is one of the main reasons why companies have been (and still are) slow in implementing its principles within their plants. As a consequence, companies should integrate MFCA into their daily management and innovation processes, exploiting its full potential and transforming theory into practice and enhancing its capability to reconcile the environment and the economy by analyzing the entire manufacturing process.

5.2. Public Authorithies’ Implications

As highlighted by the European Commission (Delegated Decision 2019/1597 [12]), in terms of the identification of common methodologies and minimum quality requirements for the homogeneous assessment of food waste quantities and composition, public authorities should incentivize the voluntary implementation of MFCA at the single industrial plant level to measure FLW-associated impacts. Although such a tool has been already standardized at the international level [89], companies are still reluctant to implement the MFCA to reach long-term objectives and provide transparent and updated inventories, as discussed by previous studies [90]. Therefore, public authorities should support companies in adopting such a method, since its systematic use could enhance disaggregated data collection, which is an absolute priority in the context of food waste [5,91] that would support the achievement of either national or international sustainability strategies, as well as the analysis and modelling of new, more accurate estimates of global FLW. Indeed, creating more high-quality data generated through a consistent bottom-up methodology could address a critical challenge that public authorities face when building indicators based on highly variable top-down data collection approaches.
Although some studies have implemented material cycle, eco-efficiency and environmental indicators in the field of FLW [92,93], national and international policies should be oriented towards food waste indicator enhancement, highlighting their role in the identification of the most promising strategies to address social, financial and environmental goals [94]. Then, companies should be encouraged to construct their own so-called “food waste index”, which currently represents one of the most promising macro-indicators to compare the sustainability target achievement levels among countries over time [4].
In addition, obtaining MFCA material and financial results could help agri-food actors and public authorities effectively incentivize bonds, resource allocations and activity links [81], thus forwarding industrial symbiosis and circular economy paradigms. For example, if methods are applied consistently across different product categories within the agri-food sector, it may reveal patterns or hot spots in related sectors to suggest that certain types of centralized investments (e.g., in flexible valorization or gleaning systems) could yield system-wide benefits.
Agricultural activities, industrial plants, retail stores, households and food services could implement mass balance and financial models and participate in the value chain knowledge exchange, enhancing environmental and financial benefits both for the private and the collective good. As a leverage point, MFCA results provide insights from economic (e.g., reduction in direct and indirect costs), environmental (e.g., reduction in resources depletion) and social (e.g., increase in food security) perspectives.

5.3. Conceptual Implications

Companies have been (and still are) reluctant to implement MFCA principles within their units, because they do not perceive the great potential of bringing together, in a single accounting process, financial and material flows [41]. However, companies should invest in MFCA to implement strategic objectives and improve decision making, considering its suitability for simultaneously generating financial benefits and reducing negative environmental impacts [90]. The present research, providing an example at the meso-level, supports the introduction of material and financial accounting systems at the industrial plant and country level, pursuing both internal savings for single plants and collective benefits towards sustainable resources and waste management, either to reduce food or non-food waste. MFCA results differentiate between the material costs of product outputs (i.e., final products) and the material costs of non-product outputs (i.e., loss or waste), providing useful insight for each production step.
In addition, distinguishing among material costs, system costs and delivery or disposal costs, MFCA represents a concrete tool to promote efficiency, effectiveness and cost-effectiveness either within or between companies, stimulating the creation of networks or industrial symbiosis to reuse or valorize waste, therefore creating profits and reducing “negative” costs. Furthermore, although MFCA represents an economic accounting tool, it arises as a useful instrument for defining sustainable resources and waste management paths. It outlines “hidden” material costs along the entire supply chain, from agricultural production to consumption and disposal activities, providing useful perspectives on production chain dysfunction, either under technological or managerial perspectives. In terms of adhering to the European Commission Delegated Decision 2019/1597 proposals [12], MFCA provides a more refined picture than the simple mass balance approach, defining at the same time material flows and economic (positive or negative) costs, and indirectly providing social insights (e.g., profits and business efficiency).
Nevertheless, the application of MFCA faces several limitations, among which the lack of data represents the most crucial. If input data (either in terms of weight or costs) exist and are quite stable, such an approach could return reliable estimates, providing a detailed snapshot of production chains’ strengths and weaknesses (e.g., hotspots, inefficiencies and dysfunctions). However, the lack of data imposes several concerns in terms of reliability and uncertainties—partially solvable through the use of suitable software (e.g., STAN 2.6)—highlighting the need for improved statistics on resource efficiency, trade, consumption and costs with higher degrees of disaggregation. We also recognize the limitation of assuming no behavioral changes at the consumer level. Furthermore, the analysis does not take into account some environmental performance measures or indicators, such as the carbon or the water footprint, which could enhance the sustainability analysis and motivate the application of MFCA for environmental research.
Future research could analyze changes in economic flows associated with FLW in relation to the changes in consumption and waste behaviors recorded following the COVID-19 pandemic [83,84]. Such an approach could illuminate the causal links between material flows, cost flows, consumption and waste behavior along the entire agri-food chain from a holistic perspective. In addition, to explore the use of the MFCA as an environmental management tool and define its efficacy towards environmental entrepreneurship, the authors will likely adopt a mixed approach based either on MFCA or the Environmental Life Cycle Costing (E-LCC) approach, which adds external costs (i.e., environmental and social impacts defined as “externalities”) to internal costs (i.e., material costs, energy costs, waste management costs and additional costs) [95]. Such an approach could open research perspectives and strengthen the unbreakable bond between economic growth and environmental protection [96].
Last, while the MFCA approach is inherently attractive because it explicitly creates links across stages within a given product’s value chain, more work is needed to understand what linkages might exist across value chains such that investments that might service multiple sectors can be robustly evaluated. Finally, while highly effective as an accounting method, MFCA does not currently permit for the feedbacks that might be expected to occur if changes are implemented at the industry or country level. That is, the prices assigned to materials at each stage are likely to be endogenous to interventions designed to reduce food loss and waste, and no computational infrastructure currently exists to assess how large-scale interventions will affect prices and the resulting MFCA outcomes.

6. Conclusions

The present article applies MFCA at the meso-level, bringing together data and perspectives from the Italian potato chip industry at the country level. As an example of MFCA’s value as an analysis method, the article applies a material and economic comparison before and during the COVID-19 lockdown, which spurred an intense upsurge in snacking activities. The results support the use of MFCA for the assessment of the change in the economic and environmental consequences of food loss and waste associated with the change in circumstances created by the COVID-19 lockdown in Italy. Such a tool, developed to be consistent with the assumptions underlying mass balance approaches, appears to be highly transversal either for companies (i.e., private benefits through profit maximization and cost minimization) or public authorities (i.e., public benefits through a reduction in economic, social and environmental food-waste-related impacts), resulting in a replicable method that can be applied in different sectors of the food and non-food economy.

Author Contributions

This paper should be considered the result of the common work of the authors. Conceptualization, V.A., B.E.R. and C.B.; methodology, V.A. and C.B.; software, C.B.; validation, V.A. and C.B.; formal analysis, V.A. and C.B.; investigation, V.A. and C.B.; resources, V.A. and C.B.; data curation, V.A. and C.B.; writing—original draft preparation, C.B.; writing—review and editing, V.A. and B.E.R.; supervision, V.A. and B.E.R. All authors have read and agreed to the published version of the manuscript.

Funding

This research received no external funding. B.E.R. recognizes salary support from USDA National Institute of Food and Agriculture, Hatch project OHO01419.

Institutional Review Board Statement

Not applicable.

Informed Consent Statement

Not applicable.

Data Availability Statement

Not applicable.

Conflicts of Interest

The authors declare no conflict of interest.

References

  1. Zylbersztajn, D. Agribusiness systems analysis: Origin, evolution and research perspectives. Rev. Adm. 2017, 52, 114–117. [Google Scholar] [CrossRef] [Green Version]
  2. Food and Agriculture Organization of the United Nations. Agriculture Food Systems Transformation: From Strategy to Action; Food and Agriculture Organization of the United Nations: Rome, Italy, 2021. [Google Scholar]
  3. Food and Agriculture Organization of the United Nations. The Impact of Disasters and Crises on Agriculture and Food Security: 2021; Food and Agriculture Organization of the United Nations: Rome, Italy, 2021. [Google Scholar]
  4. Pérez-Escamilla, R. Food Security and the 2015-2030 Sustainable Development Goals: From Human to Planetary Health: Perspectives and Opinions. Curr. Dev. Nutr. 2017, 7, e000513. [Google Scholar] [CrossRef]
  5. Amicarelli, V.; Bux, C. Food waste measurement toward a fair, healthy and environmental-friendly food system: A critical review. Br. Food J. 2020, 123, 2907–2935. [Google Scholar] [CrossRef]
  6. Edwards, M.R.; Clifford, J.S. Reframing agribusiness: Moving from farm to market centric. J. Agribus. 2005, 23, 57–73. [Google Scholar]
  7. Ritchie, H.; Roser, M. Environmental Impacts of Food Production. OurWorldInData.org. Available online: https://ourworldindata.org/environmental-impacts-of-food (accessed on 15 July 2021).
  8. Food and Agriculture Organization of the United Nations. Food Wastage Footprint. Impacts on Natural Resources, Summary Report; Food and Agriculture Organization of the United Nations: Rome, Italy, 2013. [Google Scholar]
  9. Poore, J.; Nemecek, T. Reducing food’s environmental impacts through producers and consumers. Science 2018, 360, 987–992. [Google Scholar] [CrossRef] [PubMed] [Green Version]
  10. Pellegrini, M.; Ponzo, V.; Rosato, R.; Scumaci, E.; Goitre, I.; Benso, A.; Belcastro, S.; Crespi, C.; De Michieli, F.; Ghigo, E.; et al. Changes in weight and nutritional habits in adults with obesity during the “lockdown” period caused by the COVID-19 virus emergency. Nutrients 2020, 12, 2016. [Google Scholar] [CrossRef] [PubMed]
  11. Bakaloudi, D.R.; Jeyakumar, D.T.; Jayawardena, R.; Chourdakis, M. The impact of COVID-19 lockdown on snacking habits, fast-food and alcohol consumption: A systematic review of the evidence. Clin. Nutr. 2021. [Google Scholar] [CrossRef]
  12. Official Journal of European Union. Regulation (EC) No 1069/2009 of the European parliament and of the council of 21 October 2009-laying down health rules as regards animal by-products as derived products not no human consumption and repealing regulation (EU) No 1774/2002 (animal by-products regulation). Off. J. Eur. Un. 2009, 300, 33. [Google Scholar]
  13. Moraes, N.V.; Lermen, F.H.; Echeveste, M.E.S. A systematic literature review on food waste/loss prevention and minimization methods. J. Environ. Manag. 2021, 286, 112268. [Google Scholar] [CrossRef] [PubMed]
  14. Giordano, C.; Alboni, F.; Cicatiello, C.; Falasconi, L. Do discount food products end up in the bin? An investigation into the link between deal-prone shopping behavior and quantities of household food waste. Int. J. Consum. Stud. 2019, 43, 199–209. [Google Scholar] [CrossRef]
  15. Roe, B.E.; Qi, D.; Beyl, R.A.; Neubig, K.E.; Apolzan, J.W.; Martin, C.K. A randomized controlled trial to address consumer food waste with a technology-aided tailored sustainability intervention. Resour. Conserv. Recycl. 2022, 179, 106121. [Google Scholar] [CrossRef]
  16. Khalid, S.; Naseer, A.; Sahid, M.; Shah, G.M.; Ullah, M.I.; Waqar, A.; Abbas, T.; Imran, M.; Rehman, F. Assessment of nutritionl loss with food waste and factors governing this waste at household level in Pakistan. J. Clean. Prod. 2019, 206, 1015–1024. [Google Scholar] [CrossRef]
  17. Seabrook, J.A.; Gilliland, J.A. “Reduce Food Waste, Save Money”: Testing a novel intervention to reduce household food waste. Environ. Behav. 2021, 53, 151–183. [Google Scholar]
  18. Soma, T.; Li, B.; Maclaren, V. Food waste reduction: A test of three consumer awareness interventions. Sustainability 2020, 12, 907. [Google Scholar] [CrossRef] [Green Version]
  19. Cammarelle, A.; Lombardi, M.; Viscecchia, R. Packaging innovations to reduce food loss and waste: Are Italian manufacturers willing to invest? Sustainability 2021, 13, 1963. [Google Scholar] [CrossRef]
  20. Katajajuuri, J.M.; Silvennoinen, K.; Hartikainen, H.; Heikkila, L.; Reinikainen, A. Food waste in the Finnish food chain. J. Clean. Prod. 2014, 73, 322–329. [Google Scholar] [CrossRef]
  21. Tostivint, C.; de Veron, S.; Jan, O.; Lanctuit, H.; Hutton, Z.H.; Loubiere, M. Measuring food waste in a dairy supply chain in Pakistan. J. Clean. Prod. 2017, 145, 221–231. [Google Scholar] [CrossRef]
  22. Djekic, I.; Operta, S.; Djulancic, N.; Lorenzo, J.M.; Barba, F.J.; Djordjevic, V.; Tomasevic, I. Quantities, environmental footprints and beliefs associated with household food waste in Bosnia and Herzegovina. Waste Manag. Res. 2019, 37, 1250–1260. [Google Scholar] [CrossRef]
  23. Beretta, C.; Stoessel, F.; Baier, U.; Hellweg, S. Quantifying food losses and the potential for reduction in Switzerland. Waste Manag. 2013, 33, 764–773. [Google Scholar] [CrossRef] [PubMed] [Green Version]
  24. Islam, M.T.; Huda, N. Material flow analysis (MFA) as a strategic tool in E-waste management: Applications, trends and future directions. J. Environ. Manag. 2019, 244, 344–361. [Google Scholar] [CrossRef] [PubMed]
  25. Villalba, L. Material Flow Analysis (MFA) and waste characterizations for formal and informal performance indicators in Tandil, Argentina: Decision-making implications. J. Environ. Manag. 2020, 264, 110453. [Google Scholar] [CrossRef] [PubMed]
  26. Yogiswari, N.L.P.P.; Budiasih, I.G.A.N.; Sudana, I.P.; Mimba, N.P.S.H. Implementation of environmental cost accounting during the COVID-19 pandemic in medical waste management. Linguist. Cult. Rev. 2021, 6, 264–276. [Google Scholar] [CrossRef]
  27. Afshar, R.K.; Dekamin, M. Sustainability assessment of corn production in conventional and conservation tillage systems. J. Clean. Prod. 2022, 351, 131508. [Google Scholar] [CrossRef]
  28. Bux, C.; Amicarelli, V. Separate collection and bio-waste valorization in the Italian poultry sector by material flow analysis. J. Mater. Cycles Waste Manag. 2022, 24, 811–823. [Google Scholar] [CrossRef]
  29. United Nations Environment Programme. Food Waste Index. Report 2021; United Nations Environment Programme: Nairobi, Kenya, 2021. [Google Scholar]
  30. Garcia-Herrero, L.; De Menna, F.; Vittuari, M. Food waste at school. The environmental and cost impact of a canteen meal. Waste Manag. 2019, 100, 249–258. [Google Scholar] [CrossRef] [PubMed]
  31. Omolayo, Y.; Feingold, B.J.; Neff, R.A.; Romeiko, X.B.X. Life cycle assessment of food loss and waste in the food supply chain. Resour. Conserv. Recycl. 2021, 164, 105119. [Google Scholar] [CrossRef]
  32. Christ, K.L.; Burritt, R. Material flow cost accounting for food waste in the restaurant industry. Br. Food J. 2017, 119, 600–612. [Google Scholar] [CrossRef]
  33. May, N.; Guenther, E. Shared benefit by material flow cost accounting in the food supply chain. The case of berry pomace as upcycled by-product of a black currant juice production. J. Clean. Prod. 2020, 245, 118946. [Google Scholar] [CrossRef]
  34. Piwowar-Sulej, K.; Krzywonos, M.; Kwil, I. Environmental entrepreneurship–Bibliometric and content analysis of the subject literature based on H-Core. J. Clean. Prod. 2021, 295, 126277. [Google Scholar] [CrossRef]
  35. Herzig, C.; Viere, T.; Schaltegger, S.; Burritt, R.L. Environmental Management Accounting. Case Studies of South-East Asian Companies; Routledge, Taylor & Francis Group: Oxfordshire, UK, 2012. [Google Scholar]
  36. Arieftiara, D.; Theresa, R.M.; Sari, R. Sustainability in health service industry: The implementation of material flow cost accounting (MFCA) as an eco-efficient analysis. J. Southeast Asian Res. 2021, 2021, 747009. [Google Scholar] [CrossRef]
  37. Ho, J.Y.; Ng, D.K.S.; Kin Wan, Y.; Andiappan, V. Synthesis of wastewater treatment plant based on minimal waste generation cost: A material flow cost accounting (MFCA) approach. Process Saf. Environ. Prot. 2021, 148, 559–578. [Google Scholar] [CrossRef]
  38. Dechampai, D.; Homrossukon, S.; Wongthatsanekorn, W.; Ekkachai, K. Applying material flow cost accounting and two-dimensional, irregularly shaped cutting stock problems in the lingerie manufacturing industry. Appl. Sci. 2021, 11, 3142. [Google Scholar] [CrossRef]
  39. Burritt, R.L.; Hahn, T.; Schaltegger, S. Towards a comprehensive framework for environmental management accounting—Links between business actors and environmental management accounting tools. Aust. Account. Rev. 2008, 12, 39–50. [Google Scholar] [CrossRef]
  40. ISO 14501:2011; Environmental Management–Material Flow Cost Accounting–General Framework. ISO/TC 207. International Organization for Standardization: Geneva, Switzerland, 2011; pp. 1–38.
  41. Jasch, C. Environmental and Material Flow Cost Accounting; Springer: Dordrecht, The Netherlands, 2009. [Google Scholar]
  42. Brunner, P.H.; Rechberger, H. Handbook of Material Flow Analysis. For Environmental, Resource and Waste Engineers, 2nd ed.; CRC Press: Boca Raton, FL, USA; Taylor & Francis Group, LLC: London, UK, 2017. [Google Scholar]
  43. Jakrawatana, N.; Pingmuangleka, P.; Gheewala, S.H. Material flow management and cleaner production of cassava processing for future food, feed and fuel in Thailand. J. Clean. Prod. 2016, 134, 633–641. [Google Scholar] [CrossRef]
  44. Wan, Y.K.; Ng, R.T.L.; Ng, D.K.S.; Tan, R.R. Material flow cost accounting (MFCA)–Based approach for prioritisation of waste recovery. J. Clean. Prod. 2015, 107, 602–614. [Google Scholar] [CrossRef]
  45. Dierkes, S.; Siepelmeyer, D. Production and cost theory-based material flow cost accounting. J. Clean. Prod. 2019, 235, 483–492. [Google Scholar] [CrossRef]
  46. Kokubu, K.; Kitada, H. Material flow cost accounting and existing management perspectives. J. Clean. Prod. 2015, 108, 1279–1288. [Google Scholar] [CrossRef]
  47. Sahu, A.K.; Padhy, R.K.; Das, D.; Gautam, A. Improving financial and environmental performance through MFCA: A SME case study. J. Clean. Prod. 2021, 279, 123751. [Google Scholar] [CrossRef]
  48. Hendriks, C.R.; Obernosterer, D.; Müller, S.; Kytzia, P.; Baccini, P.; Brunner, P.H. Material flow analysis: A tool to support environmental policy decision making. Case-studies on the city of Vienna and the Swiss lowlands. Int. J. Justice Sustain. 2000, 5, 311–328. [Google Scholar] [CrossRef]
  49. Food and Agriculture Organization of the United Nations. Global Food Losses and Food Waste: Extent, Causes and Prevention; Food and Agriculture Organization of the United Nations: Rome, Italy, 2011. [Google Scholar]
  50. Hartikainen, H.; Mogensen, L.; Svanes, E.; Franke, U. Food waste quantification in primary production–The Nordic countries as a case study. Waste Manag. 2018, 71, 502–511. [Google Scholar] [CrossRef]
  51. Rubinstein, R.Y.; Kroese, D.P. Simulation and the Monte Carlo Method, 3rd ed.; Wiley: Hoboken, NJ, USA, 2017. [Google Scholar]
  52. Principato, L.; Secondi, L.; Cicatiello, C.; Mattia, G. Caring more about food: The unexpected positive effect of the COVID-19 lockdown on household food management and waste. Socio-Econ. Plan. Sci. 2020, 100953, in press. [Google Scholar] [CrossRef]
  53. Statista. Average Prices of Diesel Fuel in Italy from 2000 to 2021; Statista Research Department: New York, NY, USA, 2021. [Google Scholar]
  54. U.S. Environmental Protection Agency. Emission Factors for Greenhouse Gas Inventories. Available online: https://www.epa.gov/sites/production/files/2018-03/documents/emission-factors_mar_2018_0.pdf (accessed on 17 July 2021).
  55. ISMEA. Osservatorio Patate. Prezzi Mensili All’origine. Available online: http://www.ismeamercati.it/flex/cm/pages/ServeBLOB.php/L/IT/IDPagina/4834#MenuV (accessed on 14 July 2021).
  56. ISTAT. Prezzi Al Consumo. Available online: https://www.istat.it/it/archivio/241413 (accessed on 19 July 2021).
  57. Camaggio, G.; Lagioia, G. La Trasformazione Industriale Della Patata; Dal Tubero Al Fast Food. Quaderno del Dipartimento di Scienze Merceologiche; Progedit: Bari, Italy, 2002; Volume 27, pp. 1–56. [Google Scholar]
  58. Hoepli, U. (Ed.) Manuale di Agricoltura, 2nd ed.; Hopeli: Milano, Italy, 1997. [Google Scholar]
  59. Mouron, P.; Willersinn, C.; Mobius, S.; Lansche, J. Environmental profile of the Swiss supply chain for French fries: Effects of food loss reduction, loss treatments and process modifications. Sustainability 2016, 8, 1214. [Google Scholar] [CrossRef] [Green Version]
  60. Sablani, S.; Mujumdar, A. Drying of Potato, Sweet Potato, and Other Roots. In Handbook of Industrial Drying, 4th ed.; Taylor & Francis Group, LLC: Boca Raton, FL, USA, 2006. [Google Scholar]
  61. Gustavsson, J.; Cedeberg, C.; Sonesson, U.; van Otterdijk, R.; Meybeck, A. Global Food Losses and Waste. Extent, Causes, Prevention; Food and Agriculture Organization of the United Nations: Rome, Italy, 2011. [Google Scholar]
  62. Consorzio Comuni Acquedotto Monferrato. Tariffe in Vigore 01/01/2019. Available online: https://www.ccam.it/tariffe-vigore-01012019 (accessed on 18 July 2021).
  63. Consorzio Comuni Acquedotto Monferrato. Tariffe in Vigore 01/01/2021. Available online: https://www.ccam.it/tariffe-vigore-01012021 (accessed on 18 July 2021).
  64. Camera di Commercio Alessandria. Listino Settimanale dei Prezzi All’ingrosso dei Prodotti Agricoli. Available online: http://images.al.camcom.gov.it/f/PriceLists/archive/ListinoPrezzi_1_07-10-2019.pdf (accessed on 18 July 2021).
  65. Camera di Commercio Alessandria. Listino Settimanale dei Prezzi All’ingrosso dei Prodotti Agricoli (Fertilizzanti). Available online: http://www.al.camcom.gov.it/PriceLists/Pub/Item?id_level_2=10 (accessed on 18 July 2021).
  66. ISMEA. Oli Vegetali–News Mercati. Available online: http://www.ismeamercati.it/flex/cm/pages/ServeBLOB.php/L/IT/IDPagina/9283 (accessed on 18 July 2021).
  67. ISMEA. Olio di Semi Raffinati–Prezzi per Piazza All’ingrosso. Available online: http://www.ismeamercati.it/flex/cm/pages/ServeBLOB.php/L/IT/IDPagina/927 (accessed on 18 July 2021).
  68. OECD. Effective Carbon Rates 2021. Pricing Carbon Emissions through Taxes and Emissions Trading; OECD Publishing: Paris, France, 2021. [Google Scholar]
  69. Eurostat. Intra EU-28 Export of Potatoes, 2018 (1000 EU, 1000 Tonnes). Eurostat, Statistics Explained, European Union 1995–2021; Eurostat: Luxembourg, 2018. [Google Scholar]
  70. Eurostat. The EU Potato Sector-Statistics on Production, Prices and Trade, European Union, 1995–2021; Eurostat: Luxembourg, 2021. [Google Scholar]
  71. Amica Chips. Amica Chips, Una Storia Tutta Italiana. Available online: https://allfoodonline.com/amica-chips-una-storia-tutta-italiana/ (accessed on 28 July 2021).
  72. Food. Amica Chips Festeggia I Primi 25 Anni. Available online: https://www.foodweb.it/2015/05/amica-chips-festeggia-i-primi-25-anni/ (accessed on 28 July 2021).
  73. San Carlo. L’azienda. Available online: https://www.sancarlo.it/it/publishing1.asp?ArticleId=9 (accessed on 28 July 2021).
  74. ISTAT. Nota Mensile Sull’andamento Dell’economia Italiana. Available online: https://www.istat.it/it/files/2020/04/notamensile_marzo_def.pdf (accessed on 28 July 2021).
  75. Coldiretti. Coronavirus, Balzo Nell’acquisto di Prodotti Alimentari. Available online: https://www.coldiretti.it/economia/coronavirus-balzo-nellacquisto-di-prodotti-alimentari (accessed on 28 July 2021).
  76. Nielsen. Coronavirus: La Spesa in Quarantena. The NielsenCompany (US). Available online: https://nielseniq.com/global/it/insights/analysis/2020/coronavirus-la-spesa-in-quarantena/ (accessed on 28 July 2021).
  77. Nielsen. Insights. Largo Consumo e Distribuzione. The NielsenCompany (US). Available online: https://www.nielsen.com/it/it/insights/ (accessed on 28 July 2020).
  78. STAN (subSTance flow ANalysis), Technische Universtitat Wien, Institute for Water Quality, Resource and Waste Management. Funded by ARA–Altstoff Recycling Austria, Lebensministerium, Federal State of Austria. Available online: https://www.stan2web.net (accessed on 28 July 2020).
  79. European Central Bank. Consumption Patterns and Inflation Measurement Issues during the COVID-19 Pandemic. Available online: https://www.ecb.europa.eu/pub/economic-bulletin/focus/2020/html/ecb.ebbox202007_03~e4d32ee4e7.en.html (accessed on 18 July 2021).
  80. Cencic, O. Treatment of Data Uncertainties in MFA. In Handbook of Material Flow Analysis: For Environmental, Resource, and Waste Engineers, 2nd ed.; Brunner, P.H., Rechberger, H., Eds.; CRC Press—Taylor & Francis Group: Boca Raton, FL, USA, 2016; pp. 94–148. [Google Scholar]
  81. Rechberger, H.; Cencic, O.; Fruhwirth, R. Uncertainty in material flow analysis. J. Ind. Ecol. 2014, 18, 159–160. [Google Scholar] [CrossRef]
  82. Wang, Y.; Ma, H. Analysis of uncertainty in material flow analysis. J. Clean. Prod. 2018, 170, 1017–1028. [Google Scholar] [CrossRef]
  83. Scacchi, A.; Catozzi, D.; Boietti, E.; Bert, F.; Siliquini, R. COVID-19 lockdown and self-perceived changes of food choice, waste, impulse buying and their determinants in Italy: QuarantEat, a cross-sectional study. Foods 2021, 10, 306. [Google Scholar] [CrossRef]
  84. Pappalardo, G.; Cerroni, S.; Nayaga, R.F.; Yang, W. Impact of COVID-19 household food waste: The case of Italy. Front. Nutr. 2020, 7, 585090. [Google Scholar] [CrossRef]
  85. Cialani, C.; Mortazavi, R. The cost of urban waste management: An empirical analysis of recycling patterns in Italy. Front. Sustain. Cities 2020, 2, 8. [Google Scholar] [CrossRef]
  86. European Environment Agency. Typical Charge (Gate Fee and Landfill Tax) for Legal Landfilling of Non-Hazardous Municipal Waste in EU Member States and Regions; European Union: Copenhagen, Denmark, 2013. [Google Scholar]
  87. Schmidt, M.; Nakajima, M. Material flow cost accounting as an approach to improve resource efficiency in manufacturing companies. Resources 2013, 2, 358–369. [Google Scholar] [CrossRef]
  88. Nishitani, K.; Kokubu, K.; Wu, Q.; Kitada, H.; Guenther, E.; Guenther, T. Material flow cost accounting (MFCA) for the circular economy: An empirical study of the triadic relationship between MFCA, environmental performance, and the economic performance of Japanese companies. J. Environ. Manag. 2022, 303, 114219. [Google Scholar] [CrossRef] [PubMed]
  89. IFAC. International Guidance Document: Environmental Management Accounting. Available online: https://www.ifac.org/knowledge-gateway/preparing-future-ready-professionals/publications/international-guidance-document-environmental-management-accounting (accessed on 31 March 2022).
  90. Tran, T.T.; Herzig, C. Improving decision-making through material flow cost accounting: The case of VietGreen bottled mineral water company. Int. Food Agribus. Manag. Rev. 2021, 25, 37–48. [Google Scholar] [CrossRef]
  91. Närvänen, E.; Mesiranta, N.; Mattila, M.; Heikkine, A. Food Waste Management: Solving the Wicked Problem; Springer Nature: London, UK, 2019. [Google Scholar]
  92. Amicarelli, V.; Rana, L.R.; Lombardi, M.; Bux, C. Material flow analysis and sustainability of the Italian meat industry. J. Clean. Prod. 2021, 299, 126902. [Google Scholar] [CrossRef]
  93. Kuiper, M.; Cui, H.D. Using food loss reduction to reach food security and environmental objectives–A search for promising leverage points. Food Policy 2021, 98, 101915. [Google Scholar] [CrossRef]
  94. Goossens, Y.; Wegner, A.; Schmidt, T. Sustainability assessment of food waste prevention measures: Review of existing evaluation practices. Front. Sustain. Food Syst. 2019, 3, 90. [Google Scholar] [CrossRef]
  95. Kambanou, M.L.; Lindahl, M. A literature review of life cycle costing in the product-service system context. Proc. CIRP 2016, 47, 186–191. [Google Scholar] [CrossRef] [Green Version]
  96. Huang, C.H.; Liu, S.M.; Hsu, N.Y. Understanding global food surplus and food waste to tackle economic and environmental sustainability. Sustainability 2020, 12, 2892. [Google Scholar] [CrossRef] [Green Version]
Figure 1. “Chips system” diagram. Notes: Green lines illustrate food flows (i.e., tubers and chips), whereas red lines identify food loss and food waste flows (i.e., non-harvested tubers, substandard tubers, skins and scraps, oil waste and chips waste). Number 1 links tubers from the agricultural stage to tubers at the transportation stage. Number 2 links tubers from the transportation stage to tubers at the food processing stage. Number 3 links chips from the food processing stage to chips at the transportation stage. Number 4 links chips from the transportation stage to chips at the household consumption stage. Source: Personal elaboration by the authors.
Agriculture 12 00523 g001
Figure 2. Material flow analysis for the Italian potato chip industry (t). Notes: Number 1 links tubers from the agricultural stage to tubers at the transportation stage. Number 2 links tubers from the transportation stage to tubers at the food processing stage. Number 3 links chips from the food processing stage to chips at the transportation stage. Number 4 links chips from the transportation stage to chips at the household consumption stage. Source: Personal elaboration by the authors.
Agriculture 12 00523 g002
Figure 3. MFCA before (a) and during (b) the lockdown in million EUR. Notes: (A) = agriculture; (T) = transportation; (FP) = food processing; and (H) = households. Both figures identify input and output values along the entire supply chain. Figure 3b illustrates in red the variations in input and output values (e.g., Δ = –39.6 indicates a reduction in tubers costs, considering 104.40 minus 64.8 million EUR). It emerges that FLW costs have increased, respectively, by EUR +22.33 million (loss) and EUR +0.37 million (waste) during the lockdown. Source: Personal elaboration by the authors.
Agriculture 12 00523 g003
Table 1. Data inventory for 1 ton (t) of unpackaged chips (functional unit).
Supply Chain StageInputtOutputt
Agricultural stageSeeds0.33Non-harvested tubers
Tubers
0.3
4
Fertilizers0.05
Water28
TransportationEnergy0.007CO2 emissions0.10
Non-harvested tubers0.3
Tubers4Tubers lost0.1
Tubers3.6
Food processingMix of oils0.3Mix of oils0.3
Salt0.02Steam2.2
Substandard tubers0.05
Tubers3.6Skins and scraps0.35
Chips1
TransportationEnergy0.007CO2 emissions0.10
Chips1Chips1
HouseholdsChips1Food waste (at 9%)0.09
Notes: 1 ton of energy refers to 1 toe (ton of oil equivalent, calorific value at 41.84 GJ/t). As regards 1 ton of steam, the steam is generated during the drying phase, when the tubers are hit by a counter-current flow of hot air in order to eliminate the water embedded on the surface of the chips. With respect to the mix of vegetable oils, the replacement rate of used oils is estimated to occur, on average, after every 8 h of frying. Source: Personal elaboration by the authors.
Table 2. Cost categories and data inventory (EUR/t).
Cost CategoryItemScenario 1Scenario 2Δ (%)
Material costsTubers580360−38%
Fertilizers35541517%
Seeds42856031%
Water1.651.745%
Mix of veg. oils2.865.178%
Salt160160N/A
Chips11.1911.280.80%
Energy costsFuel1.721.53−10%
Waste management costsRecovery1515N/A
Additional costsCO2 emissions6060N/A
Source: Personal elaboration by the authors.
Table 3. Food loss and waste cost ratios.
Scenario 1
RatiosInputTubers (A)Chips (D)Chips (H)
Food loss111.72%56.97%10.68%12.98%
Food waste85.11%43.40%8.14%9.89%
Scenario 2
RatiosInputTubers (A)Chips (D)Chips (H)
Food loss99.26%126.25%13.98%17.71%
Food waste55.42%55.42%7.80%9.89%
Notes: Based on values presented in Figure 3a (first scenario) and Figure 3b (second scenario). The ratio is calculated as, e.g., 111.72% = EUR 59.48 M of food loss (Figure 3a, far right) divided by the sum of costs for seeds, fertilizer, water, energy, salt and oils (8.61 + 0.8 + 2.08 + 1.21 + 2.14 + 38.41 = EUR 53.24 M, Figure 3a, various values). Notes: A = agricultural stage; D = distribution stage; and H = household consumption. Source: Personal elaboration by the authors.
Publisher’s Note: MDPI stays neutral with regard to jurisdictional claims in published maps and institutional affiliations.

