Article

Multiple Factors at Regional, Landscape, and Local Scales Determine Spider Assemblage Composition in Pomegranate Orchards

by
Ibrahim N. A. Salman
1,2,*,
Yael Lubin
1 and
Efrat Gavish-Regev
3
1
Mitrani Department of Desert Ecology, Jacob Blaustein Institutes for Desert Research, Ben-Gurion University of the Negev, Midreshet Ben-Gurion 8499000, Israel
2
French Associates Institute for Agriculture and Biotechnology of Drylands, Jacob Blaustein Institutes for Desert Research, Ben-Gurion University of the Negev, Midreshet Ben-Gurion 8499000, Israel
3
The National Natural History Collections, Edmond J. Safra Campus, Giv’at Ram, The Hebrew University of Jerusalem, Jerusalem 9190401, Israel
*
Author to whom correspondence should be addressed.
Agriculture 2022, 12(4), 512; https://doi.org/10.3390/agriculture12040512
Submission received: 20 January 2022 / Revised: 14 March 2022 / Accepted: 1 April 2022 / Published: 4 April 2022
(This article belongs to the Special Issue Biodiversity in Fruit Orchards)

Abstract

:
Orchards may support high spider diversity relative to annual crops due to their structural complexity and relative stability. Multiple environmental conditions at the landscape, regional, and local scales may influence the assemblage composition of spiders in orchards. We asked which environmental variables best explains spider assemblage composition and the similarity of the assemblages of pomegranate orchards located along a latitudinal gradient in Israel? Spiders were sampled from twelve pomegranate orchards along a climatic gradient from north to south. Orchards located at higher latitudes had richer assemblages than orchards located at lower latitudes. The assemblage composition was influenced at the large scale by latitude and annual crop cover in the surrounding landscape but not by local factors. By contrast, functional groups based on foraging strategies were affected by local scale factors, such as vegetation within the orchards. This study demonstrates the importance of considering environmental variables at different scales to understand the factors affecting the assemblage composition of naturally occurring predators in the orchard.

1. Introduction

Woody, perennial crops such as orchards and vineyards differ from field crops in that perennial crops tend to be less disturbed by management procedures such as tillage and harvest. Woody perennial crops ensure vegetation cover and standing biomass year-round [1]. They are not subjected to crop rotation or total biomass removal during harvest, and they usually have lower levels of soil disturbance and more ground cover than seasonal crops [2]. Overall, due to greater structural complexity and stability, woody perennial crops are expected to provide greater habitat diversity than annual crops and to increase the diversity, abundance, and persistence of beneficial arthropods such as predators of herbivorous insect crop pests (see, e.g., [3] for a comparison of the abundance and diversity of spiders in perennial and annual crops).
Species composition, abundance, and diversity of natural enemies are affected by different elements of the agroecosystem [4,5,6]. These elements include abiotic factors at the local and regional scales, crop management practices, and the structure and diversity of habitats in the surrounding landscape. The characteristics of the vegetation, its heterogeneity and complexity both within and adjacent to the crop, can affect the diversity and abundance of the natural enemy populations [6,7,8]. For example, flowering annuals planted within or near orchards and vineyards increased the diversity of some natural enemies and increased predation on some pest species (e.g., [9]). Likewise, natural habitats surrounding vineyards were found to have a high diversity of parasitoid wasps, some of which occur in the vineyards as well and parasitize vineyard pests [10]. The presence of an adjacent woody habitat was shown to have a positive effect on the abundance of many groups of natural enemies in vineyards [11] and on the abundance of predators in apple orchards [12,13]. Overall, increased landscape heterogeneity and, in particular, the nearby natural habitat, is often associated with a greater abundance and diversity of some arthropod predators in woody perennial crops [8,14,15,16,17].
While the abundance and diversity of natural enemies in perennial crops may be affected positively by the surrounding habitats, the patterns are less clear regarding the effect on species assemblage composition. Regional abiotic factors such as temperature and precipitation regimes have been shown in some instances to outweigh other factors in influencing the composition of predator communities in fruit orchards [1,18]. Species compositions could vary dynamically if some natural enemy species are perennial crop residents (agrobionts), while others immigrate from the surrounding landscape [13]. Alternatively, the stability of perennial crops may make them less susceptible to the invasion of opportunistic natural enemy species from surrounding habitats [1]. Therefore, species composition of natural enemies in perennial crops could be less affected by the surrounding habitats. This leads to the question: For a particular perennial crop type, will the composition of the natural enemy’s assemblage vary with regional or local abiotic conditions, or will it depend primarily on the landscape composition surrounding each crop field? To answer this question, we investigated the composition of spider assemblages in pomegranate orchards in relation to environmental variables at different spatial scales.
Spiders are generalist predators with a broad-spectrum diet [19], which enables them to utilize a range of non-pest species as prey in a crop when pest populations are low. Prey preference and foraging strategies of spiders vary among species. Based on their diverse foraging behaviors and life history traits [19,20,21], spiders can be divided into different functional groups, namely species that exploit resources in a similar way [21,22,23]. A spider assemblage containing species from diverse functional groups may provide better control of crop pests due to their ability to utilize a wider range of prey and habitat types [24].
In this study, we took advantage of a latitudinal gradient from north to south in Israel to investigate the effects of the regional, landscape, and local environmental conditions on the composition of assemblages of spiders in twelve conventionally grown pomegranate orchards located along the gradient. Pomegranate orchards are known to have rich spider fauna [16,25]. Previously, we showed that the diversity and abundance of spiders sampled on trees in these pomegranate orchards were positively associated with the evenness of the cover of habitat types surrounding the orchards at the landscape scale and with insect abundance at the local scale [16]. Here, we expand the analysis to investigate the determinants of the assemblage composition of spiders in the tree canopy. We predicted that (a) orchards in the same geographic region will have a similar spider assemblage composition due to similar abiotic conditions and to being derived from a similar larger regional pool, and (b) variations in the landscape composition surrounding each orchard and (c) local conditions within the orchard will both affect the assemblage composition.

2. Methods

2.1. Study Sites

Spiders were sampled in 2015 from twelve commercial (Table 1 and Figure 1a), conventionally grown (nonorganic) pomegranate orchards of the “Wonderful” variety, distributed along a latitudinal gradient from north to south in Israel. The rainfall ranged from 690 mm in the northern orchard of Kefar Yuval to 126 mm in the southern orchard of Be’er Milka. Orchard size and age ranged between 0.7 and 5 ha and 4 and 14 years (median age = 9 years), respectively (Table A1). Each pomegranate orchard had an annual crop, another orchard, a non-crop habitat (semi-natural and weedy vegetation), and a human-dominated habitat (unpaved roads and settlements combined) on one of the four sides of the orchard.
The pomegranate orchards differed in their management regime, namely the use of insecticides and treatment of understory vegetation. A list of management procedures could be obtained only for six of the twelve orchards. Therefore, we excluded management from the analyses to avoid misleading conclusions. The number of chemical pesticide applications over the season in orchards for which we had information were: Evron (24), Giv’at Hayyim W (18), Hazor (12), Lakhish (5), Mishmar Ha’Negev (12), and Zor’a (23). These were mainly broad-spectrum organic insecticides (spinosyns). In addition, Bacillus thuringiensis Berliner 1915 and mating disruption methods were applied against moths in some orchards. The main pest species were the moths Deudorix livia (Klug 1834), Cryptoblabes gnidiella (Milliére 1867), and Lobesia botrana (Denis & Schiffermüller 1775) and the Mediterranean fruit fly (Ceratitis capitata (Wiedemann 1824)) and unidentified species of ants and aphids. Herbicides were applied in Hazor and Lakhish and fungicides in Giv’at Hayyim W.

2.2. Spider and Insect Sampling

Spiders and insects were sampled twice during 2015, once at the stage of early fruit development (June/July) and again about one month before harvest (August). At each orchard, we sampled six trees on the edge of the orchard adjacent to the non-crop habitat and six in the orchard center. Each tree was sampled for spiders and insects using two methods: by setting cylindrical trunk refuges and, on the same day, by visually searching and then shaking the tree branches. The refuge consisted of a cylinder of corrugated cardboard of 15 cm in length × 3.5 cm in diameter [26]. A cover of plastic foil was wrapped on top of each cylinder to protect it from rain. Two refugia were placed vertically on opposite sides of the tree trunk at about 1.5 m aboveground, with the open end facing downward. The refugia were removed after 30 to 35 days, placed in a sealed bag, and brought to the laboratory. In the laboratory, all arthropods within each trunk refuge were collected with an aspirator and placed into 75% ethanol. Before branch shaking, inner and outer branches of the canopy were searched visually for 15 s each, and all spiders were collected. After searching, we shook branches with a stick (the same one was used by one person for all trees) for 30 s. Arthropods were collected in a container held below the branches (length 34 cm, width 16 cm) and were placed in labeled vials filled with 75% ethanol. Spiders and insects from traps and branches were counted, and the data combined with the trunk traps and visual census to obtain the total spider and insect abundance per tree.

2.3. Spider Identification and Functional Groups

Spiders were identified to genus, or to species when possible. The nomenclature follows the World Spider Catalog [27]. Only less than 10% of spiders (89 out of 1109) were identified to species due to the lack of necessary taxonomic information. In particular, juveniles of some of the most common families (Linyphiidae, Salticidae, Gnaphosidae, Philodromidae, and Thomisidae) could not be reliably identified to the species. Therefore, we used spider genera in the subsequent analyses. The diversity of genera was shown to be a reliable estimate of species diversity in Mediterranean spiders [28].
We assigned each spider genus collected from the pomegranate orchards to one of the five functional groups according to a modified version of Cardoso et al. [22] and based on the knowledge of hunting strategies of local species (Y. Lubin & E. Gavish-Regev, personal communication). The five functional groups were ‘active hunters’, ‘ambush hunters’, ‘orb-web weavers’, ‘sheet-web weavers’, and ‘tangle-web weavers’.

2.4. Environmental Variables at Regional, Landscape, and Local Scales Used in Data Analyses

We investigated the effect of environmental variables on the assemblage composition of spiders in the twelve pomegranate orchards (Appendix A). The data from the two seasons were combined to estimate the total spider assemblage at each site.
Variables selected at the regional scale were the latitude and average annual rainfall over thirty years (1970–2000) from a weather station closest to each pomegranate orchard (data provided by A. Rosenfeld). At the landscape scale, the variables selected were the percentages of the area defined by a 1-km radius constituting four landscape types: other orchards, natural and semi-natural non-crop habitats, annual crops, and human-dominated (urban) areas. Using orthophotos and ARCGIS 10.1, we estimated the area of each habitat type within a 1-km radius from the edges of each orchard (data provided by A. Rosenfeld). This value was then converted to percent cover out of the total habitat area adjacent to each orchard. At the local scale, the variables were insect abundance (the total number of insects collected from trunk refugia and beating combined), percent understory plant cover and understory plant species richness in the orchard, orchard area, age, and elevation. Plant cover was estimated visually at eight locations within each orchard using an approximately 3 × 1-m transect at each location and species of plants were identified (data provided by M. Kishinevsky).

2.5. Statistical Analysis

In a previous study of spider abundance and diversity, using the same database, we showed that the total abundance and genus richness did not differ between the seasons, nor were there significant differences between trees located at the edge and center of each orchard [16]. Therefore, in the current analyses, we combined the data from all 12 trees of each orchard and the two sampling seasons and treated individual orchards as replicates.
To investigate the similarity between the assemblage composition of spiders in the different orchards, the Bray–Curtis dissimilarity measure was used [29]. This index ranges between 0 (no shared species) and 1 (fully similar community composition) and takes the abundances of taxa into account. Using the Bray–Curtis indices, we constructed a cluster dendrogram of the orchards to visually represent the similarities between the spider assemblage composition at the different sites.
To investigate the variables that contribute to explaining the assemblage composition of spider genera in the pomegranate orchards, we conducted a Canonical Correspondence Analysis (CCA) in Canoco 4.5 for Windows [30]. The CCA ordination was adopted, because our data had a unimodal distribution [31]. We used the unrestricted Monte Carlo permutation tests (4999 runs) and forward selection to test 11 potentially explanatory environmental variables. Partial CCA was performed to test the variables at (a) the regional scale (latitude, rainfall); (b) the landscape scale (the percent of surrounding semi-natural habitat, the percent of surrounding annual crops, the percent of surrounding orchards, and the percent surrounding human-dominated areas). The percent surrounding human-dominant areas were shown to have high multicollinearity with other variables at the landscape scale; therefore, it was removed from the analysis; and (c) the local scale (age and area of the orchard, percent of plant cover, plant richness, insect abundance, and elevation). Each variable served as a separate main effect, while the other variables were co-variables. In all ordination plots, spider data were log-transformed, and the downweighing option of Canoco was applied. The ordination plots were performed with only those variables that showed significant effects.
We used CanoDraw [30] to create species response curves to examine the responses of the dominant spider genera to the significant environmental variables found in the partial CCA analysis. Response curves were fitted using, for the y-axis, the scores of the first axis obtained in the partial CCA, plotted against each significant variable. The response variable is thus a measure of the abundance of the spider genera that were significantly affected by the environmental variable. The curves were fitted using GAM (Generalized Additive Model: smooth term complexity with 3 d,f). A Poisson distribution with a log link was assumed for the response variable. Curve selection was based on the Akaike Information Criterion (AIC) [32].
Correlations between the functional groups of spiders and the environmental variables were based on Spearman’s correlation coefficient, with Holm–Bonferroni sequential correction for multiple comparisons. We calculated variance inflation factors (VIF) for all variables to determine which environmental variables were correlated. Variables with VIF (>10) were excluded from the analysis due to high multi-collinearly.

2.6. Limitations and Novelty of the Study Design

The sampling was performed twice during the fruiting season. This provided data on the combined spider assemblage early in the fruiting season and when the fruit was nearly ripe to be picked. Seasonal effects were disregarded, as the samples would not have been adequate to analyze by season. The sampling methods adequately covered the range of species found on the pomegranate trees (branches, trunk, and foliage). Many studies of orchard spiders have used pitfall trapping for mobile, terrestrial species (e.g., [33,34]). Here, we focused on the assemblage that is relevant to potential pest control on the trees themselves. Our trunk refugia collected species that would not have been obtained by other methods [16,26]. Only 12 trees were sampled in each orchard, but by sampling both at the edge and center of each orchard (six trees each), we expected to obtain individuals of both resident and opportunistic species. The main limitation of the study is the lack of information on orchard management practices and, especially, the use of pesticides known to negatively affect species compositions of natural enemies in orchards [35]. All pomegranate orchards were sprayed, and pesticide applications were similar in the six orchards for which we had information.

3. Results

Thirty-seven genera of spiders from 16 families were collected from canopy shaking and trunk traps over the two seasons combined. Both sampling methods combined yielded a total number of 1700 spiders, of which 1109 were identified successfully to genera and were used in the subsequent analyses. Four genera, namely Alioranus Simon 1926, Cheiracanthium C. L. Koch 1839, Euryopis Menge 1868, and Heliophanus C. L. Koch 1833 accounted for 38.5% of individuals.

3.1. Similarity of the Spider Assemblage Composition among Orchards

The Bray–Curtis similarity analysis indicates that there are four main groupings of orchards (Figure 1a,b). The first and second are of sites in the center of the country (cluster A: Giv’at ‘Ada, Hazor, and Sede Ya’akov and cluster B: the two adjacent Giv’at Hayyim sites, respectively). The third cluster includes two northern sites (cluster C: Dishon and Kefar Yuval). The fourth cluster includes three southern sites (cluster D: Lakhish, Mishmar HaNegev, and Zo’ra). Two sites do not cluster with any other sites: Evron, a young orchard located on the northern coastal plain, and Be’er Milka, the southernmost site that we sampled, located in sand dunes and outside the main fruit-growing regions of the country.

3.2. Environmental Variables and the Composition of Spider Assemblages in Pomegranate Orchards

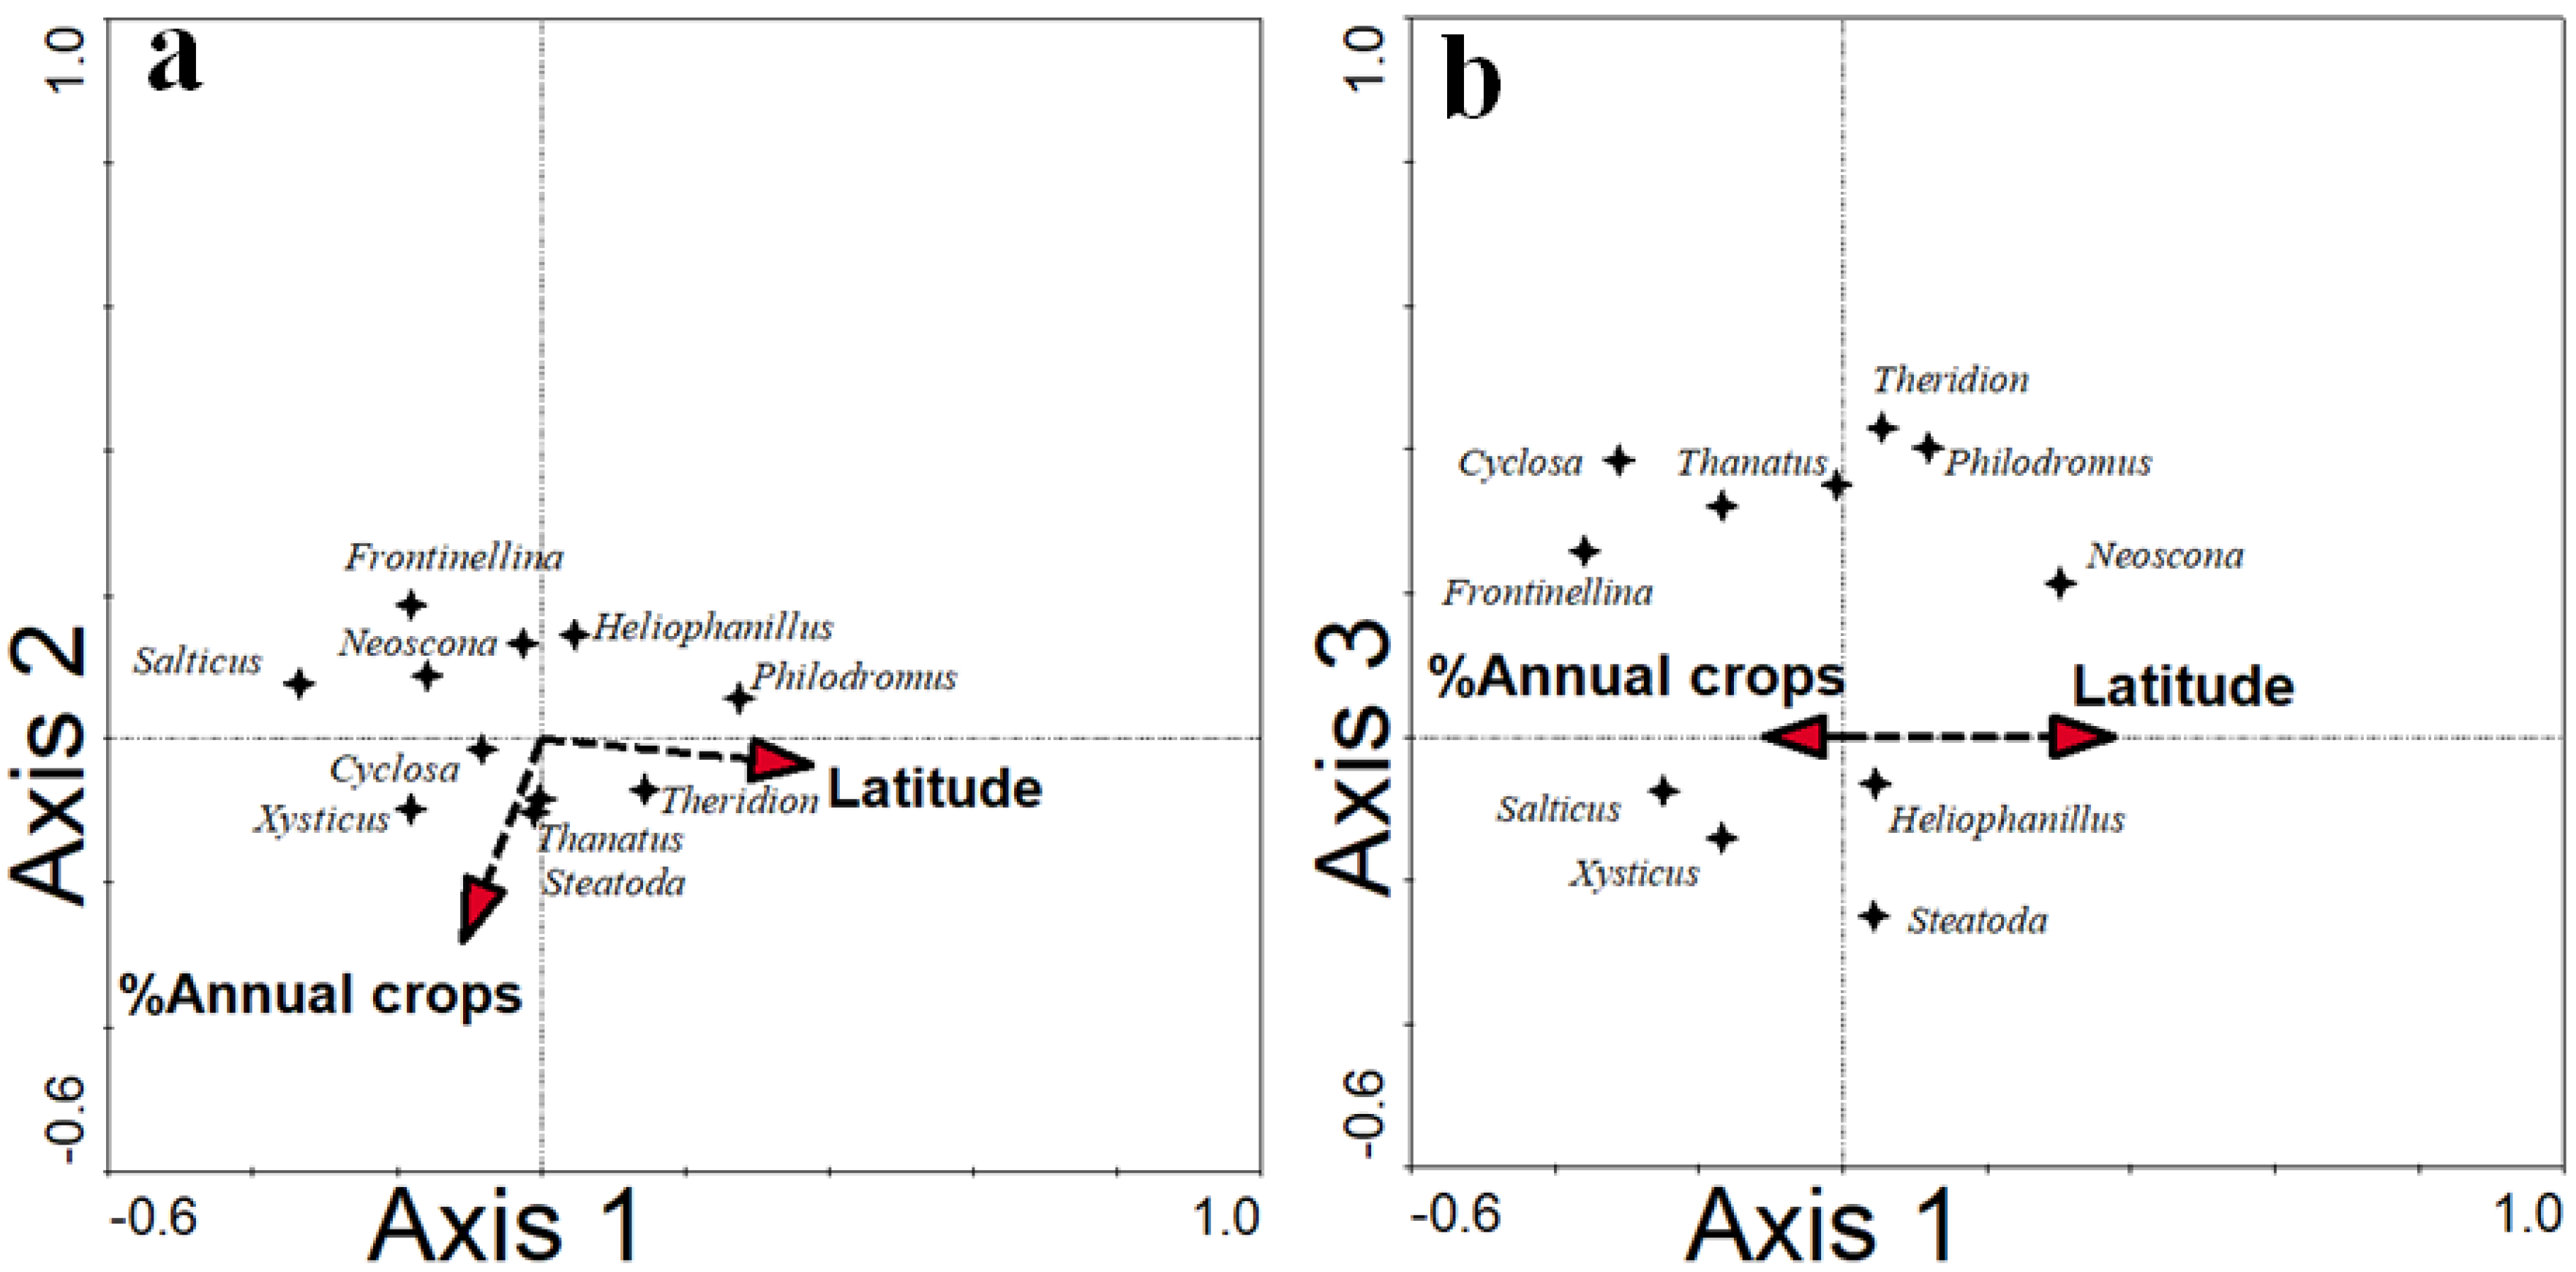
The partial CCA analyses of main effects found only two significant variables out of the 11 variables tested that affect spider assemblage composition: latitude and percent area of surrounding annual crops (p < 0.05). The variables that showed no significant effect on assemblage composition of spiders in orchards were annual rainfall; the percentages of surrounding semi-natural (non-crop) habitat; and of orchards, orchard elevation, age, area, percent of annual plant cover, plant species richness within the orchard, and insect abundance (Table 2). When combining both significant variables in the CCA, together, they explained 59% of the cumulative variance of the genus–environment relationship on constrained axis 1. Canonical axis 1 in the CCA analysis was positively correlated with the latitude and negatively correlated with the percentage of the surrounding annual crops. Axis 2 represents the nine unconstrained, nonsignificant variables that explain the additional 41% of the cumulative variance of the genus–environment relationship. Axes 1 and 2 together explain only 8.9% of the variance of the genera data (Figure 2a and Table 3). Other axes represent the additional unknown variance in the genera data (Figure 2b and Table 3).
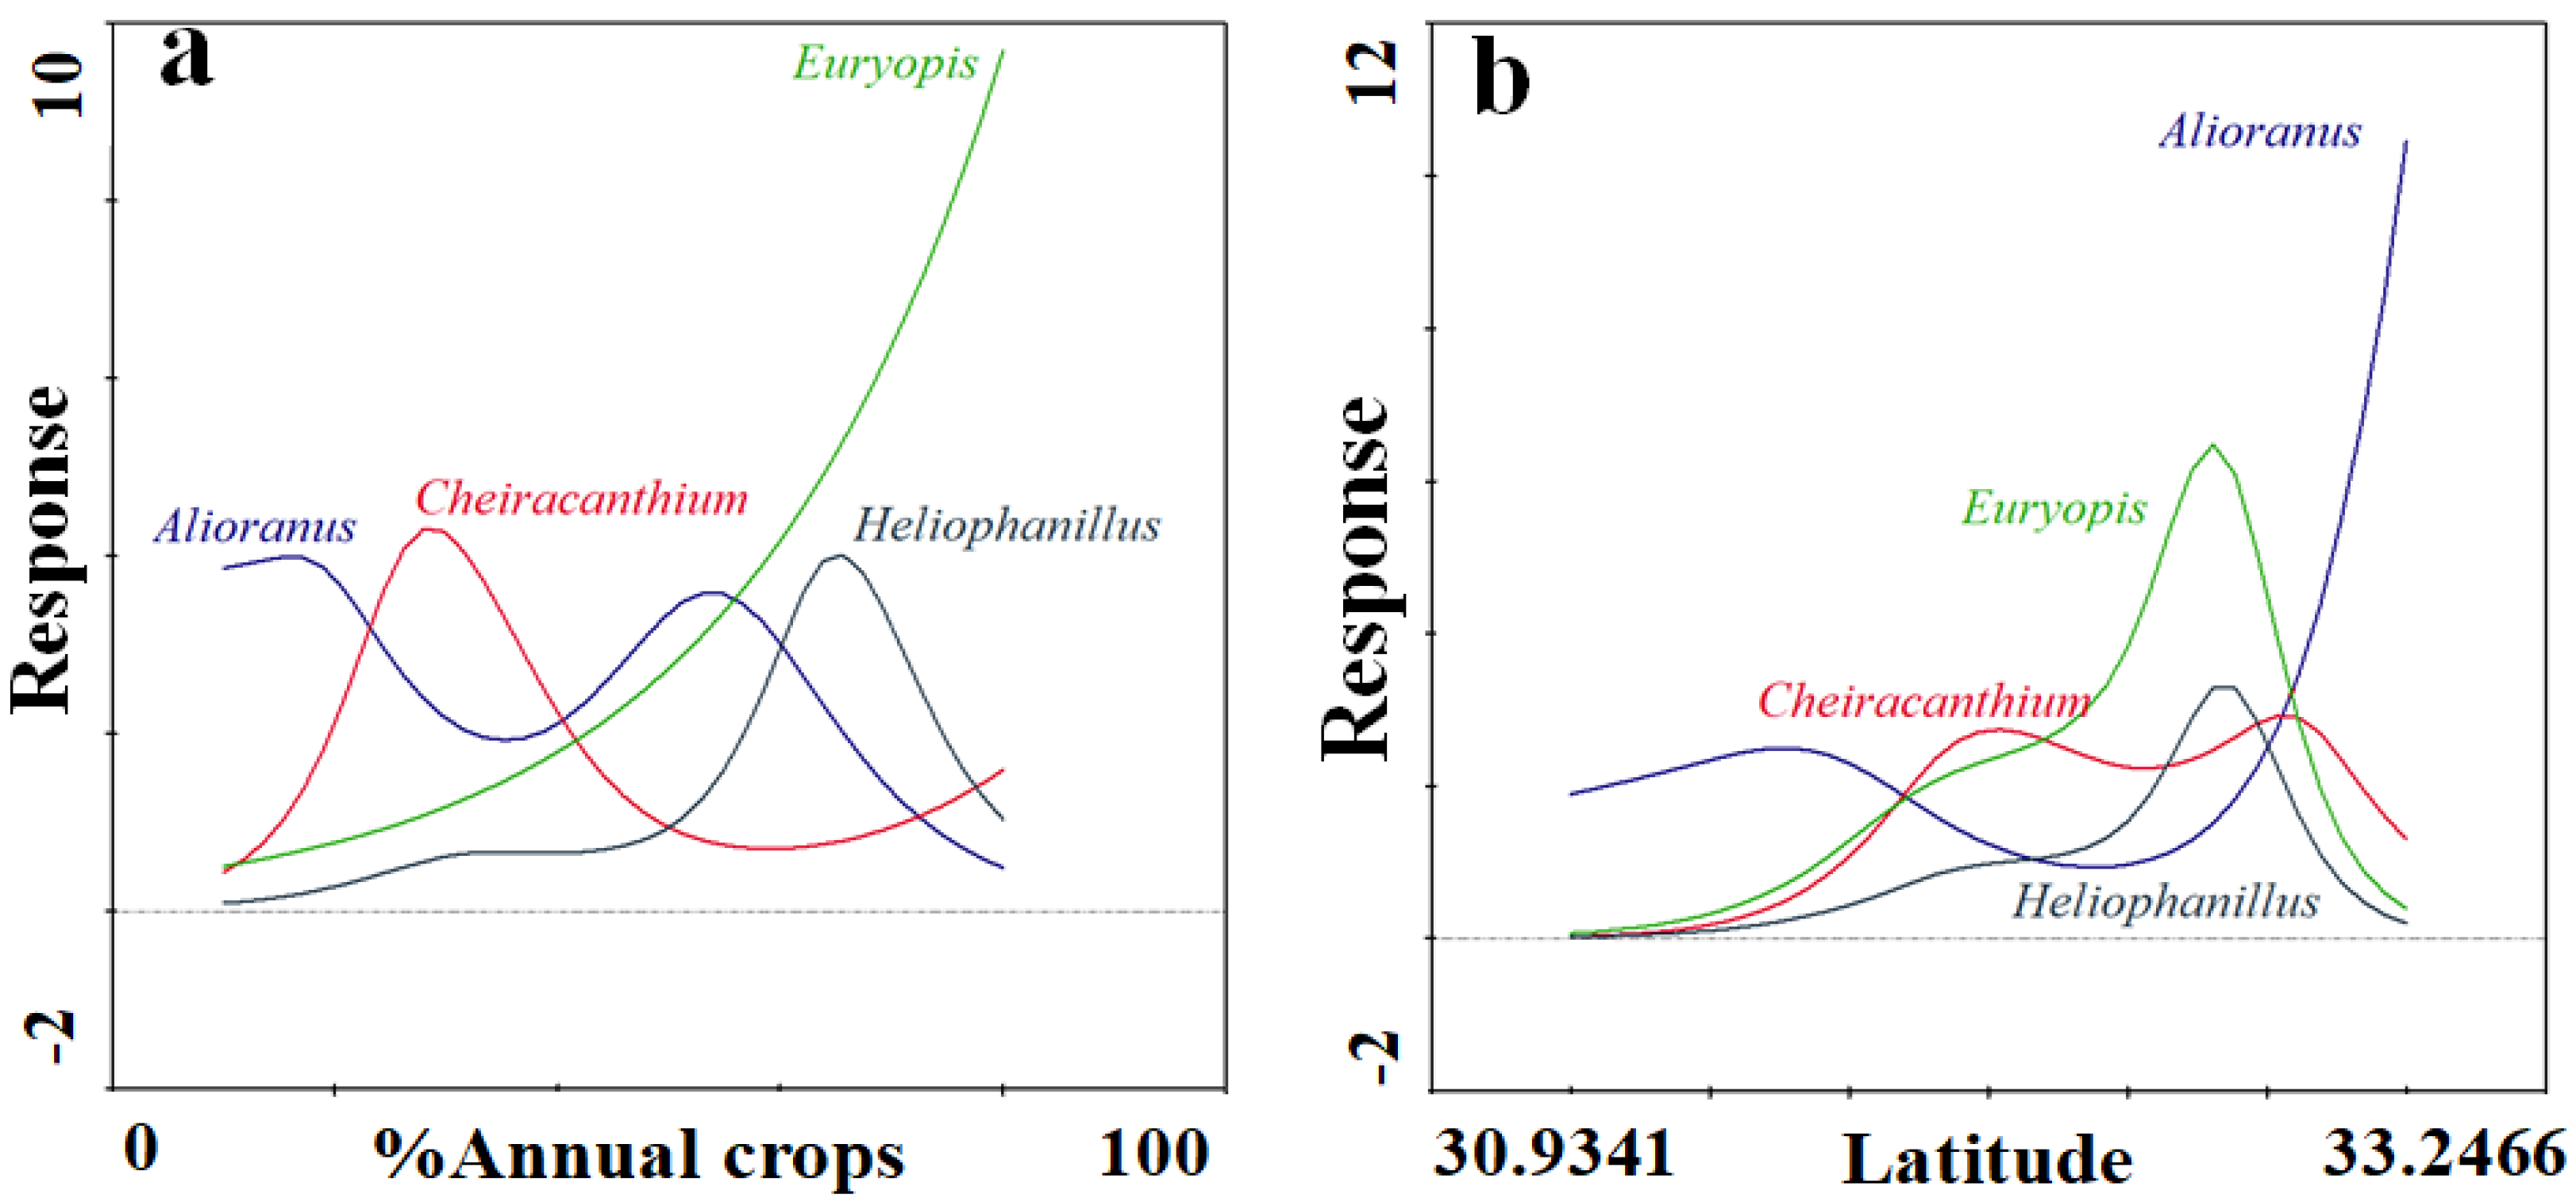
The principal response curves (PRC) analysis summarized the dynamics of the most abundant spider genera in relation to the two significant environmental factors (Figure 3). Cheiracanthium and Alioranus increased at low cover of the surrounding annual crops, while Euryopis and Heliophanus increased at high annual crop cover (Figure 3a). Alioranus has a bimodal distribution with a strong positive response to increasing latitude, while the other species are found more in the intermediate latitudes (Figure 3b).

3.3. Functional Groups

We assigned the spiders to five functional groups based on their hunting strategy (see Methods and Table A2). Out of the 1109 spiders, about a third of the individuals were ‘active hunters’ (303 individuals, 28% of the total sample), dominated by the cheiracanthiid genus Cheiracanthium (n = 146) and the salticid genus Heliophanillus (n = 97). Another third of the individuals 26% were tangled-web weavers (n = 290); this group was dominated by the theridiid genus, Euryopis (reduced web, n = 190). There were 236 sheet-web weavers (21% of the total samples). This group was dominated by the linyphiid genus Alioranus (sheet web, n = 223). In addition, there were 159 ‘ambush hunters’ (14% of the sample). The least abundant functional group was ‘orb weaver’ spiders with 113 individuals (10% of the total sample), dominated by the araneid genus Neoscona Simon 1864 with 85 individuals (8% of the total sample).
Several variables were excluded from the subsequent analysis because of high values of VIF (>10): at the regional scale, rainfall was excluded, and at the landscape scale, the percent surrounding the urban area and the percent surrounding the non-crop area were excluded. High VIF indicates high multicollinearity with the other variables. No significant correlations were found to occur between different functional groups of spiders and any of the variables at the regional and landscape scales, although sheet-web weavers had relatively high positive correlations with latitude and elevation. At the local scale, plant species richness correlated positively with active hunters, ambush hunters, and orb weavers, but only active hunters were significantly correlated with this variable (Holm–Bonferroni adjusted p = 0.01). Plant cover in the orchards similarly correlated positively with these same functional groups and orb-web weavers with insect abundance.

4. Discussion

We expected to find that the spider assemblage composition to be most similar among orchards in the same geographic region. Indeed, orchards clustered significantly based on their geographic location (Figure 1b) and the latitudinal gradient significantly affected the assemblage composition (Table 2 and Figure 2). The hypothesis that the variation in the landscape surrounding each orchard would affect the assemblage composition was partially supported: the proportion of annual crop cover had a negative effect on the spider assemblage (Figure 2), yet none of the other habitat types surrounding the orchard had a significant effect. Likewise, none of the local variables affected the spider assemblage composition. However, the local variables of orchard elevation, insect abundance, and weedy vegetation within the orchards, were positively correlated with some functional groups (Table 4).
The effect of geographic proximity on assemblage composition is likely linked to species pools that differ in climatically different regions [36,37]. A similar conclusion was reached regarding spider assemblages in European pear and apple orchards [18]. Our northernmost orchards (Dishon and Kefar Yuval) are at a higher elevation, with a cool Mediterranean climate. The orchards located in the valleys and along the coastal plain (Giv’at Ada, Hazor, Sede Ya’akov, Givat Hayyim M, and W) share a mesic, coastal climate, while the three inland orchards (Lakhish, Mishmar Ha’Negev, and Zor’a) are at a higher elevation and drier climate. These geographic regions correspond to geomorphologic regions of Israel (upper Galilee, central and southern coastal plain, and Judean hills, respectively), as defined by Klein [38]. In spite of the short distances involved, many spider species appear associated with one or a few regions [39], a pattern that is repeated for other taxa [40]. However, lacking identification to species in our data, we can point only to some genera that are associated with orchards in certain regions. For example, Alioranus and Cheiracanthium occurred in higher abundances in northern orchards, and Euryopis and Heliophanillus in central latitude orchards (Figure 4). By contrast, Philodromus Walckenaer 1826, Thanatus C. L. Koch 1837, Xysticus C. L. Koch 1835, and Steatoda Sundevall 1833 were found in similar abundances across all sites.
The precipitation decreases in Israel from north to south (Table 1). Annual rainfall, however, was not a significant determinant of the spider assemblage composition. The most likely explanation is that all pomegranate orchards are irrigated to a similar moisture level. Precipitation, however, directly affects plant productivity (e.g., [41]) and indirectly insect abundance (potential prey) [42]. While insect abundance was positively correlated with overall spider abundance in this system [16], neither insect abundance nor annual plant cover inside the orchard had a significant direct effect on the spider assemblage composition. Both insects and spiders may have been affected by insecticide spraying, which occurred on many dates throughout the season (see Methods). Whether these applications affected the species differently is unknown. In a study of vineyards in the north of Israel, it was found that the parasitoid wasp abundance recovered to pre-spraying levels within two weeks of spraying [43].
Several studies have shown positive effects of the relative area of surrounding natural and semi-natural habitat in the landscape on the abundance and species richness of spiders in crop fields (e.g., [7,43,44,45,46]). Natural vegetation bordering the pomegranate orchards enhanced the parasitoid abundance and diversity, largely due to the presence of alternative food sources [47]. In our study, no effect of percentage cover of natural and semi-natural habitats near the orchard was detected on the assemblage of spiders. Similarly, within-orchard plant cover and species richness had no effect on the spider assemblage. The lack of a positive effect of semi-natural vegetation both surrounding and within the orchards might have several explanations: First, the area occupied by natural vegetation in the landscape was small in half of the sites (less than 10% in six out of the twelve sites). Second, annuals within the orchards were often removed and, when present, covered on average only 10% of the surface between the trees and contained, on average, six plant species [16]. Third, this habitat, which is architecturally simple, consisted mostly of weedy species that were dry in the summer and may have few spider species in common with the tree-dwelling orchard fauna.
The only landscape-level variable that significantly influenced the spider assemblage composition was the percentage cover of annual crops near the orchards, while other orchards had a weak (non-significant) effect (Table 2). Surrounding crops can provide a suitable habitat with alternative prey for spiders during winter leaf drop in the orchards and a source of recolonizing spiders in the spring. The annual crops in this region were mostly postharvest at the time of sampling, and it was surprising to detect their influence. Following harvest, these habitats become less suitable for most arthropods, and spiders may have migrated from them into the orchards [48]. There was little overlap of spider species between wheat fields and tree plantations in Israel [49,50], but Nardi et al. [3] found an overlap between spider assemblages of vineyards, olive groves, and annual crops (cereals) in Italy.
Spiders can be assigned to functional groups based on different characteristics [21]. For spiders in crop fields, foraging mode and dispersal ability are perhaps the most relevant features [51], the former as it determines the type of prey captured, while the latter influences mobility within and among habitats. As our analysis is at the genus level, we used broad categories of foraging that are common to most members of a genus in our region. Dispersal modes (aerial vs. terrestrial) of different spider species are poorly known [52] and probably are not a genus-level characteristic. An effect of local productivity may be indicated by positive correlations between plant cover and richness within the orchard and the functional groups of hunting spiders and orb-web weavers, as well as between orb-web weavers and insect abundance.
Some active hunters, such as Cheiracanthium, are typically found in the foliage of trees and are considered important natural enemies, for example, in citrus orchards [53] Ambush hunter and orb-web weavers often require particular plant structures that may be more diverse when the plant richness is higher. The sheet-web weavers were all members of the family Linyphiidae; most are found in moist, cool habitats, which may explain the positive correlations with latitude and altitude. The numerically dominant species in the in the entire sample were Alioranus and Euryopis, both of which were found mainly in the trunk refuges [16] and therefore probably forage on the pomegranate trunks. Euryopis are largely ant-feeders, and unlike other theridiids, they do not build capture webs but, rather, hunt from a retreat using sticky silk to trap the ants. The common species locally is E. episinoides (Walckenaer 1847), which has been shown to be an ant specialist [54]. Alioranus pastoralis (O. Pickard-Cambridge 1872) is abundant in cereal crops in Israel and is considered an agrobiont species that feeds on aphids [48]. Its behavior in orchards is unknown.
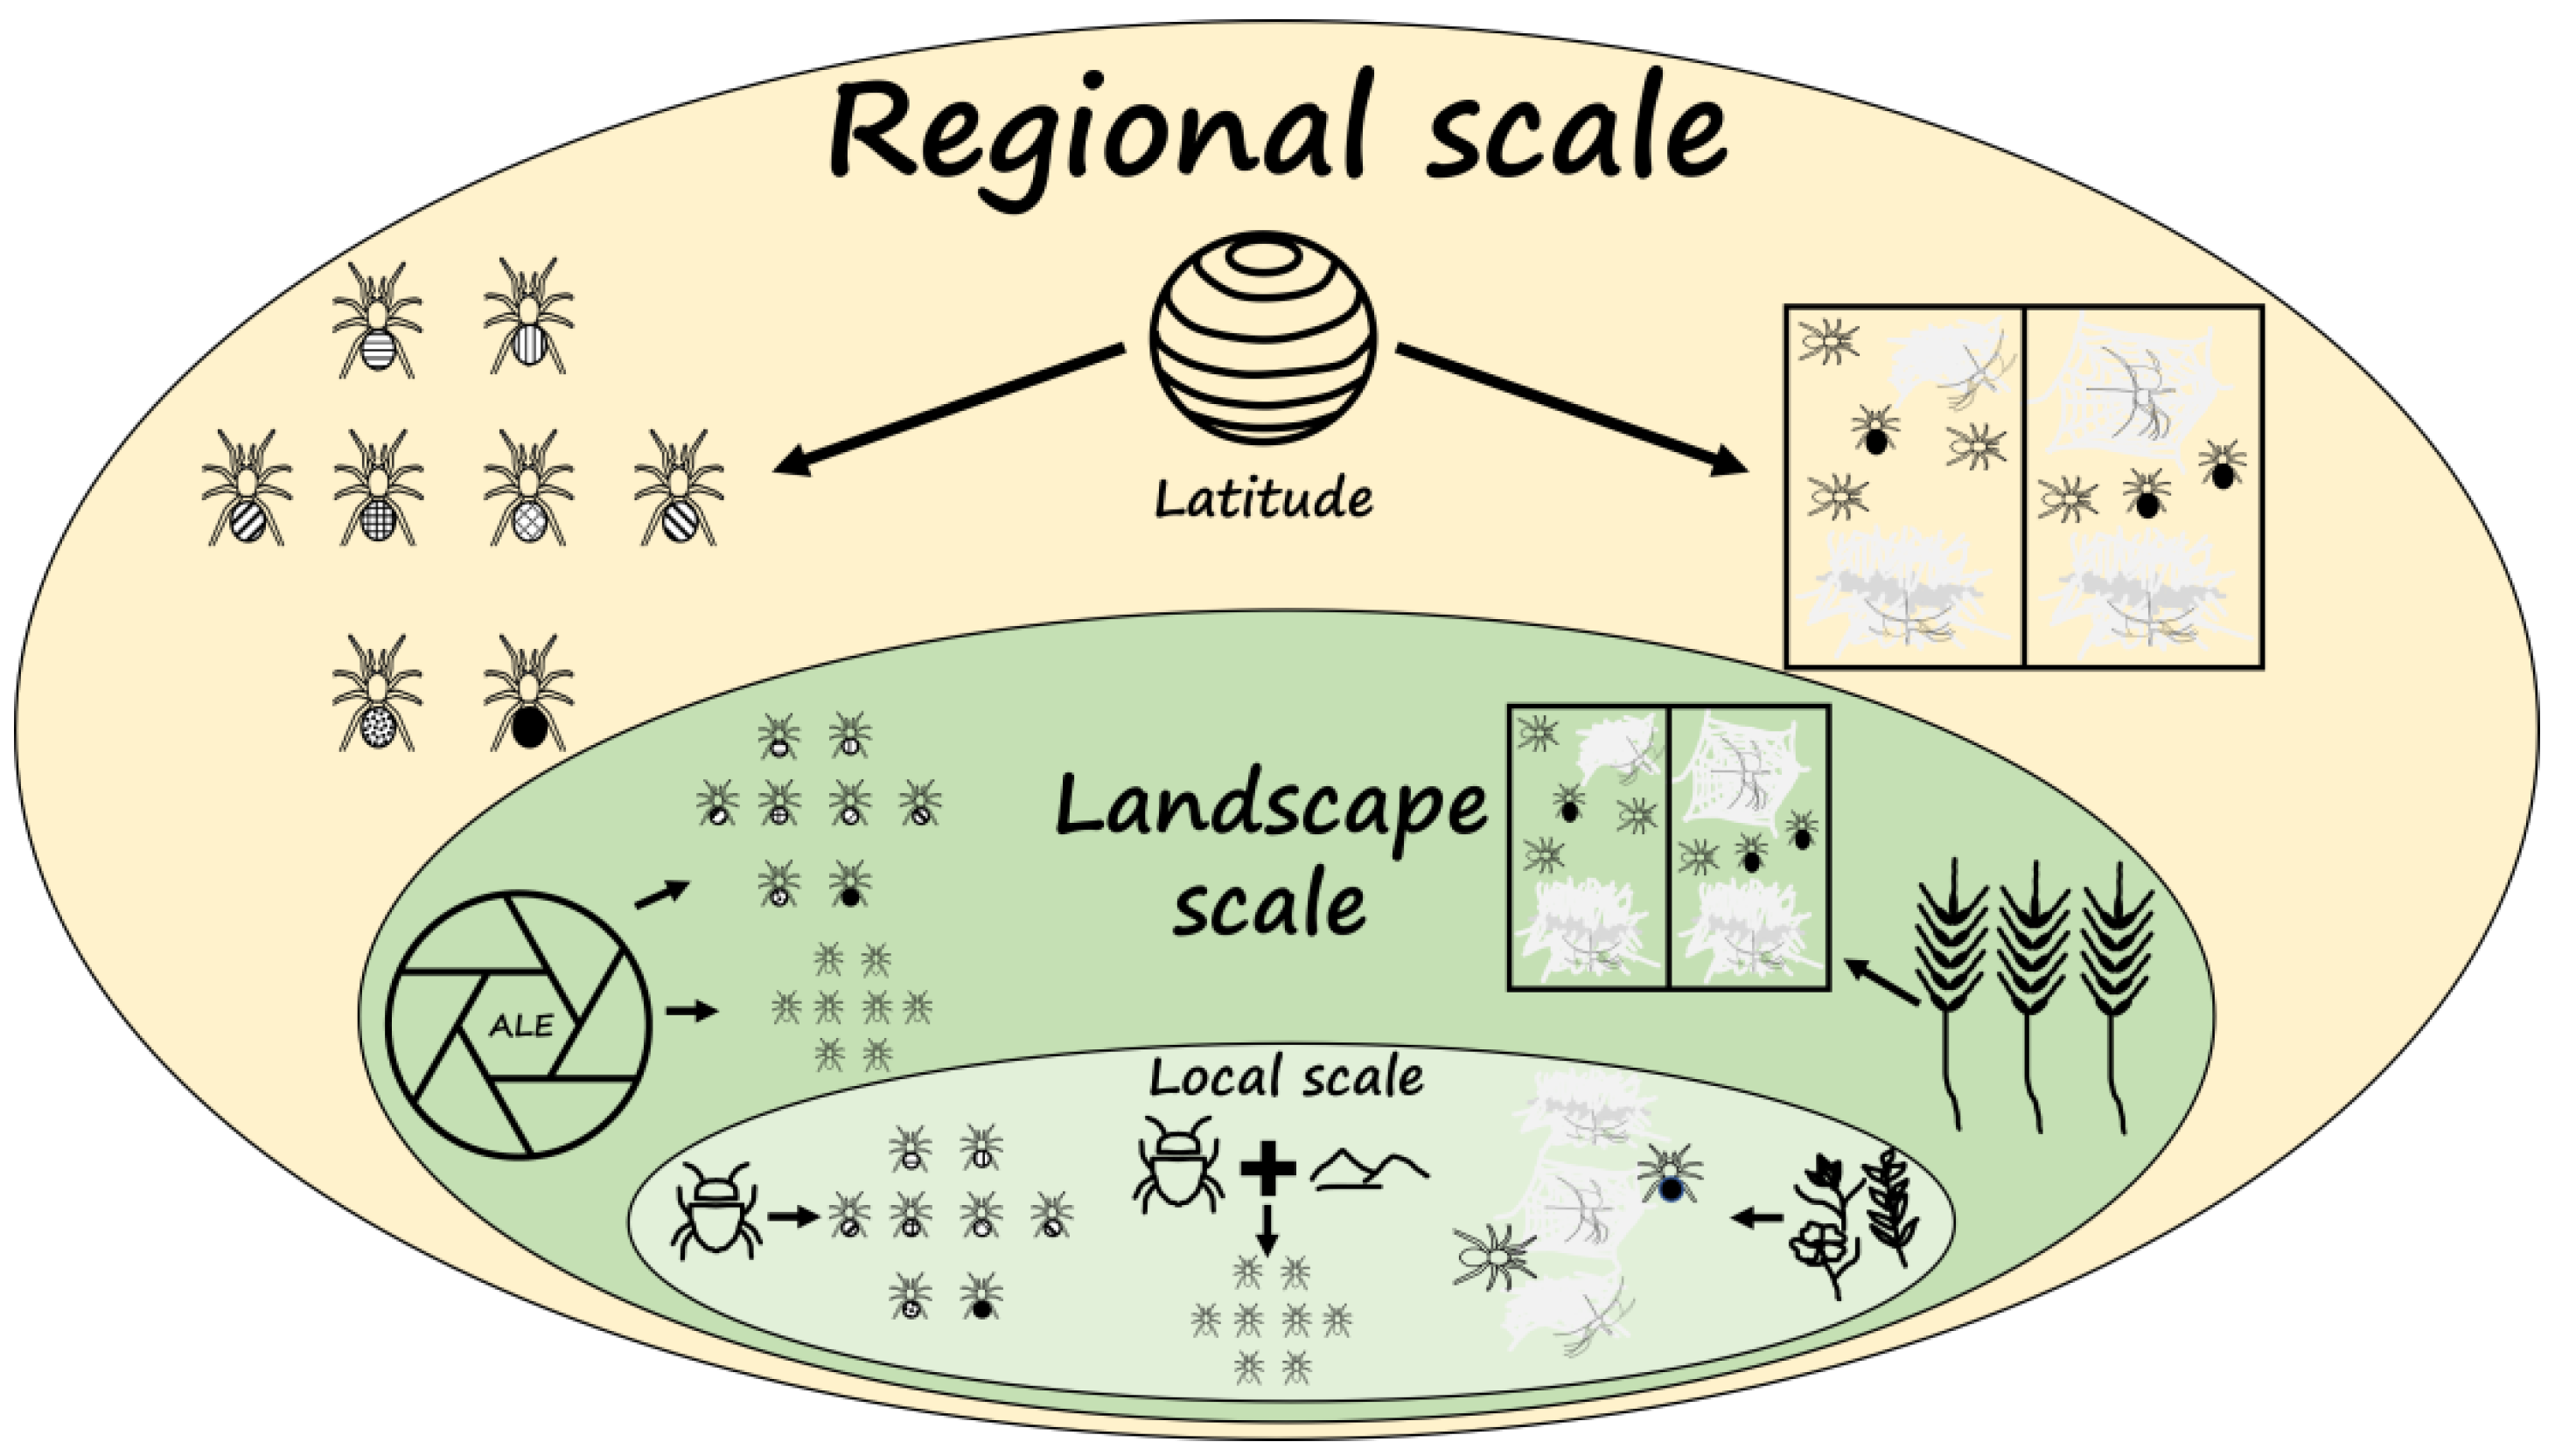
In a companion study, we investigated the effects of environmental variables on the abundance and diversity of spiders in the same twelve orchards [16]. We found that overall spider abundance was positively associated with insect abundance, while spider diversity at the genus level was positively affected by the landscape composition surrounding the orchards (ALE, agricultural landscape evenness). In the current study, we show that the spider assemblage composition, on the whole, responded to a somewhat different set of variables in these spatial scales (Figure 4). Latitude was the one factor that influenced both spider diversity and assemblage composition. This result supports the relevance of regional pools in determining the cooccurrence of different taxa in the orchards. Insect abundance, unsurprisingly, influenced spider abundance, but not diversity or the assemblage composition. The effects of landscape components on the abundance, diversity and assemblage composition are more complex, involving specific habitat effects (e.g., the percent annual crops) and dispersal potential of the landscape (as reflected in the landscape evenness effects on abundance and diversity). To understand the mechanisms underlying the observed patterns of landscape effects would require a more extensive sampling scheme in the adjacent habitats, as well as in the orchards.
Figure 4. Comparison of measures of spider assemblages in twelve pomegranate orchards in Israel in response to environmental variables at the regional, landscape and local scales. Data on abundance and diversity measures are from Salman et al. [16]. Assemblage composition and functional group data are from the present study. Variables with significant effects are shown: At the regional scale, latitude affected the diversity and assemblage composition; at the landscape scale, percent annual crop area affected the assemblage composition, and ALE affected both the abundance and diversity. At the local scale, insect abundance affected the diversity, and the combination of elevation and insect abundance affected the spider abundance; the annual plant cover in the orchards affected the functional groups. ALE = Agricultural Landscape Evenness, a measure of the degree of evenness of percent cover of the four landscape variables.
Agriculture 12 00512 g004

Author Contributions

Conceptualization, Y.L. and E.G.-R.; methodology, all authors; formal analysis, I.N.A.S.; investigation, all authors; resources, Y.L. and E.G.-R.; data curation, I.N.A.S.; writing—original draft preparation, I.N.A.S.; writing—review and editing, all authors; visualization, all authors; project administration, Y.L. and E.G.-R.; funding acquisition, Y.L. and E.G.-R. All authors have read and agreed to the published version of the manuscript.

Funding

The research was funded by grant #131-1793-14 of the Israel Ministry of Agriculture to A. R. Harari, A. Rosenfeld, R. Sharon, T. Keasar, E. Gavish-Regev and Y. Lubin. I.N.A. Salman was supported by the Kreitman Negev-Tzin Fellowship by Ben-Gurion University of the Negev, with partial support by a STEP-GTP fellowship.

Institutional Review Board Statement

Not applicable.

Informed Consent Statement

Not applicable.

Data Availability Statement

The data presented in this study are publicly available via Zenodo (http://doi.org/10.5281/zenodo.6411178).

Acknowledgments

We would like to thank Miriam Kishinevsky for the orchard management information, and the plant cover and diversity data, Arik Rosenfeld for GIS and rainfall data, Iris Musli for assistance in spider identification, Igor Armiach Steinpress for assistance in field work, Shlomi Aharon for map preparation, and Jorge FS Menezes and two anonymous reviewers for going over an earlier version of the manuscript.

Conflicts of Interest

The authors declare no conflict of interest.

Appendix A

Table A1. Median of the four landscape types surrounding each pomegranate orchard, which represent the percent cover within a 1-km radius, and local variables (annual plant cover, insect abundance, and plant species richness). Minimum and maximum values in parentheses.
Landscape Variables Local Variables
Non-CropAnnual CropsOrchardsHuman-DominatedInsect Abundance%Plant CoverPlant Species Richness
Kefar Yuval1.551154.54 (0, 12)17 (4, 30)4 (2, 4)
Dishon4.51920.528 (8, 37)2 (1, 2)3 (3, 3)
Evron02639174 (0, 6)11 (6, 16)5 (3, 7)
Sede Ya’aqov4627759 (16, 213)20 (14, 27)9 (4, 13)
Giv’at ‘Ada375130.542 (17, 71)4 (3, 6)5 (2, 7)
Giv’at Hayyim W.350161113 (7, 39)29 (14, 29)8 (6, 8)
Giv’at Hayyim M.0326317 (3, 13)6 (3, 9)9 (4, 13)
Hazor537269.58 (2, 17)5 (1, 8)8 (6, 10)
Zor’a730207.516 (0, 26)1 (1, 4)4 (3, 4)
Lakhish0131805 (0, 13)0 (0, 0)1 (0, 1)
Mishmar HaNegev2.56010430 (6, 140)15 (2, 15)3 (5, 5)
Be’er Milka8157015 (7, 154)15 (10, 20)3 (2, 3)
Table A2. List of 37 spider genera found in this study and used in the analyses, assigned to families and functional groups.
FamilyGenusFunctional GroupNumber of Individuals
AraneidaeCyclosa Menge, 1866Orb-web weavers15
Cyrtophora Simon, 1864Orb-web weavers2
Larinioides Caporiacco, 1934Orb-web weavers1
Neoscona Simon, 1864Orb-web weavers85
CheiracanthidaeCheiracanthium C. L. Koch, 1839Active hunters147
ClubionidaeClubiona Latreille, 1804Active hunters48
GnaphosidaeAphantaulax Simon, 1878Active hunters8
Micaria Westring, 1851Active hunters6
LinyphiidaeAgyneta Hull, 1911Sheet-web weavers1
Alioranus Simon, 1926Sheet-web weavers223
Frontinellina van Helsdingen, 1969Sheet-web weavers12
Lepthyphantes Menge, 1866Sheet-web weavers1
MiturgidaeZora C. L. Koch, 1847Active hunters1
PhilodromidaePhilodromus Walckenaer, 1826Ambush hunters41
Thanatus C. L. Koch, 1837Ambush hunters56
PisauridaePisaura Simon, 1886Active hunters4
SalticidaeAelurillus Simon, 1885Active hunters3
Heliophanillus Prószyński, 1989Active hunters97
Macaroeris Wunderlich, 1992Active hunters1
Pseudicius Simon, 1885Active hunters8
Salticus Latreille, 1804Active hunters29
Synageles Simon, 1876 Active hunters2
SegestriidaeSegestria Latreille, 1804Tangle-web weavers1
Tetragnathidae Tetragnatha Latreille, 1804Orb-web weavers9
TheridiidaeDipoena Thorell, 1869 Tangle-web weavers2
Euryopis Menge, 1868Tangle-web weavers190
Kochiura Archer, 1950Tangle-web weavers6
Latrodectus Walckenaer, 1805Tangle-web weavers1
Steatoda Sundevall, 1833Tangle-web weavers61
Theridion Walckenaer, 1805Tangle-web weavers30
ThomisidaeOzyptila Simon, 1864Ambush hunters3
Synaema Simon, 1864Ambush hunters2
Thomisus Walckenaer, 1805Ambush hunters2
Xysticus C. L. Koch, 1835Ambush hunters55
Titanoecidae Titanoeca Thorell, 1870Other-web weavers2
Uloboridae Uloborus Latreille, 1806Orb-web weavers1
ZodariidaeZodarion Walckenaer, 1826Active hunters1

References

  1. D’Alberto, C.F.; Hoffmann, A.A.; Thomson, L.J. Limited benefits of non-crop vegetation on spiders in Australian vineyards: Regional or crop differences? BioControl 2012, 57, 541–552. [Google Scholar] [CrossRef]
  2. Gonçalves, F.; Nunes, C.; Carlos, C.; López, Á.; Oliveira, I.; Crespí, A.; Teixeira, B.; Pinto, R.; Costa, C.A.; Torres, L. Do soil management practices affect the activity density, diversity, and stability of soil arthropods in vineyards? Agric. Ecosyst. Environ. 2020, 294, 106863. [Google Scholar] [CrossRef]
  3. Nardi, D.; Lami, F.; Pantini, P.; Marini, L. Using species-habitat networks to inform agricultural landscape management for spiders. Biol. Conserv. 2019, 239, 108275. [Google Scholar] [CrossRef]
  4. Öberg, S. Influence of landscape structure and farming practice on body condition and fecundity of wolf spiders. Basic Appl. Ecol. 2009, 10, 614–621. [Google Scholar] [CrossRef]
  5. Karp, D.S.; Chaplin-Kramer, R.; Meehan, T.D.; Martin, E.A.; DeClerck, F.; Grab, H.; Gratton, C.; Hunt, L.; Larsen, A.E.; Martínez-Salinas, A.; et al. Crop pests and predators exhibit inconsistent responses to surrounding landscape composition. Proc. Natl. Acad. Sci. USA 2018, 115, E7863–E7870. [Google Scholar] [CrossRef] [Green Version]
  6. Martin, E.A.; Seo, B.; Park, C.R.; Reineking, B.; Steffan-Dewenter, I. Scale-dependent effects of landscape composition and configuration on natural enemy diversity, crop herbivory, and yields. Ecol. Appl. 2016, 26, 448–462. [Google Scholar] [CrossRef] [PubMed]
  7. Shackelford, G.; Steward, P.R.; Benton, T.G.; Kunin, W.E.; Potts, S.G.; Biesmeijer, J.C.; Sait, S.M. Comparison of pollinators and natural enemies: A meta-analysis of landscape and local effects on abundance and richness in crops. Biol. Rev. 2013, 88, 1002–1021. [Google Scholar] [CrossRef] [PubMed]
  8. Bianchi, F.J.; Booij, C.J.H.; Tscharntke, T. Sustainable pest regulation in agricultural landscapes: A review on landscape composition, biodiversity and natural pest control. Proc. R. Soc. B Biol. Sci. 2006, 273, 1715–1727. [Google Scholar] [CrossRef] [Green Version]
  9. Lu, Z.X.; Zhu, P.Y.; Gurr, G.M.; Zheng, X.S.; Read, D.M.; Heong, K.L.; Yang, Y.J.; Xu, H.X. Mechanisms for flowering plants to benefit arthropod natural enemies of insect pests: Prospects for enhanced use in agriculture. Insect Sci. 2014, 21, 1–12. [Google Scholar] [CrossRef] [Green Version]
  10. Shapira, I.; Gavish-Regev, E.; Sharon, R.; Harari, A.R.; Kishinevsky, M.; Keasar, T. Habitat use by crop pests and natural enemies in a Mediterranean vineyard agroecosystem. Agric. Ecosyst. Environ. 2018, 267, 109–118. [Google Scholar] [CrossRef]
  11. Thomson, L.J.; Hoffmann, A.A. Natural enemy responses and pest control: Importance of local vegetation. Biol. Control. 2010, 52, 160–166. [Google Scholar] [CrossRef]
  12. Sackett, T.E.; Buddle, C.M.; Vincent, C. Comparisons of the composition of foliage-dwelling spider assemblages in apple orchards and adjacent deciduous forest. Can. Entomol. 2008, 140, 338–347. [Google Scholar] [CrossRef]
  13. Lefebvre, M.; Franck, P.; Toubon, J.F.; Bouvier, J.C.; Lavigne, C. The impact of landscape composition on the occurrence of a canopy dwelling spider depends on orchard management. Agric. Ecosyst. Environ. 2016, 215, 20–29. [Google Scholar] [CrossRef]
  14. Chaplin-Kramer, R.; O’Rourke, M.E.; Blitzer, E.J.; Kremen, C. A meta-analysis of crop pest and natural enemy response to landscape complexity. Ecol. Lett. 2011, 14, 922–932. [Google Scholar] [CrossRef] [PubMed]
  15. Isaia, M.; Bona, F.; Badino, G. Influence of landscape diversity and agricultural practices on spider assemblage in Italian vineyards of Langa Astigiana (Northwest Italy). Environ. Entomol. 2006, 35, 297–307. [Google Scholar] [CrossRef] [Green Version]
  16. Salman, I.N.; Gavish-Regev, E.; Saltz, D.; Lubin, Y. The agricultural landscape matters: Spider diversity and abundance in pomegranate orchards as a case study. BioControl 2019, 64, 583–593. [Google Scholar] [CrossRef]
  17. Clough, Y.; Kruess, A.; Kleijn, D.; Tscharntke, T. Spider diversity in cereal fields: Comparing factors at local, landscape and regional scales. J. Biogeogr. 2005, 32, 2007–2014. [Google Scholar] [CrossRef]
  18. Bogya, S.; Markó, V.; Szinetár, C.S. Comparison of pome fruit orchard inhabiting spider assemblages at different geographical scales. Agric. For. Entomol. 1999, 1, 261–269. [Google Scholar] [CrossRef]
  19. Sanders, D.; Vogel, E.; Knop, E. Individual and species-specific traits explain niche size and functional role in spiders as generalist predators. J. Anim. Ecol. 2015, 84, 134–142. [Google Scholar] [CrossRef]
  20. Uetz, G.W. Foraging strategies of spiders. Trends Ecol. Evol. 1992, 7, 155–159. [Google Scholar] [CrossRef]
  21. Uetz, G.W.; Halaj, J.; Cady, A.B. Guild structure of spiders in major crops. J. Arachnol. 1999, 27, 270–280. [Google Scholar]
  22. Cardoso, P.; Pekár, S.; Jocqué, R.; Coddington, J.A. Global patterns of guild composition and functional diversity of spiders. PLoS ONE 2011, 6, e21710. [Google Scholar] [CrossRef] [PubMed] [Green Version]
  23. Michalko, R.; Pekár, S.; Entling, M.H. An updated perspective on spiders as generalist predators in biological control. Oecologia 2019, 189, 21–36. [Google Scholar] [CrossRef] [PubMed]
  24. Marc, P.; Canard, A. Maintaining spider biodiversity in agroecosystems as a tool in pest control. Agric. Ecosyst. Environ. 1997, 62, 229–235. [Google Scholar] [CrossRef]
  25. Özturk, N.; Danisman, T.; Tufekli, M.; Ulusoy, M.R. Spider fauna of pomegranate and olive orchards in the Eastern Mediterranean Region of Turkey. Türk. Entomol. Bült. 2013, 3, 67–73. [Google Scholar]
  26. Salman, I.N.; Ferrante, M.; Möller, D.M.; Gavish-Regev, E.; Lubin, Y. Trunk refugia: A simple, inexpensive method for sampling tree trunk arthropods. J. Insect Sci. 2020, 20, 5. [Google Scholar] [CrossRef]
  27. World Spider Catalog. World Spider Catalog. Version 23.0. Natural History Museum Bern. 2022. Available online: http://wsc.nmbe.ch (accessed on 19 January 2022).
  28. Cardoso, P.; Silva, I.; de Oliveira, N.G.; Serrano, A.R. Indicator taxa of spider (Araneae) diversity and their efficiency in conservation. Biolog. Conserv. 2004, 120, 517–524. [Google Scholar] [CrossRef]
  29. Kindt, R.; Coe, R. Tree Diversity Analysis: A Manual and Software for Common Statistical Methods for Ecological and Biodiversity Studies; World Agroforestry Centre: Nairobi, Kenya, 2005. [Google Scholar]
  30. Braak, C.T.; Šmilauer, P. CANOCO Reference Manual and CanoDraw for Windows User’s Guide: Software for Canonical Community Ordination (Version 4.5); Canoco: Ithaca, NY, USA, 2002. [Google Scholar]
  31. Økland, R.H. Vegetation Ecology: Theory, Methods and Applications with Reference to Fennoscandia. Sommerfeltia; Botanical Garden and Museum, University of Oslo: Oslo, Norway, 1990; Volume 1, pp. 1–238. [Google Scholar]
  32. Lepš, J.; Šmilauer, P. Multivariate Analysis of Ecological Data Using CANOCO; Cambridge University Press: Cambridge, UK, 2003. [Google Scholar]
  33. Wang, M.; Yu, Z.; Liu, Y.; Wu, P.; Axmacher, J.C. Taxon-and functional group-specific responses of ground beetles and spiders to landscape complexity and management intensity in apple orchards of the North China Plain. Agric. Ecosyst. Environ. 2022, 323, 107700. [Google Scholar] [CrossRef]
  34. Picchi, M.S.; Bocci, G.; Petacchi, R.; Entling, M.H. Effects of local and landscape factors on spiders and olive fruit flies. Agric. Ecosyst. Environ. 2016, 222, 138–147. [Google Scholar] [CrossRef]
  35. Rosas-Ramos, N.; Baños-Picón, L.; Tormos, J.; Asís, J.D. Farming system shapes traits and composition of spider assemblages in Mediterranean cherry orchards. PeerJ 2020, 8, e8856. [Google Scholar] [CrossRef] [Green Version]
  36. Ricklefs, R.E.; He, F. Region effects influence local tree species diversity. Proc. Natl. Acad. Sci. USA 2016, 113, 674–679. [Google Scholar] [CrossRef] [PubMed] [Green Version]
  37. Zobel, M. The relative of species pools in determining plant species richness: An alternative explanation of species coexistence? Trends Ecol. Evol. 1997, 12, 266–269. [Google Scholar] [CrossRef]
  38. Klein, M. The geomorphology of Israel. In Monographiae Biologicae; Springer: New York, NY, USA, 1988; Volume 62, pp. 59–78. [Google Scholar]
  39. Zonstein, S.; Marusik, Y.M. Checklist of the spiders (Araneae) of Israel. Zootaxa 2013, 3671, 1–127. [Google Scholar] [CrossRef] [PubMed]
  40. Jimenez-Valverde, A.; Lobo, J.M. Determinants of local spider (Araneidae and Thomisidae) species richness on a regional scale: Climate and altitude vs. habitat structure. Ecol. Ento. 2007, 32, 113–122. [Google Scholar] [CrossRef]
  41. Segev, U.; Kigel, J.; Lubin, Y.; Tielbörger, K. Ant abundance along a productivity gradient: Addressing two conflicting hypotheses. PLoS ONE 2015, 10, e0131314. [Google Scholar] [CrossRef] [Green Version]
  42. Greenstone, M.H. Determinants of web spider species diversity: Vegetation structural diversity vs. prey availability. Oecologia 1984, 62, 299–304. [Google Scholar] [CrossRef]
  43. Schindler, B.; Gavish-Regev, E.; Keasar, T. Parasitoid wasp community dynamics in vineyards following insecticide application. Front. Environ. Sci. 2022, 1–10. [Google Scholar] [CrossRef]
  44. Schmidt, M.H.; Tscharntke, T. The role of perennial habitats for Central European farmland spiders. Agric. Ecosyst. Environ. 2005, 105, 235–242. [Google Scholar] [CrossRef]
  45. Pluess, T.; Opatovsky, I.; Gavish-Regev, E.; Lubin, Y.; Schmidt-Entling, M.H. Non-crop habitats in the landscape enhance spider diversity in wheat fields of a desert agroecosystem. Agric. Ecosyst. Environ. 2010, 137, 68–74. [Google Scholar] [CrossRef]
  46. Gardiner, M.M.; Landis, D.A.; Gratton, C.; DiFonzo, C.D.; O’neal, M.; Chacon, J.M.; Wayo, M.T.; Schmidt, N.P.; Mueller, E.E.; Heimpel, G.E. Landscape diversity enhances biological control of an introduced crop pest in the north-central USA. Ecol. Appl. 2009, 19, 143–154. [Google Scholar] [CrossRef]
  47. Kishinevsky, M.; Keasar, T.; Harari, A.R.; Chiel, E. A comparison of naturally growing vegetation vs. border-planted companion plants for sustaining parasitoids in pomegranate orchards. Agric. Ecosyst. Environ. 2017, 246, 117–123. [Google Scholar] [CrossRef]
  48. Opatovsky, I.; Chapman, E.G.; Weintraub, P.G.; Lubin, Y.; Harwood, J.D. Molecular characterization of the differential role of immigrant and agrobiont generalist predators in pest suppression. Biol. Cont. 2012, 63, 25–30. [Google Scholar] [CrossRef]
  49. Opatovsky, I.; Weintraub, P.G.; Musli, I.; Lubin, Y. Use of alternative habitats by spiders in a desert agroecosystem. J. Arachnol. 2017, 45, 129–138. [Google Scholar] [CrossRef]
  50. Herrmann, J.D.; Opatovsky, I.; Lubin, Y.; Pluess, T.; Gavish-Regev, E.; Entling, M.H. Effects of non-native Eucalyptus plantations on epigeal spider communities in the northern Negev desert, Israel. J. Arachnol. 2015, 43, 101–106. [Google Scholar] [CrossRef]
  51. Gavish-Regev, E.; Lubin, Y.; Coll, M. Migration patterns and functional groups of spiders in a desert agroecosystem. Ecol. Entomol. 2008, 33, 202–212. [Google Scholar] [CrossRef]
  52. Bishop, L.; Riechert, S.E. Spider colonization of agroecosystems: Mode and source. Environ. Entomol. 1990, 19, 1738–1745. [Google Scholar] [CrossRef]
  53. Mansour, F.; Whitecomb, W.H. The spiders of a citrus grove in Israel and their role as biocontrol agents of Ceroplastes floridensis [Homoptera: Coccidae]. Entomophaga 1986, 31, 269–276. [Google Scholar] [CrossRef]
  54. Líznarová, E.; Pekár, S. Trophic niche and capture efficacy of an ant-eating spider, Euryopis episinoides (Araneae: Theridiidae). J. Arachnol. 2019, 47, 45–51. [Google Scholar] [CrossRef]
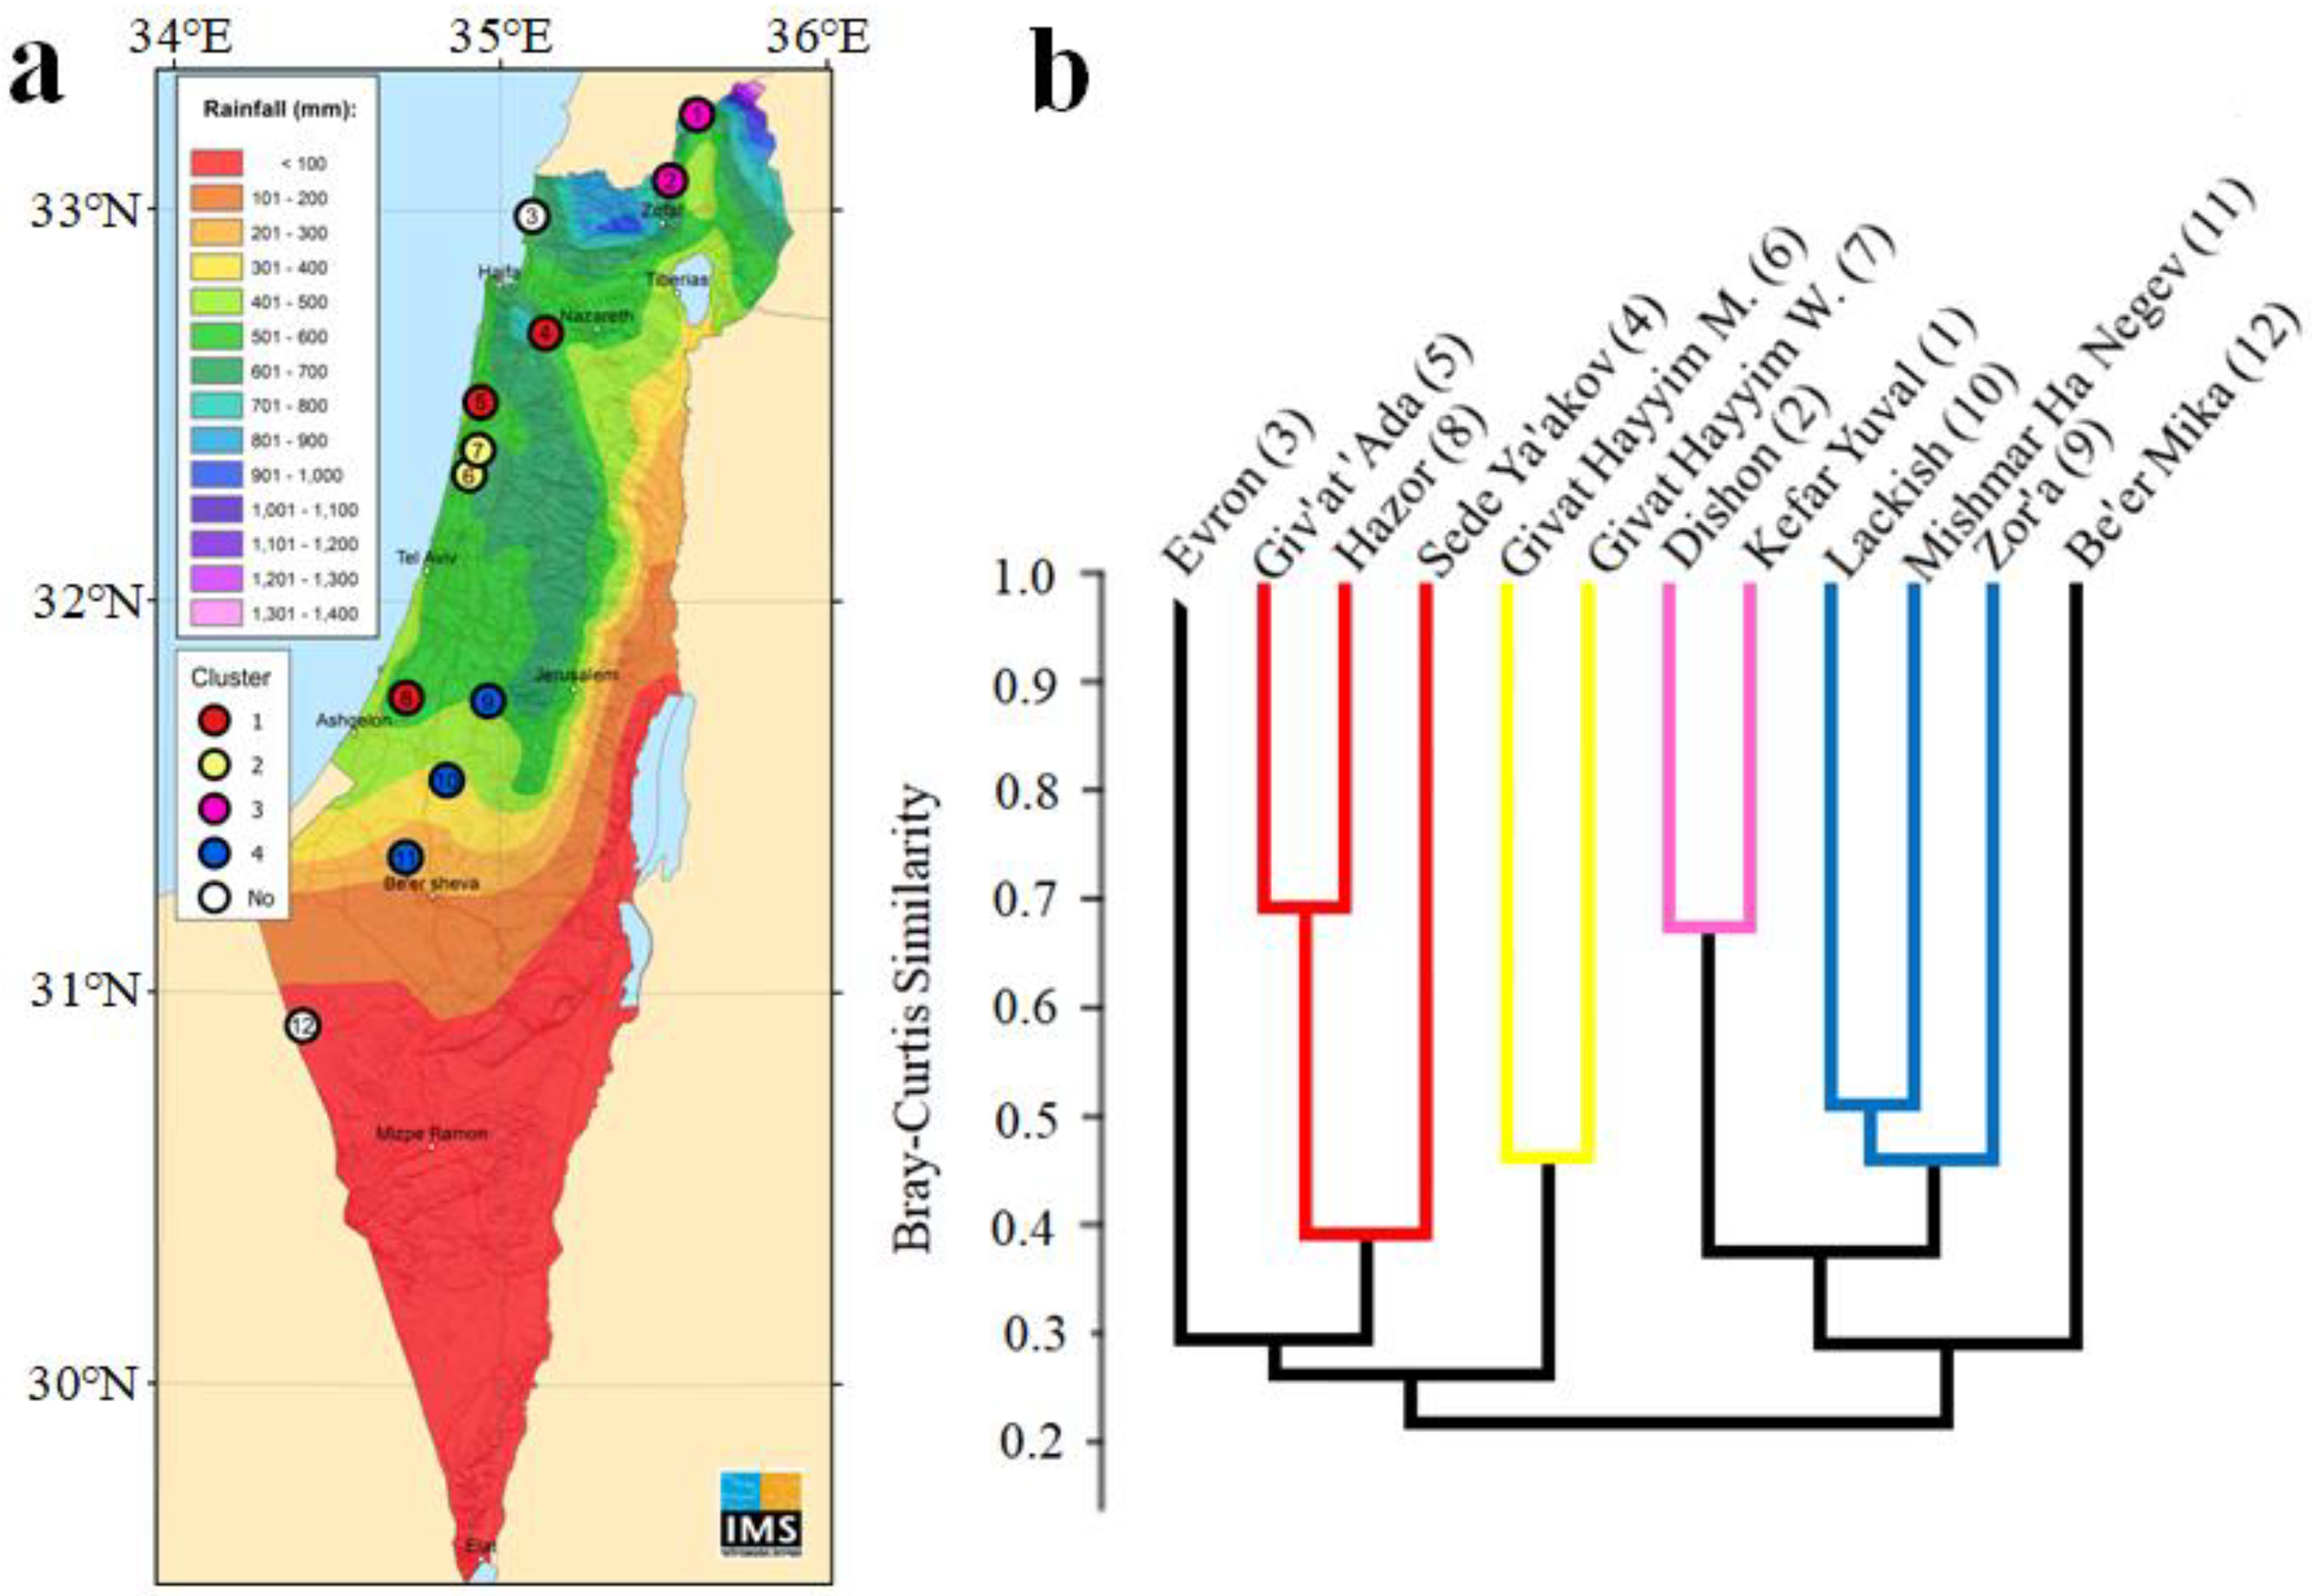
Figure 1. Study sites, their geographical locations and spider assemblage similarities. Sites are numbered on the map (Figure 1a) and in parentheses in Figure 1b. (a) Map of Israel rainfall, with the 12 pomegranate orchards (study sites) colored according to the four Bray–Curtis clusters shown in Figure 1b. (b) Cluster analysis based on Bray–Curtis similarity index of spider assemblages in the 12 sites. Sites that cluster together are shown on the map (a) as circles and in the dendrogram (b) as lines with colors: cluster A—red, B—yellow, C—pink, and D—blue. Two sites that are not clustered with any other sites are shown as white circles and black lines. The map of Figure 1a is adapted with permission from the Israel Metrological Services (IMS).
Agriculture 12 00512 g001
Figure 2. Ordination diagrams from the CCA analysis representing the spider genera that constitute 1% or more of the abundance data from 12 pomegranate orchards. (a) Biplot (genera–environment) ordination diagram of the first and second axes, and (b) biplot (genera–environment) ordination diagram of the first and third axes. The quantitative environmental variables are the latitude and the percent of surrounding annual crops and are marked with red arrows. Spider genera are marked with black stars.
Agriculture 12 00512 g002
Figure 3. Response curves of the most abundant spider genera. Only significant relationships are presented and fitted using generalized additive models (GAM): (a) response curve for the percent of surrounding annual crops and (b) response curve for latitude.
Agriculture 12 00512 g003
Table 1. The 12 pomegranate orchards used in this study, and the geographic location (listed from north to south), orchard age, elevation, and the mean annual rainfall in the vicinity of each orchard are provided. Rainfall data provided by A. Rosenfeld. The site numbers refer to the numbers on Figure 1.
Site
Number
LocationYear Planted (Age at 2015)Latitude (N)Longitude (E)Elevation (m)Annual
Rainfall (mm)
1Kefar Yuval2006 (9)33°14′48″35°35′53″185.37690
2Dishon2006 (9)33°4′53″35°31′0″360.3507
3Evron2011 (4)32°59′29″35°6′1″25.26622
4Sede Ya’aqov2001 (14)32°41′48″ 35°8′27″54.03592
5Giv’at ‘Ada2008 (7)32°31′20″34°56′42″28.12617
6Giv’at Hayyim M 2006 (9)32°23’33″34°55’46″35.29603
7Giv’at Hayyim W 2006 (9)32°24’7″34°56’15″15.21617
8Hazor2003 (12)31°46′20″34°43′13″39.15561
9Zor’a2006 (9)31°45′51″34°58′2″188.18484
10Lakhish2006 (9)31°33′42″34°50′34″287.56383
11Mishmar HaNegev2010 (5)31°21′51″34°43′7″178.71277
12Be’er Milka2008 (7)30°55′56″34°24′28″185.75126
Table 2. Partial CCA. The effect of environmental variables on spider genera composition pomegranate orchards along the precipitation gradients. Ordination results. Monte–Carlo permutation tests (4999 runs). λ i is the sum of all canonical eigenvalues; trace is the sum of all eigenvalues; the percent variance explained is the percent of λ i /trace proportion of variance of spider genera explained by the model. Bold represents significant variables (p < 0.05).
Environmental Variables λ i TraceVariance Explained (%)Fp-Value
a.  Regional Scale
Latitude 0.0863.1632.71.850.02
Rainfall0.0443.1211.40.940.50
b.  Landscape scale
Semi-natural habitat0.0673.1452.11.450.10
Annual crops0.0983.1763.12.110.01
Orchards0.0743.1522.41.600.07
c.  Local scale
Age0.0632.9682.11.430.12
Area0.0313.1091.00.670.78
Elevation0.0363.1141.20.780.66
Plant cover0.0493.1261.61.050.38
Plant richness0.0643.1412.01.370.15
Insect abundance0.043.1181.30.860.51
Table 3. CCA ordination results with two significant variables latitude and the percent surrounding of annual crops.
EigenvaluesGenus-Environment CorrelationCumulative Percentage VarianceSum of all Canonical Values
of Generaof Genus-Environment Relation
Axis 10.1090.6653.359.0
Axis 20.0750.5585.6100.00.184
Axis 30.5340.00022.00.0
Axis 40.3240.00032.00.0
Sum of all eigenvalues3.261
Table 4. Correlation coefficients (Spearman Rho) of environmental variables against the pattern of spider functional groups at three spatial scales (significant values in bold).
Environmental VariablesOrb-WebActive HunterAmbush HunterTangle-Web WeaversSheet-Web Weavers
a.  Regional
Latitude−0.150.04−0.010.010.27
b.  Landscape
Annual crops0.180.070.120.12−0.09
Orchards−0.050.100.03−0.06−0.08
c.  Local
Age−0.11−0.10−0.11−0.260.12
Area−0.01−0.070.09−0.06−0.03
Elevation−0.20−0.19−0.06−0.130.30
Plant cover 0.150.150.150.000.08
Plant richness0.320.430.33−0.05−0.17
Insect abundance0.220.080.080.15−0.13
Publisher’s Note: MDPI stays neutral with regard to jurisdictional claims in published maps and institutional affiliations.