Article

Novel 3-D Spacer Textiles to Protect Crops from Insect Infestation and That Enhance Plant Growth

1
Department of Entomology and Plant Pathology, Campus Box 7647, North Carolina State University, 3230 Ligon Street, Raleigh, NC 27695, USA
2
Department of Textile and Apparel, Technology and Management, Wilson College of Textiles, North Carolina State University, Raleigh, NC 27695, USA
3
Department of Forest Biomaterials, College of Natural Resources, North Carolina State University, Raleigh, NC 27695, USA
4
Luna Innovations, 301 1st St. SW, Suite 200, Roanoke, VA 24011, USA
*
Author to whom correspondence should be addressed.
Agriculture 2022, 12(4), 498; https://doi.org/10.3390/agriculture12040498
Submission received: 9 February 2022 / Revised: 23 March 2022 / Accepted: 29 March 2022 / Published: 31 March 2022

Abstract

:
Pesticide-free, 3-D, spacer fabrics (Plant Armor Generation (PA Gen) 1 and 2) were investigated for proof-of-concept as an insect barrier to protect plants and improve plant agronomics for organic farming. The time to 50% penetration (TP50) for tobacco thrips, Frankliniella fusca (Hinds) adults in laboratory Petri dish bioassays was 30 and 175 min for PA Gen 1 and 2, respectively, and 12 min for the control (a commercially available, single layer-crop cover, Proteknet). PA Gen 2 was ≥90% resistant to penetration of unfed caterpillar neonates, Helicoverpa zea (Boddie), while the TP50‘s for Gen 1 and Proteknet were 3.1 and 2.35 h, respectively. In small cage studies, PA Gen 2 covered potted cabbage plants were 100% resistant to penetration by these insects through 10 d after which the study was ended. In small field plot studies for 3 summer months, cabbage plants grew approximately twice as fast when covered versus not covered with Gen 1 and Gen 2 without the need for insecticides or herbicides. This was not observed for the control crop cover. Martindale abrasion tests demonstrated Gen 1 and 2 were at least 6- and 1.8-fold more durable than the control crop cover used. Data are also presented on percentage light, water, air, and water vapor penetration across each textile and operational temperatures and humidity for cabbage plants covered and uncovered in small field plots.

1. Introduction

As the world population and demand for food and fiber increases, the ability to sustainably grow plants is expected to be impeded by climate change, the loss of arable land, and increasing challenges from insects, weeds, and diseases [1,2]. Although integrated pest management (IPM) has contributed to the sustainability of our agricultural (Ag) systems, IPM is still highly dependent on chemical pesticides and transgenic crops engineered with bacterial protein toxins and herbicide resistance [3,4,5]. Resistance to pesticides is a growing challenge [6,7,8,9,10]. Most recently, insect resistance to genetically modified organisms (GMOs) has become a world-wide concern [10,11,12,13].
Public preference is clearly for insect control and food grown without chemical pesticides, and plants that are not genetically engineered [14]. One approach of interest to our group has been taking advantage of applications in the material sciences for pest management. To illustrate the power of this approach in arthropod vector biology and human disease prevention, we developed the non-insecticidal, T (trapping) bed net that was 13 times more efficacious in Africa for killing mosquitoes than a long lasting, insecticide-treated bed net [15]. In another example, non-insecticidal, mosquito bite resistant-textiles and garments were developed that looked like and felt like everyday clothing but prevented blood feeding using only textile structure; prior to this research, insecticides bound to clothing were mostly used to prevent mosquito biting [16].
The use of textiles and physical methods to prevent insect infestations in crops was used before for kiwi [17], apples [18,19], peppers [20], tomatoes [21], cucumbers [22], cabbage [23,24], and spinach [25] and for other applications including greenhouses [26]. The technology was mostly based on size exclusion, similar to how window screening prevents insects from entering a home. A challenge with this approach is the size of the pore needed to exclude small insects like thrips or caterpillar neonates. Small pore sizes reduce sunlight, air and water penetration. However, research studying mosquito biting across clothing [16] found that blocking insect penetration was not limited to just size exclusion. The use of a tortuous path allowed for larger openings across the textile while at the same time excluding insect penetration. We have applied this new knowledge in this paper to examine the use of spacer fabrics as an insect barrier for crop production.

2. Materials and Methods
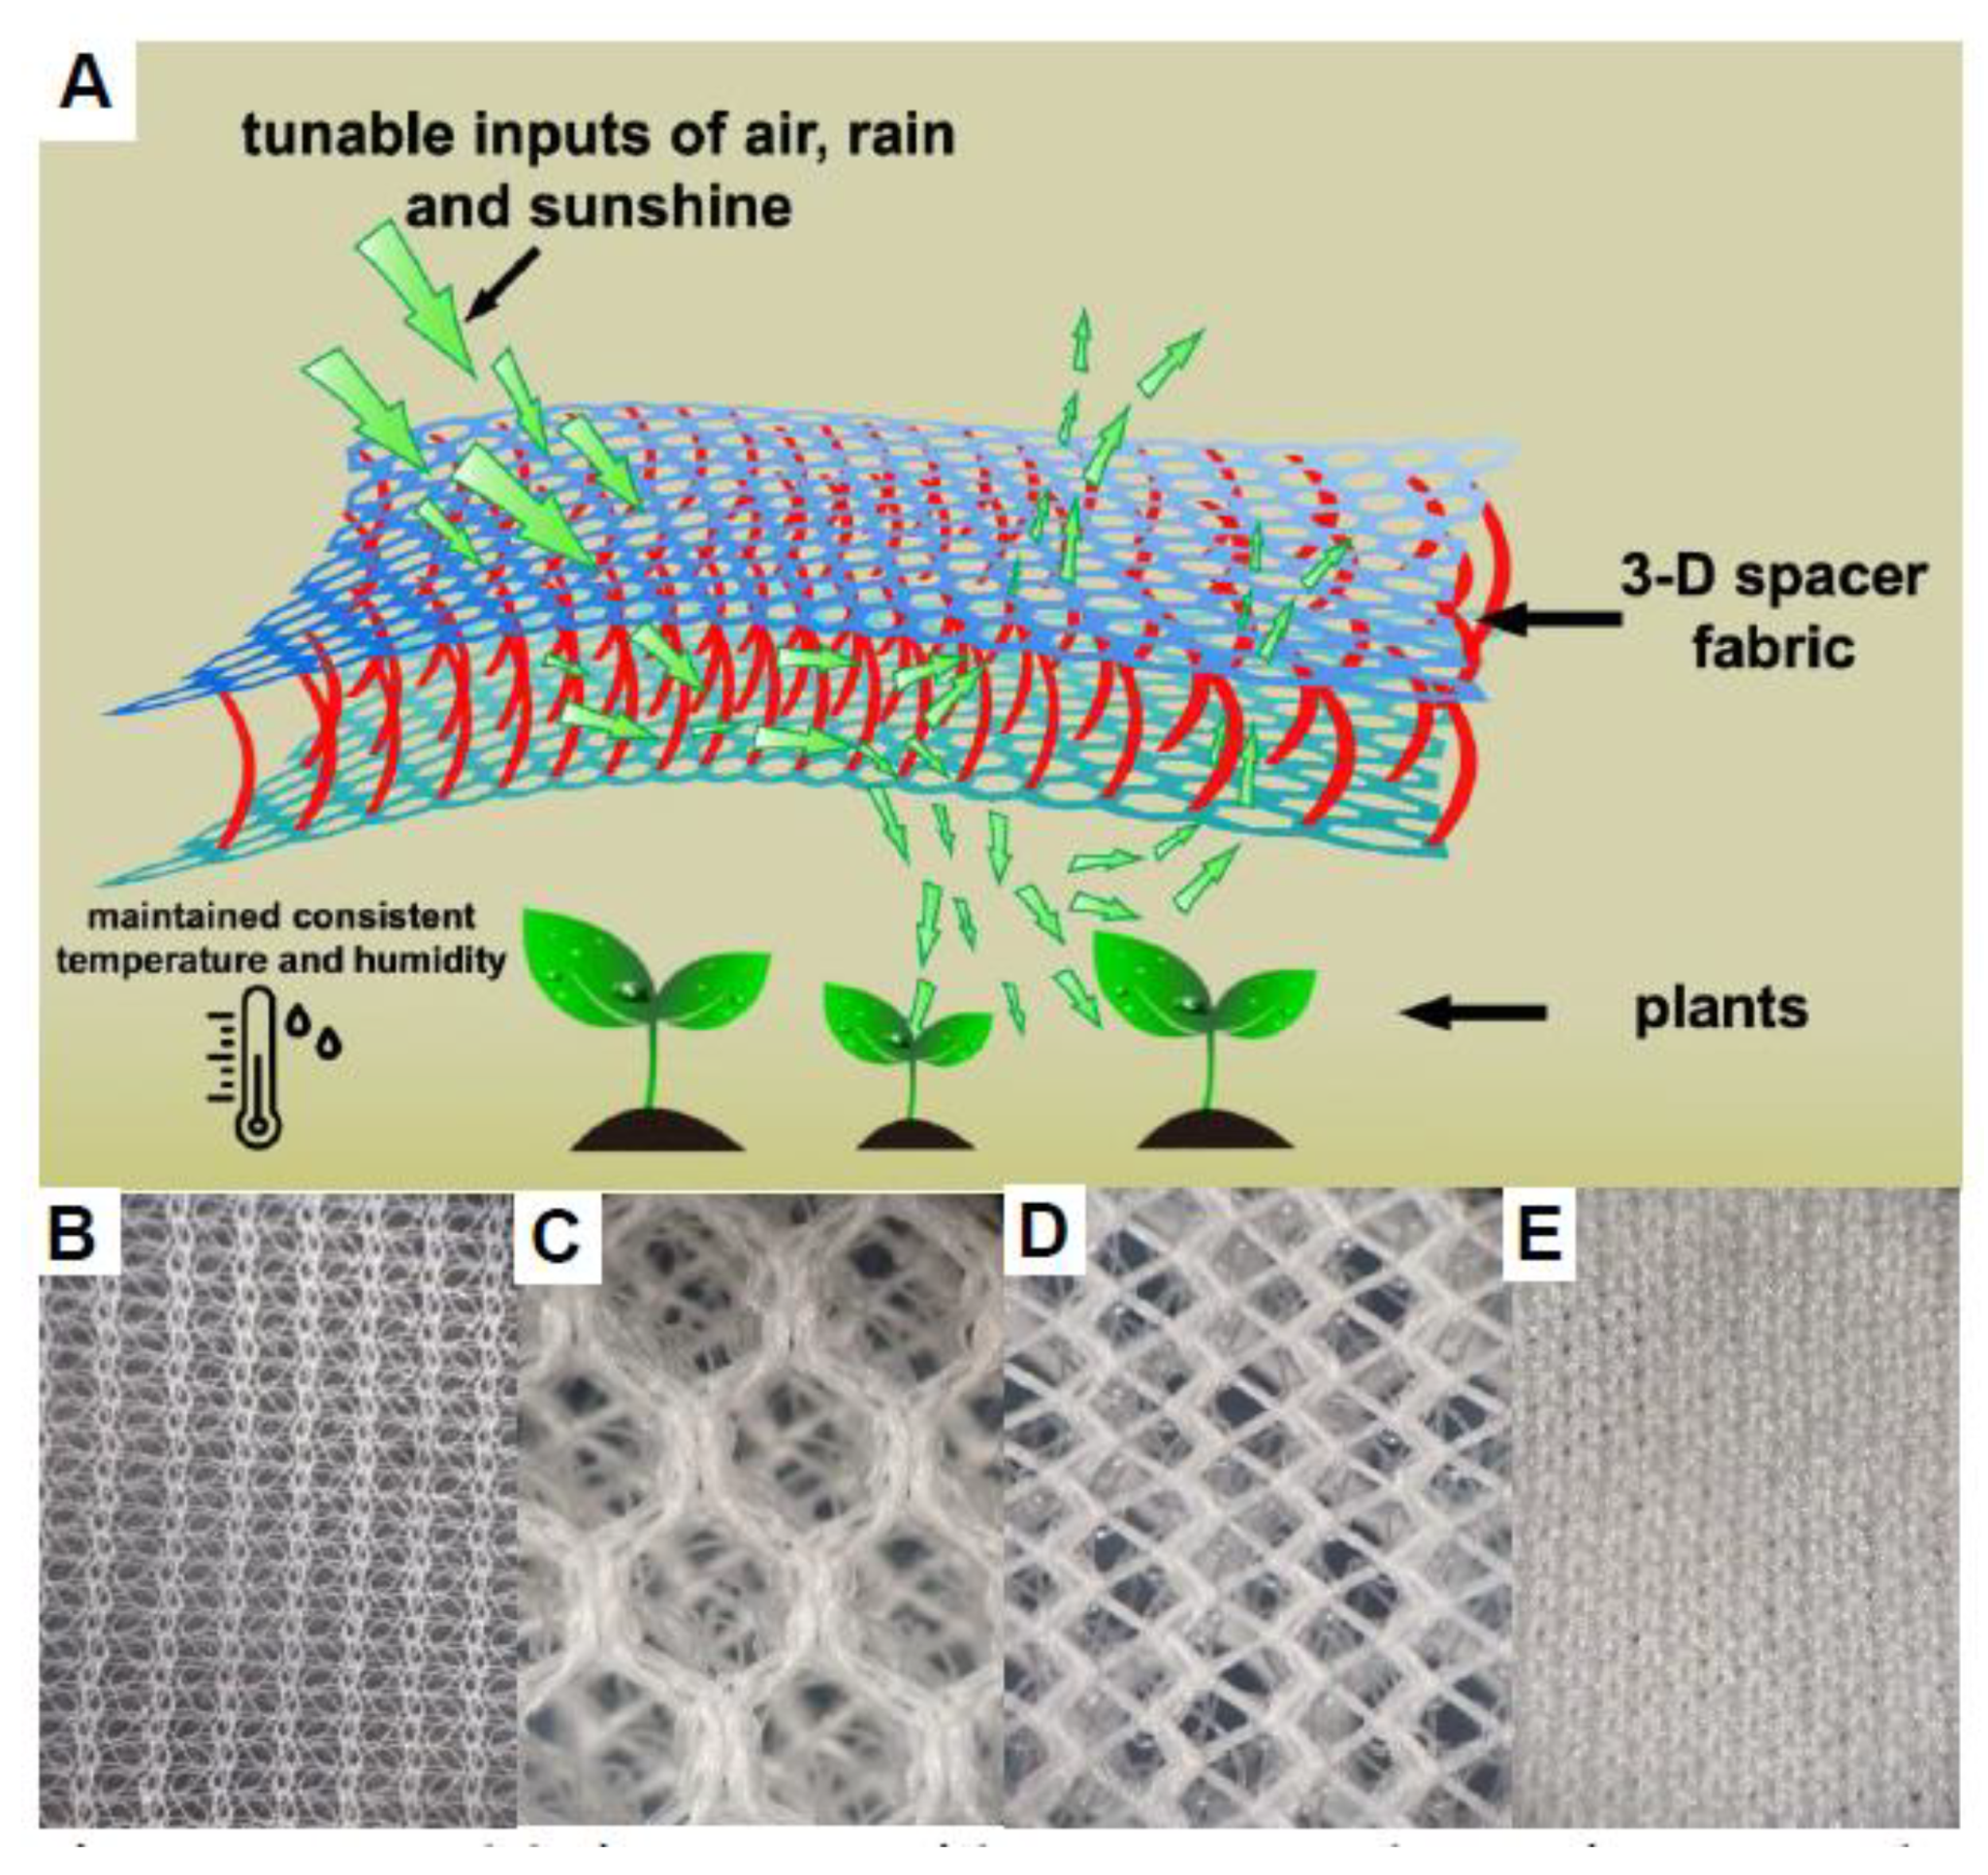
2.1. Textiles

Two spacer (3-D) fabrics, hereafter referred to as Plant Armor, were constructed and evaluated. This knitted fabric consisted of three layers, the outer layers providing a degree of size exclusion separated by an inner, connecting layer that produces a torturous path. Plant Armor Generation (Gen) 1 was constructed with the two outer layers made from a 150-denier dull, polyester multifilament with the inner layer made from a 20-denier polyester monofilament using a MiniTronic 800 warp knitting machine (Rius-Comatex, Saint Joan de Vilatorrada, Barcelona, Span). Plant Armor Gen 2 was constructed using a 70-denier bright polyester, multifilament containing 0.05% titanium dioxide (TiO2) for the outer layers and an inner layer of 9-denier polyester monofilament. The addition of TiO2 to the outer layer protected the filaments from environmental degradation. Gen 2 was constructed on a Jacquard OVJA 106 E 3 wt weft knitting spacer machine (Mayer & Cie, Albstadt Germany) with a diameter of 30 inches and 18 needles per inch gauge. A commercially available crop cover, Proteknet (Dubois Agrinovation, Saint-Remi, Québec, Canada), was evaluated as a positive control.

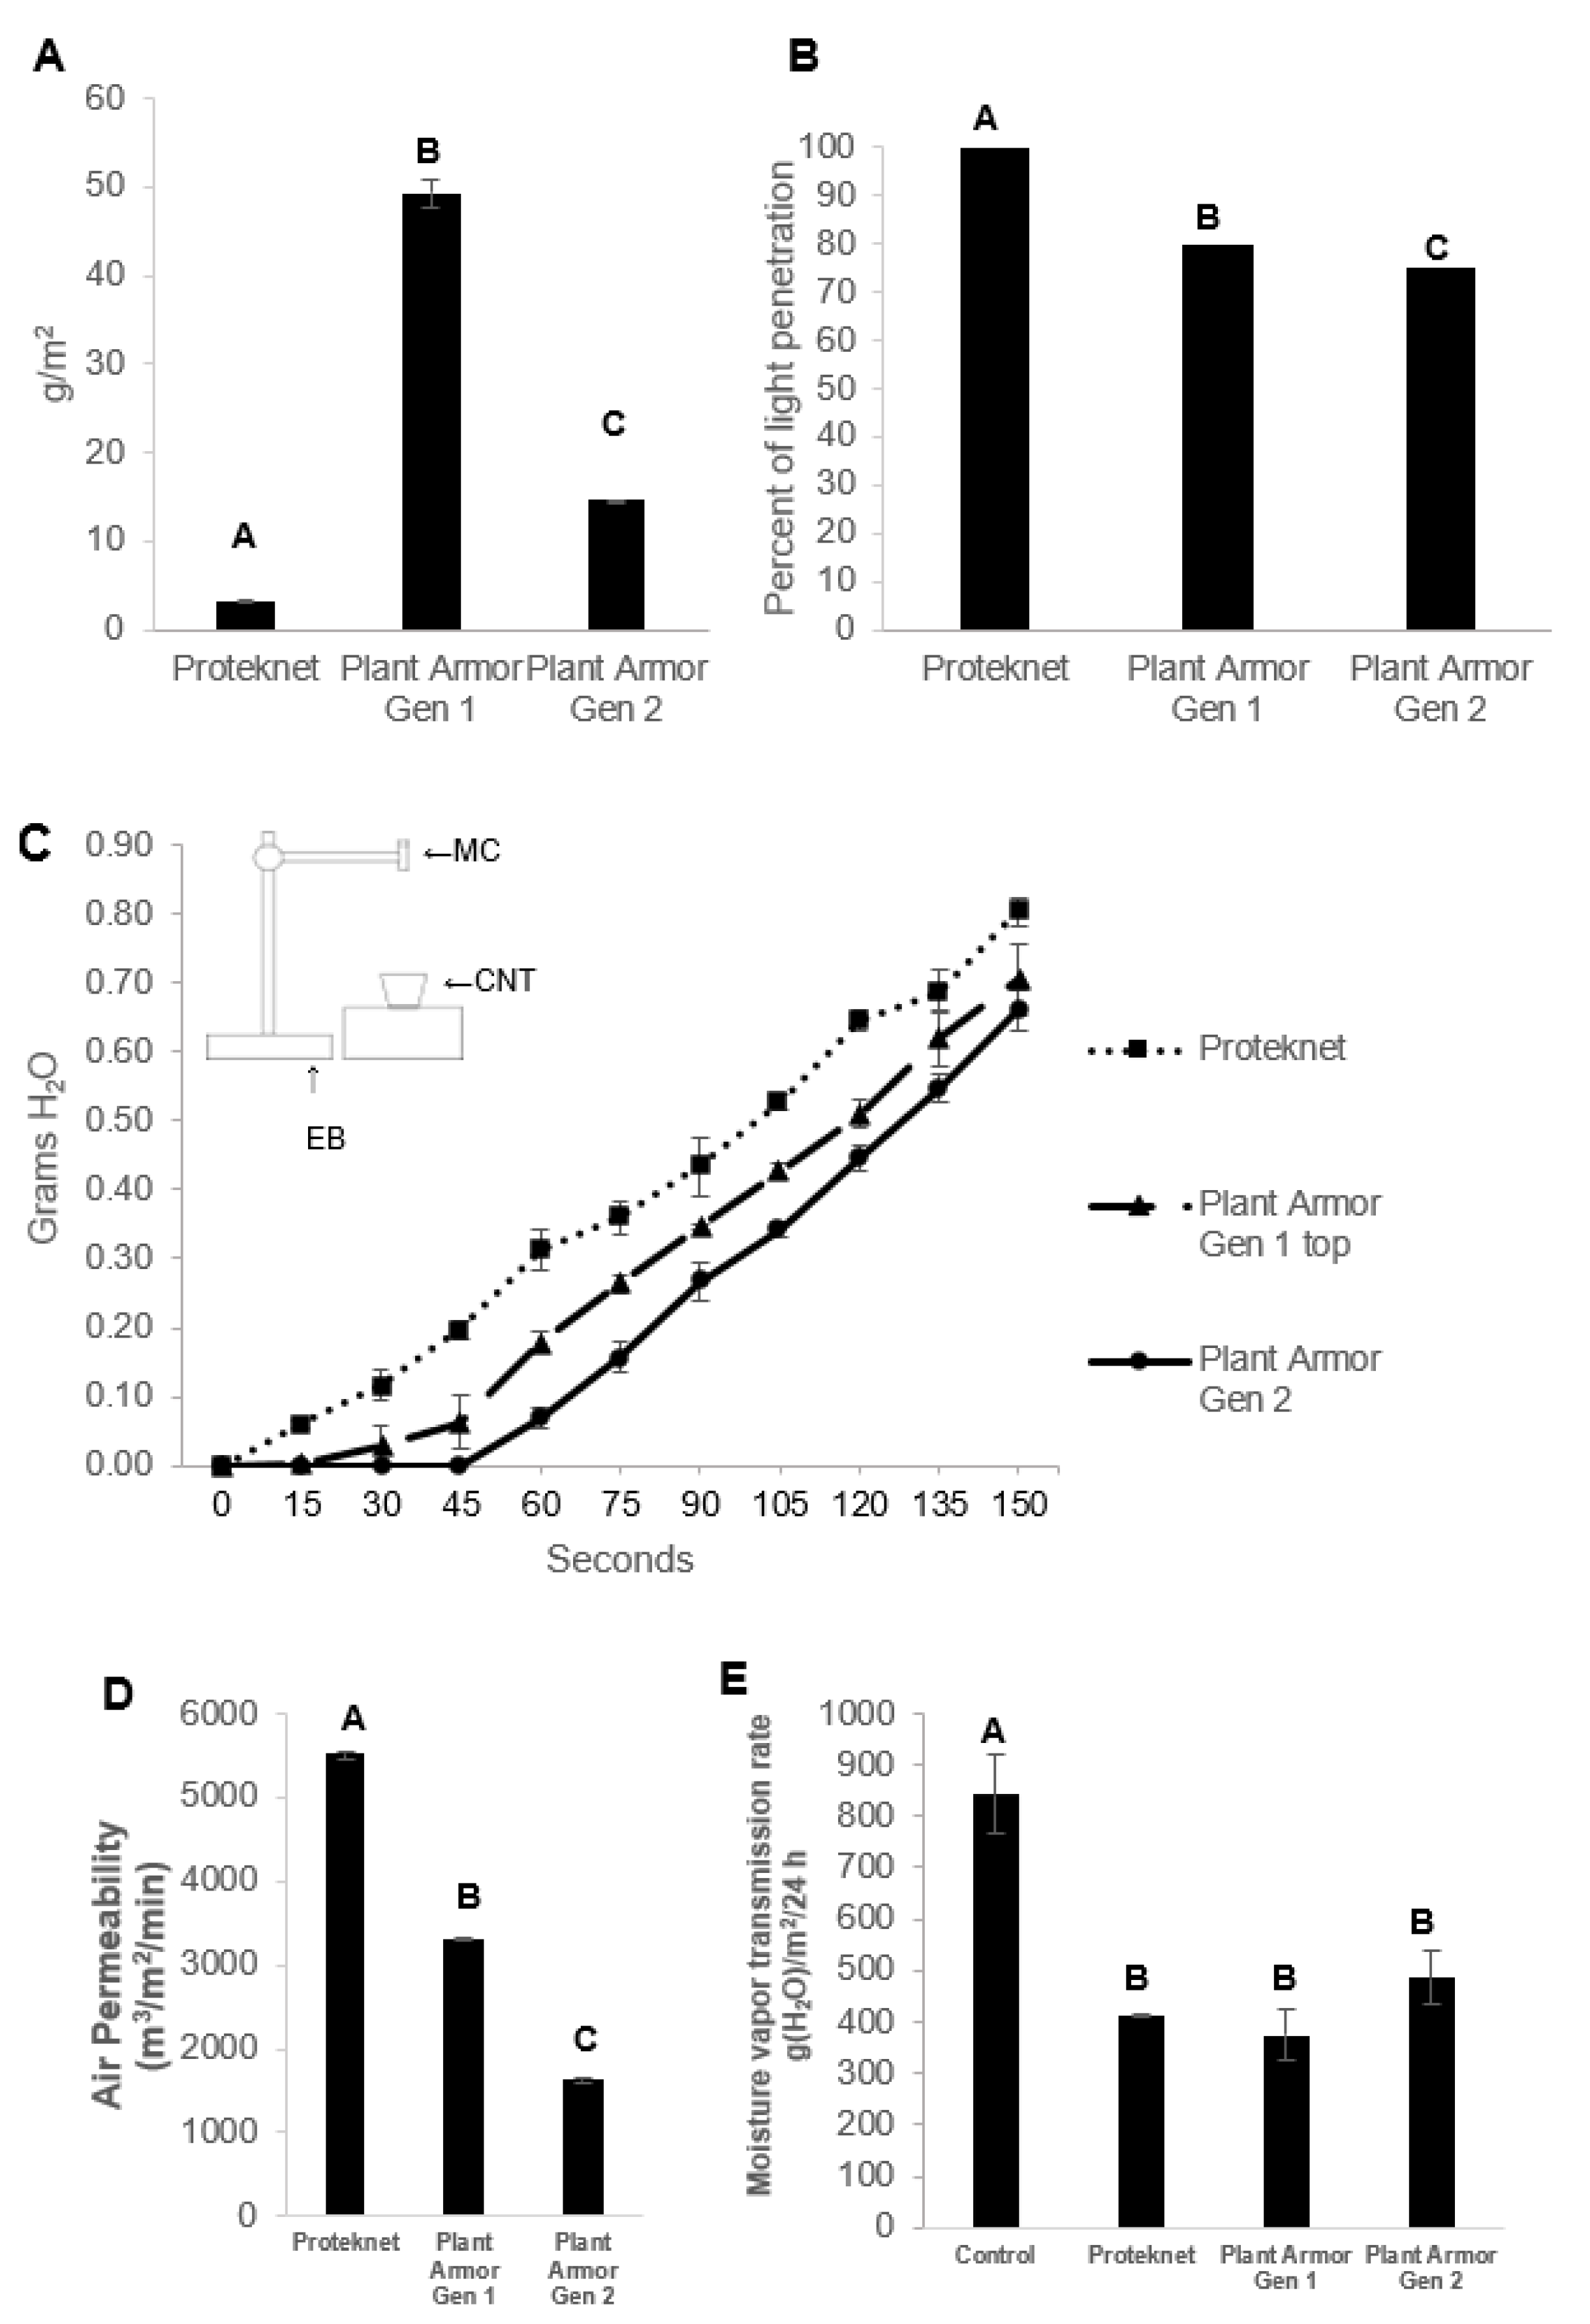
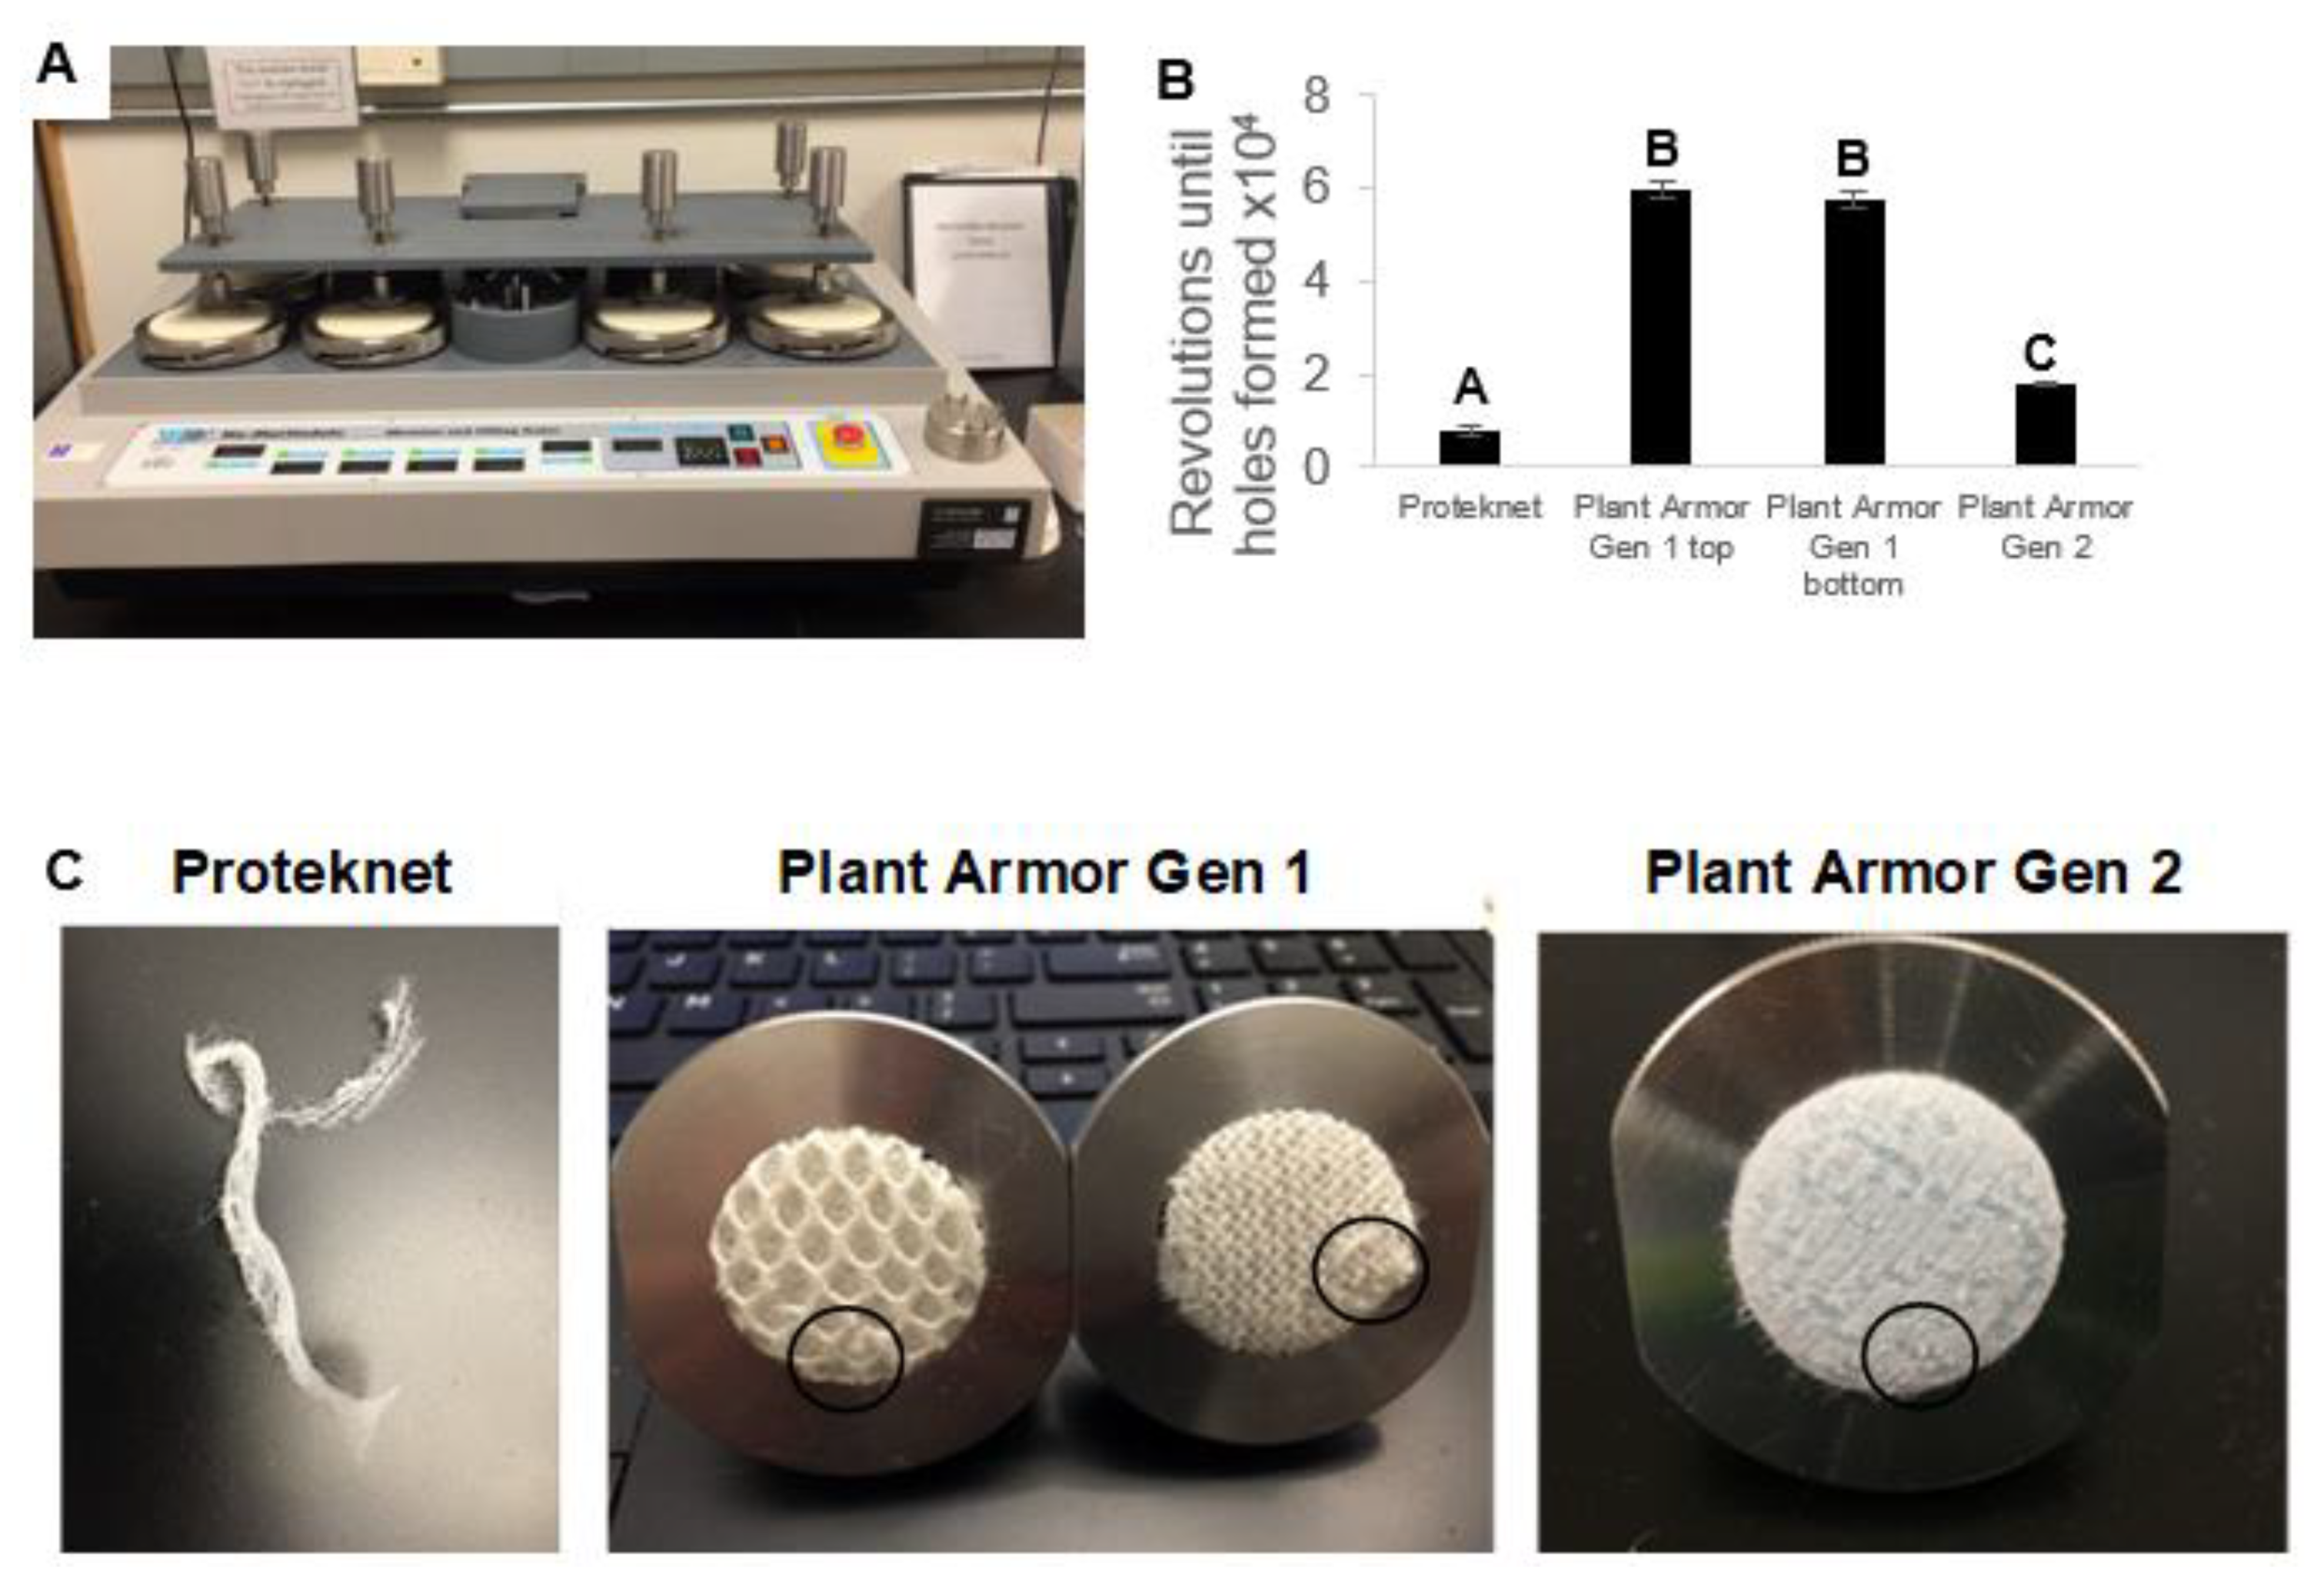
2.2. Textile Metrics

Cloth weight per unit area for Proteknet and Plant Armor Gen 1 and 2 were measured from three randomly selected, 10 cm × 10 cm squares cut with scissors from a commercial scale, production run of each textile. These squares were weighed to calculate the average weight per unit area. Cloth thickness was determined by measuring with a Thwing-Albert ProGage Thickness Tester (Thwing-Albert ProGage instrument company, West Berlin, NJ, USA) averaged over 10 samples, using standard methods for assessing textile thickness as described in ASTM D177 (https://www.astm.org/d1777-96r19.html accessed on 24 February 2018). Light penetration was determined outside under natural sunlight (1200 on 11 September 2018 at the Dearstyne Entomology building, NCSU Campus, Raleigh, NC, USA; 35°47′20″ N, 78° 41′55″ W; 133 m above sea level). Measurements were made by placing a Sight-Light photometer (Model 703, Weston Electrical Instrument Corporation, Newark, NJ, USA) on a flat surface and suspending the textile (10 cm × 10 cm) 6 cm directly above the surface of the photometer during a cloudless day. Light readings were taken before and after the cloth was suspended (replicated for three randomly selected samples of each textile).
Water penetration was measured using a drop assay. Each textile was cut large enough to completely cover the large open end of a 1.5 mL microcentrifuge tube (Fisherbrand, Waltham, MA, USA), with no more than a 2 mm extension pass the tube edge. The textile was held in place at the outside edge of the tube at 2 locations with a small drop of hot glue. The conical end of the tube (1.27 cm from the terminus) was removed by cutting with scissors to avoid any jagged or uneven edges. The textile mounted to the microcentrifuge tube and positioned with the textile end up, was suspended 13 cm above a water tight container sitting on an electronic balance. One hundred microliters of glass distilled water at 25 °C was released manually every 15 s from a pipette held 2.5 cm above the textile. The weight of the container with water was measured approximately 15 s after each release of water, and the release of water was repeated every 15 s for 150 s. These measurements of water weight increase versus time were replicated with three randomly selected samples of each textile. The Gen 1 textile was tested with the large holes on the outside layer of the textile facing up.
A Frazier air permeability test was performed for each textile according to ASTM D737 (https://www.astm.org/Standards/D737.html accessed on 12 September 2018) at 21 ± 1 °C and 65 ± 2% relative humidity using a circular test area of the cloth (38.3 cm2 ± 0.3%). These measurements were replicated with three randomly selected samples of each textile. Water vapor transmission was measured for a circular piece of each textile (0.0053 m2) according to ASTM E96 (https://www.astm.org/Standards/E96.html accessed on 17 September 2018) using a 2” EZ-Cup (Thwing-Albert Instrument Company, West Berlin, NJ, USA) at 23 ± 1 °C and 50% relative humidity. These measurements were replicated with three randomly selected samples of each textile. Textile durability was determined with a Maxi Martindale 1609 Abrasion & Pilling Tester machine (SDL Atlas, Rock Hill, SC, USA) at 21 ± 1 °C and 65 ± 2% relative humidity using the ASTMD4966 protocol (ASTMD4966-12, https://www.astm.org/d4966-12r16.html acessed on 20 September 2018). These measurements were replicated with three randomly selected samples of each textile.

2.3. Insects

Tobacco thrips, Frankliniella fusca (Hinds) (Thysanoptera: Thripidae), were obtained from the laboratory of Dr. G. G. Kennedy at North Carolina State University, Raleigh, NC, USA. The colony was originally established from insect collections in 1997 from peanut at the Peanut Belt Research Station in Lewiston, NC, USA. The thrips used in this paper were reared in our laboratory in 1-gallon plastic tubs covered with one layer of cheesecloth at 25 ± 1 °C, 50 ± 5% relative humidity, and 16:8 (L:D) and fed on cabbage leaves obtained from a local grocery and deionized water-moistened Whatman #1 filter paper (Cytiva, Marlborough, MA, USA). Adults of mixed ages and sexes were randomly chosen and used for assays (Figure 1). Bollworms, Helicoverpa zea (Boddie) (Lepidoptera: Noctuidae), eggs were purchased from Benzon Research (Benzon Research Inc., Carlisle, PA, USA), maintained at 27 ± 1 °C, 50 ± 5% relative humidity and 16:8 (L:D) until hatching. One-day-old, unfed neonates were used for bioassay (Figure 1).

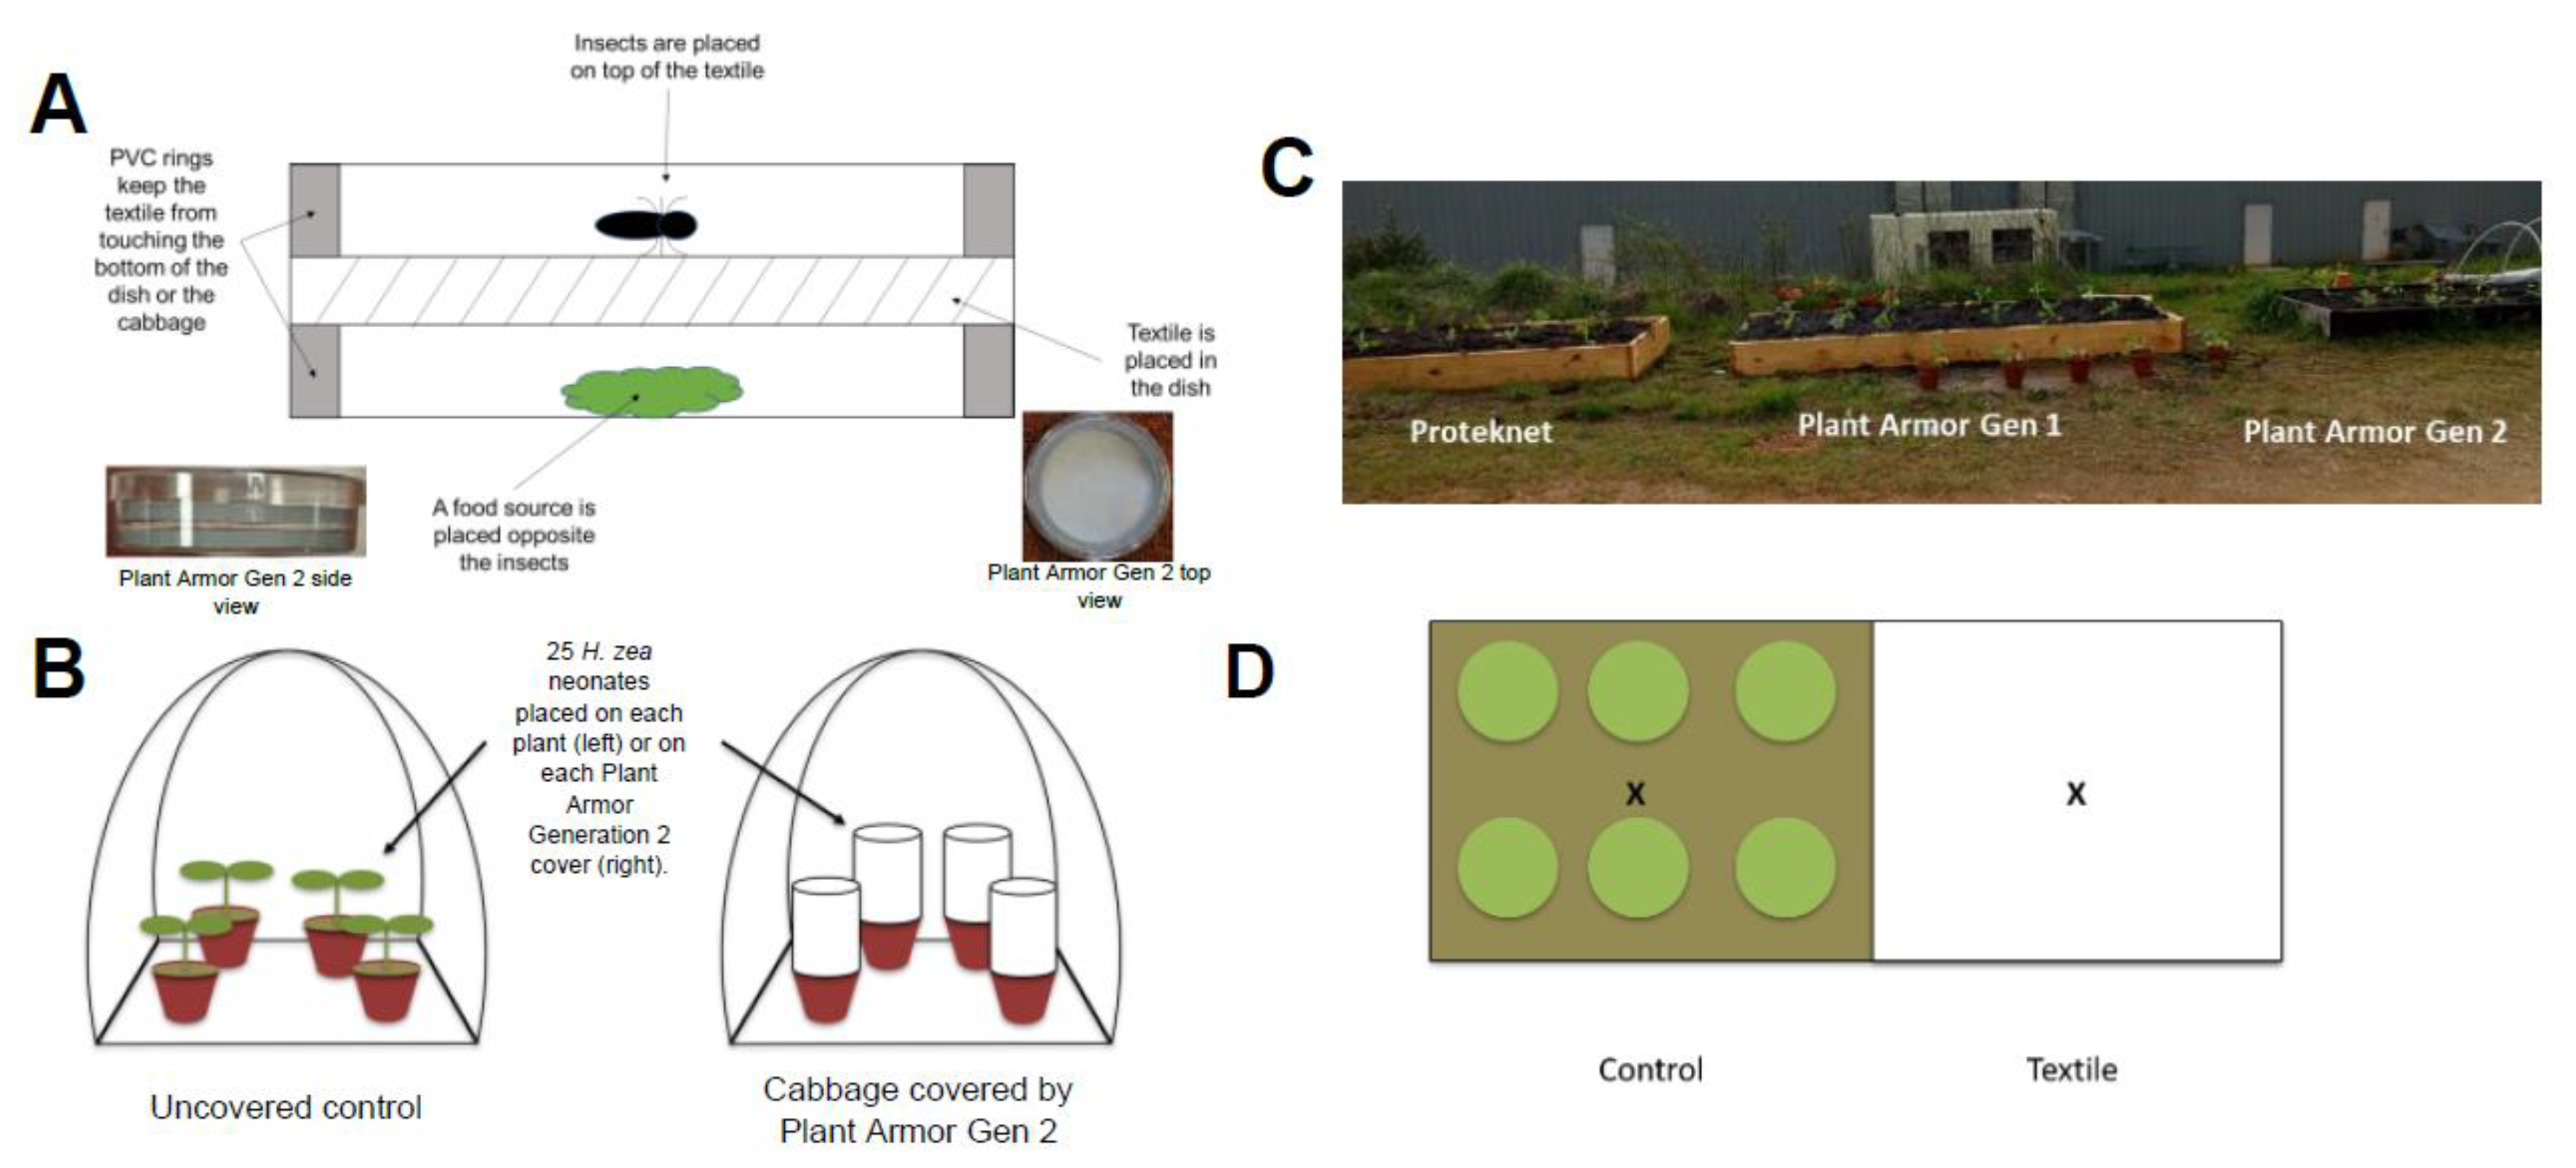
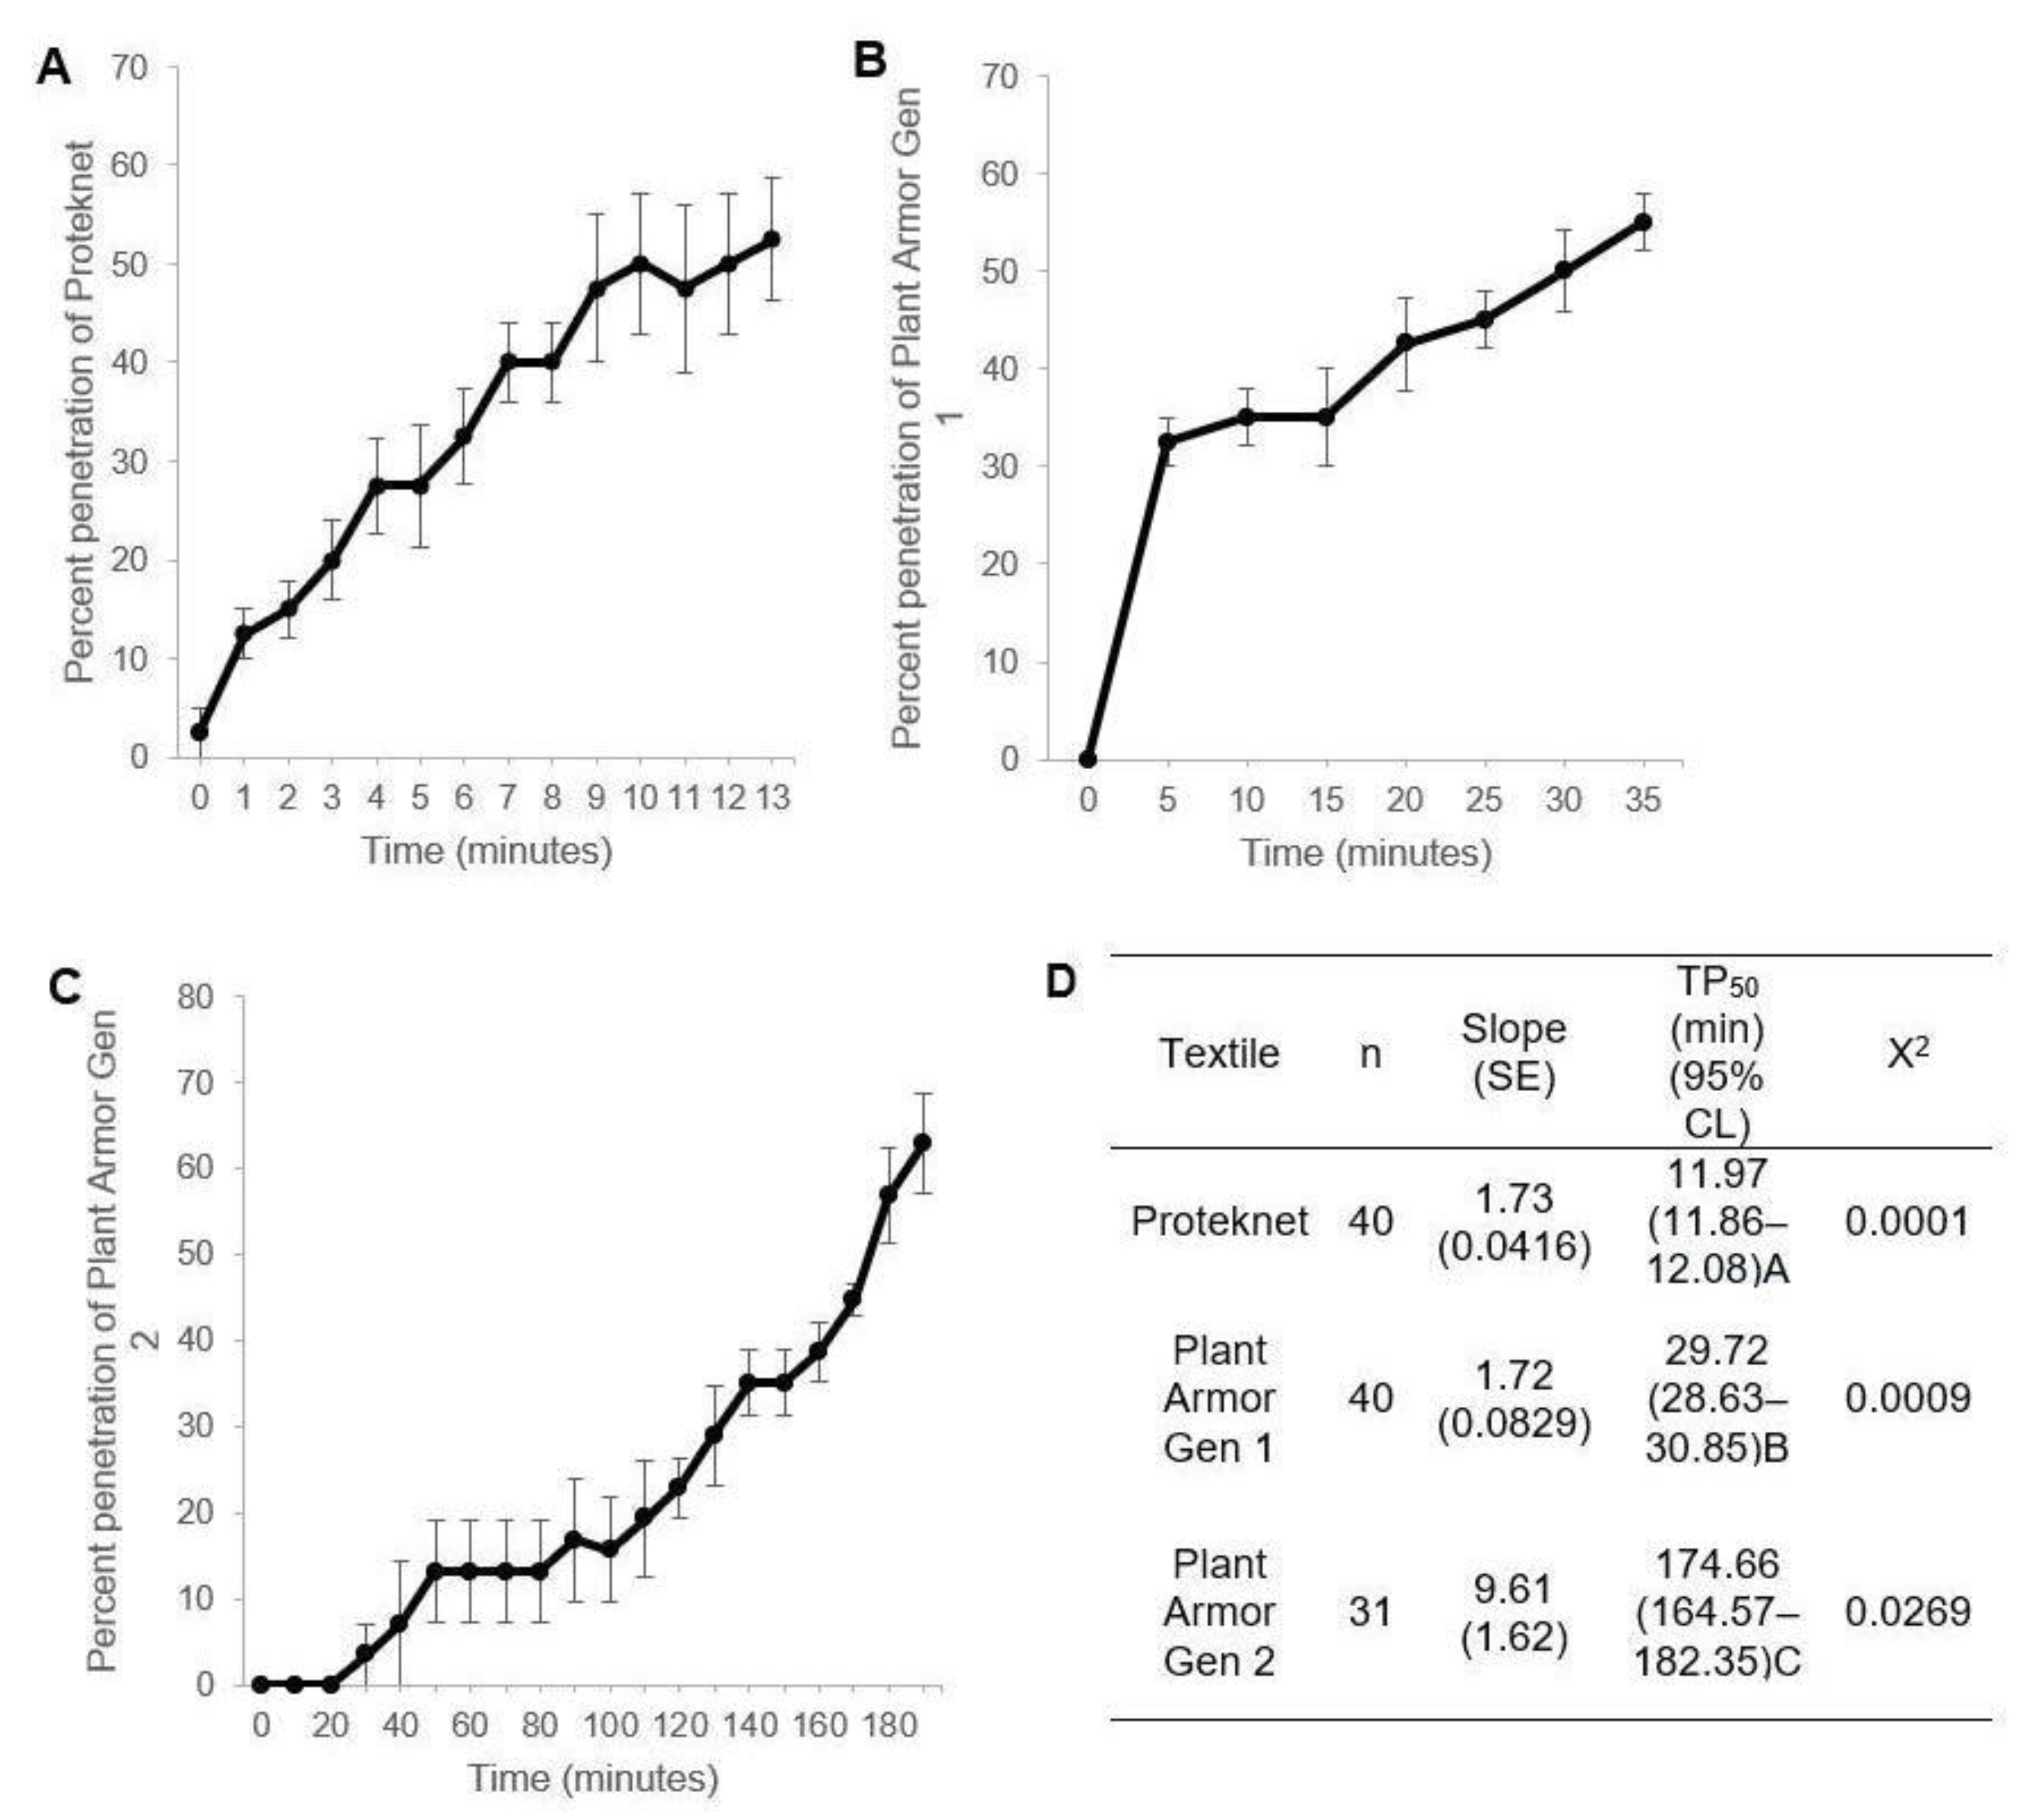
2.4. Petri Dish Penetration Assay

The assay (Figure 1A) was a 100 × 25 mm, plastic Petri dish (Fisher brand, Waltham, MA, USA). A textile swatch was cut to the inside diameter of the Petri dish bottom and held in place between two PVC rings in the Petri dish bottom. The rings had the same outer diameter as the inside diameter of the Petri dish bottom with the PVC rings having an inside diameter of 7.5 cm and a thickness of 0.5 cm. The first PVC ring was placed in the bottom of the Petri dish bottom and a cabbage leaf (same as that used for rearing thrips) was placed on the inside bottom of the Petri dish and sized to cover about 2/3 of the Petri dish bottom but not wider than the inside diameter of the PVC ring. The textile was then placed on top of the ring over the cabbage leaf and a second PVC ring placed over the textile. A 1 × 1 cm piece of Whatman #1 filter paper (Cytiva, Marlborough, MA, USA) was placed on top of the textile. Ten insects (thrips or caterpillars) were transferred using a camel hairbrush to the top side of the paper. This allowed the insects to crawl onto the textile, and in this case, penetration was not affected by how the insects were physically placed on the textile by the researcher. The Petri dish top was applied to the Petri dish bottom and the Petri dish bottom and tops sealed together with Parafilm. The number of insects found in the bottom compartment below the textile over time was measured. The incubation conditions were 25 ± 1 °C, 50 ± 5% relative humidity, and 16:8 L:D cycle. Each textile was evaluated in separate experiments with adult thrips or unfed bollworm neonates (unsexed), replicated with different insects and textiles for each replicate. The time to 50% penetration was calculated from Probit models.

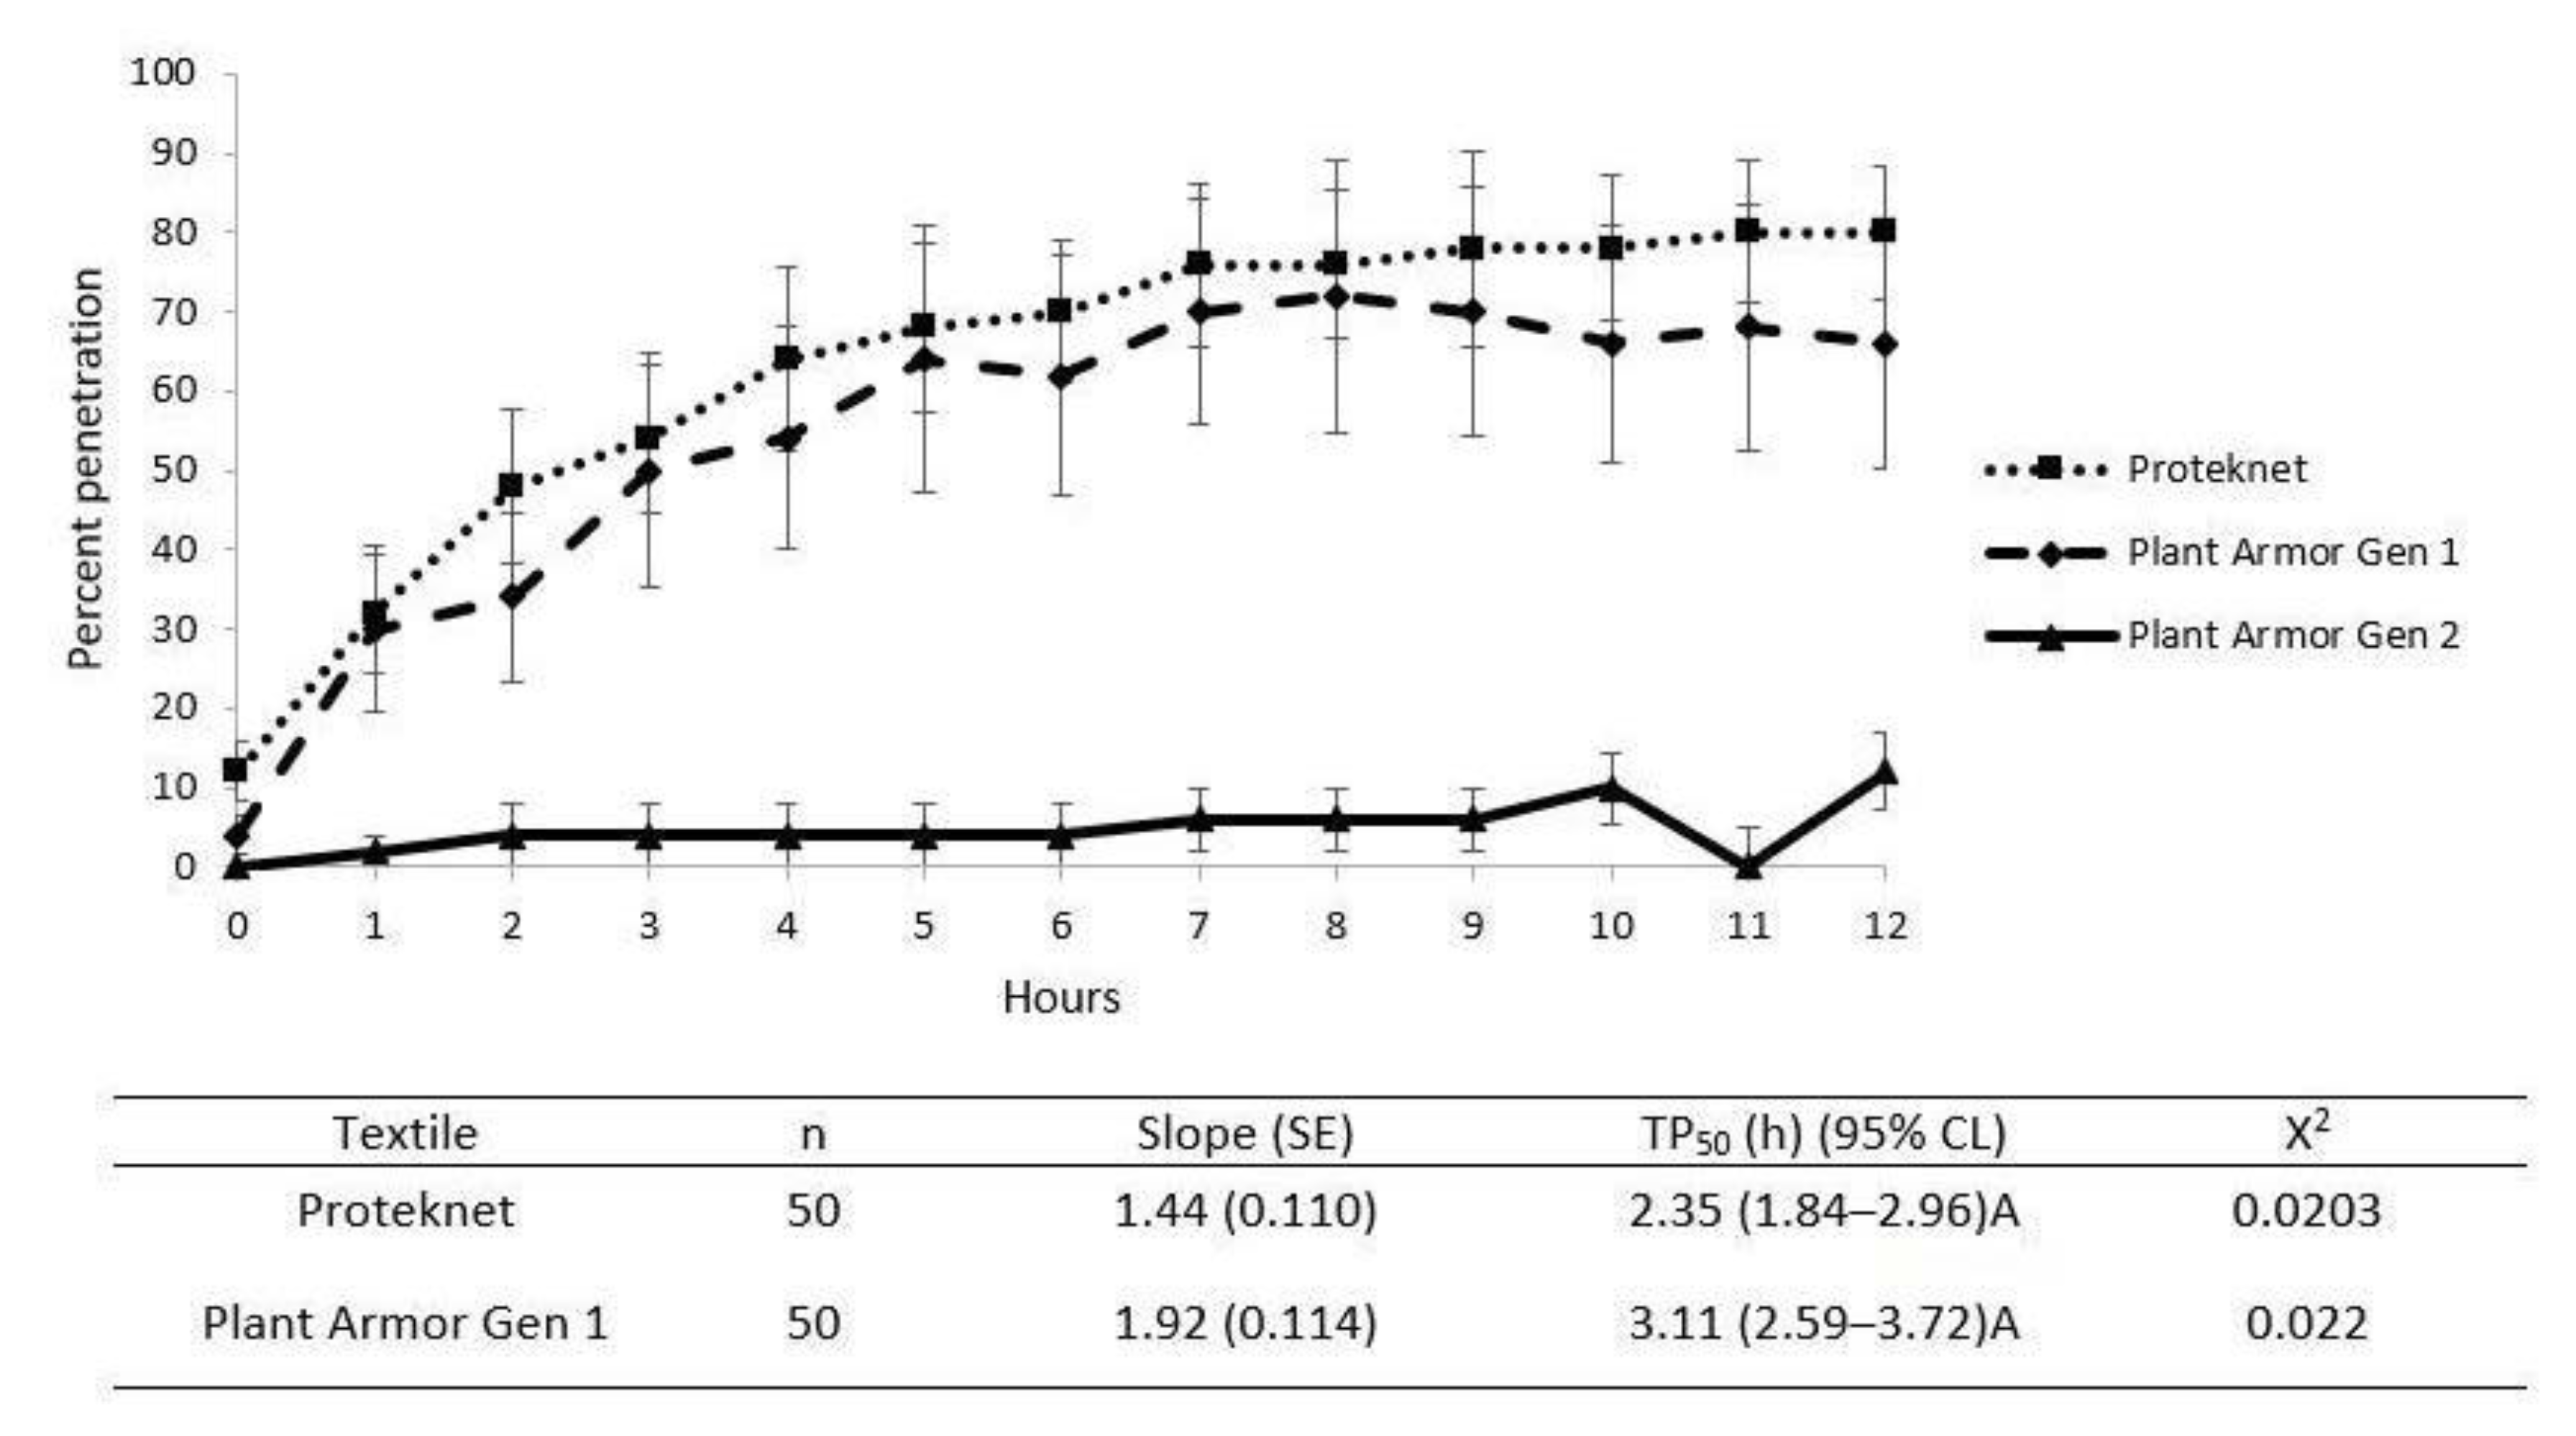
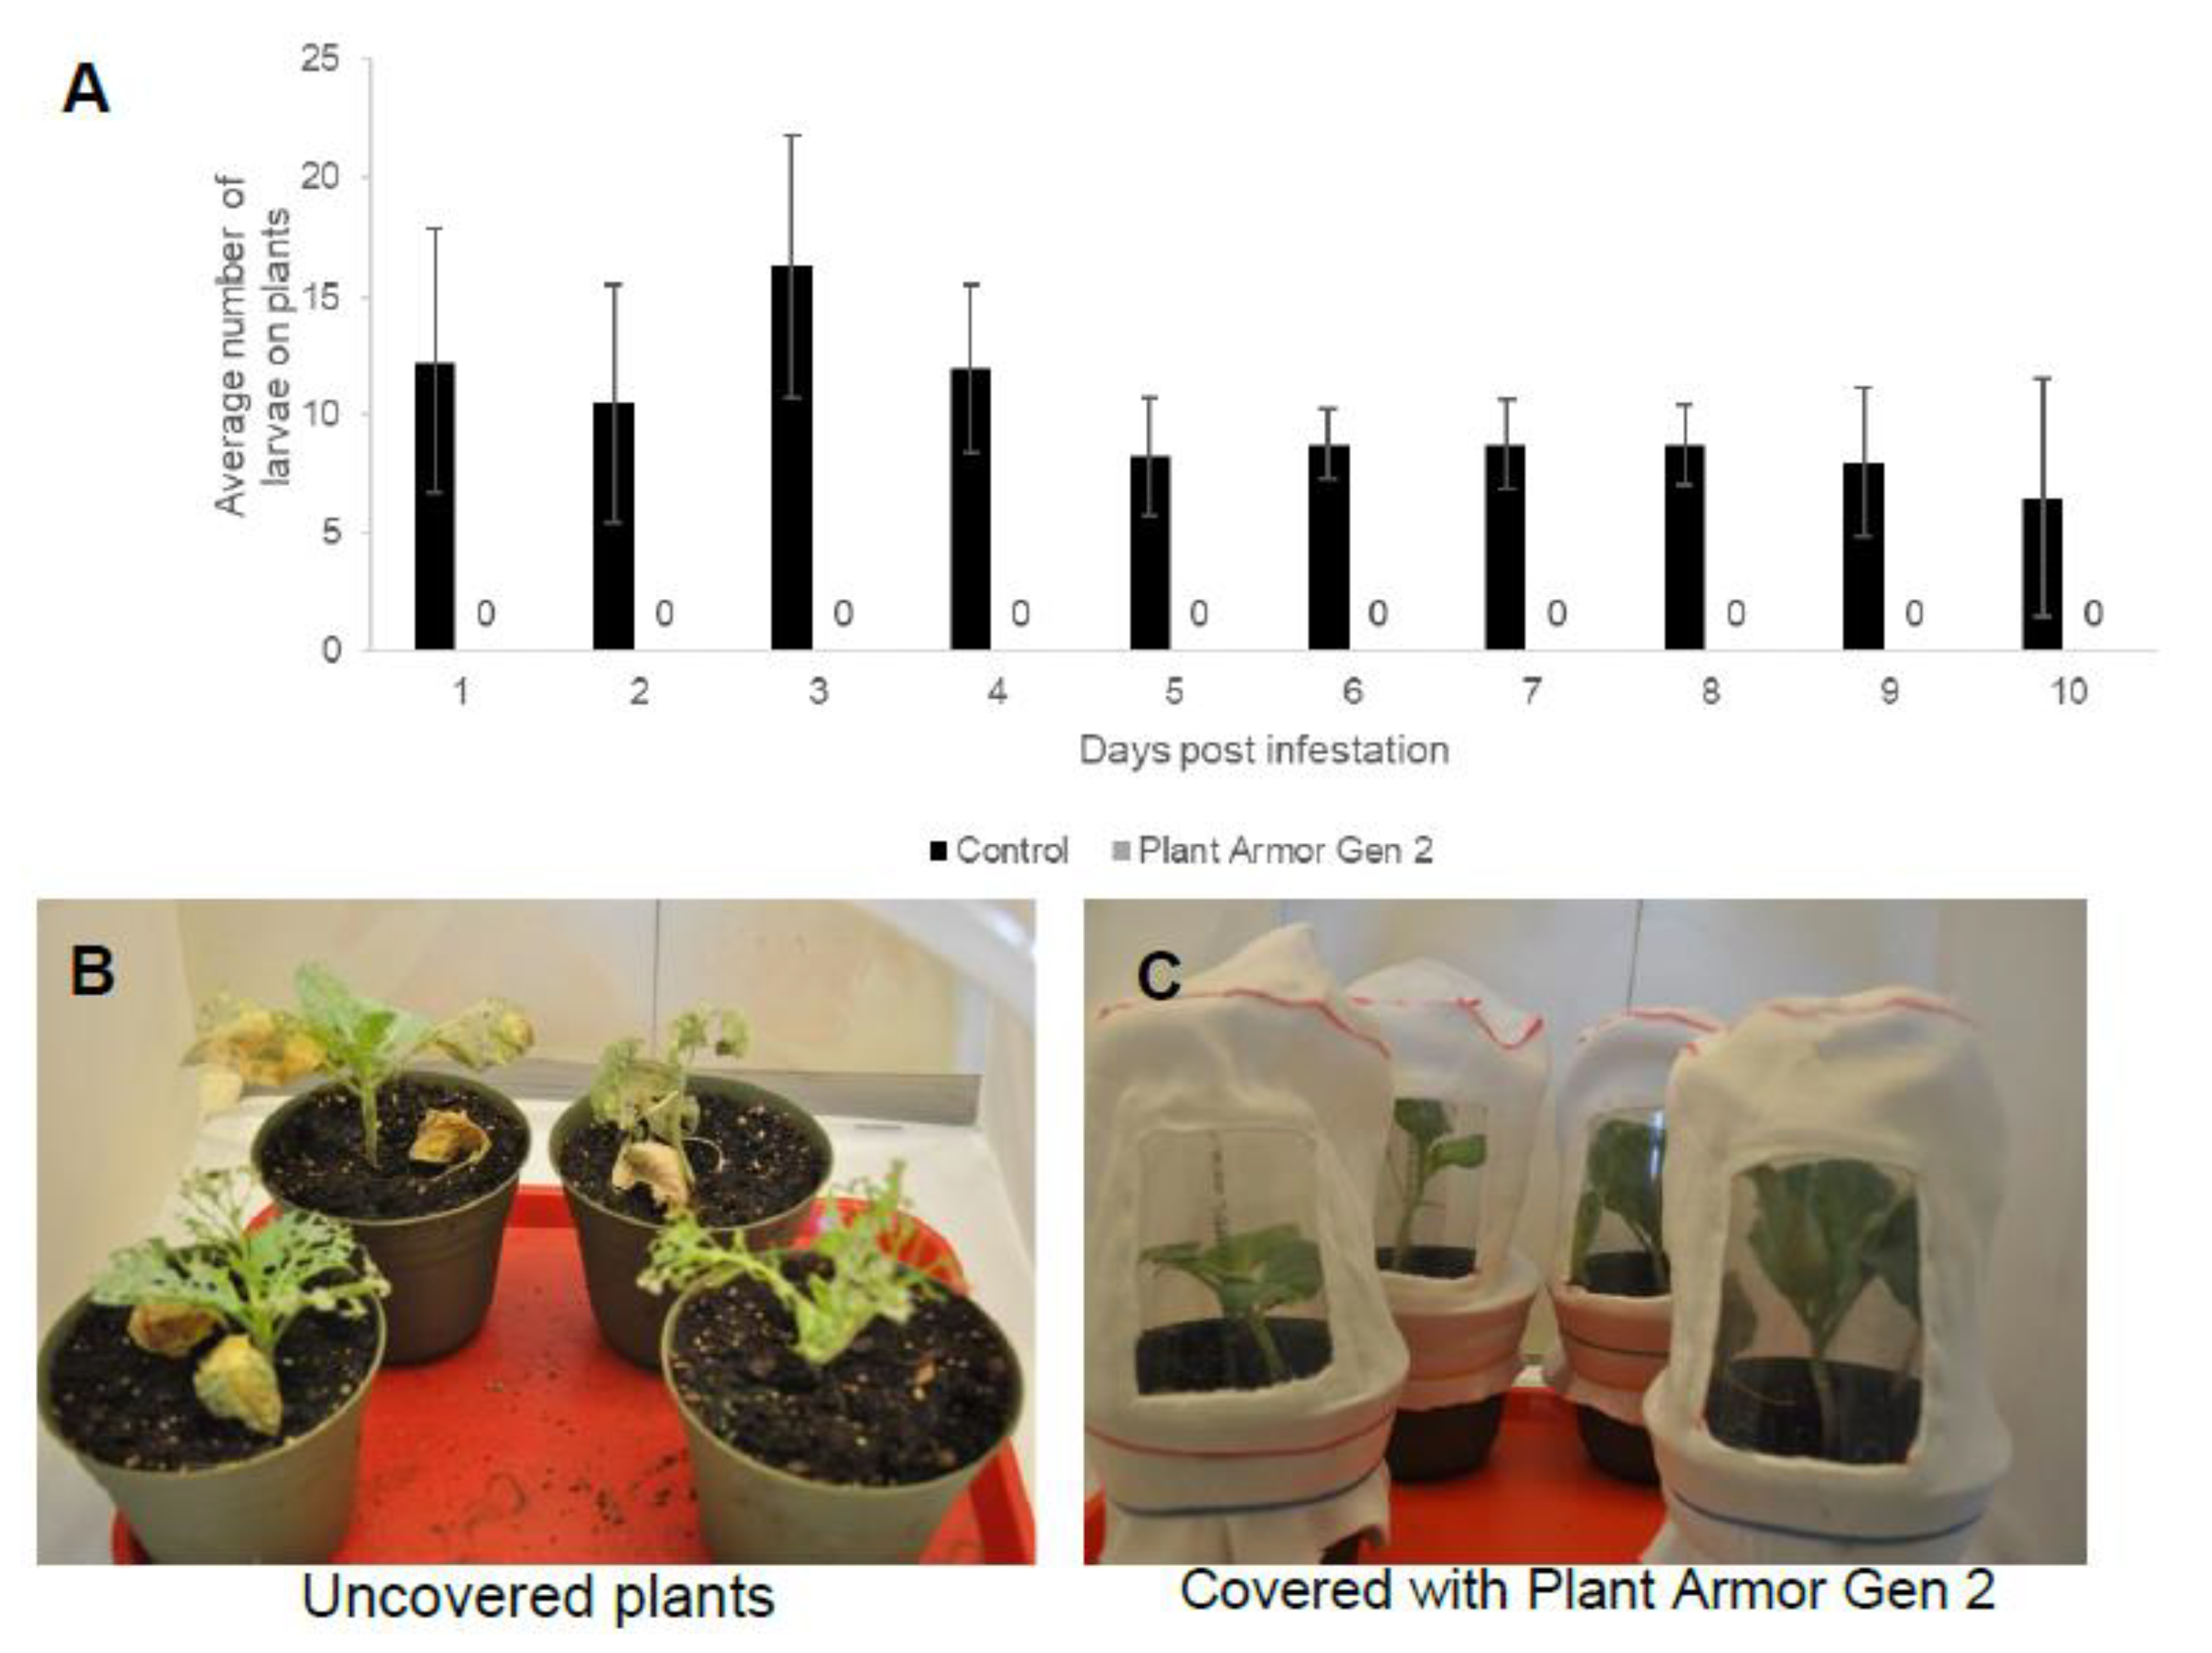
2.5. Cage Penetration Assay

Eight Brassica oleracea (L.) var. capitata cv. (early Jersey Wakefield cabbage) plants (five leaf stage) in soil in individual plastic pots were purchased from a local garden center. Plants were sorted at random and separated into two groups of four plants each, transferred to individual pots, and placed into a BugDorm Insect Rearing Tent (Model 2M120, MegaView Science, Taichung, Taiwan), one tent per treatment (Figure 1B). Before the start of the experiment, the plants were inspected for insect eggs, larvae or adults on the plant, soil, or pots (none were found). At no time during the experiment did we observe insects on the plants or pots except those introduced for study. Each plant in one tent (the treatment) was covered with a 50 × 25 cm peace of Gen 2 Plant Armor formed into a cylinder with the bottom end open and the top end sealed with Gen 2 Plant Armor of the exact diameter of the cylinder. A 10 × 12 cm clear plastic window was mounted into the side of the cylinder to allow counting from the outside of any insects that might penetrate the Plant Armor. All seams were sealed with hot glue to create an insect tight enclosure of Plant Armor. The open end of the Plant Armor cylinder was fixed to the top edge of the pot (with the plant now under the textile) where insect penetration from the outside was not possible except by movement across the Plant Armor. The plants in the second tent were not covered and used as the control. Twenty-five H. zea, unfed neonates (not sexed) were placed (using a camel hair brush) onto each control plant or cylinder covering a plant (a total of 100 larvae for the four plants in total in each tent). The number of larvae found on each plant was counted every 24 h for ten days, and the condition of the plants at the end of the experiment documented photographically. The experiment was conducted in a reach-in incubator at 25 ± 1 °C and 50 ± 5% relative humidity with a 16:8 L:D cycle under a daylight fluorescent bulb. The plants were not watered during this period so as to not disrupt larval feeding.

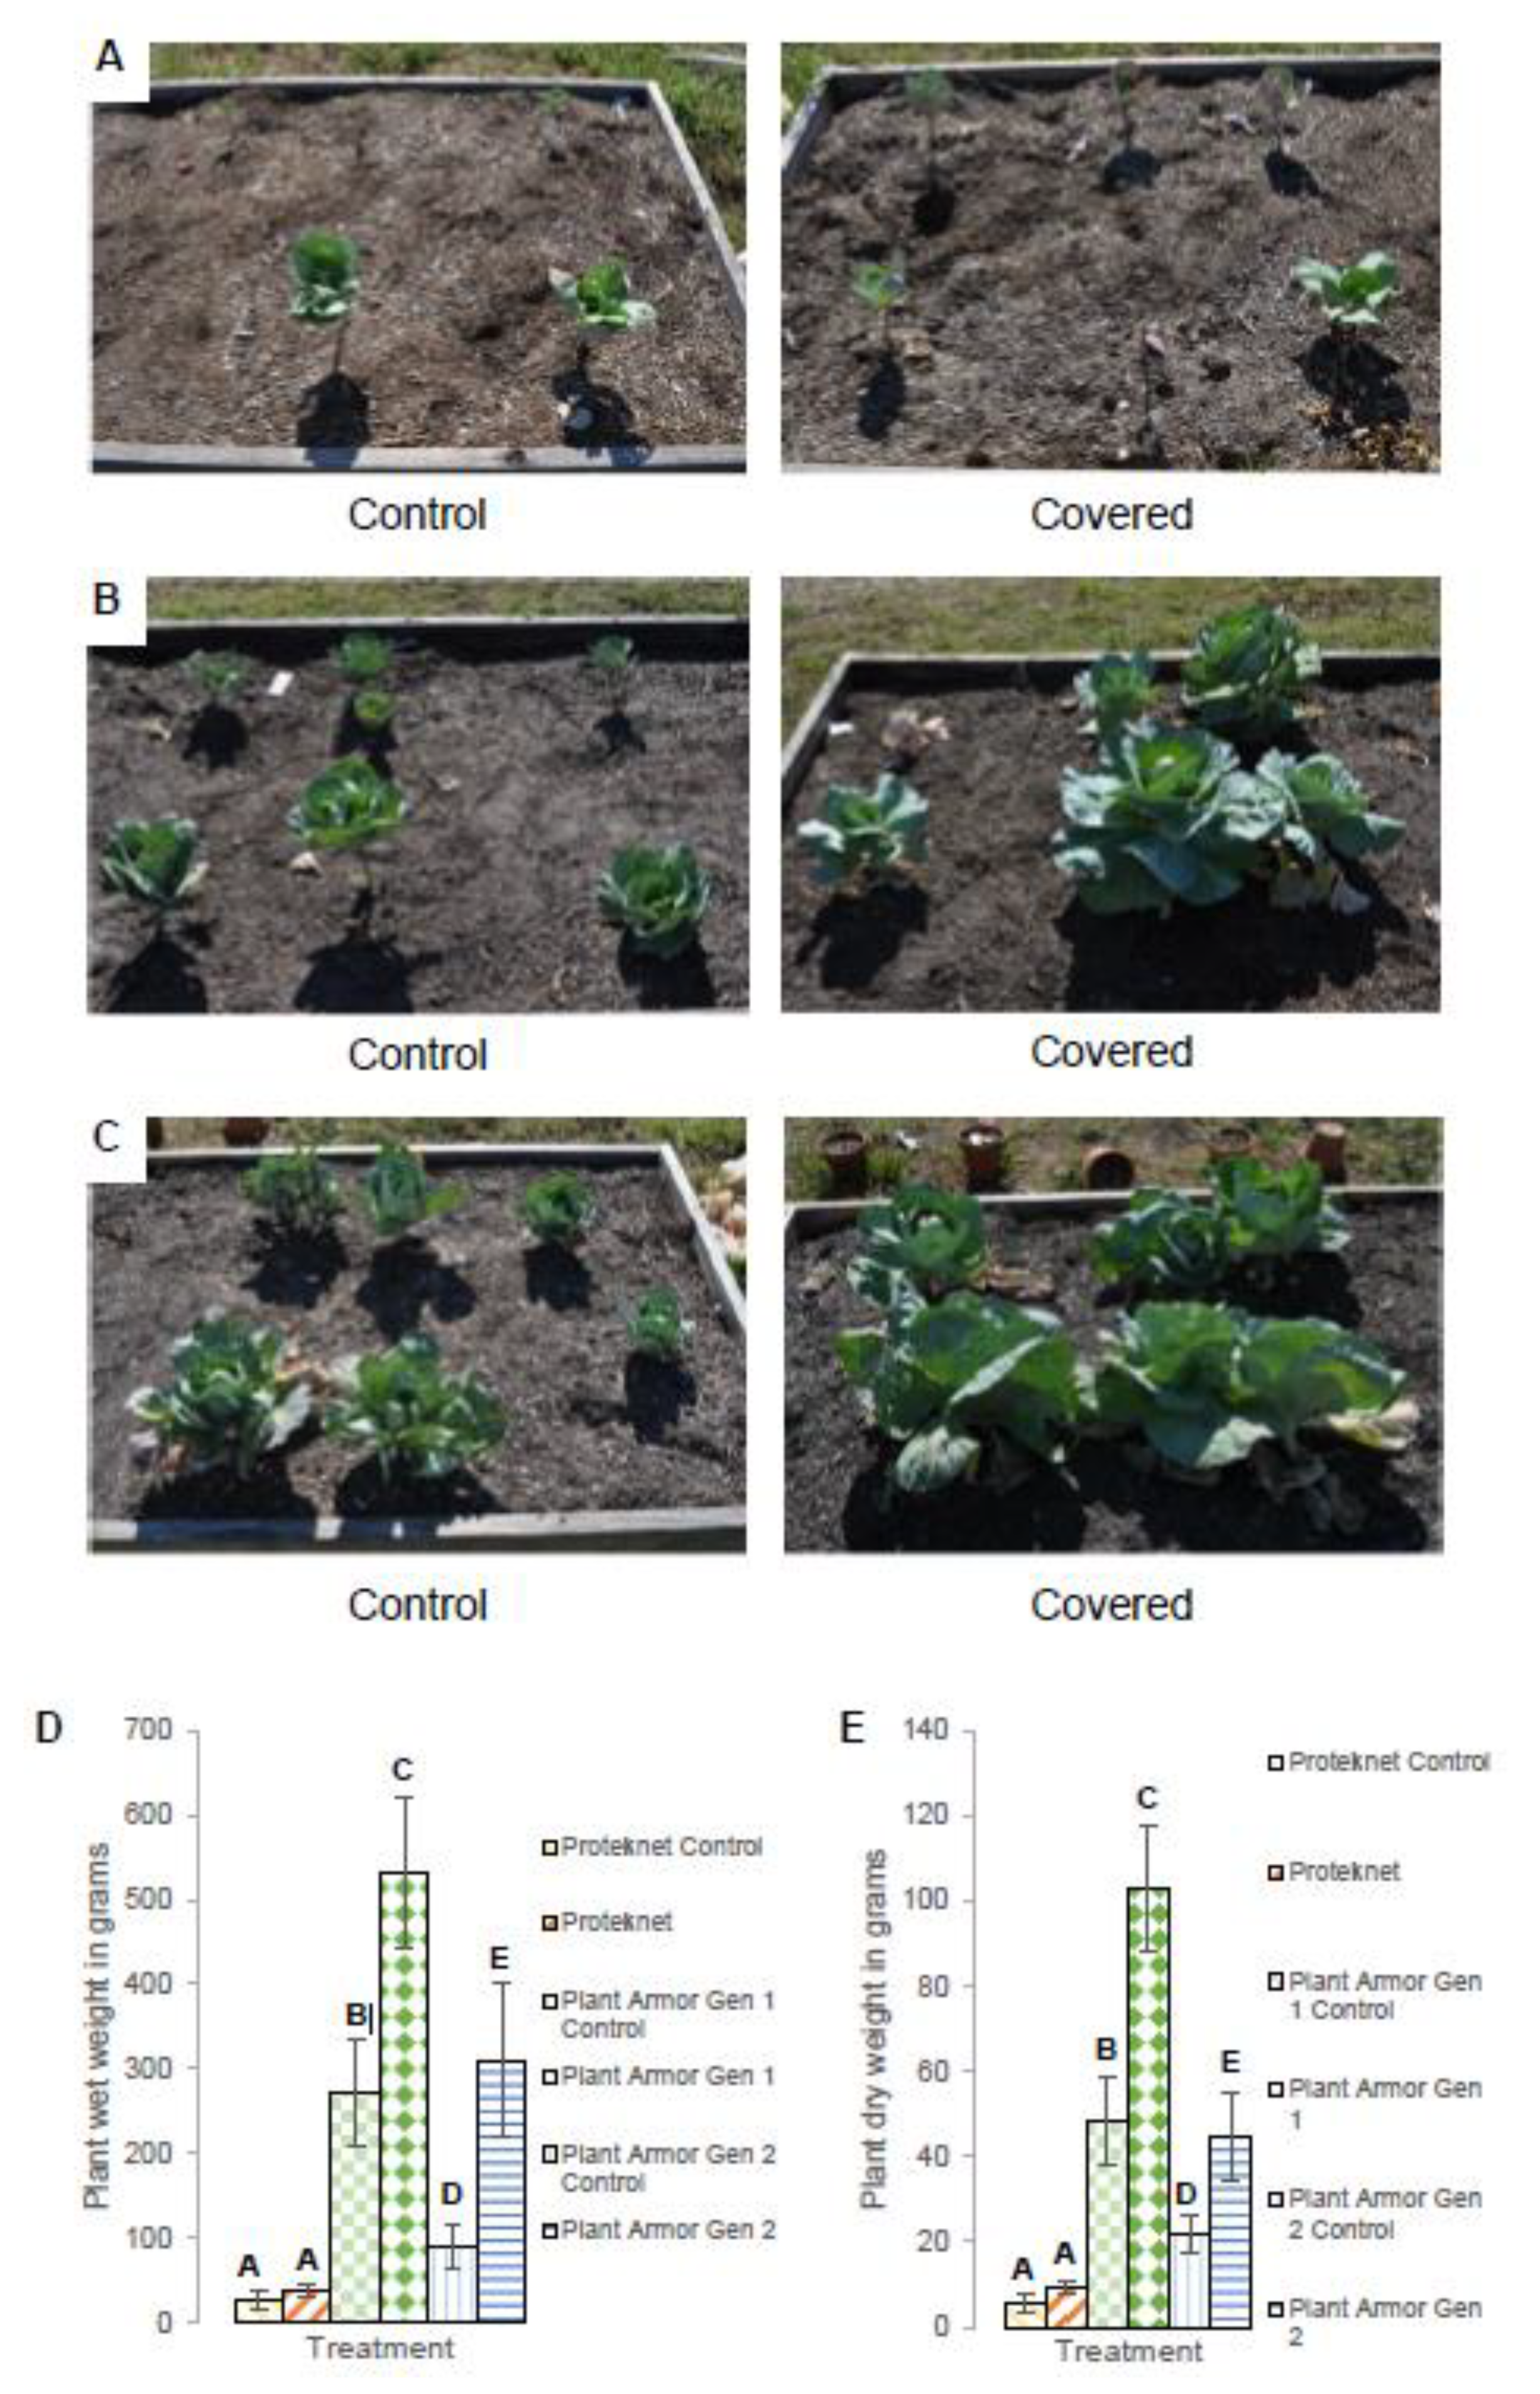
2.6. Small Field Plot Trials

To assess Plant Armor under field conditions, three 3 × 1.2 m raised field plots were constructed from non-treated 5 × 30 cm dimensional pine lumber (Figure 1C) near the Dearstyne Entomology building (47′18″ N, 78°41′57″ W), filled with a mixture of 3:1 of Timberline top soil (CRH, Dublin, Ireland) Miracle-Gro fertilizer soil (Scotts, Marysville, OH, USA). Twelve B. oleracea plants (described earlier) were randomly selected and planted approximately 25.4 cm apart from each other in each raised bed (Figure 1D). Half of the bed was then covered by either Proteknet, Plant Armor Gen 1, or Plant Armor Gen 2. The assignment of the textiles to a particular raised bed was random. The textile was held above the plants using 1.3 cm PVC pipe bent to produce an arch support above the soil that extended from one side of the bed to the other (in the bed short dimension; shown partially on the right side of Figure 1C). The test textile was fitted over this arch to completely seal the plants under the textiles without any contact with the plants as illustrated in Figure 1D with the full white background. The plants were allowed to grow for 91 days (April–July 2018), and each treatment was watered for 5 min once a day for one month (after that the plants were allowed to be watered by rain). At the end of the experiment, each plant was carefully removed from the soil to minimize damage to the roots. The roots then were lightly agitated in a reservoir of tap water to remove as much soil as possible and blotted dry with paper towels until no more water was evident visually. The wet weight of each plant was measured immediately. The plants were then dried at 100 °C overnight and the dry weight measured.
Temperature and relative humidity measurements were made using a Fluke 971 temperature and humidity meter (Model 971, Fluke, Everett, WA, USA). The sensor was 19 cm from ground level and at equal distance in the short and long dimensions from the edges of the plot surface covered by each textile. The control temperature measurements were made at the same distance from the ground and edges in the uncovered area of the PA Gen 2 plot. Temperature and relative humidity readings were taken over 7 d at 1200 and 2400 each day with sunrise occurring at approximately 7:00 a.m. (0700) and sunset at approximately 7:30 p.m. (1930).

2.7. Statistical Analyses

A Probit model [27] was used to analyze the insect penetration data from the Petri dish assays; a statistically significant difference was obtained when the 95% confidence intervals did not overlap. Textile weight per unit area, cage penetration and growth assay data were analyzed using one-way analysis of variance (ANOVA) followed by a Tukey’s test for all means separation (alpha = 0.05). Log10(x + 1) transformations were performed prior to running ANOVA where x represents the value obtained for each measurement except for temperature and humidity data where it represents the absolute value of the difference between inside and outside measurements for each textile. Untransformed descriptive statistics (mean ± 1 standard error of the mean) are reported. Statistical analyses were performed using SAS 9.4 software (SAS Technical Inc., Cary, NC, USA).

3. Results

To determine the feasibility of using a knitted 3-D fabric to exclude insects from plants, two spacer fabrics (Plant Armor Gen 1 and 2; Figure 2A,C–E) were made and compared to a commercially available, single layer (knitted textile) crop cover, Proteknet (Figure 2B). The three layers of the spacer (3-D) fabric and the general method of weaving that produces the structure are illustrated in Figure 2A. The size of the holes on the outside layers of Plant Armor Gen 1 were different. The pores in the top layer were 349.13 ± 18.15 µm (mean ± SD) in diameter (Figure 2C) while the pores in the bottom layer facing the plant were 99.24 ± 12.90 µm (Figure 2D). For Plant Armor Gen 2, the pore sizes were the same on both sides, 15.58 ± 2.97 µm (Figure 2E). The average hole diameter in Proteknet was 46.51 ± 4.91 µm (Figure 2B). The average fabric thickness for Proteknet, Gen 1, and Gen 2 were 0.25 ± 0.01, 8.9 ± 0.06, and 1.07 ± 0.01 mm.
The weight per unit area of Proteknet was 3.23 ± 0.04 g/m2, Plant Armor Gen 1 was 49.21 ± 1.63 g/m2, and Plant Armor Gen 2 was 14.59 ± 0.10 g/m2 (Figure 3A; F = 2192.8, df = 2, p < 0.0001). The percentage sunlight penetration was 100, 80, and 75%, respectively (Figure 3B; no variation in replicates for each treatment). Proteknet had no significant impact on reducing light (<1%, the precision limit of our measurement), while Gen 1 and Gen 2 were similar. The rate of simulated raindrops and their penetration in grams across the textile over time was almost identical between the three textiles once they reached water saturation (Figure 3C). The water first penetrated Proteknet at 15 s, Plant Armor Gen 1 at 30 s and Gen 2 at 60 s. The differences between textiles resulted from the water filling the internal empty space of the 3-D fabrics; once filled, water dripping.
Below the fabric started water filling was minimal for Proteknet since it was a single layer of cloth. Once the threshold for filling was reached for the 3-D fabrics, the slope of water weight increase with time was similar for all textiles tested (Figure 3C). The insert in Figure 3C shows a diagram of the experimental device used for water penetration (explained in detail in the Materials and Methods). There were large differences in the air permeability of the fabrics (Figure 3D). Proteknet had the highest air permeability at 5500.7 ± 39.2 m3/m2/min followed by Plant Armor Gen 1 at 3309.7 ± 22.5 m3/m2/min and Plant Armor Gen 2 at 1621.4 ± 37.1 m3/m2/min (F = 1921.60, df = 2, p < 0.0001). Water vapor transmission rate in the control was significantly higher in the control (F = 15.15, df = 3, p < 0.05) with no differences in transmission rates between textiles (Figure 3E; Tukey’s test, α = 0.05).
The durability of the textiles was investigated using a Martindale abrasion test (Figure 4). The assay uses equal pressure and simultaneous circular rubbing of the textile surface, looking for the first visible change in textile structure. Observations were made without magnification, and the end-point is the first appearance of a hole in the textile. The number of cycles of circular motion to the endpoint is a measure of durability. The endpoints for Plant Armor Gen 1 and 2 were similar in appearance (Figure 4C), represented by the first appearance of a small hole (= disruption of the planar surface structure of the fabric). Proteknet degraded much faster because of its significantly lower mass per unit area (Figure 3A) and single layer (Figure 2B). A hole never appeared, but instead, there was a total disruption of the planar structure of the fabric (Figure 4C, left picture). Based on cycles alone, Plant Armor Gen 1 performed the best reaching the endpoint at 60,000 and 58,000 revolutions for the top and bottom of the cloth, respectively, followed by Plant Armor Gen 2 at 18,000 cycles, and then Proteknet at 10,000 (Figure 3B; F = 160.15, df = 3, p < 0.0001). The Proteknet end-point at 10,000 revolutions was a total breakdown of the planar structure of the fabric, suggesting the durability was much lower than what the quantitative Martindale abrasion test results suggested.
The Petri dish assay measured penetration from the top chamber that lacks a food source and hydration across the textile to the bottom chamber that contains a cabbage leaf (Figure 1A). The insects placed in the top chamber must pass through the test textile to gain access to the bottom chamber. The number of insects in the bottom chamber was a measure of the textile resistance to penetration. The adult thrips penetration rate was higher for Proteknet followed by Plant Armor Gen 1 and then Gen 2 (Figure 5A–C, respectively). The time to 50% penetration (Figure 5D) was significantly different between the textiles—12.0, 29.7, and 174.7 min, respectively (95% confidence intervals did not overlap determined by probit analysis). Adult thrips were used in these studies because of their uniform size and minimal developmental differences in physiology and size compared to different instars and age within a stadium. Age within a stadium greatly affects the physiology of an insect, its attraction to food, and mobility. Larvae were also much more difficult to sort without causing harm.
When this experiment was repeated with unfed bollworm, H. zea, caterpillar neonates, the Plant Armor Gen 2 resistance was ≥90% at 0–11 h and 89% at 12 h (Figure 6), after which the experiment was ended because of reduced neonate viability. They had no access to water or food during the experiment but were still mobile at 12 h. Proteknet and Plant Armor Gen 1 penetration by H. zea neonates were similar with no significant differences in the time to 50% penetration—2.35 and 3.11 h, respectively (confidence intervals overlapped determined by probit analysis), and clearly differed from Gen 2 (Figure 6; 95% confidence intervals did not include Gen 2).
Small cage studies were conducted with whole plants (Figure 1B) to further examine whether Plant Armor Gen 2 would be 100% resistant to unfed H. zea neonate caterpillars. The results were unequivocal. Cabbage plants not covered and exposed to the insects were infested with H. zea larvae while plants covered with Plant Armor Gen 2 fabric were not infested (Figure 7A). Not a single neonate was found on the covered plants after 10 days shown as zero in Figure 7A. Plants that were covered showed no insect damage visually while the plants not covered had major insect damage (Figure 7B).
A three-month, small field plot study was conducted during summer months to assess plant (cabbage) agronomics when covered with Plant Armor Gen 1 and Gen 2 compared to the commercially available, plant cover, Proteknet. The planting layout and fabric coverage is presented in Figure 1D and the actual test plots shown in Figure 1C before the right half of each plot was covered with fabric. No pesticide treatments were made to protect the plants before or during the experiment. The plants were exposed to ambient natural environmental conditions and insect stresses. Weeds were controlled for the uncovered plants by pulling them from the soil by hand. Plants that were covered did not have weeds. The raised beds were 61 cm apart end-to-end (Figure 1C). The uncovered and covered plants received the same amount of watering. The textile cover was not removed and the water was sprayed onto the cover with the same spray parameters used for the uncovered plants. The assignment of a textile type to a particular plot was random, and the same was the case for each plant shown (Figure 1C). Cabbage was used for these studies to be consistent with the small cage study (discussed earlier).
There were significant differences between the treatments both for the wet weight (F = 12.58, df = 5, p < 0.0001) as well as the dry weight (F = 18.01, df = 5, p < 0.0001). In the Proteknet test, there were minimal visual differences between the uncovered and covered plants (Figure 8A) which was also reflected in no statistically significant differences in the plant wet weight (Figure 8D) or dry weight (Figure 8E) (Tukey’s test, α = 0.05). In contrast, the Gen 1 covered plants looked larger (Figure 8B) and had an average 1.96-fold higher wet weight (Figure 8D) and 2.13-fold higher dry weight (Figure 8E) (Tukey’s test, α = 0.05). For Gen 2, the covered plants also looked larger (Figure 8C) reflected by an average 2.93-fold higher wet weight (Figure 8D) and 1.78-fold higher dry weight (Figure 8E) (Tukey’s test, α = 0.05). The expectation was that the size of the uncovered plants would be similar between field plots, but this was not the case. This is best illustrated in the wet and dry weight determinations (Figure 8D,E, respectively). The uncovered plants were significantly smaller in the Proteknet test, Gen 2 were larger, and Gen 3 the largest by weight, regardless if they were covered or uncovered.
There were no temperature (1200: F = 0.58, df = 2, p = 0.568; 2400: F = 0.20, df = 2, p = 0.979) and humidity (1200: F = 1.29, df = 2, p = 0.299; 2400: F = 0.40, df = 2, p = 0.679) differences outside versus under Proteknet, Plant Armor Gen 1, and Plant Armor Gen 2 over 7 d in the small plot study (Figure 9A,B and C,D, respectively). These measurements were taken daily at 1200 and 2400.

4. Discussion

Organic farming that minimizes any negative environmental impact and uses recycled materials is not only highly valued and “sought after” by the public but could have significant economic benefits to the farmer. Any new technology should consider challenges to the sustainability of agriculture in the face of reduced arable land because of population growth and global warming. Considered in our current research was the use of physical methods, i.e., textile barriers, to reduce insect access to plants that at the same time might reduce the need for pesticides and water and enhance plant growth.
Insect barriers like window screening on homes and crop covers use the simple principle of size exclusion. The holes in the barrier are smaller than the size of the insect body, and the insect cannot fly or crawl through the holes. The challenge with this approach, exclusion of small insects like thrips or newly hatched caterpillar larvae require holes so small, they block light, air and rain and trap heat and humidity under the textile reducing or preventing plant growth. Our group has been studying mosquito penetration of fabrics for blood feeding on humans and found critical head morphometrics that governed their ability to penetrate a textile [16]. For mosquitoes, we found that textile pore size, thickness and the tortuosity of the path from outside to inside of a cloth worked together to prevent blood feeding. Based on this research, we constructed 3-D spacer knits that were 100% mosquito bite proof. When made into garments, they looked and felt like everyday clothing and had a high degree of thermal comfort with high air and water vapor transmission. This research showed that an insect barrier is not limited by size exclusion. A tortuous path allows for larger holes than would be expected based on size exclusion only. The objective of this paper was to apply this knowledge and demonstrate proof of concept of using 3-D fabrics as a crop cover to prevent herbivory and improve plant growth.
We report here the first successful use of spacer fabrics to reduce insect penetration and improve plant growth. The pores of Plant Armor Gen 1 on the inside layer facing the plant were 99 µm and on the outside 349 µm. Proteknet, a single layered crop cover used in agriculture had pores 57 µm in diameter. The TP50 against tobacco thrips adults in a worst-case Petri dish penetration assay we developed, was 30 min for Gen 1 (with the larger holes) compared to Proteknet (with smaller holes) where the TP50 was 12 min. An even smaller holes and more tortuous path in Gen 2 increased the TP50 to 175 min for thrips. Gen 2 fabrics demonstrated greater than 90% bite resistance from 0–11 h and 89% at 12 h for neonate caterpillars while neonates were able to penetrate Gen 1 and Proteknet (at equal rates). The Petri dish assay used in these studies measured textile resistance based on the rate insects moved from a top chamber across the test textile to a lower chamber containing a plant leaf. This movement could be a result of either positive gravitational tropism, innate dispersal behavior, random locomotor activity, attraction to the increased humidity, color and odorants, or in combination, from the cabbage leaf. Regardless of the reason for movement into the bottom chamber, insects were found in the bottom chamber over time, and the percentage of insects in the bottom chamber was used as a measure of insect resistance across the fabric. Because this was a simple two choice assay with equal volume limits for the top and bottom chambers, insect crowding in the top chamber at the assay start could affect the movement rate to the bottom chamber, and short travel distances existed between the top and bottom chambers; this test was considered a worst-case scenario bioassay. Our hypothesis is that resistance would be higher under field conditions where the space outside of the cover is essentially infinite (and insects have other choices for feeding and moisture) and insects must travel larger distances in many cases to find the covered plant. Therefore, the level of bite resistance in the Petri dish assay should not be automatically considered the same as that in a real world, field application for any of the textiles studied. More detailed research will be needed to understand the important interactions between pore size, thickness, and the tortuous path of a textile and the many different insect body sizes and behavior, crop plants, and environmental conditions possible to prevent plant herbivory. In the case of mosquitoes, real-world percentage penetration could be mathematically defined with a high level of accuracy [17].
Exclusion of insects from plants cannot come at the cost of adversely affecting plant agronomics. Since Plant Armor Gen 2 had high H. zea resistance to penetration in both Petri dish assays and longer-term small cage, laboratory studies and Gen 1 and 2 demonstrated higher resistance to tobacco thrips adults, small field plot trials were conducted to compare their impact on plant growth compared to a Proteknet positive control. The physical characterization of each textile showed that we had similar water and moisture vapor transmission but light penetration was reduced by 20 and 25% and air permeability by 40 and 71% for Gen 1 and Gen 2, respectively, compared to Proteknet. Over a 3-month small field plot study with covered versus uncovered cabbage, plant size based on plant total wet and dry weight was about twice that of uncovered plants for Gen 1 and 2. This difference did not occur for Proteknet. The increased plant size above ground of the covered plants was clearly visible before the plants with their roots were removed from the soil. No differences in temperature or humidity under the plant covers compared to outside of the cover for all three textiles was found. The field plots were in direct sunlight and not shaded. There was a difference in the size of the plants overall between the different raised beds; the smallest plants were in the Proteknet plot, followed by Gen 2 and then Gen 1. The reason for these differences between plots is unknown, but since comparisons were made between uncovered and covered plants in the same plot, the study conclusions are reasonable (but require further study).
The effect of shade nets on plant agronomics was described before [20,28,29]. Shade from netting provided a favorable plant respiration rate [30] and lowered surface temperature [21,30,31], provided a more amenable microclimate under the cloth [23,24,32], and improved the richness of leaves [33]. Shade cloth color also affected plant growth [34]. Gen 1 and 2 provided greater shading than Proteknet as measured by our light penetration experiments; the visual color of the cloths tested were similar. Other possible reasons that the Gen 1 and 2 covered plants were larger compared to uncovered plants may be due to better soil moisture retention because of shading, differences in either the plant, soil, or both microbiomes, lower insect and animal plant damage, reduced competition with weeds, and the growth of larger leaves to compensate for less light.

5. Conclusions

In conclusion, we have shown proof of concept that spacer fabrics are an effective insect barrier for plant protection from insects and can promote plant growth. Martindale abrasion studies showed that Plant Armor Gen 1 and 2 were more durable than our control textile. However, there were large differences in fabric mass per unit area. Proteknet was 32.3, Gen-1 492.1, and Gen-2 145.9 g/m2. The differences in weight per unit area and the increased knitting time for spacer fabrics comes with a higher cost that needs further assessment versus the repetitive use for a 3-D fabric, its reduced impact on the environment by recycling, and its favorable impact on plant agronomics. The 3-D fabrics have other advantages, for example, the cost of covering a greenhouse with Plant Armor would be significantly less than glass or hard plastics. The permeability of the fabric will take advantage of rain, reduce over-heating, and conserve water. Plant Armor Gen 1 and 2 were still usable after 3 years in the field (data not shown) and can be produced from recycled plastics. The impact of natural environmental factors and pesticide and fertilizer use also need consideration on the durability of Plant Armor.

Author Contributions

Conceptualization, A.J.W., M.G.M., B.K., J.M.D. and R.M.R.; methodology, G.L.C., A.J.W., M.G.M., B.K., J.B.B., J.M.D., K.L. and R.M.R.; investigation, G.L.C., A.J.W., B.K., J.B.B., J.M.D. and K.L.; resources, A.J.W., M.G.M., B.K. and R.M.R.; writing—original draft, G.L.C., J.M.D. and R.M.R.; writing—review and editing, G.L.C., A.J.W., M.G.M., B.K., J.B.B., J.M.D., K.L. and R.M.R.; supervision, A.J.W., M.G.M., B.K., J.M.D. and R.M.R.; project administration, A.J.W., M.G.M., B.K. and R.M.R.; funding acquisition, A.J.W., M.G.M., B.K. and R.M.R. All authors have read and agreed to the published version of the manuscript.

Funding

This paper is based upon work supported by the National Institute of Food and Agriculture, U.S. Department of Agriculture, under Agreement No. (2015-33610-23785) of the Small Business Innovation Research Grants Program. Any opinions, findings, and conclusions, or recommendations expressed in this publication are those of the author(s) and do not necessarily reflect the view of the U.S. Department of Agriculture. G.L.C. was supported in part by a teaching assistantship from NC State University. G.L.C. and R.M.R. are supported by the NC Agricultural Experiment Station.

Institutional Review Board Statement

Not applicable.

Data Availability Statement

All data is available in the main text.

Acknowledgments

Thanks to Jiwei Zhu, Robert Mitchell III, and Anirudh Dhammi.

Conflicts of Interest

A.J.W, M.G.M. and R.M.R. have competing interests.

References

  1. Deutsch, C.A.; Tewksbury, J.J.; Tigchelaar, M.; Battisti, D.S.; Merrill, S.C.; Huey, R.B.; Naylor, R.L. Increase in crop losses to insect pests in a warming climate. Science 2018, 361, 916–919. [Google Scholar] [CrossRef] [PubMed] [Green Version]
  2. Lehmann, P.; Ammunét, T.; Barton, M.; Battisti, A.; Eigenbrode, S.D.; Jepsen, J.U.; Kalinkat, G.; Neuvonen, S.; Niemelä, P.; Terblanche, J.S.; et al. Complex responses of global insect pests to climate warming. Front. Ecol. Environ. 2020, 18, 141–150. [Google Scholar] [CrossRef] [Green Version]
  3. Radcliffe, E.; Hutchison, W.; Cancelado, R. Integrated Pest Management: Concepts, Tactics, Trategies and Case Studies; Cambridge University Press: Cambridge, UK, 2008. [Google Scholar]
  4. Abrol, D.P. Integrated Pest Management: Current Concepts and Ecological Perspective; Elsevier: New York, NY, USA, 2014. [Google Scholar]
  5. Roe, R.M.; North Carolina State University, Raleigh, NC, USA. Personal Communication. 2022. [Google Scholar]
  6. Moar, W.; Roush, R.; Shelton, A.; Ferré, J.; MacIntosh, S.; Leonard, B.R.; Abel, C. Field-evolved resistance to Bt toxins. Nat. Biotechnol. 2008, 26, 1072–1074. [Google Scholar] [CrossRef] [PubMed]
  7. Huang, F.; Qureshi, J.A.; Meagher, R.L.; Reisig, D.D.; Head, G.P.; Andow, D.A.; Ni, X.; Kerns, D.; Buntin, G.D.; Niu, Y.; et al. Cry1F resistance in fall armyworm Spodoptera frugiperda: Single gene versus pyramided Bt maize. PLoS ONE 2014, 9, e112958. [Google Scholar] [CrossRef] [Green Version]
  8. Balabanidou, V.; Grigoraki, L.; Vontas, J. Insect cuticle: A critical determinant of insecticide resistance. Curr. Opin. Insect Sci. 2018, 27, 68–74. [Google Scholar] [CrossRef]
  9. Reisig, D.D.; Huseth, A.S.; Bacheler, J.S.; Aghaee, M.A.; Braswell, L.; Burrack, H.J.; Flanders, K.; Greene, J.K.; Herbert, D.A.; Jacobson, A.; et al. Long-term empirical and observational evidence of practical helicoverpa zea resistance to cotton with pyramided bt toxins. J. Econ. Entomol. 2018, 111, 1824–1833. [Google Scholar] [CrossRef]
  10. Guedes, R.N.C.; Roditakis, E.; Campos, M.R.; Haddi, K.; Bielza, P.; Siqueira, H.A.A.; Tsagkarakou, A.; Vontas, J.; Nauen, R. Insecticide resistance in the tomato pinworm Tuta absoluta: Patterns, spread, mechanisms, management and outlook. J. Pest Sci. 2019, 92, 1329–1342. [Google Scholar] [CrossRef]
  11. Storer, N.P.; Babcock, J.M.; Schlenz, M.; Meade, T.; Thompson, G.D.; Bing, J.W.; Huckaba, R.M. Discovery and characterization of field resistance to Bt Maize: Spodoptera frugiperda (Lepidoptera: Noctuidae) in Puerto Rico. J. Econ. Entomol. 2010, 103, 1031–1038. [Google Scholar] [CrossRef]
  12. Tabashnik, B.E.; Carrire, Y. Field-evolved resistance to Bt cotton: Bollworm in the U.S. and pink bollworm in India. Southwest. Entomol. 2010, 35, 417–424. [Google Scholar] [CrossRef]
  13. Tefera, T.; Mugo, S.; Mwimali, M.; Anani, B.; Tende, R.; Beyene, Y.; Gichuki, S.; Oikeh, S.O.; Nang’ayo, F.; Okeno, J.; et al. Resistance of Bt-maize (MON810) against the stem borers Busseola fusca (Fuller) and Chilo partellus (Swinhoe) and its yield performance in Kenya. Crop Prot. 2016, 89, 202–208. [Google Scholar] [CrossRef] [Green Version]
  14. Shew, A.M.; Danforth, D.M.; Nalley, L.L.; Nayga, R.M.; Tsiboe, F.; Dixon, B.L. New innovations in agricultural biotech: Consumer acceptance of topical RNAi in rice production. Food Control 2017, 81, 189–195. [Google Scholar] [CrossRef]
  15. Mouhamadou, C.S.; Luan, K.; Fodjo, B.K.; West, A.J.; McCord, M.G.; Apperson, C.S.; Roe, R.M. Development of an insecticide-free trapping bednet to control mosquitoes and manage resistance in malaria vector control: A new way of thinking. Insects 2020, 11, 732. [Google Scholar] [CrossRef] [PubMed]
  16. Luan, K.; West, A.J.; McCord, M.G.; Denhartog, E.A.; Shi, Q.; Bettermann, I.; Li, J.; Travanty, N.V.; Mitchell, R.D.; Cave, G.L.; et al. Mosquito-textile physics: A mathematical roadmap to insecticide-free, bite-proof clothing for everyday life. Insects 2021, 12, 636. [Google Scholar] [CrossRef] [PubMed]
  17. Basile, B.; Giaccone, M.; Cirillo, C.; Ritieni, A.; Graziani, G.; Shahak, Y.; Forlani, M. Photo-selective hail nets affect fruit size and quality in Hayward kiwifruit. Sci. Hortic. 2012, 141, 91–97. [Google Scholar] [CrossRef]
  18. Chouinard, G.; Veilleux, J.; Pelletier, F.; Larose, M.; Philion, V.; Cormier, D. Impact of exclusion netting row covers on arthropod presence and crop damage to ‘Honeycrisp’ apple trees in North America: A five-year study. Crop Prot. 2017, 98, 248–254. [Google Scholar] [CrossRef]
  19. Bosančić, B.; Mićić, N.; Blanke, M.; Pecina, M. A main effects meta principal components analysis of netting effects on fruit: Using apple as a model crop. Plant Growth Regul. 2018, 86, 455–464. [Google Scholar] [CrossRef]
  20. Kong, Y.; Avraham, L.; Perzelan, Y.; Alkalai-Tuvia, S.; Ratner, K.; Shahak, Y.; Fallik, E. Pearl netting affects postharvest fruit quality in “Vergasa” sweet pepper via light environment manipulation. Sci. Hortic. 2013, 150, 290–298. [Google Scholar] [CrossRef]
  21. Nordey, T.; Deletre, E.; Mlowe, N.; Martin, T. Small mesh nets protect tomato plants from insect pests and increase yields in eastern Africa. J. Hortic. Sci. Biotechnol. 2020, 95, 222–228. [Google Scholar] [CrossRef]
  22. Nordey, T.; Deletre, E.; Mlowe, N.; Martin, T. Nethouses protect cucumber plants from insect pests and increase yields in eastern Africa. J. Hortic. Sci. Biotechnol. 2020, 95, 673–678. [Google Scholar] [CrossRef]
  23. Simon, S.; Komlan, F.A.; Adjaïto, L.; Mensah, A.; Coffi, H.K.; Ngouajio, M.; Martin, T. Efficacy of insect nets for cabbage production and pest management depending on the net removal frequency and microclimate. Int. J. Pest Manag. 2014, 60, 208–216. [Google Scholar] [CrossRef]
  24. Kiptoo, J.; Kasina, M.; Wanjala, F.; Kipyab, P.; Wasilwa, L.A.; Ngouajio, M.; Martin, T. Use of low cost pest exclusion nets can boost cabbage yield. East Afr. Agric. For. J. 2015, 81, 112–119. [Google Scholar] [CrossRef]
  25. Bergquist, S.Å.M.; Gertsson, U.E.; Nordmark, L.Y.G.; Olsson, M.E. Ascorbic acid, carotenoids, and visual quality of baby spinach as affected by shade netting and postharvest storage. J. Agric. Food Chem. 2007, 55, 8444–8451. [Google Scholar] [CrossRef] [PubMed]
  26. Vatsanidou, A.; Bartzanas, T.; Papaioannou, C.; Kittas, C. Efficiency of physical means of IPM on insect population control in greenhouse crops. Acta Hortic. 2011, 893, 1247–1254. [Google Scholar] [CrossRef]
  27. Finney, D.J. Probit Analysis, 3rd ed.; Cambridge University Press: New York, NY, USA, 1971. [Google Scholar]
  28. Costa, L.C.B.; Pinto, J.E.B.P.; Castro, E.M.; Alves, E.; Rosal, L.F.; Bertolucci, S.K.V.; Alves, P.B.; Evangelino, T.S. Yield andcomposition of the essential oil of ocimum selloi benth. Cultivated under colored netting. J. Essent. Oil Res. 2010, 22, 34–39. [Google Scholar] [CrossRef]
  29. Ilić, Z.S.; Milenković, L.; Šunić, L.; Fallik, E. Effect of coloured shade-nets on plant leaf parameters and tomato fruit quality. J. Sci. Food Agric. 2015, 95, 2660–2667. [Google Scholar] [CrossRef] [PubMed]
  30. Mira-García, A.B.; Conejero, W.; Vera, J.; Ruiz-Sánchez, M.C. Leaf water relations in lime trees grown under shade netting and open-air. Plants 2020, 9, 510. [Google Scholar] [CrossRef] [PubMed] [Green Version]
  31. McCaskill, M.R.; McClymont, L.; Goodwin, I.; Green, S.; Partington, D.L. How hail netting reduces apple fruit surface temperature: A microclimate and modelling study. Agric. For. Meteorol. 2016, 226–227, 148–160. [Google Scholar] [CrossRef]
  32. Gogo, E.O.; Saidi, M.; Ochieng, J.M.; Martin, T.; Baird, V.; Ngouajio, M. Microclimate modification and insect pest exclusion using agronet improve pod yield and quality of French bean. HortScience 2014, 49, 1298–1304. [Google Scholar] [CrossRef]
  33. Martin, T.; Simon, S.; Parrot, L.; Komlan, F.A.; Vidogbena, F.; Adegbidi, A.; Baird, V.; Saidi, M.; Kasina, M.; Wasilwa, L.A.; et al. Eco-friendly nets to improve vegetable production and quality in sub-Saharan Africa. Acta Hortic. 2015, 1105, 221–227. [Google Scholar] [CrossRef]
  34. Mashabela, M.N.; Selahle, K.M.; Soundy, P.; Crosby, K.M.; Sivakumar, D. Bioactive Compounds and Fruit Quality of Green Sweet Pepper Grown under Different Colored Shade Netting during Postharvest Storage. J. Food Sci. 2015, 80, H2612–H2618. [Google Scholar] [CrossRef]
Figure 1. (A) Schematic of Petri dish bioassay to measure textile penetration rate for adult Frankliniella fusca (Hinds) and neonates of Helicoverpa zea (Boddie). On bottom left of Figure 1 (A) is a side view and bottom right a top view of Plant Armor Generation (Gen) 2 in the Petri dish bioassay. (B) Whole plant penetration bioassay architecture with Helicoverpa zea neonates. (C,D) Small field plots (wooden, raised beds) to study plant growth. Cabbage (3–4 leaf stage, shown in (C)) were planted in each raised bed in the pattern shown in (D). This pattern was duplicated on the right side (shown as a white background because the plants were covered with Proteknet, Plant Armor Generation (Gen) 1 or Plant Armor Gen 2. (C) The plantings before the cover was added to the right half of each plot are shown. The “X” on (D) is the location 19 cm from ground level where temperature and humidity measurements were taken for the control (uncovered plants) and treatments (covered plants); control measurements were made only in the Plant Armor Gen 2 plot. Preliminary studies showed no differences in temperature and humidity for the control location between plots.
Agriculture 12 00498 g001
Figure 2. (A) Model of a 3-D spacer fabric as an insect barrier for crop production; (B) Proteknet, a commercially available knitted fabric for plants; (C,D) Plant Armor Generation (Gen) 1, a knitted, spacer fabric showing the top with large holes (C) and underside facing the covered plants with smaller holes (D); and (E) Plant Armor Gen 2, a knitted, spacer fabric that looks the same on both sides. See Materials and Methods for the knitting of Plant Armor Gen 1–2. Magnification is 5X for (BE).
Agriculture 12 00498 g002
Figure 3. Physical properties of the textiles studied. (A) Average g/m2; (B) percentage penetration of sunlight; (C) water penetration (insert showing device to measure water penetration (EB, electronic balance; CNT, container to hold water; MC, microcentrifuge tube); (D) air permeability; and (E) moisture vapor transmission across Proteknet and Plant Armor Generation (Gen) 1 and 2. Error bars are ±1 SEM. In some cases, the error bars were too small to be visible. Treatments that were statistically significantly different as determined by ANOVA and Tukey’s test are indicated by different letters on the bar graph (exception was for (C) where there was no variation between replicates for each treatment).
Agriculture 12 00498 g003
Figure 4. (A) Martindale abrasion device; (B) number of revolutions to reach the abrasion endpoint; and (C) abrasion endpoints. The endpoint was reached for Plant Armor when the first beginning of a visible hole was seen as shown by the circles in (C). The endpoint for Proteknet is shown in (C). In (C) for Generation (Gen) 1, the textile top surface is shown on the left and the bottom on the right (bottom = surface facing the covered plant). Error bars are ±1 SEM. Treatments that were statistically significantly different as determined by ANOVA and Tukey’s test are indicated by different letters on the bar graph.
Agriculture 12 00498 g004
Figure 5. Penetration of unsexed adult thrips, Frankliniella fusca, versus time in the Petri dish bioassay (Figure 1A) for Proteknet (A) and Plant Armor Generation (Gen) 1 (B) and Gen 2 (C). The error bars are ±1 SEM which in some cases were smaller than the size of the symbol and not visible. (D) Probit models and time to 50% penetration. TP50s followed by different letters were significantly different from the other TP50s based on non-overlap of the 95% confidence intervals.
Agriculture 12 00498 g005
Figure 6. Penetration of neonate caterpillars of the bollworm, Helicoverpa zea, versus time in the Petri dish bioassay (Figure 1) for Proteknet and Plant Armor Generation (Gen) 1 and 2 textiles. The error bars are ±1 SEM. The probit model data are shown beneath the graph. A probit model for Plant Armor Gen 2 could not be determined because penetration never exceeded 11%.
Agriculture 12 00498 g006
Figure 7. Whole plant penetration (WPP) bioassay with bollworm, Helicoverpa zea, neonate caterpillars. (A) Number of neonates that penetrated Plant Armor Generation (Gen) 1 versus number found on the uncovered plants at different days after the study was started (the zeros shown were for Plant Armor Gen 2 where no larvae were found on the plants). Condition of the plants 10 days after the start of the bioassay is presented for uncovered (B) and covered (C) plants. A window made of transparent plastic was glued to the Plant Armor as shown in (C) to monitor H. zea penetration. Error bars are ±1 SEM.
Agriculture 12 00498 g007
Figure 8. Cabbage at 90 days under (A) Proteknet, (B) Plant Armor Generation (Gen) 1 and (C) Plant Armor Gen 2; (D) plant wet weight; and (E) plant dry weight. The error bars are ±1 SEM. Treatments that were statistically significantly different, according to ANOVA and Tukey’s test, are indicated by different letters on the bar graph.
Agriculture 12 00498 g008
Figure 9. Temperature outside (control) and under Proteknet, Plant Armor Generation (Gen) 1, and Plant Armor Gen 2 at (A) 1200 and (B) 2400; and percentage humidity outside and under the textile at (C) 1200 and (D) 2400 over the same 7 days. Sunrise was approximately 7:00 a.m. (0700) and sunset at 7:30 p.m. (1930). Location of measurements under the textiles are shown in Figure 1D.
Agriculture 12 00498 g009
Publisher’s Note: MDPI stays neutral with regard to jurisdictional claims in published maps and institutional affiliations.

