Communication

Nitrate Concentration in Leachate—Essential Information for Reducing Nitrogen Surplus and Groundwater Pollution from Agricultural Land in Slovakia

1
Water Research Institute, Nábr. Arm. Gen. L. Svobodu 5, 81249 Bratislava, Slovakia
2
National Agricultural and Food Centre, Soil Science and Conservation Research Institute, Trenčianska 55, 82109 Bratislava, Slovakia
3
Department of Geography and Applied Geoinformatics, Faculty of Human and Natural Sciences, Prešov University, Ul. 17. Novembra 1, 08001 Prešov, Slovakia
*
Author to whom correspondence should be addressed.
Agriculture 2022, 12(4), 493; https://doi.org/10.3390/agriculture12040493
Submission received: 25 January 2022 / Revised: 11 March 2022 / Accepted: 29 March 2022 / Published: 31 March 2022
(This article belongs to the Section Agricultural Water Management)

Abstract

:
The aim of the study was to detect nitrate concentrations in leachate within agricultural land in three districts of Slovakia, namely Nitra, Nové Zámky and Dunajská Streda as well as in the DEEPWATER-CE pilot area. Using the average values of leachable nitrogen in the period 2015–2018 and the long-term amount of percolated water, the nitrate concentration values in leachate were detected. In most defined groundwater monitoring sites, the current nitrogen surplus and corresponding nitrate concentration in leachate create preconditions for the gradual reduction of groundwater nitrate pollution. However, in some groundwater monitoring places, especially in the Nitra district, the nitrate concentration in leachate exceeds 50 mg L−1, which is completely unacceptable from the point of groundwater pollution. In detected hot-spots, it is necessary to reduce the nitrogen surplus up to 15 kg ha−1 on average per year. In this sense, the nitrate concentration in leachate is an important indicator for the revision of existing measures in agriculture.

1. Introduction

Groundwater pollution by nitrates remains a persistent environmental problem requiring more attention. The importance of this topic is confirmed by many findings at both national and international levels [1,2,3,4,5]. Although considerable effort has been made to reduce nitrate concentration in water, especially since the enactment of the Nitrates Directive (91/676/EEC), the expected effect in groundwater has not been reached [2,6,7,8]. In addition, reaching the limit established by the Nitrates Directive can take decades in many locations owing to low rates of degradation or long lag times in the transport of water and solutes in the vadose and saturated zones [9,10,11,12,13].
Nevertheless, as indicated by the EU Biodiversity Strategy to 2030 and the Farm to Fork Strategy, the European Commission continues to promote further reduction of fertilizer application as well as the reduction of unproductive nutrient losses into the water and air. Therefore, the issue of reduction of above-limit nitrate concentration in groundwater remains highly pertinent from political, scientific and best-practice viewpoints.
Although the excessive load of nitrogen from agricultural practices is still considered a primary reason for water pollution by nitrates, current information on nitrogen surpluses and nitrate concentration in groundwater shows that there is not always a direct or unambiguous relationship between these two indicators [14,15,16]. Clearly, the nitrogen surplus, the qualitative risk of groundwater pollution by nitrogen [17,18,19,20,21] and the leaching rates of nitrogen into the waters [15,22,23,24,25] can serve as the basis for relevant hot-spot definition. However, the consideration of hydrological or hydro-geochemical properties of a specific site [5,7,9,10,26,27] is essential in assessing the impact of leached nitrogen on overall nitrate concentration in groundwater and on the sufficiency or inadequacy of the measures taken. Consequently, the targeted addressing of the problem in hot-spots where nitrate concentration in seepage water exceed the Nitrates Directive limit is essential [1,28,29,30,31]. This is particularly important in aquifers, where the capacity to reduce nitrates is low or depleted and dilution represents the only mechanism for decreasing nitrate concentration in groundwater [26].
Until the whole country is included in the Nitrates Directive vulnerable zones, these could serve as priority areas for the implementation of more targeted and consistent measures. As is being documented by a significant number of publications [27,29,30,31,32,33,34], even within defined vulnerable zones, the efficiency of adopted measures is significantly influenced both by their allocation and the character of soil-climatic and hydrological conditions.
As was already mentioned, the diffuse pollution of groundwater by nitrates, in which agriculture plays a significant role, represents an issue to be addressed systematically. Any consolidation of existing measures or the adoption of new ones should be enforced on the basis of objective comprehensive information [5,9,10,11,12,13,35,36] and not only as a result of longing public expectations and force majeure occurrence [12]. Otherwise, the much-needed cooperation between the water management sector and agriculture remains suboptimal.
Therefore, the study, based on the examples of selected districts, aims to detect current nitrate concentration in leachate from utilized agricultural land, which provides immediate information to improve of efficiency of relevant measures in agriculture. The relatively simple procedure developed for this purpose consists of several consecutive steps: (1) the determination of nitrogen surplus within utilized agricultural land, (2) the determination of the amount of leachate, (3) the determination of leachable nitrogen and its conversion to nitrates, (4) the delineation of areas where nitrate concentration in leachate exceeds 40 mg L−1, and (5) the quantification of nitrogen surplus to be reduced.

2. Materials and Methods

2.1. Delineation of the Evaluated Area

In Slovakia, the Nitrates Directive vulnerable zones (VZs) represent the agricultural land in relevant municipal cadasters, and their list is revised every four years. With respect to the availability of input data for the nitrogen balance calculation, the local administrative units LAU-1 (districts) were applied.
Evaluation was focused on the two districts where groundwater pollution by nitrates from agricultural land is the most extensive and requires increased attention. These are the Nitra (NR) and Nové Zámky (NZ) districts, located in the western part of Slovakia (Figure 1). The choice was primarily based on the highest proportion of the groundwater monitoring sites with nitrate concentration equal to or over 50 mg L−1 as well as the monitoring sites with elevated average nitrates concentration in range 40 to 49.99 mg L−1 with an increasing trend in the period 2016–2019. The share of preselected monitoring sites with defined nitrate concentrations was 52.2% (NR) and 49.2% (NZ)—see Table 1.
Additionally, the district of Dunajská Streda (DS) was included, although the share of monitoring sites with nitrate concentrations equal to or over 40 mg L−1 was more than five times lower (9.0%). The reason for its inclusion was that a large part of this district and its utilized agricultural land (UAL) belongs to the most important protected area of natural water accumulation (PANWA) in Slovakia—Žitný ostrov—see Figure 1. Therefore, the monitoring sites with nitrate concentrations 25–39.99 mg L−1 with an increasing trend were also included (see Figure 2, Table 1). In this district, within the DEEPWATER-CE project, one of the pilot areas was selected in order to investigate possibilities of groundwater recharge (latter pilot area, PA)—see Figure 2. Therefore, this territory was separately evaluated.
It should be recalled that the number of groundwater monitoring sites and the corresponding average values of nitrates in groundwater are based on the most recent data of the 2016–2019 period specified in the current report on the implementation of Council Directive 91/676/EEC in Slovakia [6].
Regarding agricultural land use, arable land, which includes kitchen gardens, is the clearly dominant type—over 97% of UAL. This modality is typical of intensively used agricultural areas in Slovakia while permanent cultures (orchards and vineyards) and permanent grasslands generally represent very small shares (see Table 2). The distribution of soil types classified by World Reference Base for Soil Resources—WRB (2015) is shown in Table 3.

2.2. Calculation of Nitrogen Balance and Nitrates Concentration in Leachate

Nitrogen balance represents the first step of estimation of nitrogen losses to groundwater. Gross nitrogen balance on UAL was calculated by Eurostat & OECD methodology [37]. The main input data at district level were received from the National Statistical Office (number of farm animal categories, harvested area and crop yields, as well as acreage of utilized agricultural land) and Central Control and Testing Agricultural Institute (consumption of nitrogen fertilizers). Atmospheric nitrogen deposition was derived from EMEP data for the years 2015–2018 (available at: EMEP MSC-W HOME).
The amount of nitrogen leachable to groundwater was obtained by subtracting the gaseous nitrogen losses (during animal housing, manure storage and after its application on the land [38]), and gaseous N loses via the biological denitrification in the soil as described by Kunkel et al. [26] or originally by Kunkel and Wendland [39].
Amount of nitrogen losses via denitrification in soil rooting zone was calculated by following equation:
d N s t s o i l d t s o i l + D m a x · N s t s o i l k + N s t s o i l = 0
where N s t s o i l : remaining nitrogen surplus in soil after residence time tsoil; t s o i l : residence time of percolation water in soil root zone (years); D m a x : maximum annual denitrification rate in soil (kg N ha−1 year−1); k : Michaelis constant (kg N ha−1 year−1); and 0 : displaceable nitrogen surplus in soil (kg N ha−1).
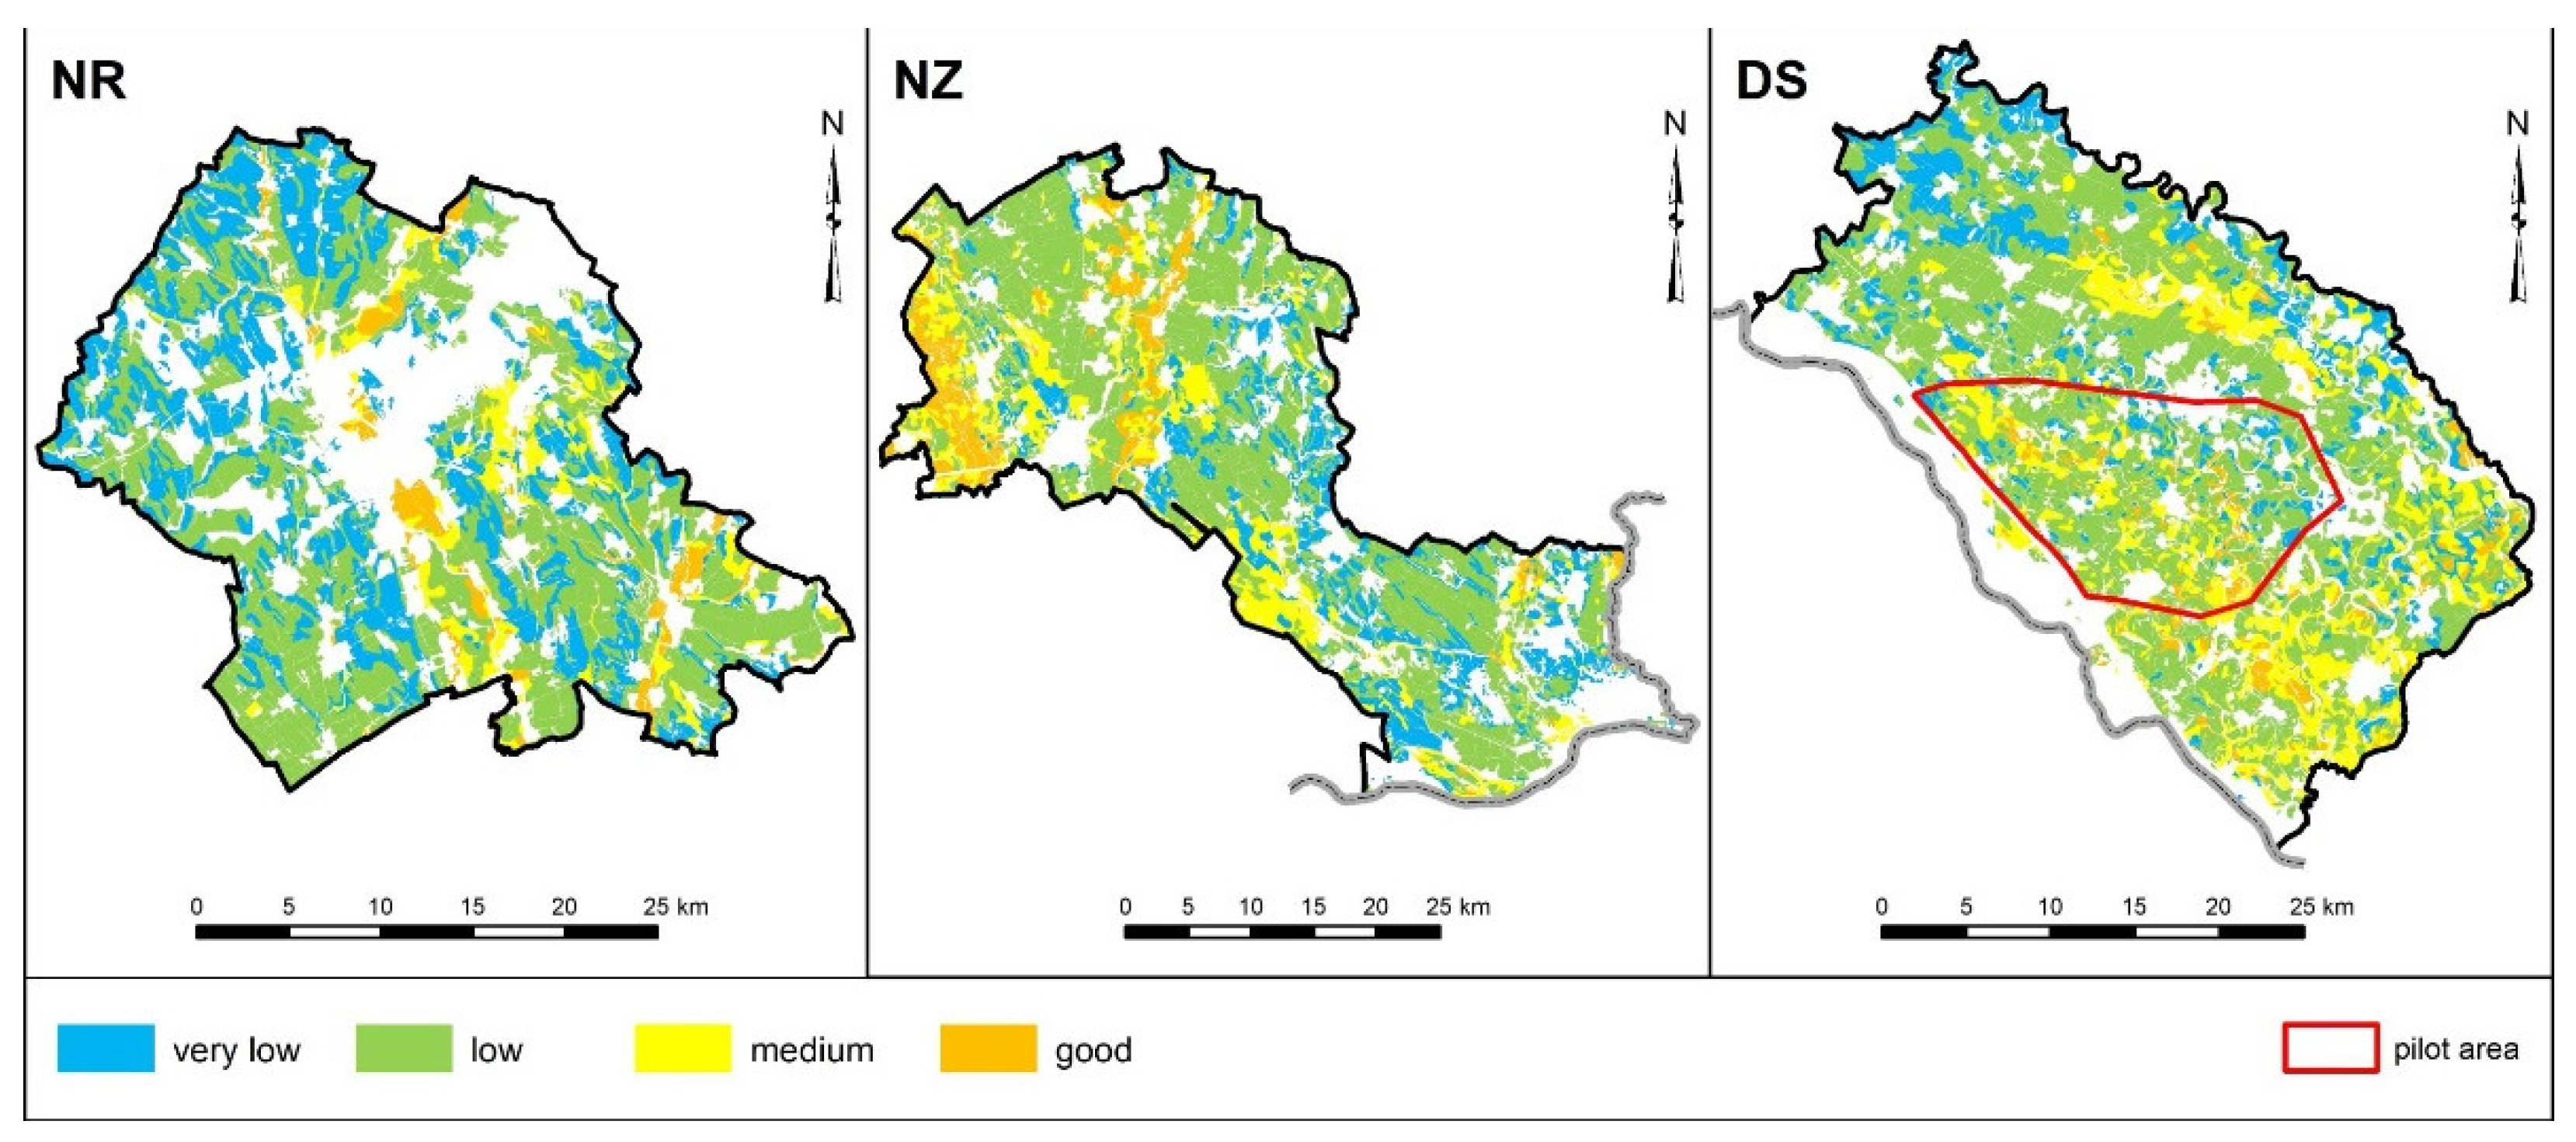
Using the soil database operated by the National Agricultural and Food Centre—Soil Science and Conservation Research institute in Bratislava, the maximum annual denitrification rate was derived from grouping of soil types (see Table 3) to four out of five groups [40]. The rates 10, 20, 40 and 60 kg N ha−1 year−1, corresponding to very low, low, medium and good soil denitrification potential were corrected by residence time of percolation water through the soil, what is given by ratio of effective field capacity of the soil and leachate rate:
t s o i l = F C e f f Q p
where t s o i l : residence time of percolation in soil root zone (years); F C e f f : effective field capacity in the soil column (mm); and Q p : the mean long-term leachate rate (mm year−1).
The amount of the mean long-term average values of leachate rate was calculated as the difference between precipitation and evapotranspiration reduced by surface runoff by formula, described by Kunkel and Wendland [39]:
Q p = P E T a Q o
where Q p : the mean long-term leachate rate (mm year−1); P : the long-term average of annual rainfall (mm year−1); E T a : real evapotranspiration calculated from the long-term annual rainfall and potential evapotranspiration (mm year−1); and Q o : surface runoff (mm year−1).
The average long-term data on precipitation and potential evapotranspiration in the period 1986–2015 distinguishing between winter and summer half-year period were obtained from the Slovak Hydrometeorological Institute. This reference period was applied to eliminate inter-annual variability and the effect of individual dry or wet years, respectively [41].
The surface runoff was calculated according to formula, described by Kunkel and Wendland [39]:
Q o = Q p · ( P 500 ) 1.65
where Q o : surface runoff (mm year−1); Q p : the mean long-term leachate rate (mm year−1); and P : the long-term average of annual rainfall (mm year−1).
The nitrogen concentration in leachate was calculated on the base of leachable nitrogen converted into nitrates and the amount of percolation water:
C N O 3 = 443   ·   N s t s o i l Q p
where C N O 3 : nitrate concentration in leachate (mg L−1); 443 : factor to convert nitrogen (mg L−1) to nitrate (mg L−1); N s t s o i l : nitrogen surplus after denitrification considered as leachable nitrogen (kg ha−1); and Q p : the mean long-term leachate rate (mm year−1).
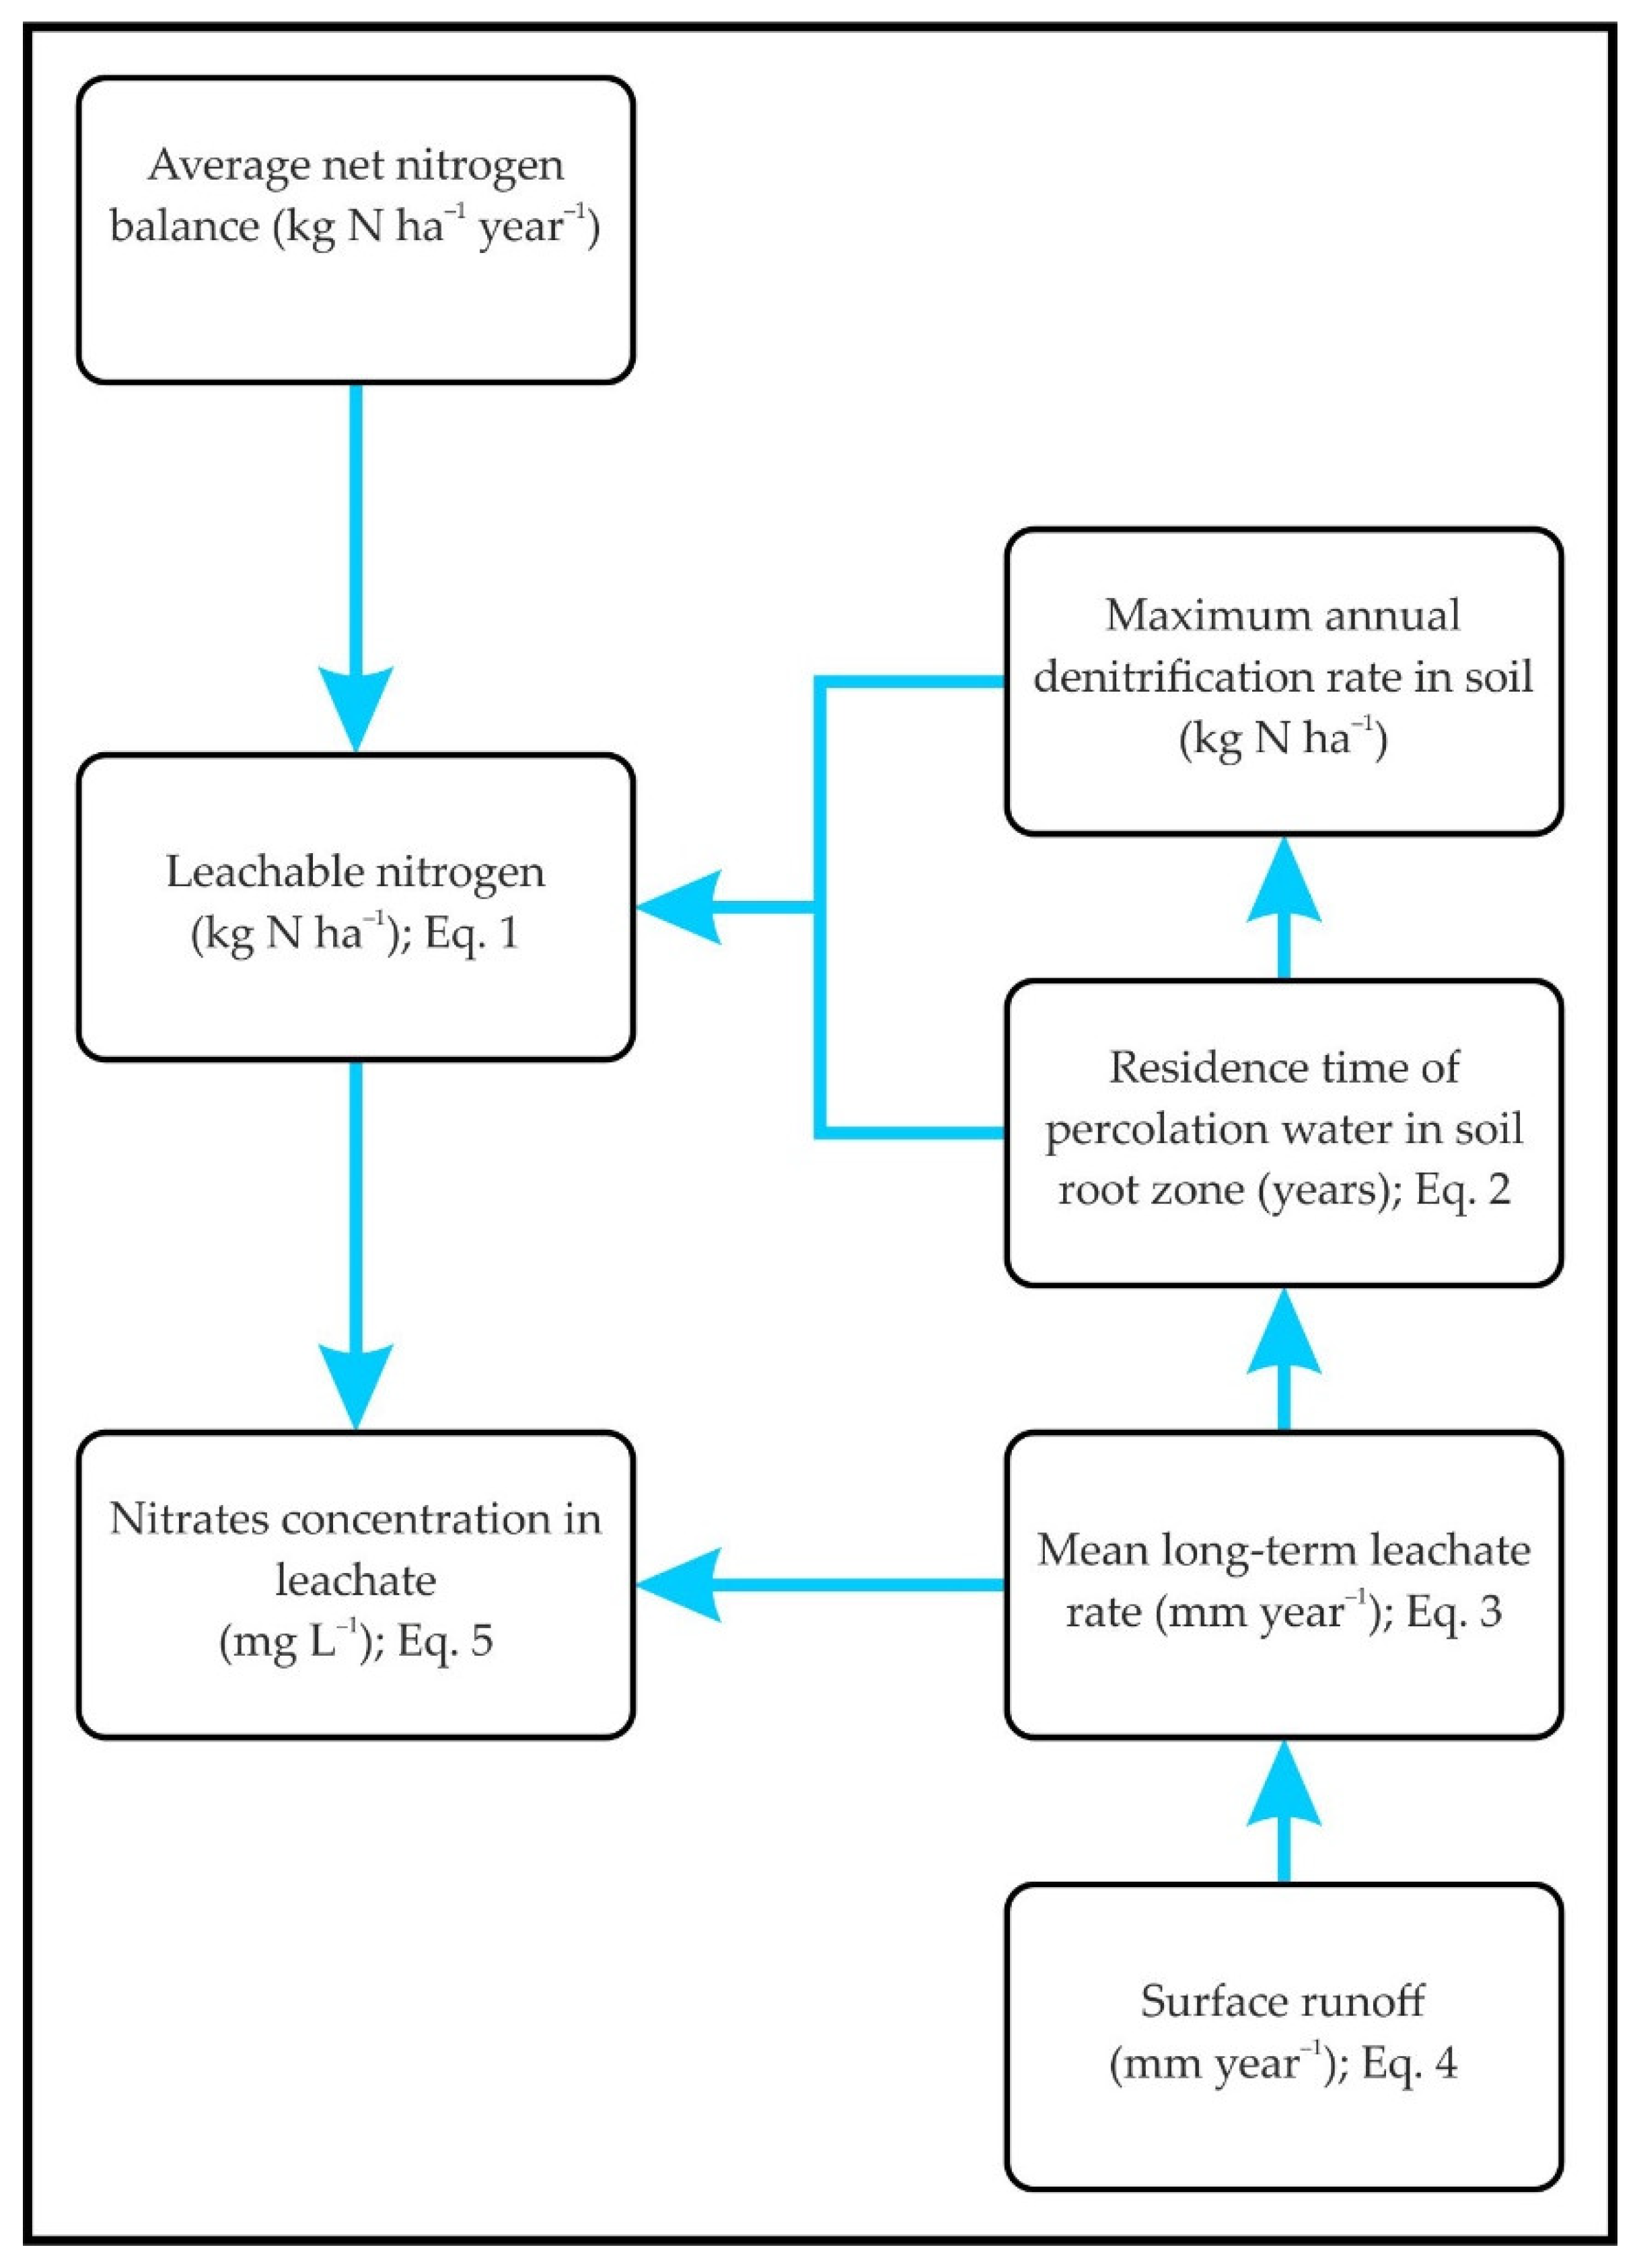
Figure 3 summarizes the above procedure.
In line with the three-step concept “critical limits—critical loses—critical inputs” [31], the need to reduce the nitrogen excess was based on the backward recalculation of leachate nitrates above 40 mg L−1 to nitrogen. This concentration, which is more stringent when compared to the value 50 mg L−1 in leachate used by other authors [30,31,33,39], should contribute to a gradual decrease of nitrate concentration in groundwater.

3. Results

The average values of gross and net nitrogen balance on UAL in individual districts and the pilot area are illustrated at Table 4.
While gross nitrogen surplus is just initial information on possible N losses into water, the net nitrogen surplus (according to Eurostat & OECD methodology [37] labelled as land budget) represents the indicator of potential N loses to groundwater. To classify the gross nitrogen balance, in Slovakia the indicative OECD limit value 50 kg ha−1 was set as middle value of medium N surplus category (40.1–60.0 kg ha−1). In the case of net nitrogen balance, the half values for individual categories could be provisionally used. In terms of this classification, the gross and net balance values as such (see Table 4) can be assessed quite favorably.
The calculation of leachable nitrogen is the next important step to determine nitrate concentration in leachate. The maximum annual denitrification rate in UAL is shown in Figure 4.
As shown in Figure 4, UAL in selected districts shows mainly very low and low conditions for denitrification with shares over 75% (NZ = 75.5%, DS = 76.3%, and NR = 87.5%). In the pilot area, the conditions are almost equal to DS district (73.2%).
The detected share of UAL in selected districts with residence time of percolation water over one year (see Figure 5) is more than 75%. In the pilot area, it accounts for 75%. From the soil denitrification aspect, it can be assessed as favorable. It can no longer be claimed about the share of UAL with a residence time of percolation water up to 0.25 years, which is considerable especially in the district of Dunajská Streda (7.6%).
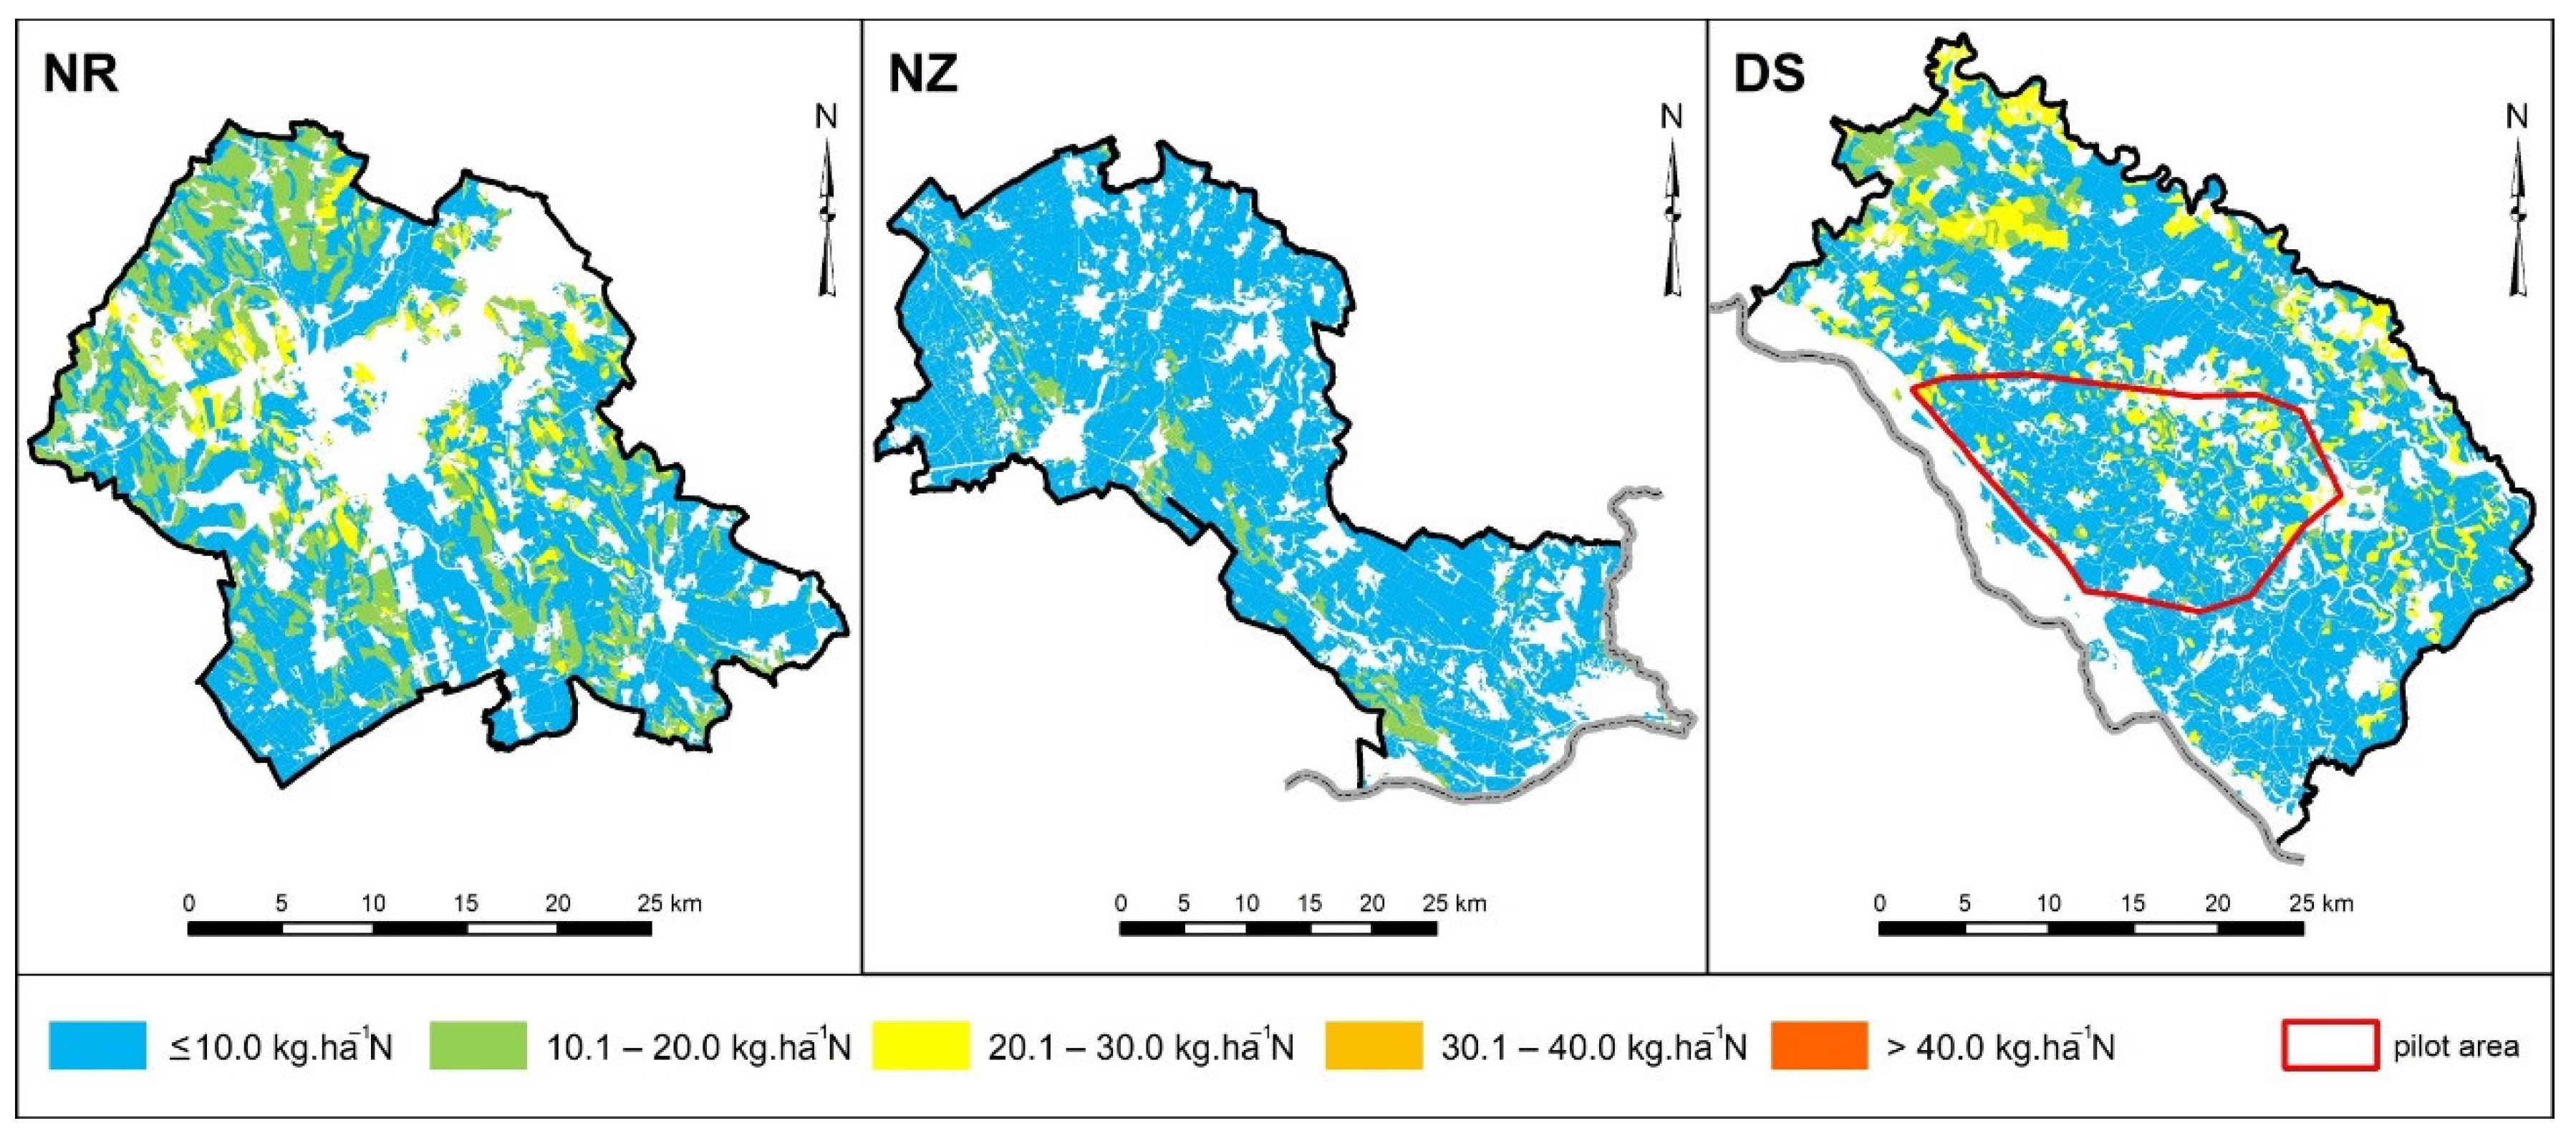
The amount of leachable nitrogen after losses via denitrification in the soil rooting zone is illustrated in Figure 6. As it can be seen, the lowest values are detected in district Dunajská Streda, followed by the Nové Zámky and Nitra districts. The share of UAL with displaceable nitrogen below 10 kg ha−1 decreases in the order NZ (94.1%) > DS (80.5%) > NR (67.7%). In the pilot area, this share is little bit higher than in the whole DS district (85.3%).
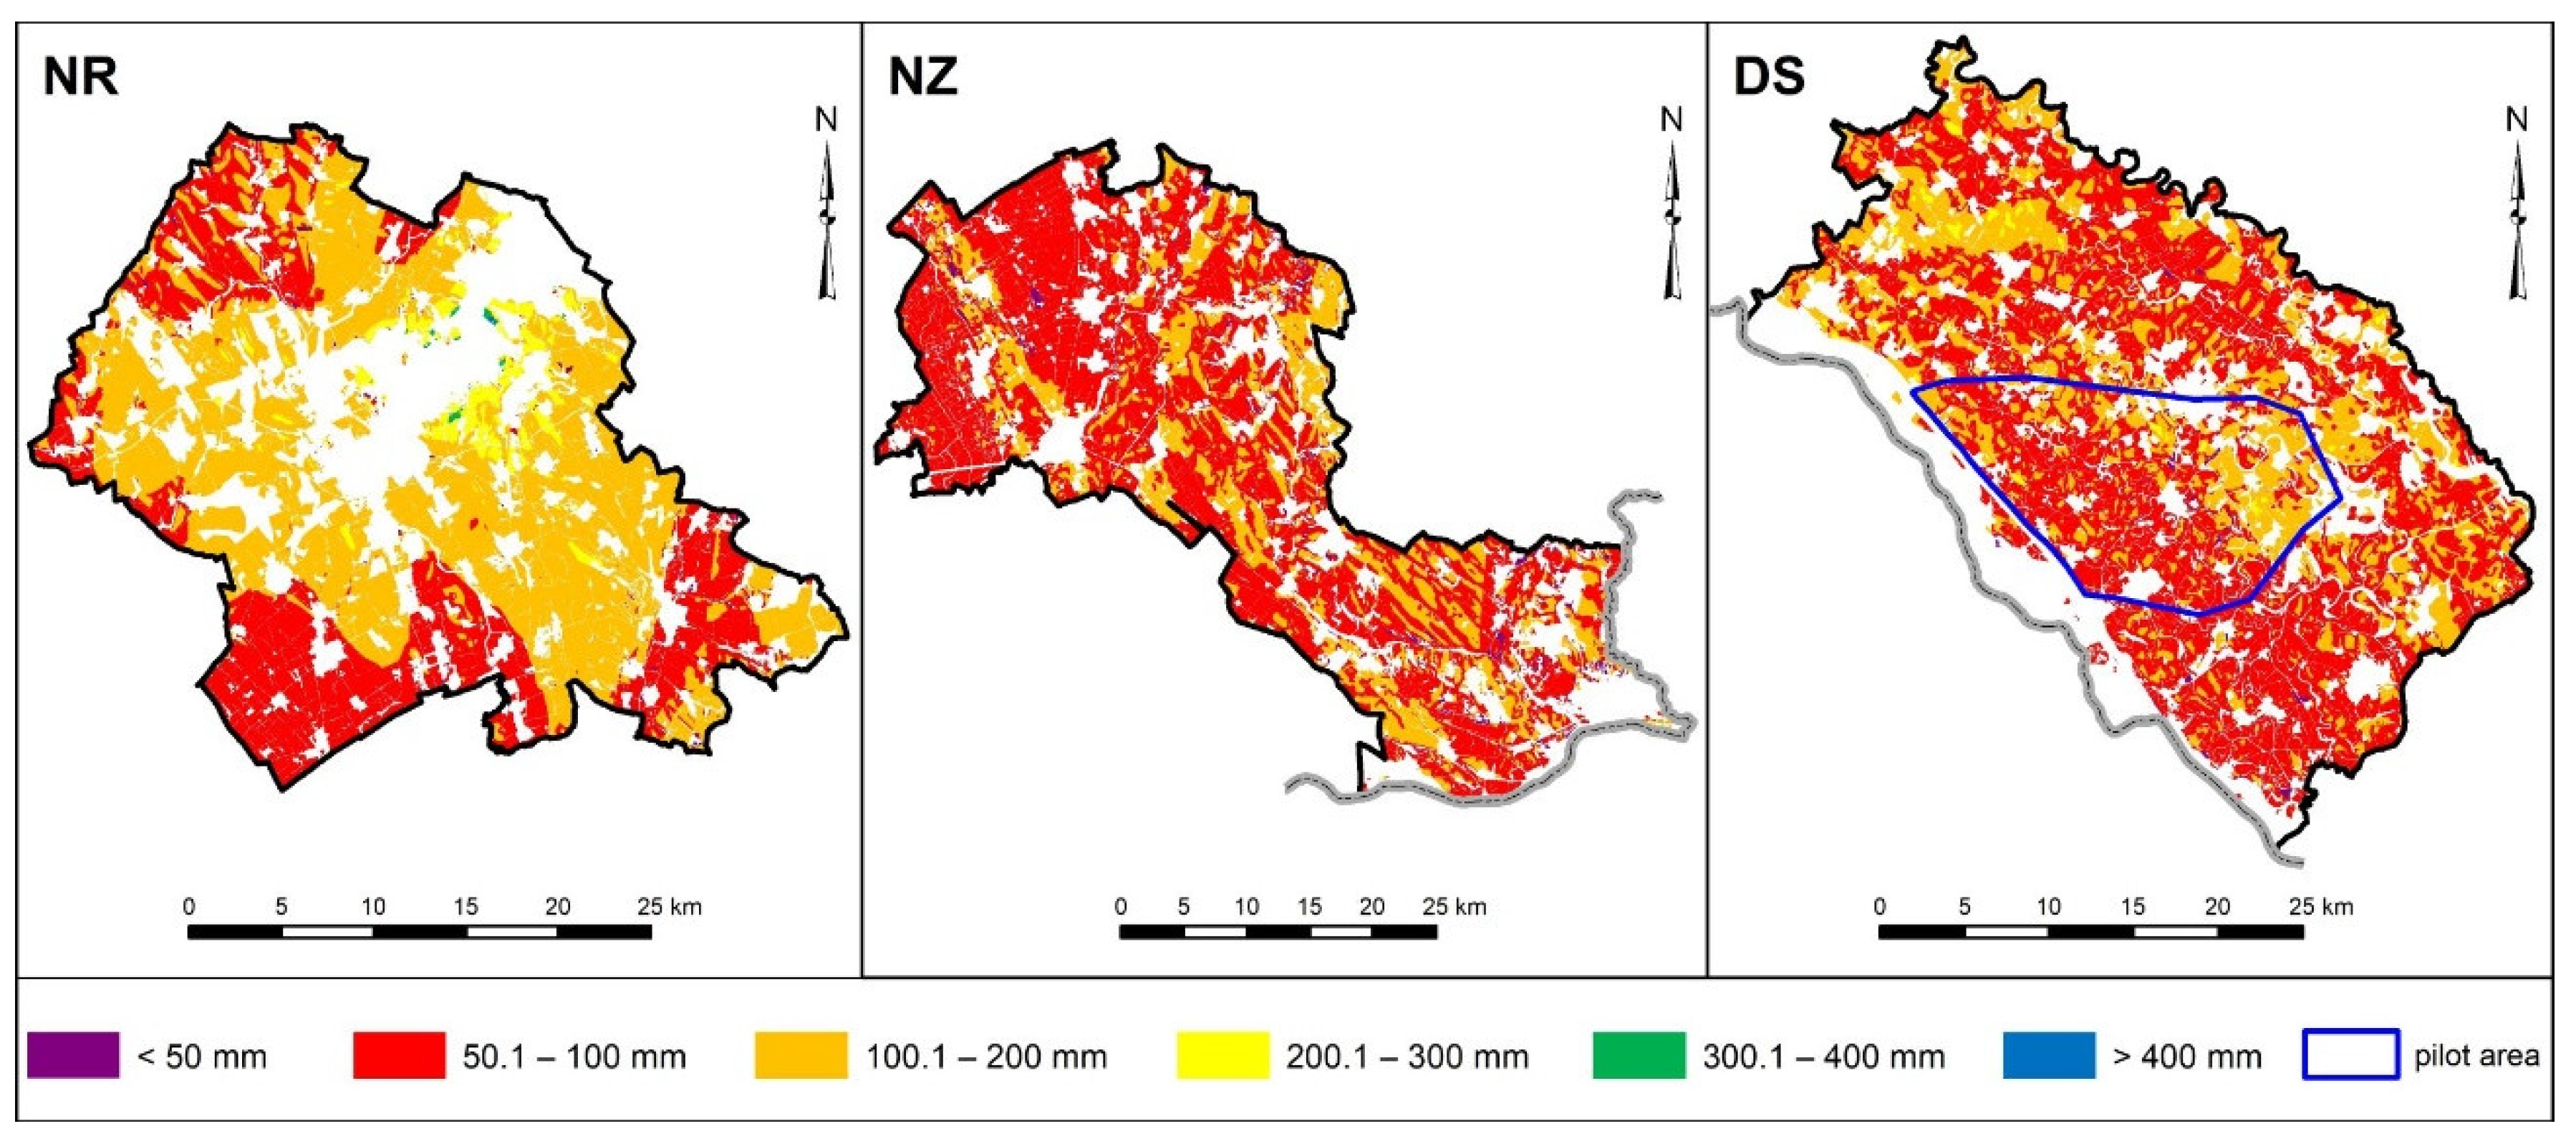
The amount of percolation water within UAL of selected districts (see Figure 7) corresponds to typical annual values up to 200 mm, which occur at precipitation totals around 600 mm in areas with warm climate.
The mean long-term nitrate concentrations in leachate show some differences (Figure 8). The share of UAL where nitrate concentrations are ≥40 mg L−1 decreases in the order NR (25.9%) > DS (12.2%) > NZ (2.5%). In the pilot area, it is slightly higher than in the DS district (13.3%). In corresponding areas, a targeted reduction in the nitrogen balance surplus should be considered in order to ensure a gradual decrease of nitrate concentration in groundwater or to secure the current good status where detected.
Finally, the comparison of nitrate concentration in leachate with their values in groundwater monitoring sites are shown in Table 5. The average nitrate concentration in leachate might contribute to the gradual decrease of concentration of nitrates in most groundwater monitoring sites. However, in some groundwater monitoring sites, especially in the Nitra district, the nitrates concentration in leachate goes beyond 50 mg L−1 what is completely unacceptable from the point of groundwater pollution. Currently, the concentration range of nitrates in groundwater monitoring sites within the pilot area are out of the pre-defined range.
The need to reduce the balance surplus of nitrogen to subsequently ensure the average nitrates concentration in seepage water at 40 mg L−1 is illustrated in Table 6.
As Table 6 shows, the average reduction in annual N surplus to ensure a nitrate concentration of 40 mg L−1 in leachate does not exceed 15 kg N ha−1 in detected hot-spot areas which are shown in Figure 8. The largest share of UAL acreage in hot-spot areas falls within the reduction of nitrogen surplus only up to 10 kg N ha−1, especially for the districts of Nitra and Dunajská Streda. On the other hand, no need to reduce the nitrogen surplus in the Nové Zámky district is anticipated at present. The situation in the pilot area is more favorable compared to the Dunajská Streda district. In the corresponding hot-spot area, where it is necessary to reduce the excess of nitrogen, the category 0.1 to 5 kg N ha−1 prevails.

4. Discussion

Water monitoring is an essential tool to address the current status of groundwater pollution and to identify how far it is from reaching the desired environmental level [42], but on its own it cannot to be used to predict the further development of water quality and the effect of the measures adopted in agriculture [43,44,45]. Likewise, the combination of water monitoring results with general information on recent land use patterns, fertilizer consumption, livestock density, etc. does not significantly improve comprehension in this regard, although it may seem beneficial when no information is available.
The modelled nitrate concentration in leachate serves as a predictive approximation of the adopted measures efficiency and as the base for their possible reassessment [15,44,46], while the spatial information concerning the net nitrogen balance represents the starting point for that. Moreover, as indicated by several authors [15,44], identical N balance surpluses or even leachable nitrogen may lead to completely different nitrate concentration in leachate as a consequence of different denitrification rates and infiltration. As a result, the values of nitrogen balance cannot provide any objective response to groundwater nitrate pollution from agriculture in the current period even when surveyed at the level of individual plots, nor can they serve for monitoring the efficiency of mitigation measures as stated by Klages et al. [14].
Although in Slovakia the values of the gross nitrogen balance at country level are clearly lower than in the countries with more intensive agriculture, and modelled nitrogen losses by leaching and runoff [24,25,31] indicate a quite good situation, unsatisfactory high levels of nitrate concentration in groundwater [6] compel us to address this issue in relevant areas as effectively as possible.
The primary step for decreasing nitrates concentration in groundwater below 50 mg L−1 directly corresponds with the reduction of the amount of potentially leachable nitrogen in the soil and thus net nitrogen balance [1,15,44,46]. Even though, under certain conditions, the groundwater environment enables a further decrease of nitrates concentration [47], the capacity of this mechanism is exhaustible [46], it being associated with negative side-effects such as the release of arsenic, nickel and rising sulphate concentration. For that reason, groundwater dilution by less polluted leachate and regulation of nitrogen surplus remains the most accessible way to reduce the above-limit values of nitrates in groundwater as also stated by Mas-Pla and Menció [32].
Recharge rates significantly influence both the concentration of nitrates in leachate and the rate of groundwater concentration change. This is especially relevant in NR, NZ and DS because the annual amount of leachate is often less than 100 mm (see Figure 6), and thus the dilution effect is limited. On the contrary, as stated by Kumar et al. [48], lower rates of leachate, which are typical for eastern European countries, can promote the process of soil denitrification due to longer residence time of percolation water in the soil.
The definition of hot-spot regions with nitrate concentration in groundwater over 50 mg L−1 or over 37.5 mg L−1 with increasing trend is the primary base for deriving maximum acceptable nitrogen balance surplus [15,41]. In this case the second limit value is derived from the Directive 2006/118/EC on the protection of groundwater against pollution and deterioration (Article 5, Annex IV). A similar approach was also used in this study with the proviso that Nitrates Directive limits were applied (nitrate concentration over 50 mg L−1, nitrate concentration over 39.99 mg L−1 with increasing trend and nitrate concentration over 25 mg L−1 with increasing trend) (see Figure 2). Currently, the concentration limit 40 mg NO3 L−1 in leachate in selected districts can be considered an acceptable result from the agricultural practice. As can be seen from the Table 5, in most cases nitrate concentration in leachate contributes to gradual dilution in groundwater, especially within the range over 50 mg L−1. However, in some groundwater monitoring sites, mainly in Nitra district, indicate that the nitrate concentration in leachate requires the review of the measures to reduce leachable nitrogen. Defined hot-spot areas (see Figure 8) should effectively serve as a basis in this regard.
In comparison to foreign studies [1,15,31], the average rates to reduce nitrogen surplus to ensure nitrate concentration of 40 mg L−1 in leachate are lower. But it should be recalled that in these studies single year nitrogen balance was applied instead of the multiannual average [22,33,41,46], thus the final results may be subject to significant inter-annual variability, which Kühling et al. [44] have also noticed. In any case, the lower limit of nitrates concentration in leachate (40 mg L−1) can be considered as a certain guarantee for achieving the necessary effectiveness of measures in agriculture.
It is clear that certain decreases of N input in fertilizers or the reduction of intensity of crop cultivation [22,26,43], formulated in the EU Biodiversity Strategy to 2030 and the Farm to Fork Strategy, as well as nitrogen capture by winter crops or catch crops in hot-spot areas [15,17,22,26,28,43], can help to reduce groundwater nitrate pollution. As for Slovak conditions, the higher nitrogen surplus is recorded in the lowlands as the consequence of cultivation of cash crops and the summer droughts [29]. The drought in the growing season affects not only the nitrogen surplus as Bowles et al. indicate [28], but also the cultivation of winter catch-crops in warm lowland areas, which also applies to the NR, NZ and DS districts. The problem is to reach the stand completeness of winter intercrops, which are sown in summer, also confirmed by Kühling et al. [44]. The expansion of winter crops, in turn, faces the problem of dominant share of winter wheat stands which have lower capacity to uptake nitrogen in autumn compared to rapeseed or rye.
The information presented here significantly improves existing descriptive and qualitative approaches both in the review of vulnerable areas as well as in the assessment of the adequacy of existing measures. It is also possible to partially supplement the monitoring network with other sites that better reflect diffuse groundwater pollution. Even though the precautionary principle is being applied in Slovakia to classify agricultural land into vulnerable areas, information on nitrate concentration in leachate can contribute to a better-informed application of the precautionary principle in the study area.
However, it should be taken into consideration that all relevant information is influenced by the accuracy/scale of the input data [41] rather than the grid in which the results are displayed. Although the soil maps and data in Slovakia are in very good scale (1:10,000), this does not apply for relevant climatic data and the input and outputs for nitrogen balance calculation being calculated on districts (LAU-1) level.
Currently, the disaggregation of nitrogen balance numbers according to the type of agricultural land and intensity represents the most suitable approach to deal with the situation. Therefore, the values of gross and net nitrogen balance in specific districts were redistributed according to the type of agricultural land (especially arable land, permanent grassland and permanent cultures such as orchards and vineyards) and the intensity of their use, which can be derived from some measures of the second pillar of the current Rural development program (e.g., ecological agriculture). In accordance with Kunkel and Wendland [39] and Knoll et al. [47], who indicate the necessity to take into account the type of agricultural land in the area of interest, the highest balance surpluses of nitrogen occur on intensively used arable land contrary to the lowest N surpluses on permanent grasslands, which in Slovakia are often used extensively. Direct calculation of nitrogen balance at LAU-2 or municipal cadasters level or even at field level can bring improvement provided that it covers all UAL and sufficient quality/correct data from farmers are ensured.
Although nitrate concentration in leachate is a terminative indicator to detect hot-spots, as stated in several works [11,12], the time lag which also corresponds to the thickness of unsaturated zone or depth of groundwater should be also taken into account at revision of agricultural measures.

5. Conclusions

Nitrate concentration in leachate within the agricultural land represent an important indicator for determining the current hot-spot areas in terms of groundwater nitrate pollution. In most cases nitrate concentration in leachate contributes to gradual dilution in groundwater, especially in the range over 50 mg L−1. The target value of this indicator, 40 mg NO3 L−1, can serve as the baseline for revision of the measures taken by farmers in selected districts of Slovakia. In the identified hot-spots, the average reduction of average annual N surplus to ensure a nitrate concentration of 40 mg L−1 in leachate does not exceed 15 kg ha−1.

Author Contributions

R.B., Š.K. and R.C. have chosen the methodological procedure; R.B. and Š.K. processed and analyzed the data; R.B., Š.K., R.C., A.V. and D.V. wrote and edited the paper. Conceptualization: R.B.; methodology, R.B., Š.K. and R.C.; software, Š.K.; formal analysis, R.B., Š.K. and R.C.; investigation, R.B., Š.K. and R.C.; resources, R.B.; data curation, Š.K., R.C. and R.B.; writing—original draft preparation, R.B.; writing—review and editing, R.B., Š.K., R.C., A.V. and D.V.; visualization, R.B., Š.K. and R.C.; supervision, R.B.; project administration, R.B. and A.V.; funding acquisition, R.B. and A.V. All authors have read and agreed to the published version of the manuscript.

Funding

This research was funded from technical project of MoE SR “Assessment of diffuse water pollution with nitrogen and phosphorus from utilized agricultural area as a basis for effective allocation of available measures“ and the CE1464 DEEPWATER project funded by Interreg Central Europe.

Institutional Review Board Statement

Not applicable.

Informed Consent Statement

Not applicable.

Data Availability Statement

The data presented in this study are available upon request from the corresponding author. The data are not publicly available due to owner restrictions.

Conflicts of Interest

The authors declare no conflict of interest. The funders had no role in the design of the study; in the collection, analyses, or interpretation of data; in the writing of the manuscript; or in the decision to publish the results.

References

  1. Andjelov, M.; Kunkel, R.; Uhan, J.; Wendland, F. Determination of nitrogen reduction levels necessary to reach groundwater quality targets in Slovenia. J. Environ. Sci. 2014, 26, 1806–1817. [Google Scholar] [CrossRef] [PubMed]
  2. European Commission. Report from the Commission to the Council and the European Parliament on the Implementation of Council Directive 91/676/EEC Concerning the Protection of Waters Against Pollution Caused by Nitrates from Agricultural Sources Based on Member State Reports for the Period 2016–2019, COM(2021) 1000 Final; European Commission: Brussels, Belgium, 2021. [Google Scholar]
  3. European Environment Agency. European Waters. Assessment of Status and Pressures 2018; EEA Report No. 7/2018; European Environment Agency: Copenhagen, Denmark, 2018. [Google Scholar]
  4. European Environment Agency. Water and Agriculture: Towards Sustainable Solutions; EEA Report No. 17/2020; European Environment Agency: Copenhagen, Denmark, 2021. [Google Scholar]
  5. Musacchio, A.; Re, V.; Mas-Pla, J.; Sacchi, E. EU Nitrates Directive, from theory to practice: Environmental effectiveness and influence of regional governance on its performance. Ambio 2020, 49, 504–516. [Google Scholar] [CrossRef] [PubMed] [Green Version]
  6. Cibulka, R.; Rajczyková, E.; Bujnovský, R.; Májovská, A.; Ľuptáková, A.; Paľušová, Z.; Grófová, R.; Gergeľová, Z.; Halásová, M.; Píš, V.; et al. Report on the State of Implementation of Council Directive 91/676/EEC Concerning the Protection of Water against Pollution Caused by Nitrates from Agricultural Resources in the Slovak Republic; Ministry of Environment & Ministry of Agriculture and Rural Development: Bratislava, Slovakia, 2020. Available online: https://cdr.eionet.europa.eu/sk/eu/nid/ (accessed on 29 November 2021).
  7. Orellana-Macías, J.M.; Merchán, D.; Causapé, J. Evolution and assessment of a nitrate vulnerable zone over 20 years: Gallocanta groundwater body (Spain). Hydrogeol. J. 2020, 28, 2207–2221. [Google Scholar] [CrossRef]
  8. Van Grinsven, H.J.M.; Ten Berge, H.F.M.; Dalgaard, T.; Fraters, B.; Durand, P.; Hart, A.; Hofman, G.; Jacobsen, B.H.; Lalor, S.T.J.; Lesschen, J.P.; et al. Management, regulation and environmental impacts of nitrogen fertilization in northwestern Europe under the Nitrates Directive; a benchmark study. Biogeosciences 2012, 9, 5143–5160. [Google Scholar] [CrossRef] [Green Version]
  9. Ascott, M.J.; Gooddy, D.C.; Fenton, O.; Vero, O.; Ward, R.S.; Basu, N.B.; Worrall, F.; Van Meter, K.; Surridge, B.W.J. The need to integrate legacy nitrogen storage dynamics and time lags into policy and practice. Sci. Total Environ. 2021, 781, 146698. [Google Scholar] [CrossRef]
  10. Paradis, D.; Ballard, J.-M.; Lefebvre, R.; Savard, M.M. Multi-scale nitrate transport in a sandstone aquifer system under intensive agriculture. Hydrogeol. J. 2018, 26, 511–531. [Google Scholar] [CrossRef] [Green Version]
  11. Turkeltaub, T.; Jia, X.; Zhu, Y.; Shao, M.-A.; Binley, A. Recharge and nitrate transport through the deep vadose zone of the loess plateau: A regional-scale model investigation. Water Resour. Res. 2018, 54, 4332–4346. [Google Scholar] [CrossRef]
  12. Vero, S.W.; Basu, N.B.; Van Meter, K.; Richards, K.G.; Mellander, P.E.; Healy, M.G.; Fenton, O. Review: The environmental status and implications of the nitrate time lag in Europe and North America. Hydrogeol. J. 2018, 26, 7–22. [Google Scholar] [CrossRef]
  13. Wang, L.; Stuart, M.E.; Lewis, M.A.; Ward, R.S.; Skirvin, D.; Naden, P.S.; Collins, A.L.; Ascott, M.J. The changing trend in nitrate concentrations in major aquifers due to historical nitrate loading from agricultural land across England and Wales from 1925 to 2150. Sci. Total Environ. 2016, 542, 694–705. [Google Scholar] [CrossRef] [Green Version]
  14. Klages, S.; Heidecke, C.; Osterburg, B.; Bailey, J.; Calciu, I.; Casey, C.; Dalgaard, T.; Frick, H.; Glavan, M.; D’Haene, K.; et al. Nitrogen surplus—A unified indicator for water pollution in Europe? Water 2020, 12, 1197. [Google Scholar] [CrossRef] [Green Version]
  15. Kuhr, P.; Haider, J.; Kreins, P.; Kunkel, R.; Tetzlaff, B.; Vereecken, H.; Wendland, F. Model based assessment of nitrate pollution of water resources on a federal state level for the dimensioning of agro-environmental reduction strategies. The North Rhine-Westphalia (Germany) case study. Water Resour. Manag. 2013, 27, 885–909. [Google Scholar] [CrossRef]
  16. Sieling, K.; Kage, H. N balance as an indicator of N leaching in an oilseed rape—winter wheat—winter barley rotation. Agric. Ecosyst. Environ. 2006, 115, 261–269. [Google Scholar] [CrossRef]
  17. Bujnovský, R.; Malík, P.; Švasta, J. Evaluation of the risk of the diffuse pollution of groundwater by nitrogen substances from agricultural land use as background for allocation of effective measures. Ekológia 2016, 35, 66–77. [Google Scholar] [CrossRef] [Green Version]
  18. Capri, E.; Civita, M.; Corniello, A.; Cusimano, G.; De Maio, M.; Ducci, D.; Fait, G.; Fiorucci, A.; Hauser, S.; Pisciotta, A.; et al. Assessment of nitrate contamination risk: The Italian experience. J. Geochem. Explor. 2009, 102, 71–86. [Google Scholar] [CrossRef] [Green Version]
  19. McLellan, E.L.; Cassman, K.G.; Eagle, A.J.; Woodbury, P.B.; Sela, S.; Tonitto, C.; Marjerison, R.D.; Van Es, H.M. The nitrogen balancing act: Tracking the environmental performance of food production. BioScience 2018, 68, 194–203. [Google Scholar] [CrossRef]
  20. Mititelu-Ionuș, O.; Simulescu, D.; Popescu, S.M. Environmental assessment of agricultural activities and groundwater nitrate pollution susceptibility: A regional case study (Southwestern Romania). Environ. Monit. Assess. 2019, 191, 501. [Google Scholar] [CrossRef]
  21. Orellana-Macías, J.M.; Perles Roselló, M.J.; Cauasapé, J. A methodology for assessing groundwater pollution hazard by nitrates from agricultural sources: Application to the Gallocanta groundwater basin (Spain). Sustainability 2021, 13, 6321. [Google Scholar] [CrossRef]
  22. Ackermann, A.; Mahnkopf, J.; Heidecke, C.; Venohr, M. Reducing agricultural nitrogen inputs in the German Baltic Sea catchment—Trends and policy options. Water Sci. Technol. 2016, 74, 1060–1068. [Google Scholar] [CrossRef]
  23. Pärn, J.; Pinay, G.; Mander, Ü. Indicators of nutrients transport from agricultural catchments under temperate climate: A review. Ecol. Indic. 2012, 22, 4–15. [Google Scholar] [CrossRef]
  24. Velthof, G.L.; Oudendag, D.; Witzke, H.P.; Asman, W.A.H.; Klimont, Z.; Oenema, O. Integrated assessment of nitrogen loses from agriculture in EU-27 using MITERRA-EUROPE. J. Environ. Qual. 2009, 38, 402–417. [Google Scholar] [CrossRef]
  25. Velthof, G.L.; Lesschen, J.P.; Webb, J.; Pietrzak, S.; Miatkowski, Z.; Pinto, M.; Kros, J.; Oenema, O. The impact of the Nitrates Directive on nitrogen emissions from agriculture in the EU-27 during 2000–2008. Sci. Total Environ. 2014, 468–469, 1225–1233. [Google Scholar] [CrossRef] [PubMed]
  26. Hansen, B.; Thorling, L.; Schullehner, J.; Termansen, M.; Dalgaard, T. Groundwater nitrate response to sustainable nitrogen management. Sci. Rep. 2017, 7, 8566. [Google Scholar] [CrossRef] [PubMed]
  27. Hansen, B.; Sonnenborg, T.O.; Møller, I.; Bernth, J.D.; Høyer, A.-S.; Rasmussen, P.; Sandersen, P.B.E.; Jørgensen, F. Nitrate vulnerability assessment of aquifers. Environ. Earth Sci. 2016, 75, 999. [Google Scholar] [CrossRef] [Green Version]
  28. Bowles, T.M.; Atallah, S.S.; Campbell, E.E.; Gaudin, A.C.M.; Wieder, W.R.; Grandy, A.S. Addressing agricultural nitrogen loses in a changing climate. Nat. Sustain. 2018, 1, 399–408. [Google Scholar] [CrossRef]
  29. Bujnovský, R.; Koco, Š. The Load of Agricultural Land by Nutrients in Relation to Diffuse Water Pollution in Slovakia—Actual view. In From Environmental Goals towards Drinking Water Quality, Proceedings of the International Conference Water Resources Protection 2019, Bratislava, Slovakia, 17–18 June 2019; Slovak Environmental Agency: Banská Bystrica, Slovakia, 2019; pp. 38–43. Available online: https://water-resources.sazp.sk/wp-content/uploads/2019/07/OchranaVodnychZdrojov.pdf (accessed on 6 December 2021).
  30. Kunkel, R.; Kreins, P.; Tetzlaff, B.; Wendland, F. Forecasting the effects of EU policy measures on the nitrate pollution of groundwater and surface waters. J. Environ. Sci. 2010, 22, 872–877. [Google Scholar] [CrossRef]
  31. De Vries, W.; Schulte-Uebbing, L.; Kros, H.; Voogd, J.C.; Louwagie, G. Spatially explicit boundaries for agricultural nitrogen inputs in the European Union to meet air and water quality targets. Sci. Total Environ. 2021, 786, 147283. [Google Scholar] [CrossRef]
  32. Mas-Pla, J.; Menció, A. Groundwater nitrate pollution and climate change: Learnings from a water balance-based analysis of several aquifers in a western Mediterranean region (Catalonia). Environ. Sci. Pollut. Res. 2019, 26, 2184–2202. [Google Scholar] [CrossRef] [Green Version]
  33. Wendland, F.; Bergmann, S.; Eisele, M.; Gömann, H.; Herrmann, F.; Kreins, P.; Kunkel, R. Model-based analysis of nitrate concentration in the leachate—The North Rhine-Westfalia case study, Germany. Water 2020, 12, 550. [Google Scholar] [CrossRef] [Green Version]
  34. Wiering, M.; Boezeman, D.; Crabbé, A. The Water Framework Directive and agricultural diffuse pollution: Fighting a running battle? Water 2020, 12, 1447. [Google Scholar] [CrossRef]
  35. European Court of Auditors. Water Quality in the Danube River Basin: Progress in Implementing the Water Framework Directive but Still Some Way to Go; Special Report No 23; Publications Office of the European Union: Luxembourg, 2016; Available online: https://www.eca.europa.eu/Lists/ECADocuments/SR15_23/SR_DANUBE_PROGRESS_EN.pdf (accessed on 13 December 2021).
  36. Laurent, F.; Ruelland, D. Assessing impacts of alternative land use and agricultural practices on nitrate pollution at the catchment scale. J. Hydrol. 2011, 409, 440–450. [Google Scholar] [CrossRef]
  37. Eurostat. Nutrient Budgets—Methodology and Handbook, Version 1.02; Eurostat and OECD: Luxembourg, 2013.
  38. European Environmental Agency. EMEP/EEA Air Pollutant Emission Inventory Guidebook 2016. Technical Guidance to Prepare National Emission Inventories; EEA Technical Report No. 21/2016; Publications Office of the European Union: Luxembourg, 2016. [Google Scholar]
  39. Kunkel, R.; Wendland, F. Diffuse Nitrateinträge in die Grund—und Oberflächengewässer von Rhein und Ems; Reihe Umwelt, Band 62; Schriften des Forschungszentrum Jülich: Jülich, Germany, 2006. [Google Scholar]
  40. Wienhaus, S.; Höper, H.; Eisele, M.; Meesenburg, H.; Schäfer, W. Nutzung Bodenkundlich-Hydrogeologischer Informationen zur Ausweisung von Zielgebieten für den Grundwasser-Schutz—Ergebnisse Eines Modellprojektes (NOLIMP) zur Umsetzung der EG—Wasserrahmenrichtlinie; GeoBerichte 9; Landesamt für Bergbau, Energie und Geologie: Hannover, Germany, 2008. [Google Scholar]
  41. Wolters, T.; Cremer, N.; Eisele, M.; Herrmann, F.; Kreins, P.; Kunkel, R.; Wendland, F. Checking the plausibility of modelled nitrate concentrations in the leachate on federal state scale in Germany. Water 2021, 13, 226. [Google Scholar] [CrossRef]
  42. Voulvoulis, N.; Arpon, K.D.; Giakoumis, T. The EU Water Framework Directive: From great expectations to problems with implementation. Sci. Total Environ. 2017, 575, 358–366. [Google Scholar] [CrossRef] [PubMed] [Green Version]
  43. Hérivaux, C.; Orban, P.; Brouyère, S. It is worth protecting groundwater from diffuse pollution with agri-environmental schemes? A hydro-economic modeling approach. J. Environ. Manage. 2013, 128, 62–74. [Google Scholar] [CrossRef]
  44. Kühling, I.; Beiküfner, M.; Vergara, M.; Trautz, D. Effect of adapted N-fertilisation strategies on nitrate leaching and yield performance of arable crops in North-Western Germany. Agronomy 2021, 11, 64. [Google Scholar] [CrossRef]
  45. Teixeira, E.I.; Johnstone, P.; Chakwizira, E.; De Ruiter, J.; Malcom, B.; Shaw, N.; Zyslowski, R.; Khaembah, E.; Sharp, J.; Meenken, E.; et al. Quantifying key sources of variability in cover crop reduction of N leaching. In MODSIM2015, Proceedings of the 21st International Congress on Modelling and Simulation; Weber, T., McPhee, M.J., Anderssen, R.S., Eds.; Modelling and Simulation Society of Australia and New Zealand: Canberra, Australia, 2015; pp. 401–405. [Google Scholar]
  46. Kunkel, R.; Herrmann, F.; Kape, H.-E.; Keller, L.; Koch, F.; Tetzlaff, B.; Wendland, F. Simulation of terrestrial nitrogen fluxes in Mecklenburg-Vorpomern and scenario analyses how to reach N-quality targets for groundwater and coastal waters. Environ. Earth Sci. 2017, 76, 146. [Google Scholar] [CrossRef]
  47. Knoll, L.; Häussermann, U.; Breuer, L.; Bach, M. Spatial distribution of integrated nitrate reduction across the unsaturated zone and the groundwater body in Germany. Water 2020, 12, 2456. [Google Scholar] [CrossRef]
  48. Kumar, R.; Hesse, F.; Rao, P.S.C.; Musolff, A.; Jawitz, J.W.; Sarrazin, F.; Samaniego, L.; Fleckenstein, J.H.; Rakovec, O.; Thober, S.; et al. Strong hydroclimatic controls on vulnerability to subsurface nitrate contamination across Europe. Nat. Commun. 2020, 11, 6302. [Google Scholar] [CrossRef]
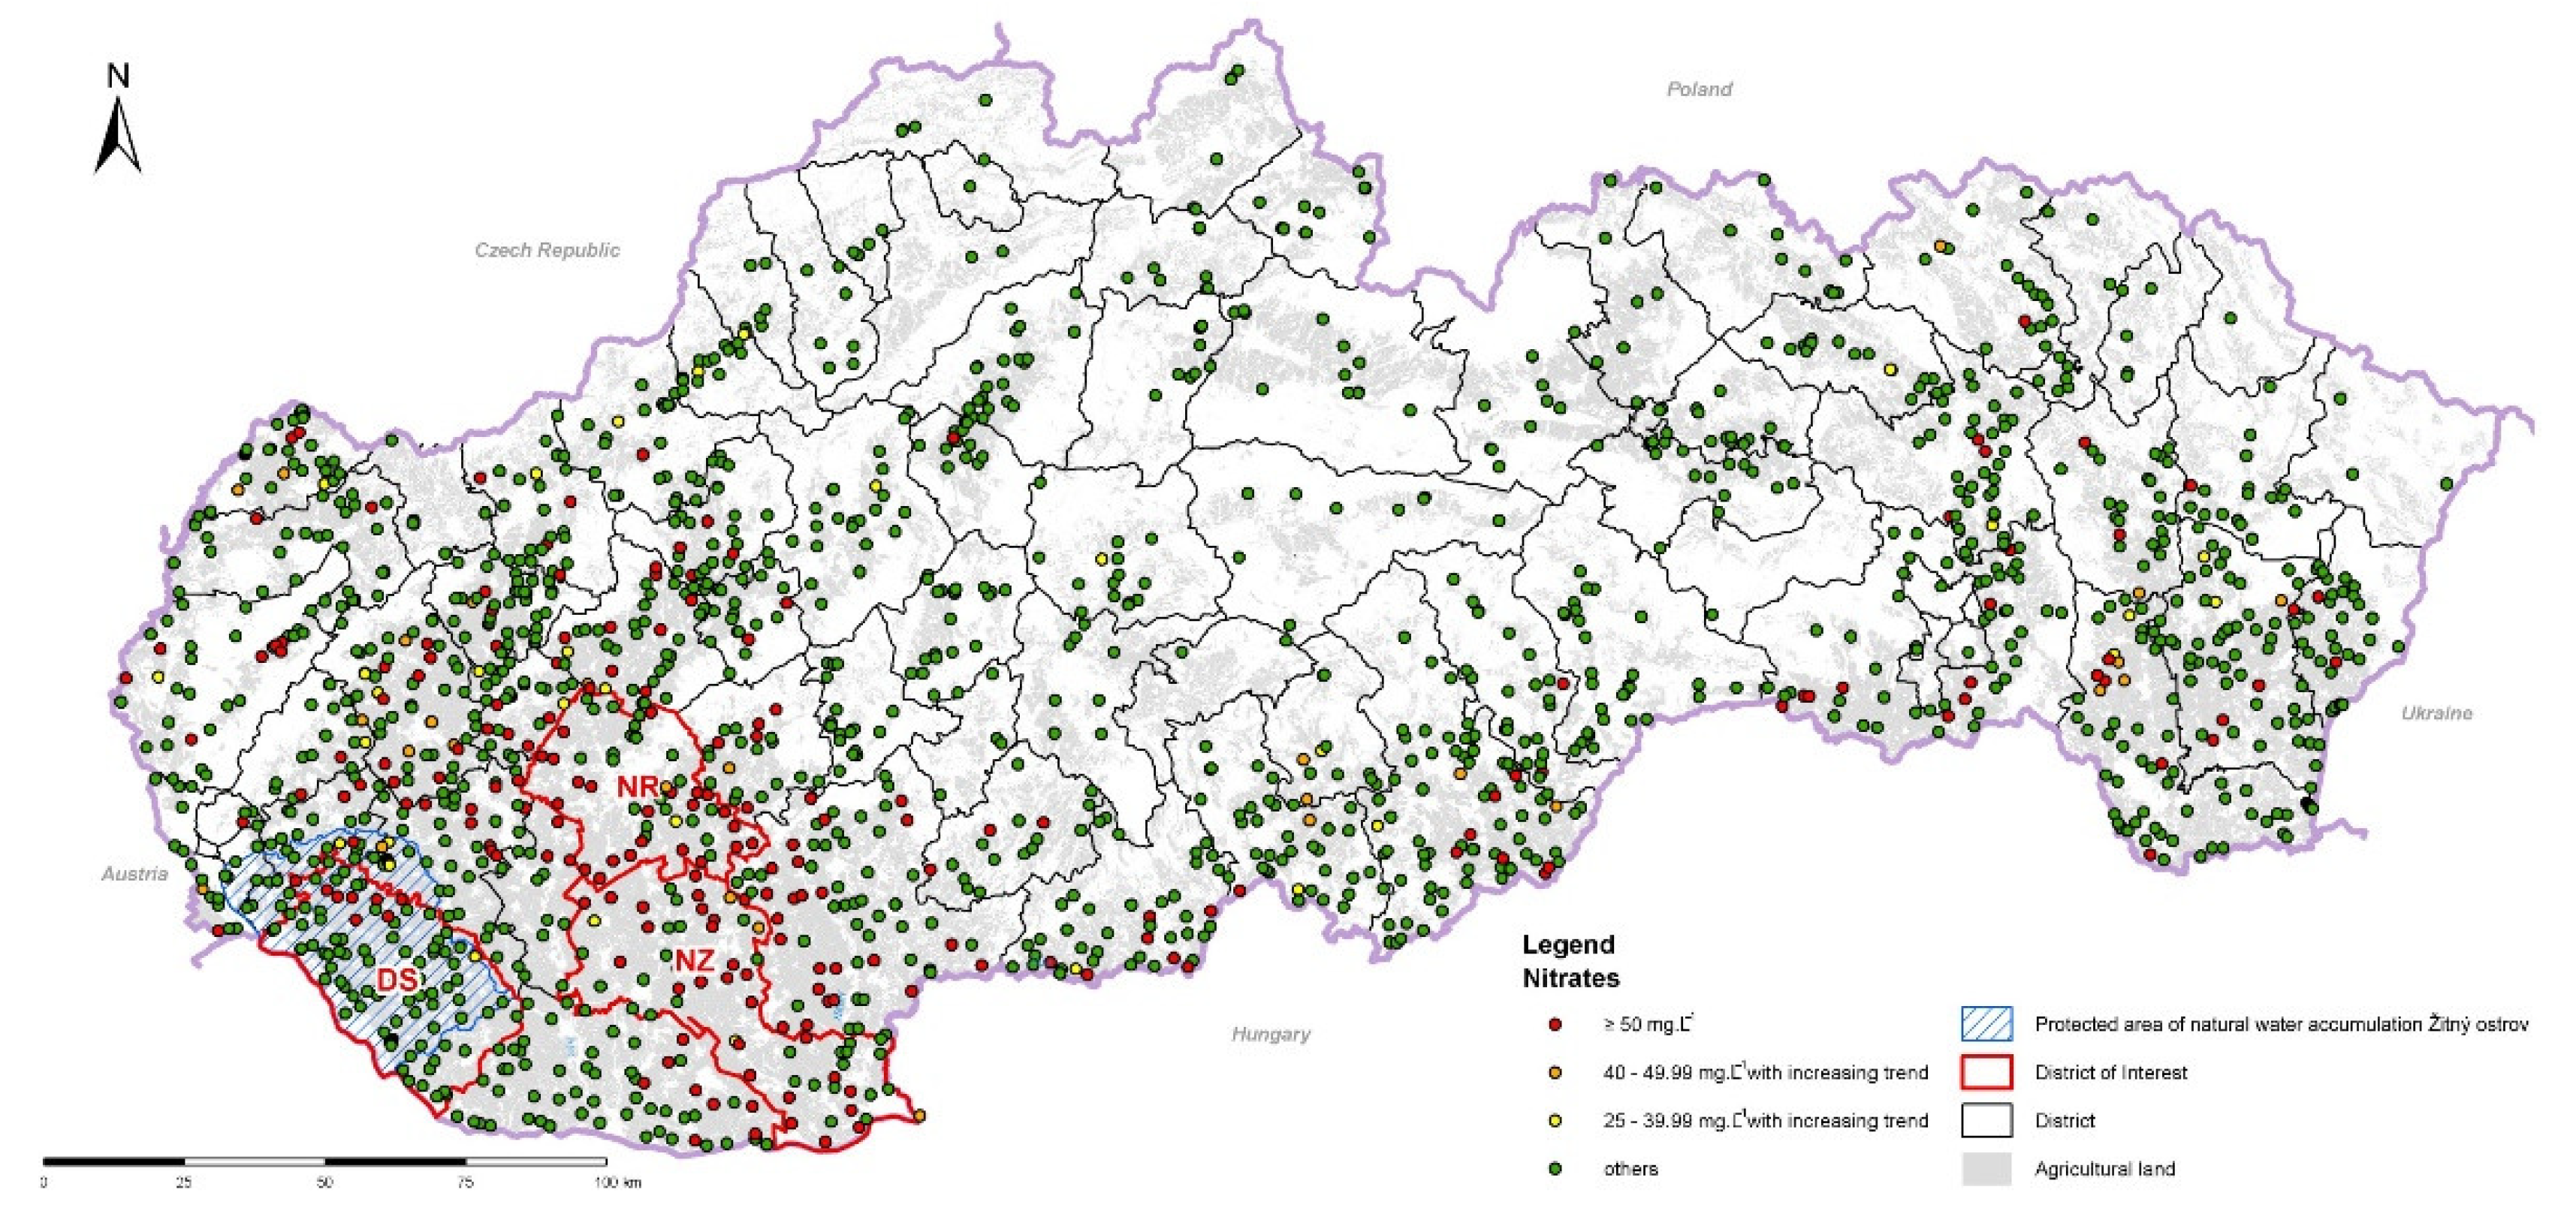
Figure 1. Spatial distribution of defined average nitrate concentrations in groundwater in 2016–2019 and allocation of selected districts.
Agriculture 12 00493 g001
Figure 2. Spatial distribution of defined average nitrate concentrations in groundwater in 2016–2019 within selected districts and pilot area.
Agriculture 12 00493 g002
Figure 3. Summary flowchart for calculation of nitrate concentration in the leachate.
Agriculture 12 00493 g003
Figure 4. Maximum annual denitrification rate within UAL of selected districts.
Agriculture 12 00493 g004
Figure 5. Residence times of percolation water in the agricultural soil (in years).
Agriculture 12 00493 g005
Figure 6. The amount of leachable nitrogen within UAL of selected districts.
Agriculture 12 00493 g006
Figure 7. Calculated average amount of percolation water.
Agriculture 12 00493 g007
Figure 8. Mean annual nitrates concentration in leachate.
Agriculture 12 00493 g008
Table 1. Relative share of groundwater monitoring sites (%) with defined nitrate concentrations (mg L−1) of the total within UAL of selected districts and pilot area.
District/AreaRelative Share of GW Monitoring Sites (%)
25–39.99 (mg L−1)40–49.99 (mg L−1)50 and More (mg L−1)
(Increasing Trend)(Increasing Trend)
Nitra 0.02.250.0
Nové Zámky0.06.642.6
Dunajská Streda0.80.88.2
Pilot area0.00.00.0
Table 2. Relative share of arable land, permanent grasslands and permanent cultures within UAL of selected districts/areas of Slovakia.
District/AreaUtilized Relative Share (%)
Agricultural Arable LandPermanentPermanent
Landand KitchenCulturesGrasslands
(Thou. ha)Gardens
Nitra60.3297.621.720.66
Nové Zámky107.9097.061.811.13
Dunajská Streda75.0498.580.720.70
Pilot area 16.6998.700.320.98
Table 3. Relative share of soil types within UAL of selected districts/areas of Slovakia.
Soil TypeDistrict/Area
NitraNovéDunajská Pilot Area
ZámkyStreda
Regosol27.3310.130.030.05
Fluvisol2.601.8516.645.18
Gleyic Fluvisol3.771.811.070.11
Fluvic Gleyic Chernozem4.7313.8720.3025.58
Chernic Gleysol1.506.496.495.88
Rendzic Skeletic Leptosol0.100.05
Lithic Leptosol0.01
Haplic Chernozem6.1326.5253.9659.70
Luvic Phaeozem20.6530.24
Haplic Luvisol22.206.90
Albic Luvisol2.610.69
Stagnic Luvisol6.350.79
Albi Stagnic Fragic Luvisol0.990.01
Haplic Cambisol0.670.06
Stagnic Cambisol0.11
Fragic Planosol0.070.02
Gleysol0.090.02
Histosol 0.111.403.51
Haplic Solonchak0.020.36
Anthrosol0.050.090.12
Table 4. Average values of nitrogen surplus on district/area level in period 2015–2018 (kg N ha−1 of UAL).
District/AreaGross BalanceNet Balance
Nitra43.225.5
Nové Zámky28.313.6
Dunajská Streda44.223.5
Pilot area44.721.5
Table 5. Number of groundwater monitoring sites corresponding to combinations of average annual nitrate concentration in seepage water and groundwater.
DistrictNitrates Concentration (mg L−1)
Percolation Groundwater
Water25–39.9940–49.99≥50
Nitra<251114
25–39.99--1
40–49.99---
≥50--8
Nové Zámky<252324
25–39.99-12
40–49.99---
≥50---
Dunajská Streda<25-18
25–39.99---
40–49.99--1
≥501-1
Table 6. The acreage of UAL which has to reduce the nitrogen surplus to ensure an average nitrate concentration in percolation water of 40 mg L−1.
District/AreaN SurplusUAL Acreage
(kg ha−1)(ha)
Nitra0.1–5.01148
5.1–10.017,234
10.1–15.0251
Nové Zámky0.1–5.04
5.1–10.00
10.1–15.00
Dunajská Streda0.1–5.02587
5.1–10.010,387
10.1–15.00
Pilot area0.1–5.01389
5.1–10.0737
10.1–15.0
Publisher’s Note: MDPI stays neutral with regard to jurisdictional claims in published maps and institutional affiliations.