Article

Investigation into Experimental and DEM Simulation of Guide Blade Optimum Arrangement in Multi-Rotor Combine Harvesters

Key Laboratory of Modern Agricultural Equipment and Technology, Ministry of Education, Jiangsu University, Zhenjiang 212013, China
*
Author to whom correspondence should be addressed.
Agriculture 2022, 12(3), 435; https://doi.org/10.3390/agriculture12030435
Submission received: 15 January 2022 / Revised: 23 February 2022 / Accepted: 24 February 2022 / Published: 21 March 2022
(This article belongs to the Section Agricultural Technology)

Abstract

:
The cleaning performance of the cleaning shoe of a multi-rotor combine harvester has proven to be poor owing to the threshed output entering the cleaning section in an uneven manner. Experimental results indicated that the arrangement of the guide blades on the return plate surface has a significant effect on the threshed output distribution. In this paper, DEM (discrete element method) simulations were carried out in the EDEM software to examine the effect of the height of the guide blade, the installation angle, and the number of guide blades on threshed output distribution before entering the cleaning shoe. Based on the simulated results under different guide blades arrangements, the optimum arrangement location was obtained. The simulation’s results were verified by a field experiment and were consistent with the experimental results. The field experiment results indicate that the cleaning performance significantly improved with the proper guide blade arrangement. The corresponding grain impurity ratio declined significantly from 1.26% to 0.67%, and the grain sieve loss ratio, with a decrease of 53.2%, was reduced from 1.11% to 0.52%.

1. Introduction

Combine harvesters, whose entire working process can be divided into cutting, threshing, separating, cleaning, and storing, has played an important role in crop harvesting [1]. With the increase in rice production and the popularization of high-yield super-rice in China [2], there is a growing requirement for combine harvesters with high harvesting efficiency and performance. To increase harvesting efficiency, Jiangsu University in China developed a combine harvester with a multi-rotor threshing unit and a multi-duct cleaning unit [3,4,5]. Experimental results indicated that such a threshing unit can result in good threshing performance for rice with feeding rates up to 8 kg/s (grain + MOG (material other than grain)), that is to say, the separation loss and grain damage ratio in the grain tank were relatively low. However, the cleaning performance was worse owing to the uneven threshed output distribution when entering the cleaning shoe [6]. The return plate structure has a paramount influence on threshed output distribution; it is therefore important to investigate the conveying capability of the return plate and to seek the best combination of operating parameters. Numerical simulation based on the discrete element method (DEM) [7] has been shown to be very useful in understanding the fundamentals for numerous applications covering many fields of interest [8,9,10,11,12,13,14], and many scholars have utilized the DEM to optimize the cleaning and threshing device in combine harvesters. Lenaerts et al. built a bendable flexible straw model through the cylinder hemispherical combination method. The spheres in the model were connected with six axisymmetric linear spring-dampers to simulate bending stiffness and energy dissipation under oscillations. At the same time, simulation parameters were calibrated and the shaking separation process of the mixture of grains and long straws was simulated through the three-point bending test [15]. Horabik collected the material properties of most material particles applied in the agricultural engineering field from laboratories across the globe and described the specific methods and model settings required for determining the material properties in detail [16]. A. Hager et al. proposed a fully parallelized open-source method to calculate the interaction between particles and fluids for relatively large fluid grids. Combined with computational fluid dynamics (CFD) and the discrete element method (DEM), the coupling of CFD and DEM was realized in the open-source framework. Its interface is based on openfoam and liggghts. Its algorithm was improved to realize full parallel computing [17]. Salikov et al. conducted gas–solid coupling numerical simulation of a prismatic spouted particle bed, with the main purpose of studying the influence of gas flow on particle motion and spouting stability. Firstly, the three-dimensional coupling model of the spouted bed was established, and then the CFD–DEM gas–solid coupling method was used to simulate the spouted bed model under a different gas flow. Finally, the characteristics of particle motion in the spouted bed were analyzed according to the simulation results, and the relationship between gas flow and spouting stability was obtained [18]. D. Markauskas et al. conducted a comparative study on the coupling methods based on CFD. Through three test cases, DEM–CFD coupling methods were analyzed in turn. The results showed that the calculation results of the two coupling methods were consistent, but there were differences between the calculation methods of fluid components [19]. A. Volk et al. studied the mesh size in the CFD–DEM coupling method, summarized the development and trend of mesh technology, analyzed the influence of mesh refinement on numerical simulation results, established a unified numerical error mathematical model, and obtained the functional relationship between mesh size and numerical simulation results [20]. To obtain an even threshed output distribution before entering the cleaning shoe, the distribution law of the threshed output after leaving the concave in the test-bench experiment was obtained firstly. Then, based on the threshed output distribution in different zones, simulations were carried out with different return plate structure parameters in the EDEM software (EDEM® 2.5, DEM Solutions, Edinburgh, UK) and the optimum return plate arrangement was figured out. Finally, a field experiment was carried out to check the performance of the cleaning shoe with the optimum return plate structure.

2. Materials and Methods

2.1. Threshed Output Distribution

To understand the distribution status of the threshed output after leaving the concave, a threshing experiment was carried out in the thresh-separation test bench in the laboratory. The thresh-separation test bench is composed of a crop conveyor, a threshing and separation device, a device for receiving threshed outputs, a power driving system, and a monitoring and control system. Some reception boxes with a dimension of 110 × 110 × 110 mm were located under the rotor concave to collect all threshed outputs. Each test was repeated 3 times, and the average values of each box were obtained by a scale with a resolution of 0.01 g. The total weight of the material was 60 kg. The equivalent feeding rates were 8 kg/s, and the threshed outputs distribution under the rotors was analyzed in detail to lay a proper foundation for the following simulation. The properties of the experiment rice were as follows: plant height was 750~850 mm, ear height was 150–170 mm, straw moisture content was 58–67%, grain moisture content was 22–29%, straw/grain ratio in weight was 1.9–2.2, and the weight of one thousand grains was 31.2 g. A physical diagram of the thresh-separation test bench was shown in Figure 1.

2.2. Determination of Guide Blade Location on Return Plate

EDEM Simulation Parameter Settings

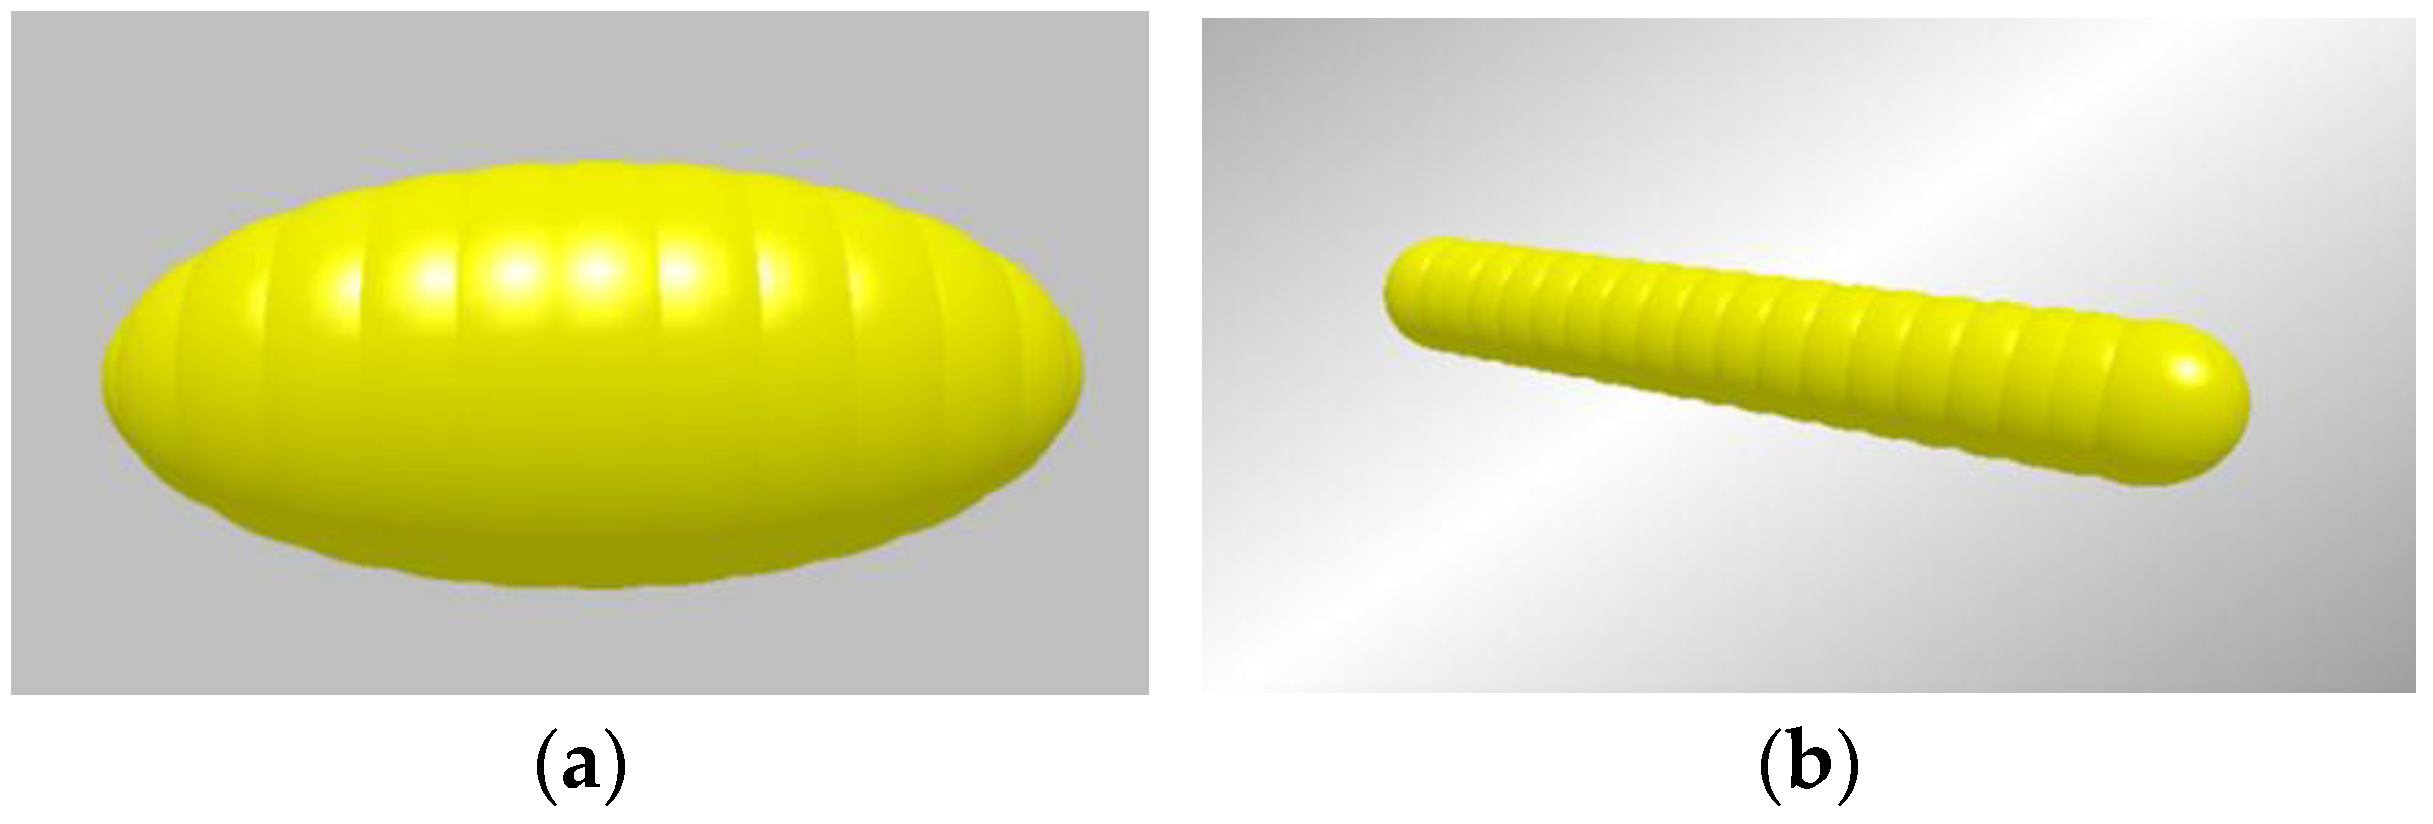
The experiment’s results indicated that the main ingredients within the threshed outputs were rice grain, short straw (30–90 mm in length), and blight grains. As the masses of the blighted grains and the light miscellaneous material were relatively small, modelling was mainly focused on rice grains and short straws. The grain length was 6.41–7.31 mm, the width was 2.89–3.47 mm, and the thickness was 2.01–2.74 mm. The short straw diameter was 5 mm. Developed grain and short straw particle models are shown in Figure 2.
According to the actual parameters of the multi-rotor combine harvester, the 3D model of the return plate and the material distribution device’s guide blades were established through the Proe software (PTC5.0, Needham, MA, USA). Based on the actual relative installation position between the sieve and the return plate in the multi-rotor combine harvester, a receiving box was placed obliquely below the return plate. The size of the receiving box was 950 × 1150 × 100 mm (length × width × height). The distance from the bottom of the return plate’s front end to the bottom of the splice box is 200 mm. Based on the threshed output from different zones, eight particle generators were established accordingly. Particle generators were above the return plate at a distance of 150 mm. Finally, we introduced the established model into the EDEM software. The established model with particle generators is shown in Figure 3a. Particle generator distribution is shown in Figure 3b.
The parameters used in the EDEM simulation were the mean values from the replicated tests measured using a texture analyser (Stable Micro Systems, Godalming, UK) in the laboratory with fresh rice and suitable values obtained from the literature [21,22]. The time step ΔT = 0.15ΔTr, ΔTr is Rayleigh time step with ΔTr = 1.98 × 10⁶ s [23,24]. Based on grain and short straw distribution after leaving the rotor concaves, different particle generators were established according to grain and short straw proportions in the mixture in different zones. The falling velocity of grain and straw were set to 0.1 m/s after leaving the particle generators. The total simulation time was 6 s, including the particle generating time (3 s). An experimental data analysis was carried out by utilizing the ‘selection’ function included in the EDEM software. Ten zones were divided at the end of the return plate to count the grain and straw. The EDEM simulation parameters are shown in Table 1.

2.3. Verifying the EDEM Numerical Simulation Results

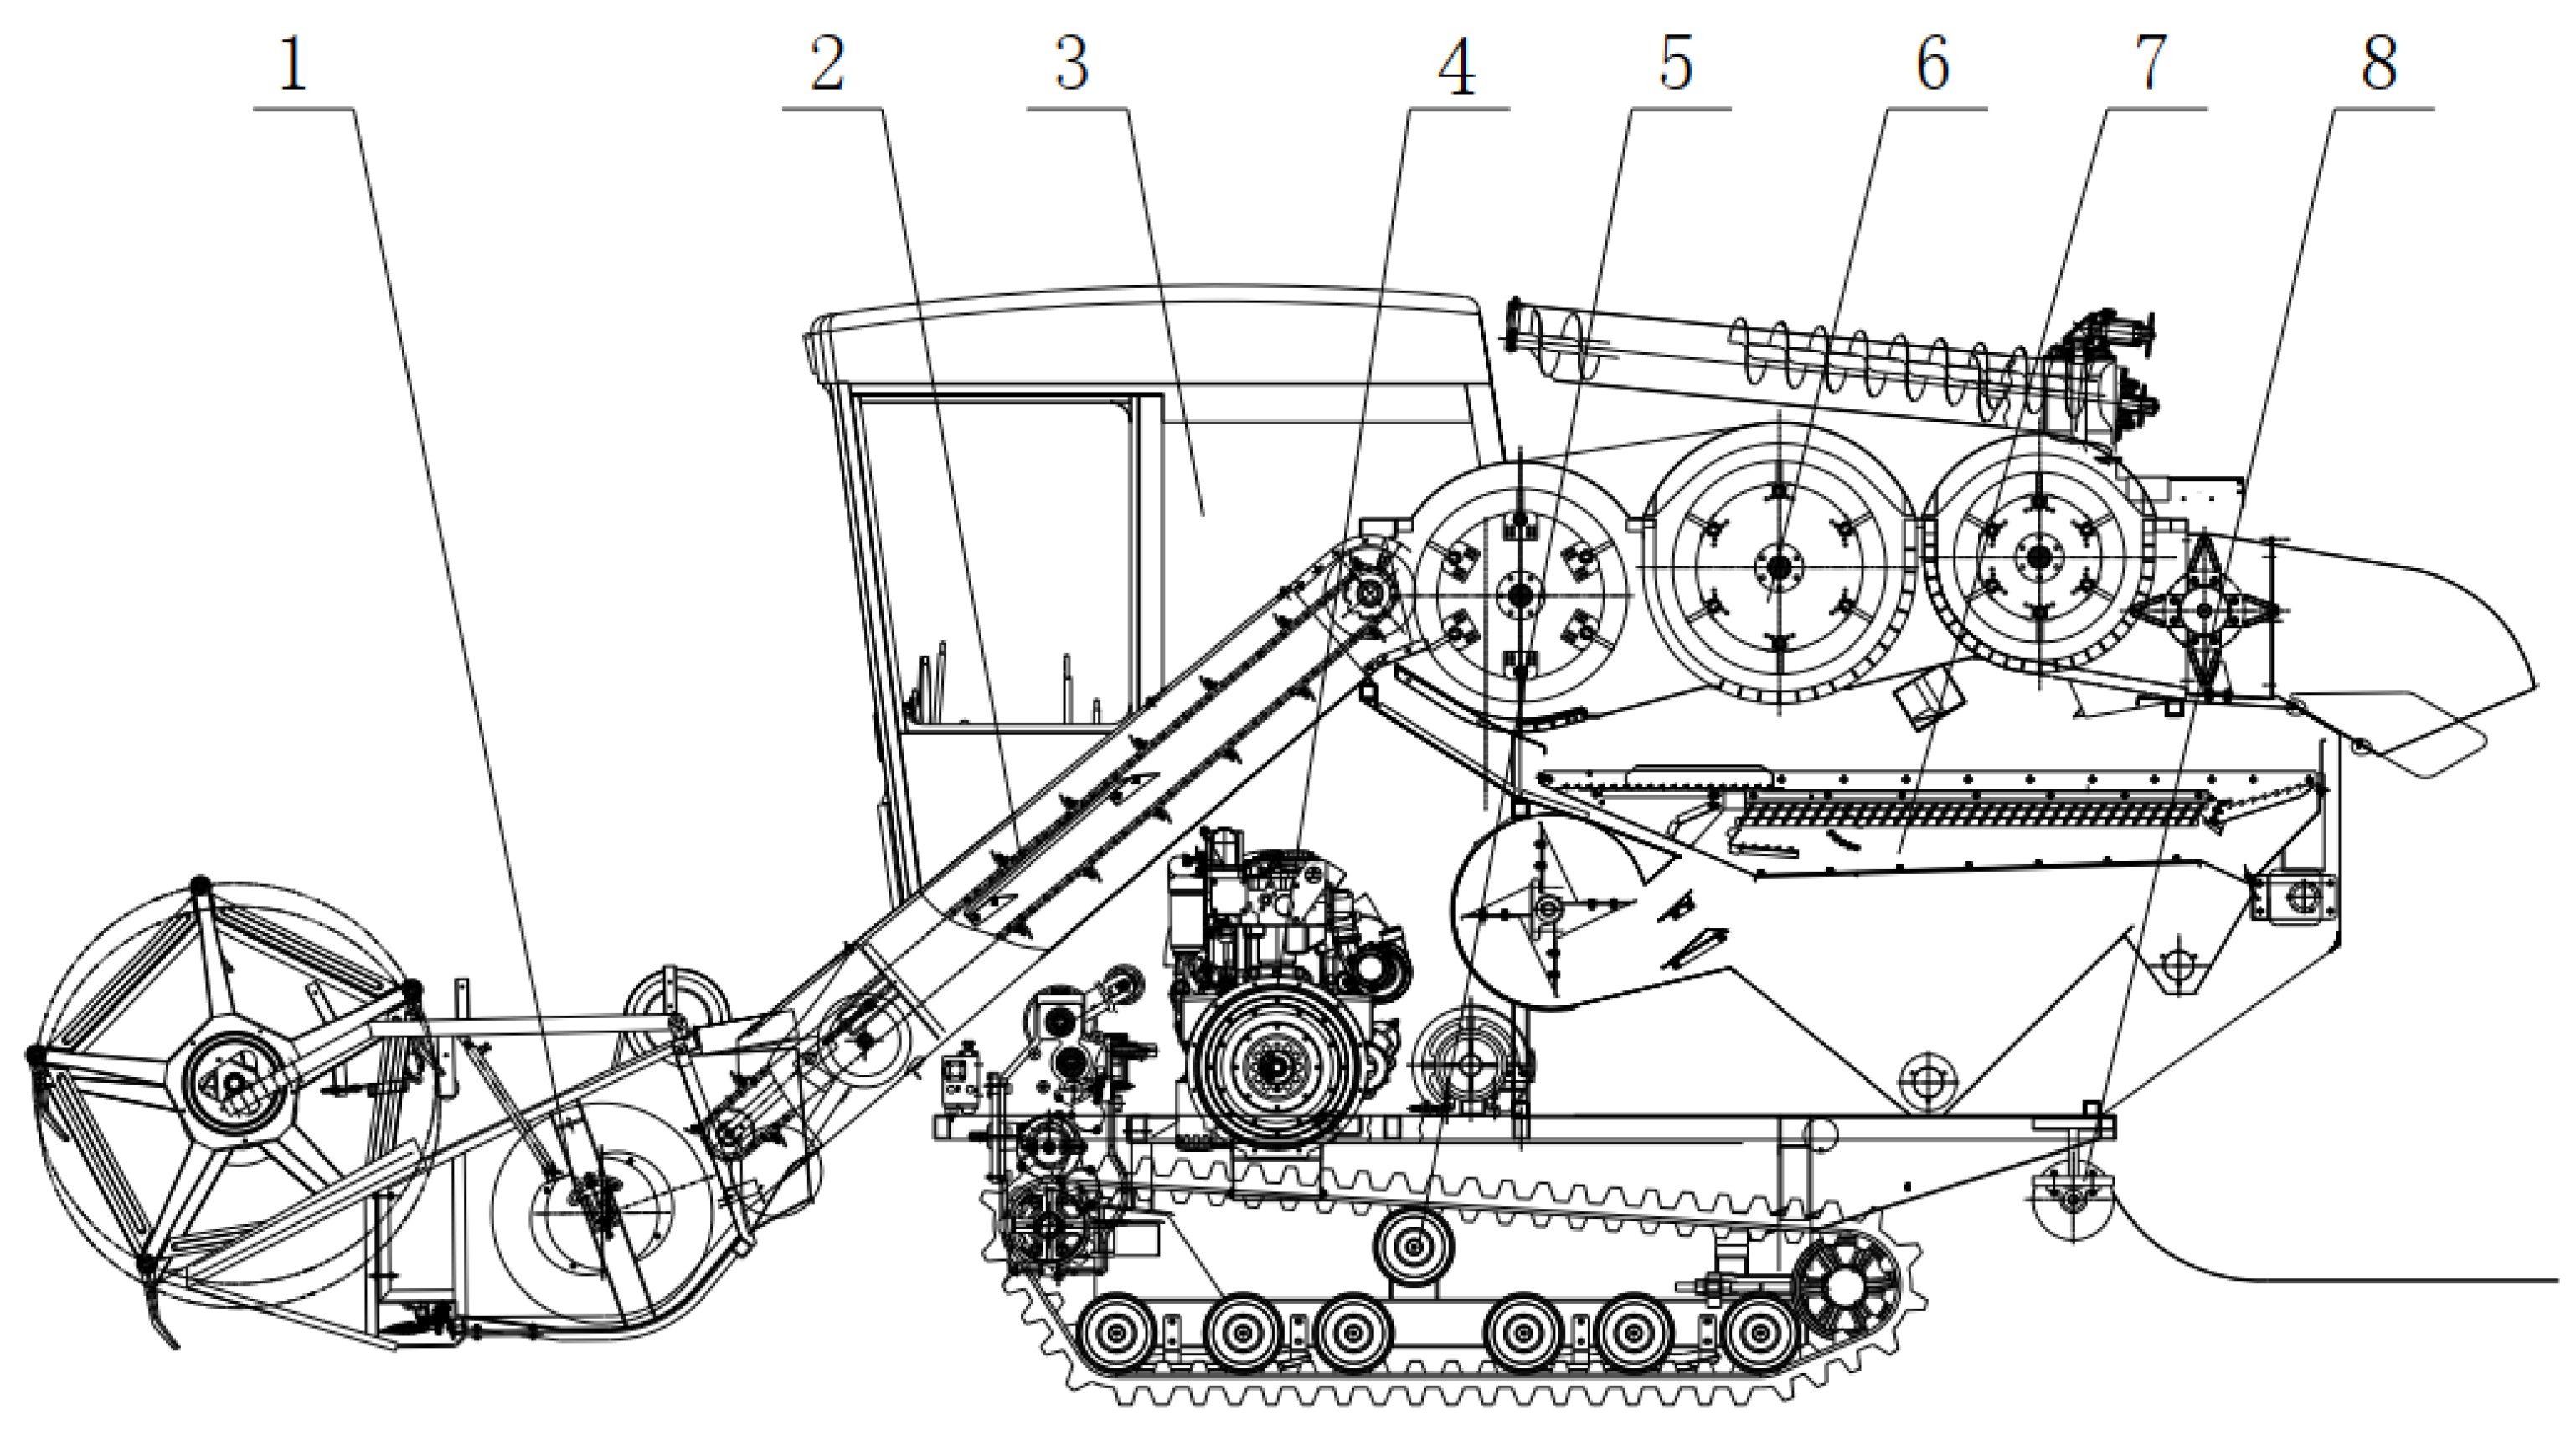
To verify the EDEM numerical simulation results, one of the guide blades was manufactured and installed on the return plate surface. The header width of the combine harvester is 2580 mm, and the engine power is 95 kw. The minimum ground clearance is 310 mm, the theoretical forward speed is 0–5.47 km/h, and the productivity can be obtained at 0.30–0.67 ha/h accordingly. The threshing unit of the combine harvester, as is shown in Figure 4, is composed of 3 rotors, with the tangential rotor and the horizontal axis flow rotor I responsible for primary threshing and separating, and the horizontal axis flow rotor II for secondary threshing and separating. The diameters of the tangential rotor, the first horizontal axis flow rotor, and the second horizontal axis flow rotor are 400 mm, 400 mm, 400 mm, respectively, and the corresponding rotor lengths are 480 mm, 1100 mm, and 1100 mm. The clearance between the rotors and the concave is 30 mm. The sieve cleaning system is composed of a multi-duct fan, a vibration sieve, and a return plate. The length of the return plate is 1000 mm and the width is 1100 mm, the return plate has the same vibration frequency of 6 Hz as the sieve, but their vibration directions are opposite. The threshed output of the tangential rotor fell into the grain pan, and the threshed output of the horizontal axis flow rotors I and II fell into the return plate. At the action of the grain pan and the return plate, the threshed output moved into the cleaning shoe to finish the cleaning procedure with the cooperation of the vibrate sieve and the multi-duct fan [6]. The revolution speed of the feeder conveyor, tangential rotor, the first horizontal axis flow rotor, and the second horizontal axis flow rotor were fixed to 520 rpm, 600 rpm, 750 rpm, and 950 rpm, respectively. A schematic diagram of the main structure of the combine harvesters with the stepped tangential–horizontal–horizontal rotors is shown in Figure 4.
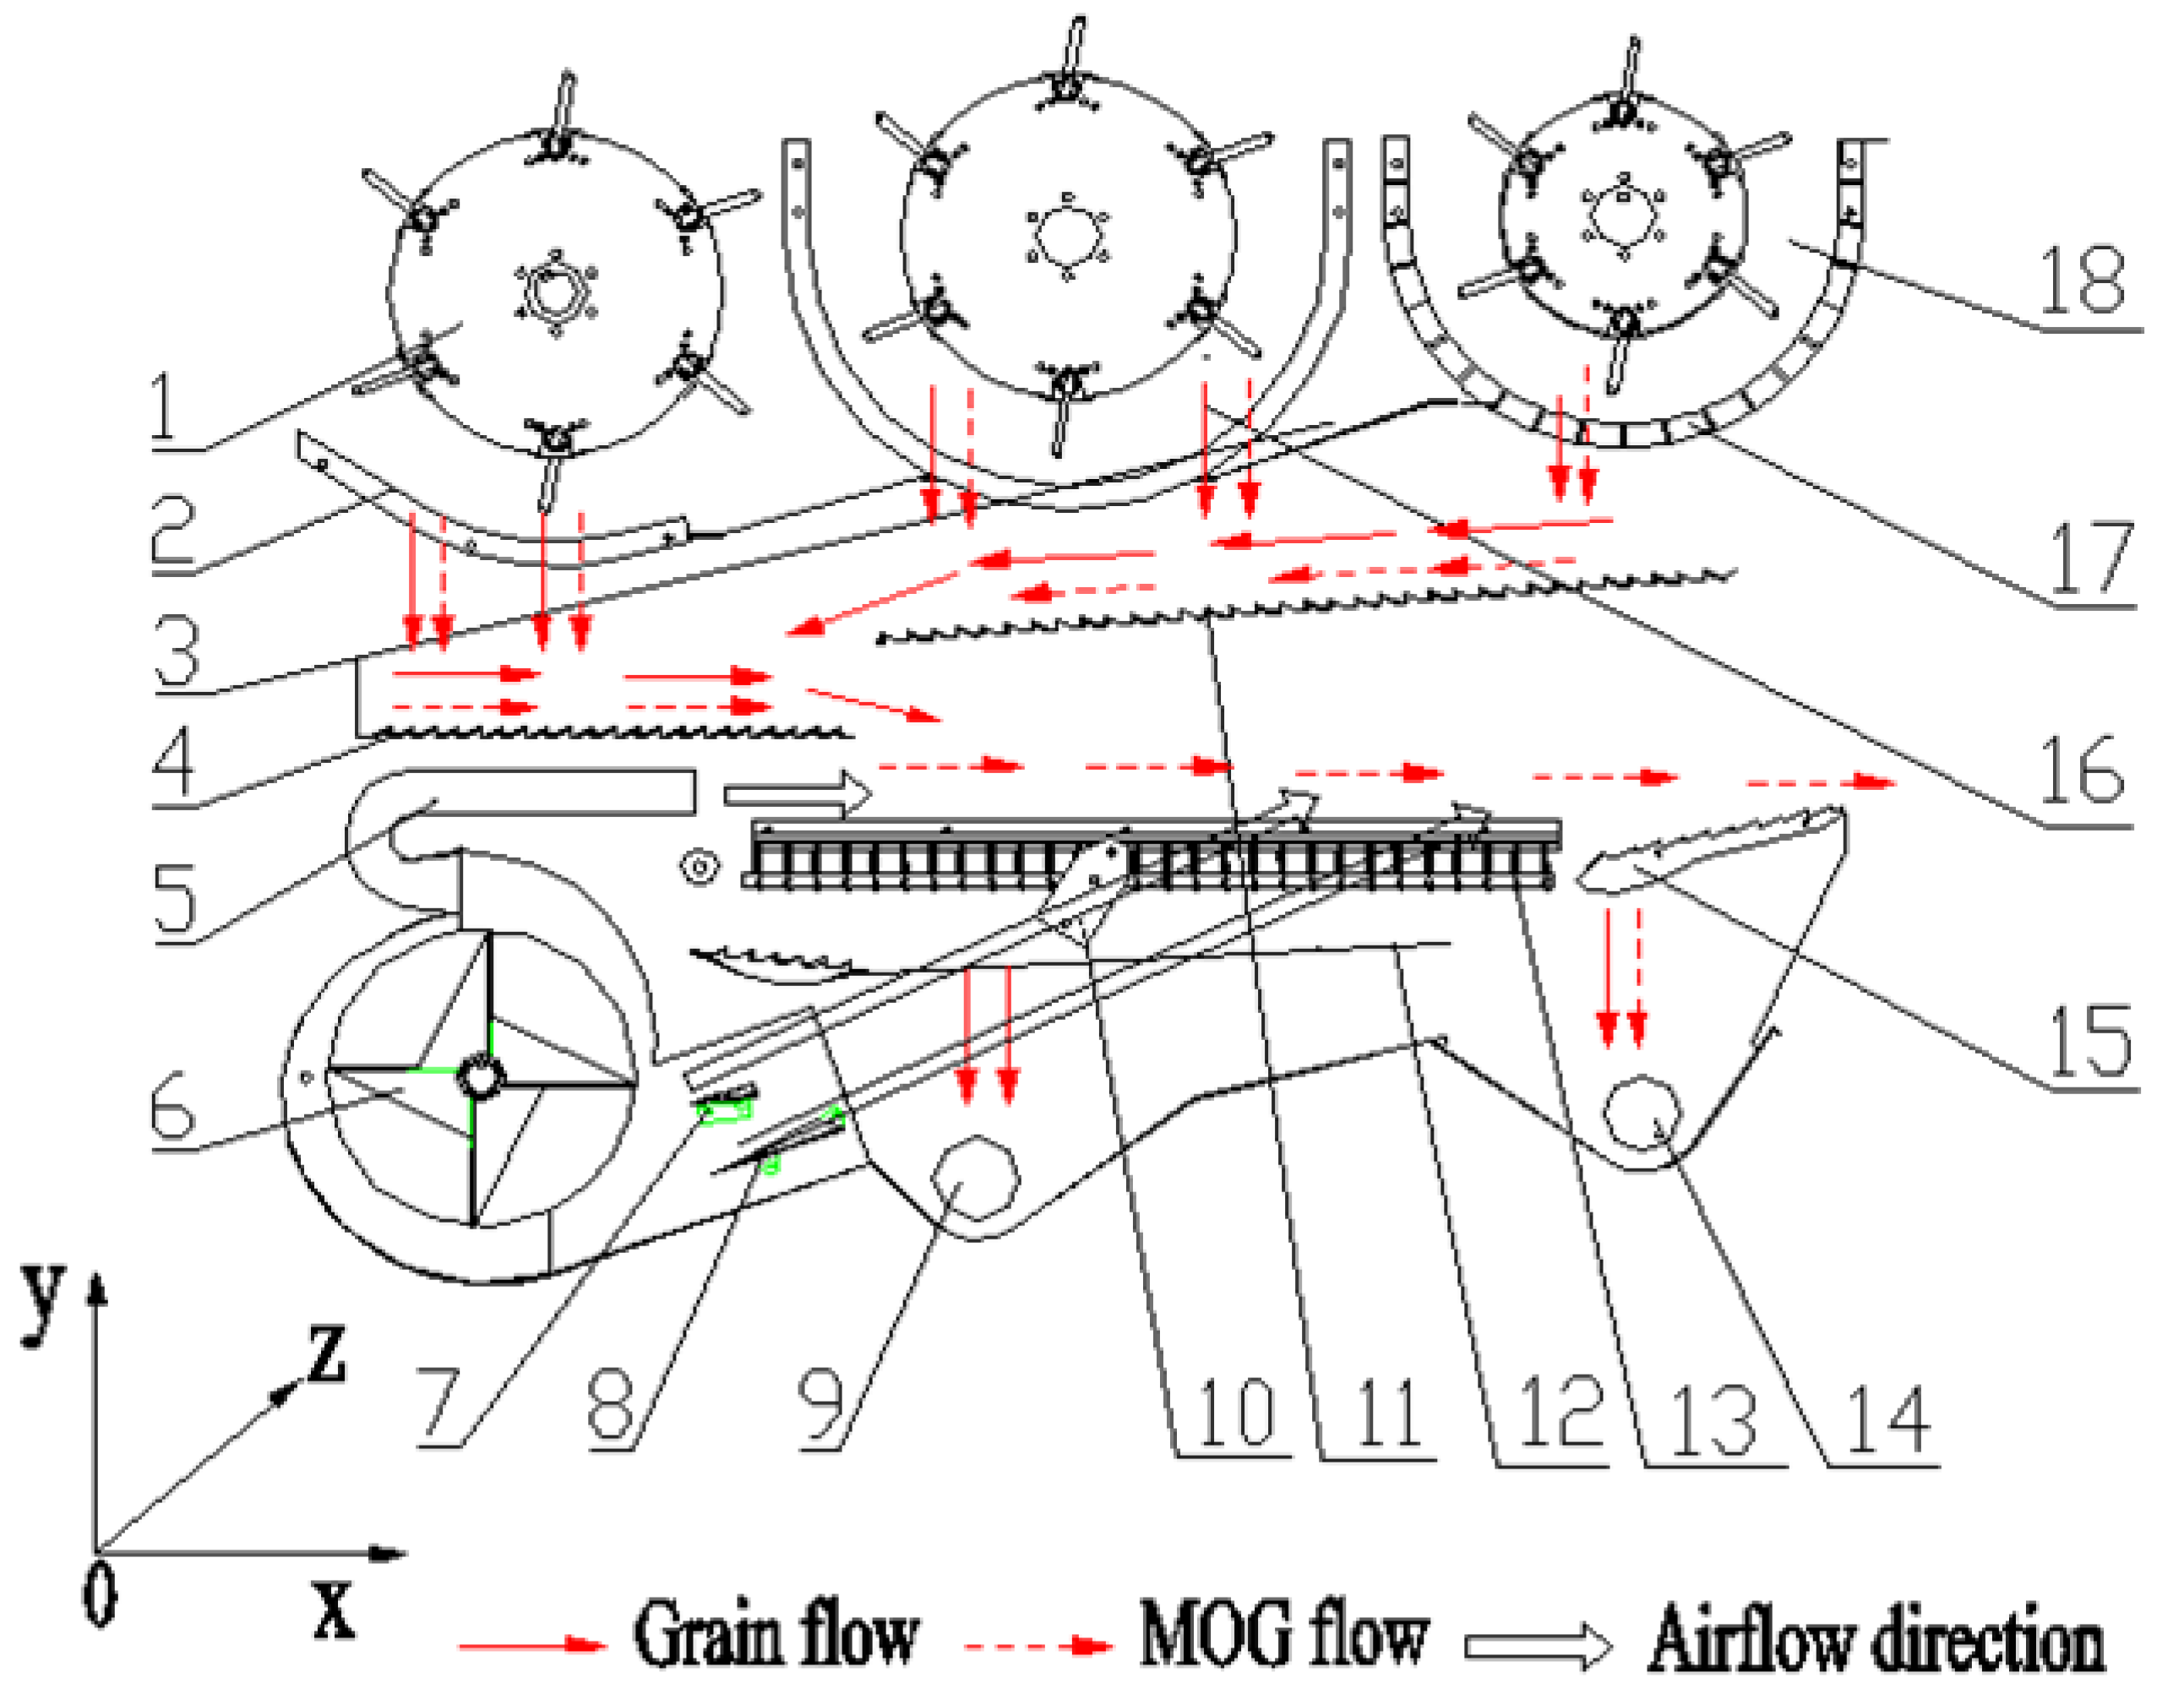
Crop flow process inside the threshing rotors and the cleaning system are shown in Figure 5 and Figure 6.
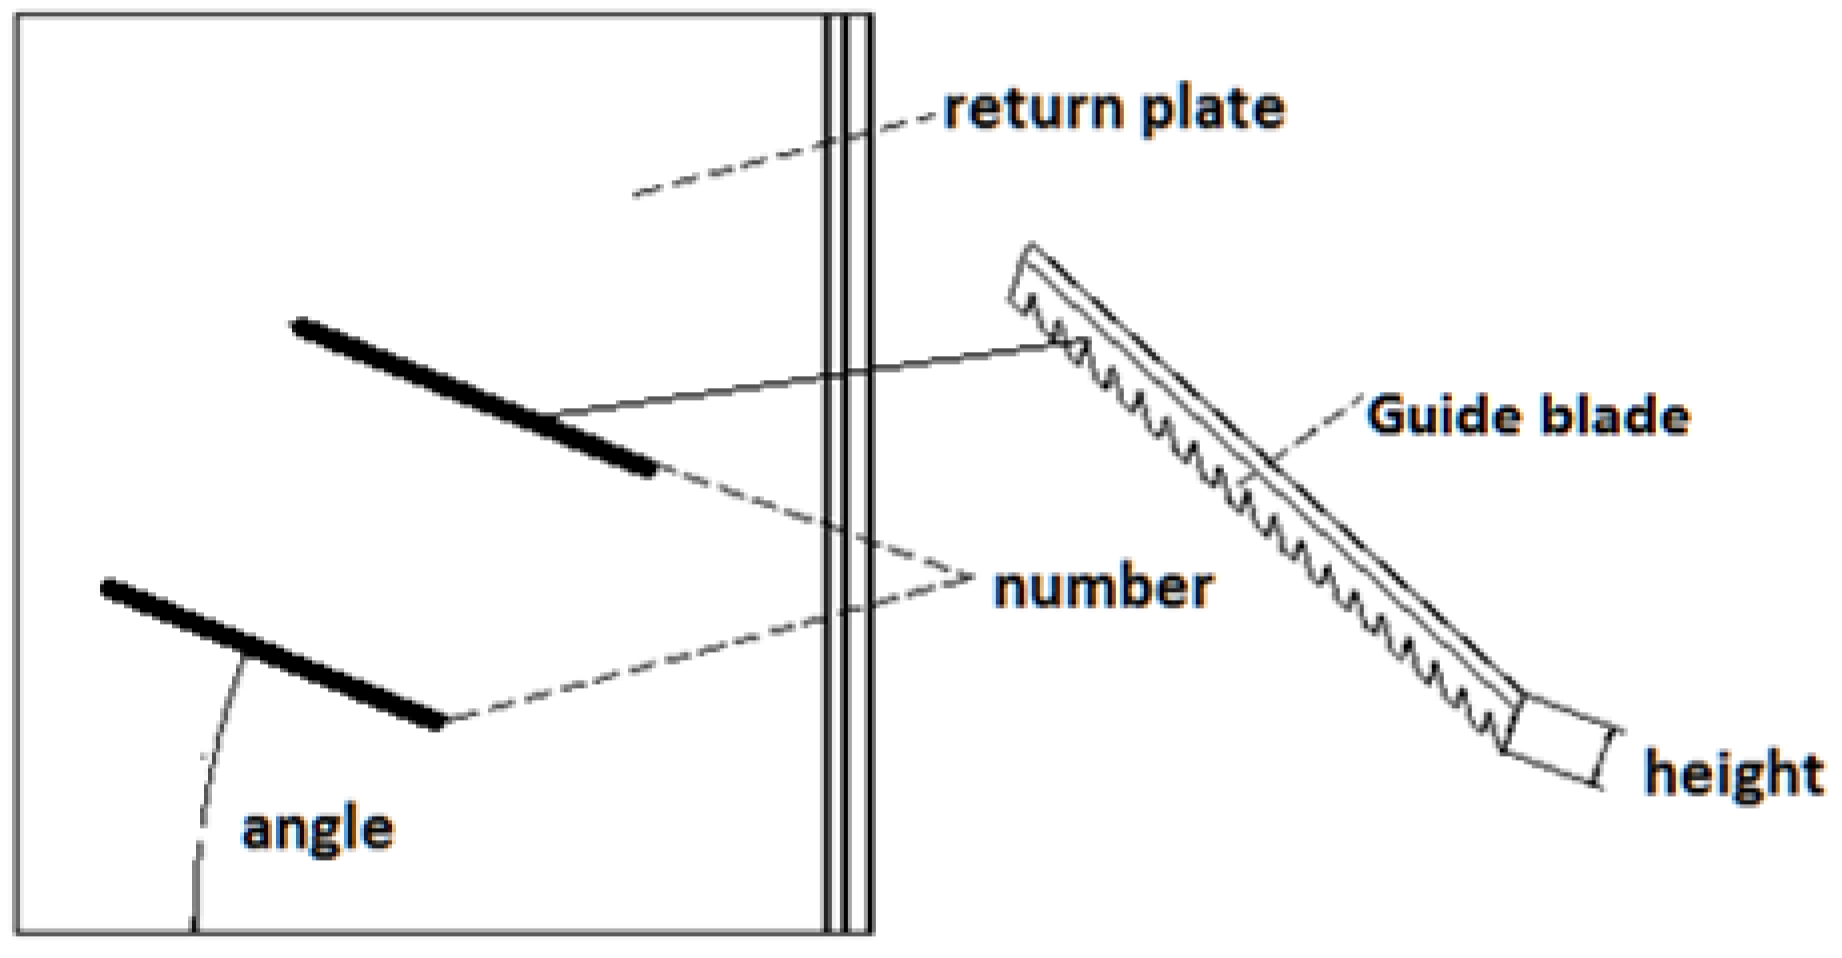
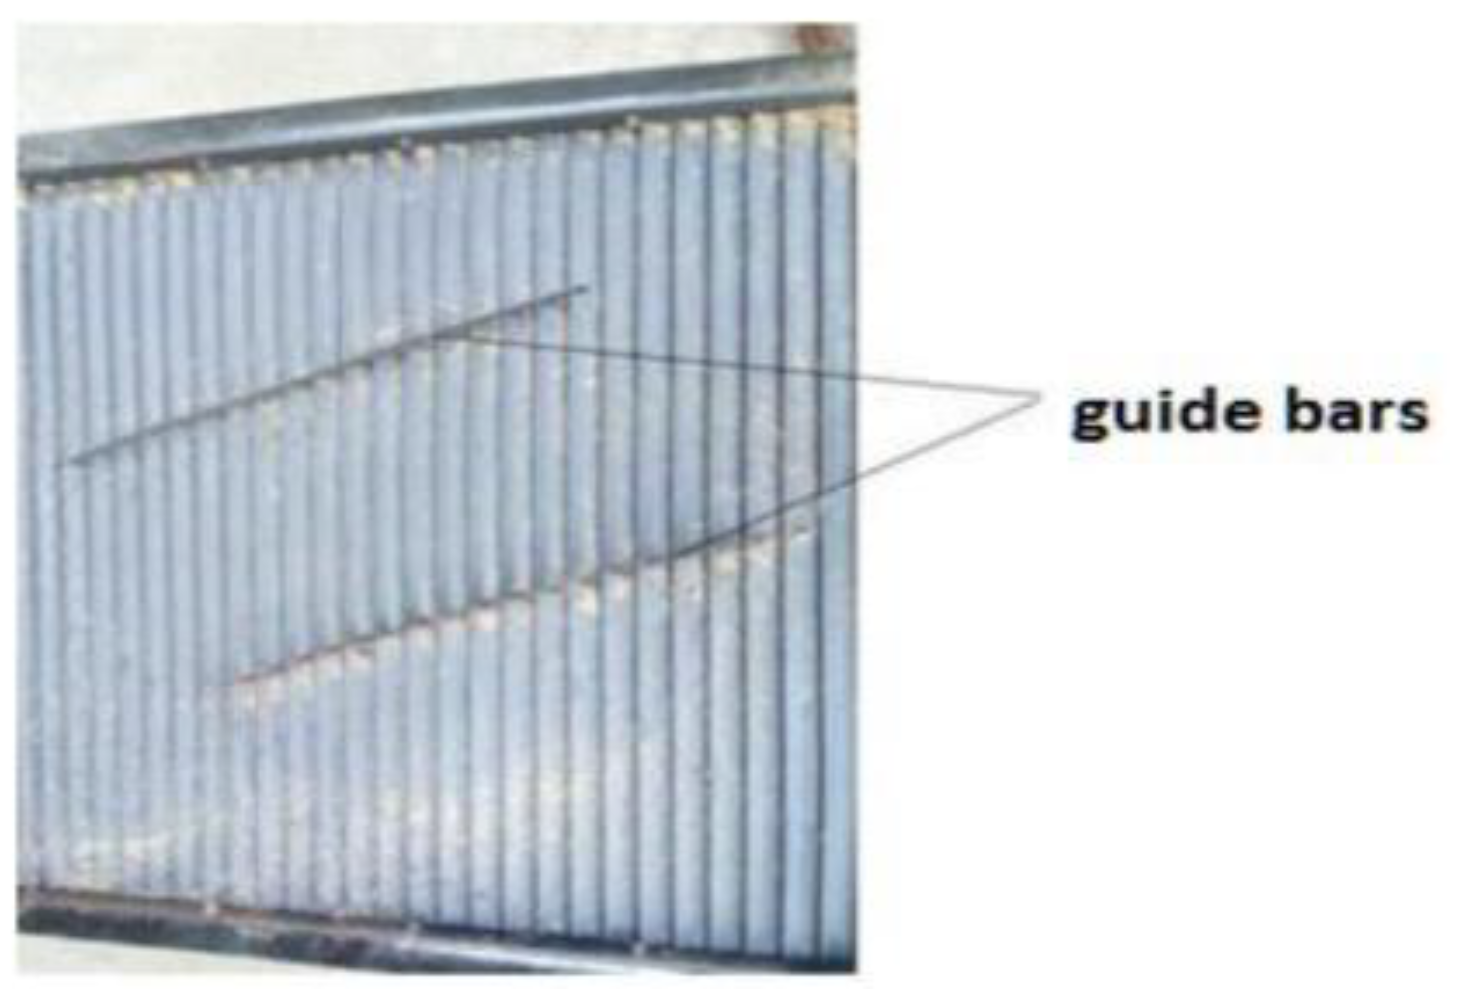
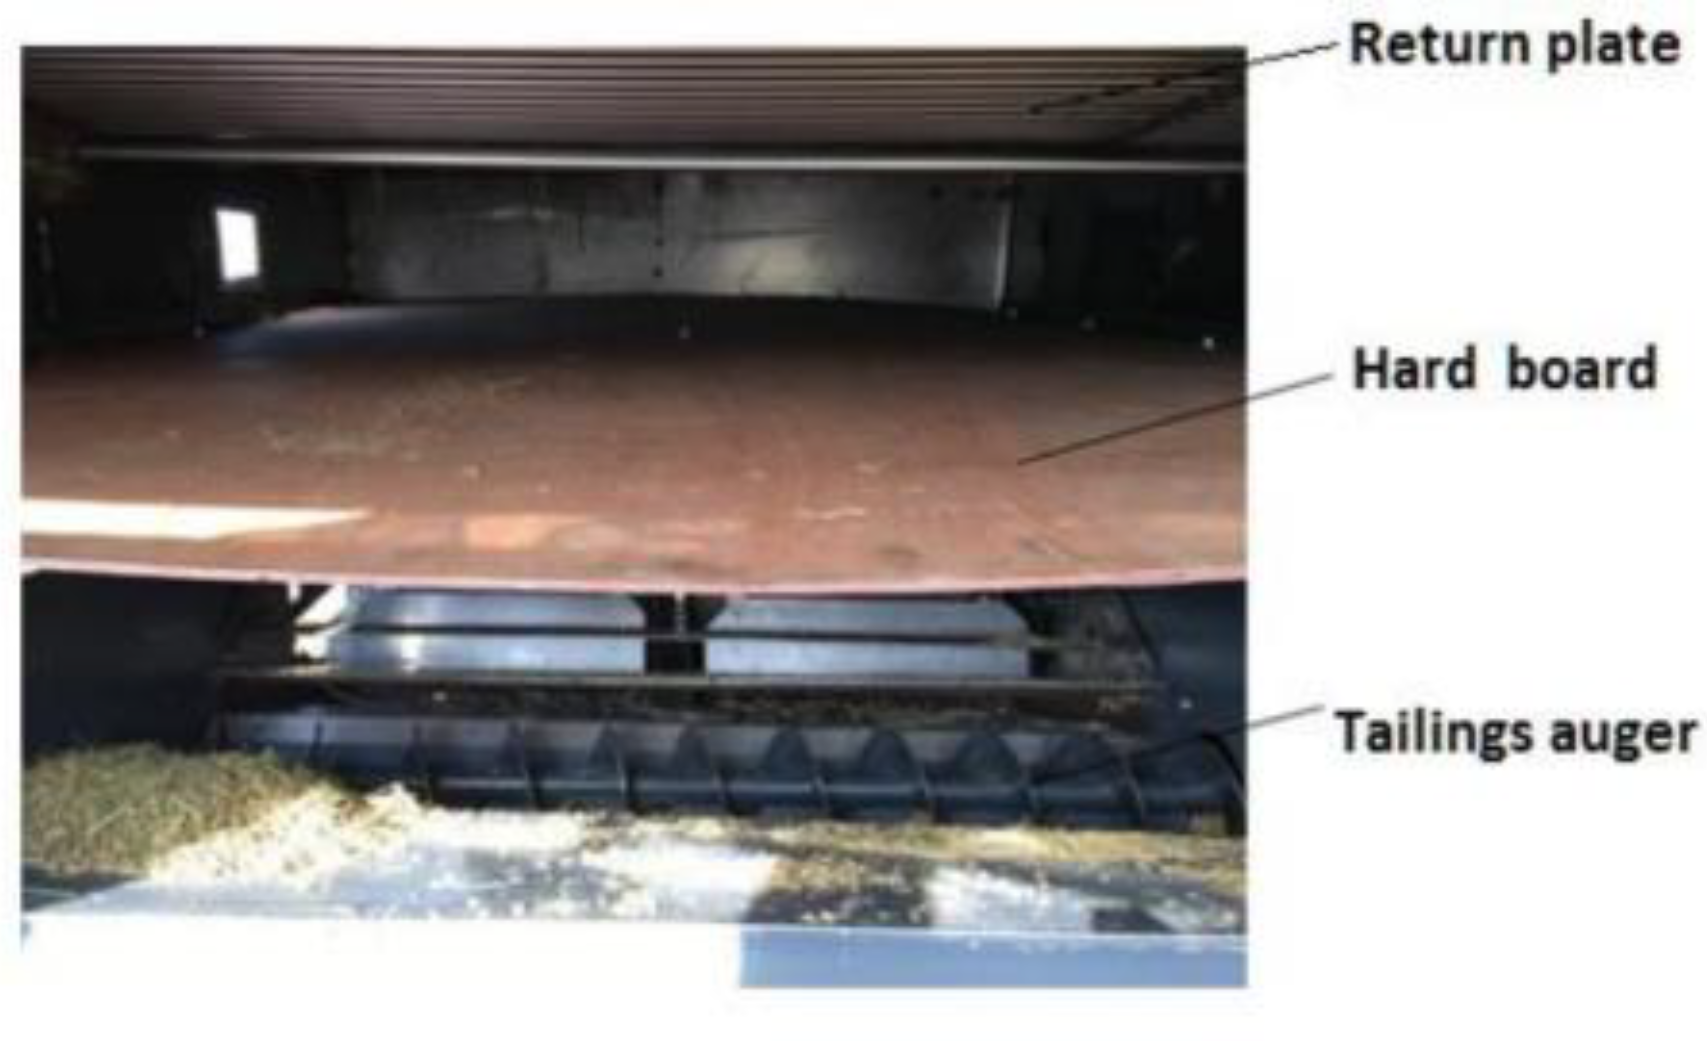
The height of the guide blade was 50 mm, the installation angle on the return plate surface was 25°, and 2 guide blades were placed parallel to each other. After installing the designed return plate in the combine harvester, the field experiment was conducted. To pick up all the threshed mixture from the return plate for a contrast with the simulation results, a hard board was added between the return plate and the upper outlet of the fan. The feeding rate was 8.0 kg/s (grain + MOG). The threshed outputs were divided into 10 zones, the mass of each zone was then weighed, and the full grains were then separated out by the stationary re-cleaner (Agriculex ASC-3 Seed Cleaner (Guelph, ON, Canada)) and weighed after each test. A schematic diagram of the guide blade installation position is shown in Figure 7. The physical diagram of the return plate with 2 guide blades is shown in Figure 8, and the location of the hard board is shown in Figure 9.
Once the simulation results were verified, the corresponding parameters in the EDEM software could be used to simulate the grain and MOG movement under different guide blade arrangements. To find out the best combination of parameters for the guide blades, the guide blades were arranged on the return plate surface according to the experimental design, as shown in Table 2. The process was repeated 3 times for each combination of parameters and the results were averaged.

2.4. Field Experiment

To check the performance of the cleaning system after utilizing the designed return plate with guide blades, a field experiment was carried out. The return plates with guide blades and without guide blades were all used to test the cleaning performance. Field experiments were carried out in Lianhu farm, Danyangcity, Jiangsu Province, China. During the field experiments, the forward velocity of the combine harvester was varied between 1 and 1.2 m/s, and a perforated bag was utilized to collect all the sieve outputs. The rice grains were isolated from the collected mixture using a re-cleaner (Agriculex ASC-3 Seed Cleaner, Guelph, ON, Canada) and weighed. The grain impurity ratio can be calculated by sampling from the grain tank (0.2–6 kg with an accuracy of ±1 g) according to the national standard in China (the outline of agricultural machinery popularization and identification: grain crops harvesting machinery, DG/T 014, 2009 [25]). From these measurements, the grain sieve loss and grain impurity ratio were then calculated as:
(1)
Grain sieve loss ratio, Sq:
S q = W q W × 100 %
where Wq is the collected grains in the perforated bag, g, and W is the grain mass in grain tank + Wq, g.
(2)
Grain impurity ratio, Zz:
Z z = W x z W x i × 100 %
where Wxz is the MOG mass in the grain sample, g, and Wxi is the sample mass, g.
The higher the grain sieve loss ratio and the grain impurity ratio, the worse the cleaning performance was [6]. The grain sieve loss should be ≤1% and the grain impurity ratio ≤2% according to the relevant Chinese standards (JB/T 5117-2006) (Ministry of Agriculture of the People’s Republic of China, 2006 [26]).

3. Results and Discussion

3.1. Threshed Output Distribution after Leaving the Concave

By using experimental data derived from the threshing experiments in the test bench, the corresponding average grain and MOG weight distribution along the rotors’ axial direction are shown in Figure 10.

3.1.1. Threshed Output Distribution under the Tangential Rotor

From Figure 10 it may be seen that there is the same distribution trend for grain and short straw along the axial direction (z-axis direction) of the tangential rotor, and the variations between them are minor. The grain and straw mass reached their maximum values in the third row, when the corresponding grain mass was 500 g and the straw mass was 150 g. The grain and straw mass reached their minimum values in the fourth row, with the corresponding grain mass being 370 g and the straw mass 77 g. The grains and short straw only accounted for a small proportion of the mass of the total threshed outputs.

3.1.2. Threshed Output Distribution under the Horizontal Axis Flow Rotor I

As can be seen from Figure 10, the grain mass along the z-axis direction of the horizontal axis flow rotor I appeared as an inversed V-shaped distribution, and the grain mass reached its maximum value (1950 g) in the sixth row. The minimum value was 450 g in the first column, and the distribution was also not uniform. The straw mass in the z-axis direction of the rotor gradually increased and then showed a decreasing trend from left to right. In the z-axis direction of the rotor, the grain mass reached a maximum of 350 g in the 6th row, and its minimum value was 175 g in the first column. The grains were mainly concentrated under the horizontal axis flow rotor I, and the distribution was not uniform. The straw was mainly concentrated under the horizontal axis flow rotor I and II, and the straw mass showed a slowly varying trend below the horizontal axis flow rotor I.

3.1.3. Threshed Output Distribution under the Horizontal Axis Flow Rotor II

As can be seen from Figure 10, the grain and straw masses below the horizontal axis flow rotor II exhibited a tendency of increasing and then decreasing. Grain mass reached its maximum value of 772 g at the fifth receiving box area in the X-axis direction. The maximum straw mass was at the sixth receiving box area in the z-axis direction, with a value of 350 g. The minimum grain mass, 302 g, was obtained at the 10th receiving box area in the z-axis direction. The straw mass resulted in a minimum value of 155 g in the axial first box area of the rotor. As can be seen from Figure 10, the grains below the horizontal axis flow rotor II were larger than for the tangential rotors, but smaller relative to the horizontal axis flow rotor I, and the overall distribution was relatively uniform; there was more straw under horizontal axis flow rotor II.
From the above analysis it can be concluded that the threshed outputs were mainly accumulated in the middle section of the return plate and that the threshed output was not uniform before entering the cleaning shoe. As the airflow inside the cleaning shoe always passes easily through the space with less resistance, the uneven threshed output when entering the cleaning shoe was not beneficial for ideal airflow distribution inside the cleaning shoe, since the grain does not penetrate the sieve instantly, leading to a relatively large grain sieve loss and grain impurity ratio in the grain tank.

3.2. EDEM Simulation Results Analysis

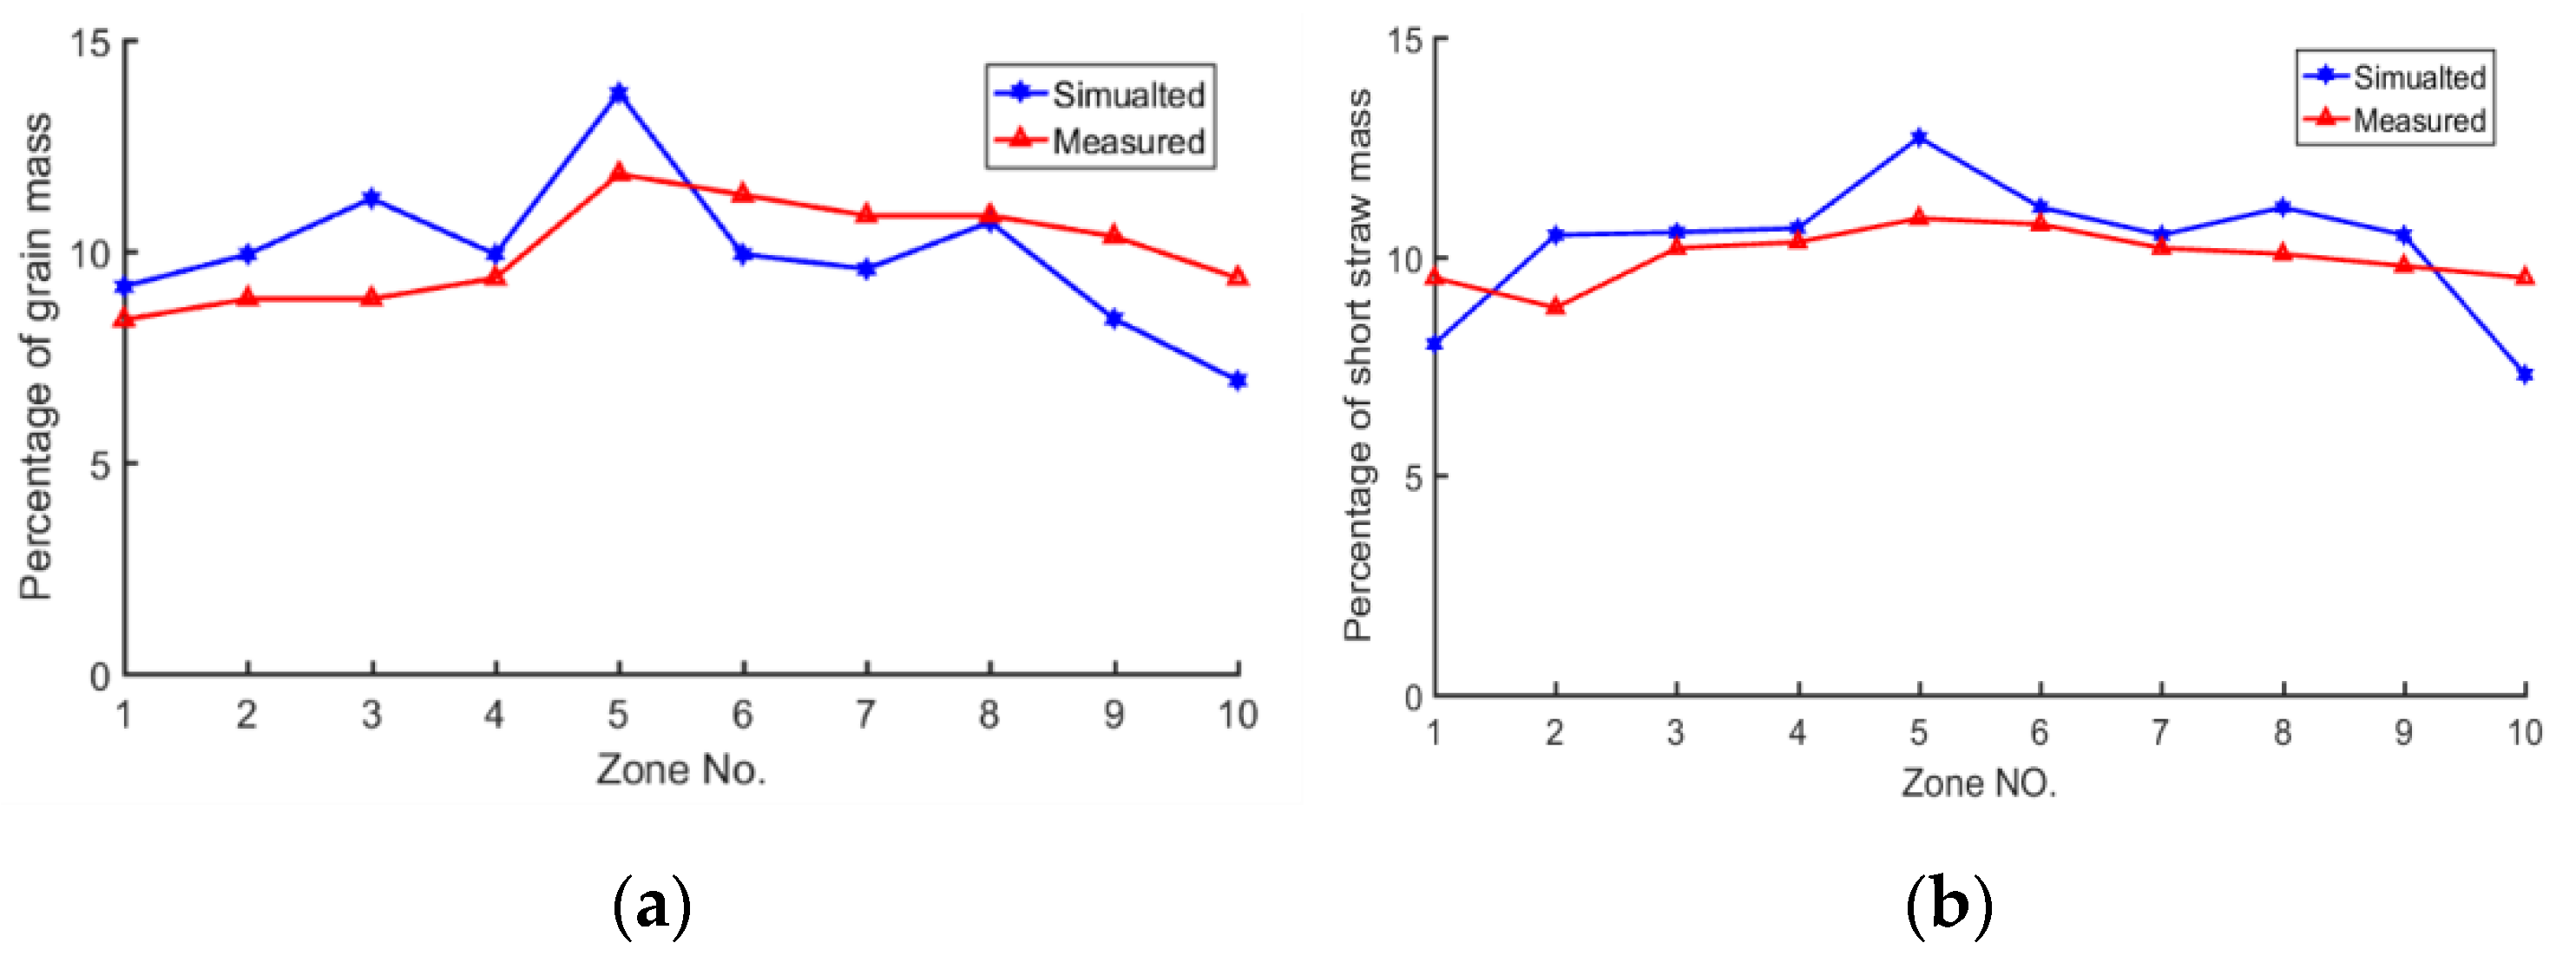
The numbers of grain and short straw in different zones were determined by a test bench experiment, shown in Table 3. For an analysis of the distance between the simulated results and the experiment’s results, the respective proportions of the grain and the MOG mass in different zones is shown in Figure 11. The average simulated results and experimental results are used in Figure 11. As shown in Figure 11, the simulated results of grain and MOG distribution are consistent with the measured values in their variation trends. The simulation results can thus be accepted.
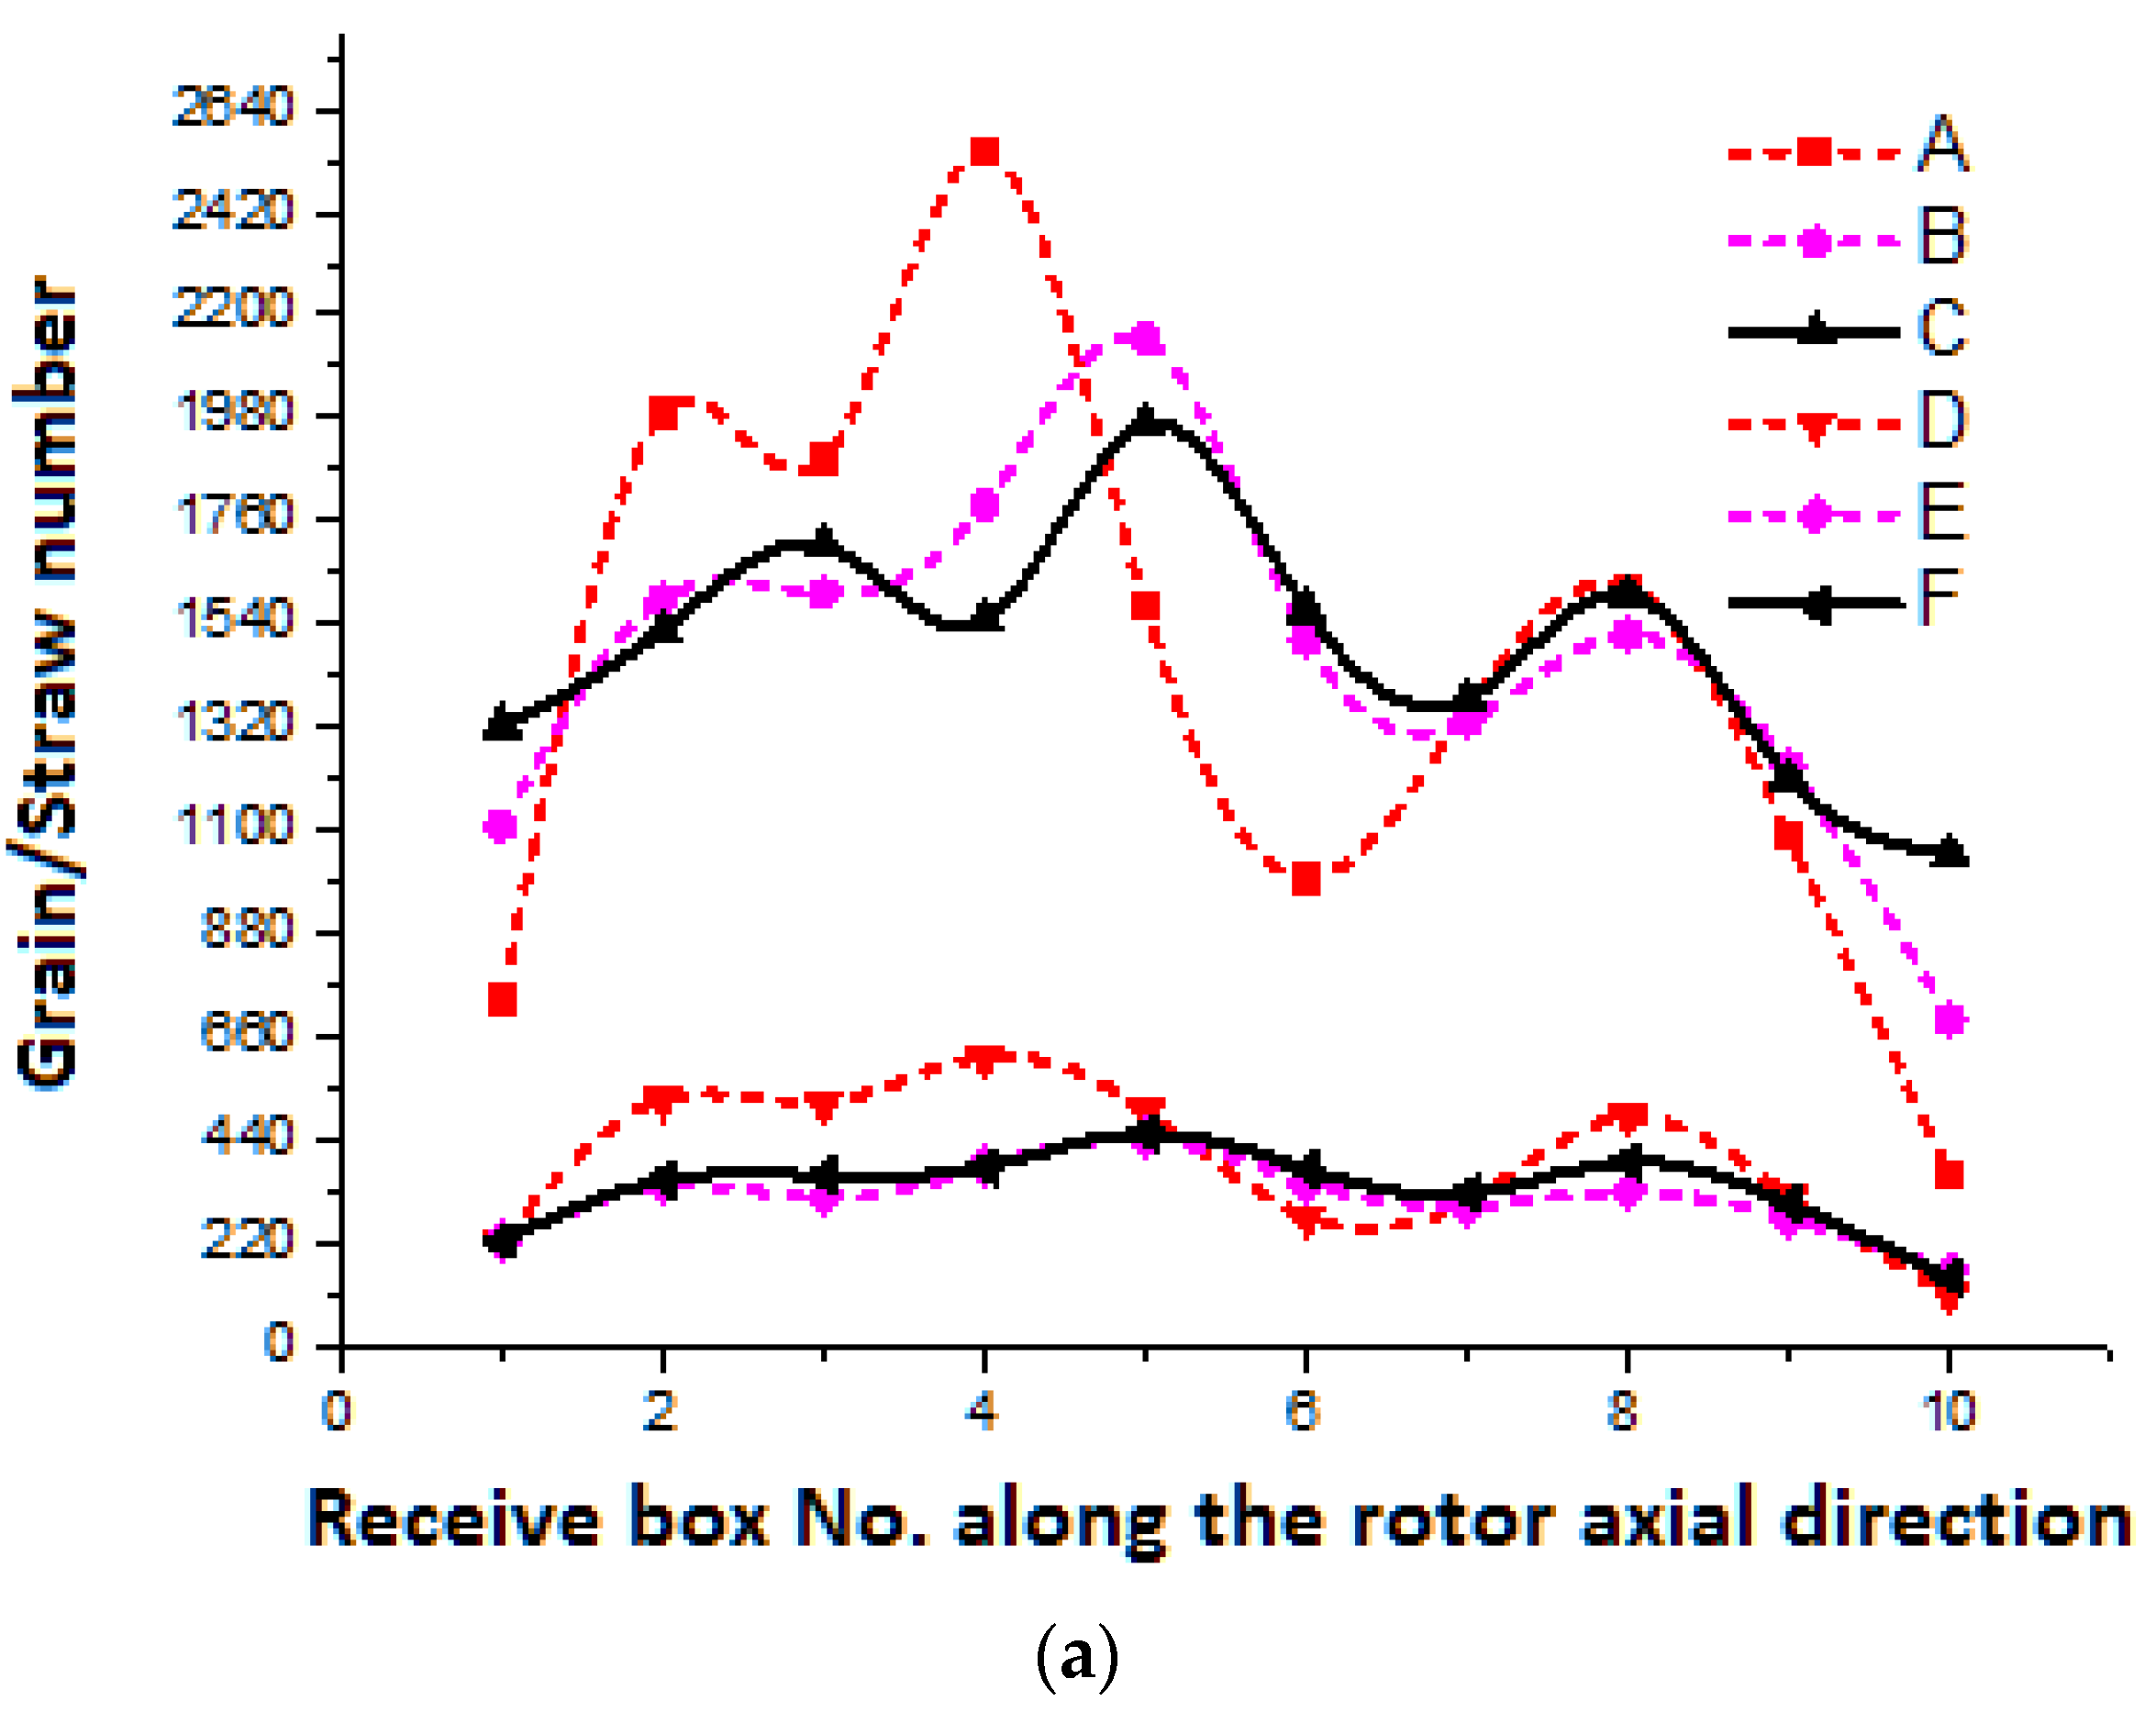
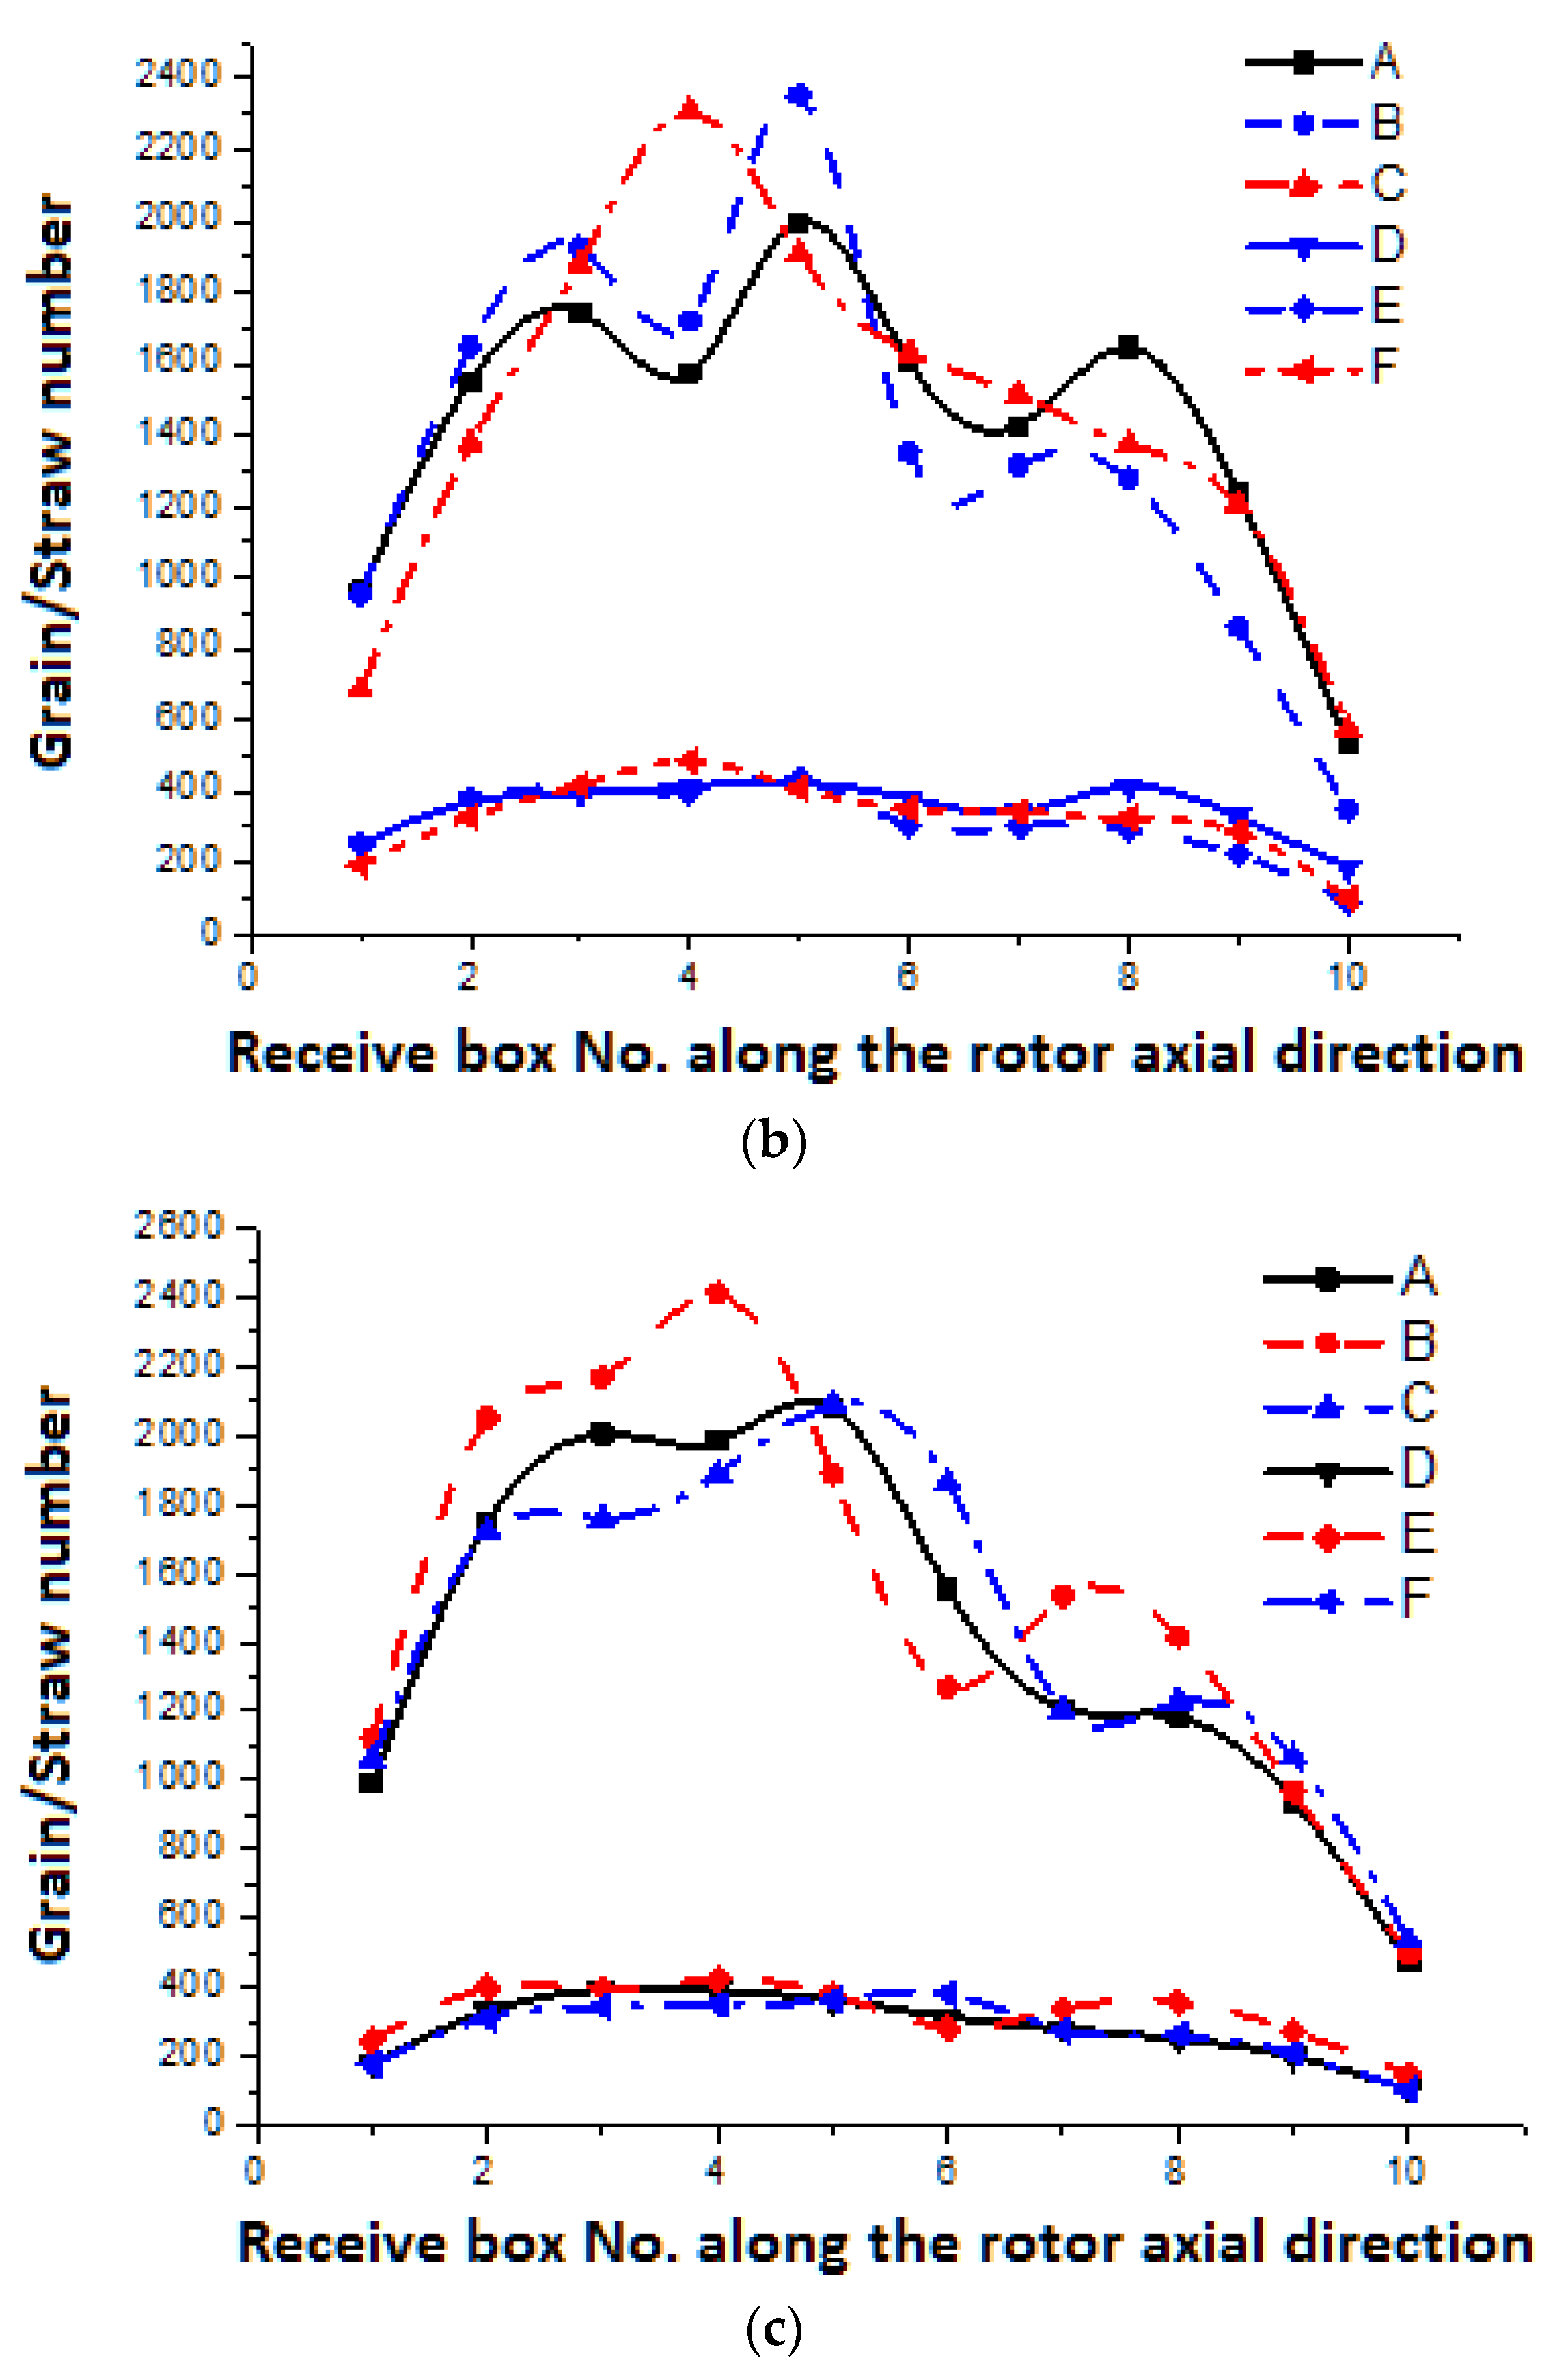
By using experimental data derived from EDEM software simulations, the distributions of grains and MOGs along the width of the return plate for different guide blades arrangement are shown in Figure 12. The average simulated results in each point were used for Figure 12. From Figure 12 it can be learnt that the guide blades had a significant effect on grain distribution in the z-axis direction of the return plate before entering the cleaning shoe. However, the guide blades had a little effect on short straw distribution. Test 3’s results indicate that a guide blade with a height of 50 mm, an installation angle on the surface of the return plate of 25°, and two guide blades parallel to each other is the optimum arrangement for the guide blades; the threshed mixture distribution was relatively even after leaving the return plate, while in the other groups, the threshed output distribution had a large variation in the axial direction (z-axis) of the rotors, which is not beneficial for grain stratification and penetration in the following process.
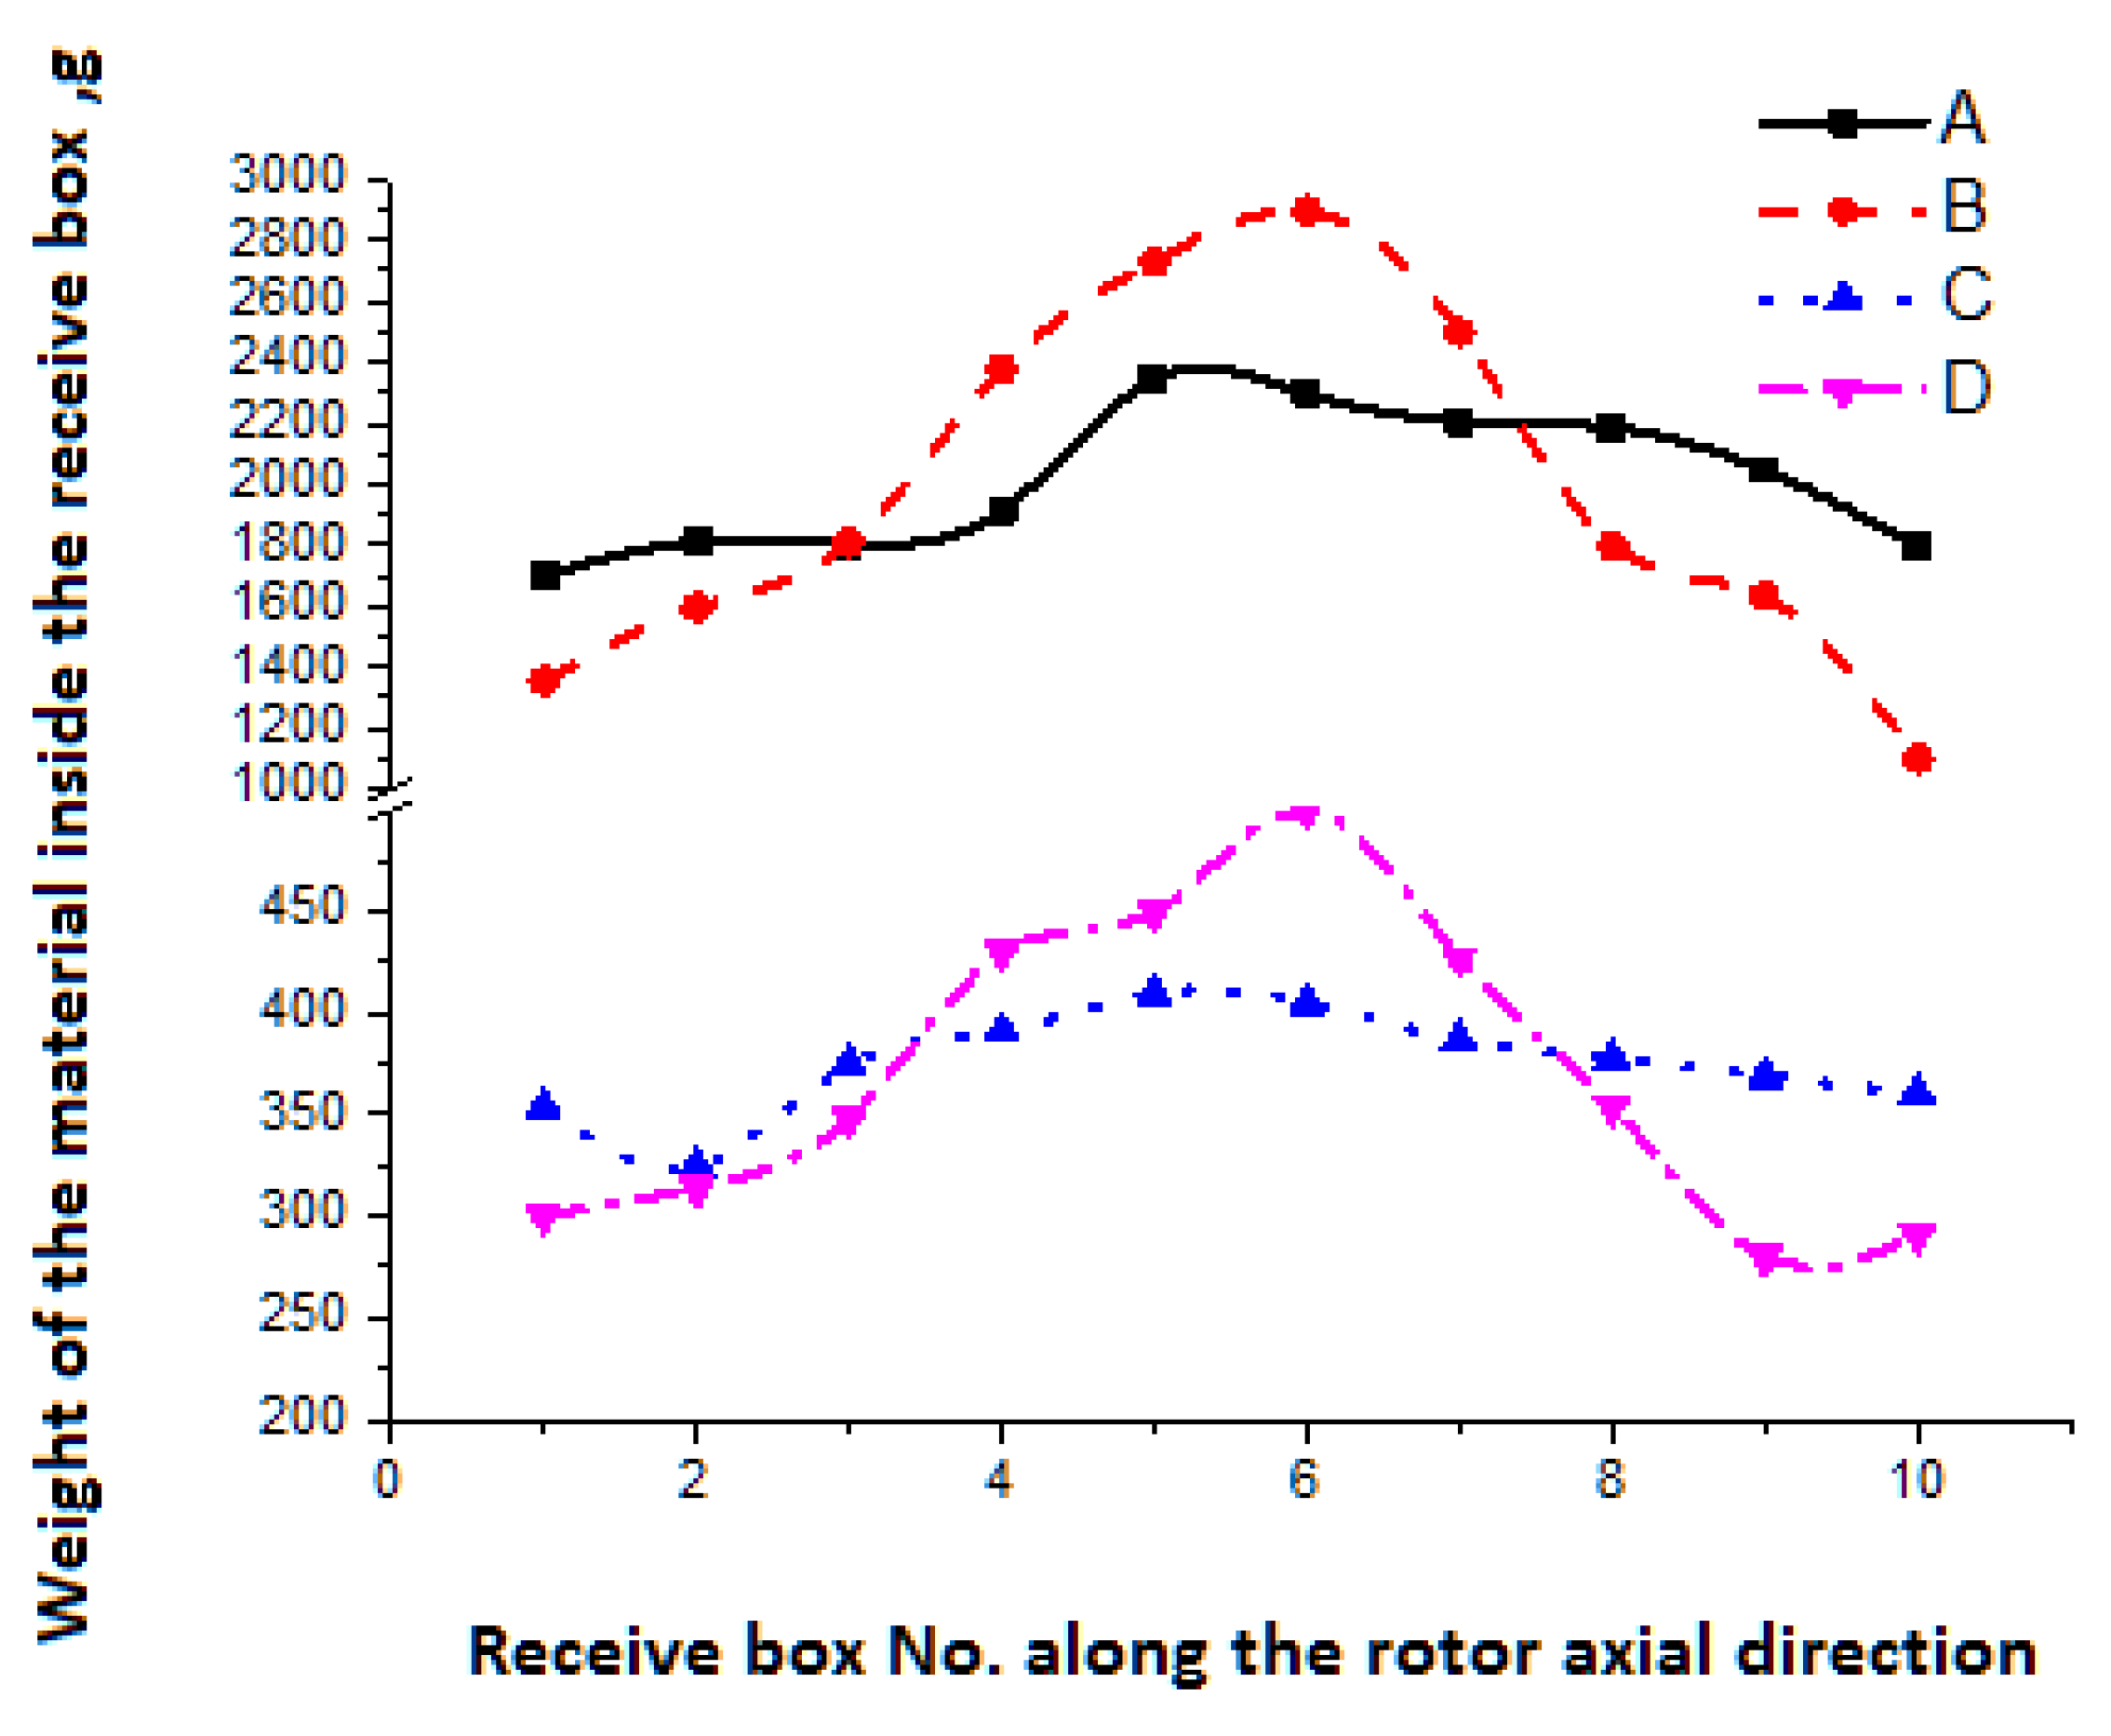
By using experimental data derived from field experiments, the grains and MOGs distributed along the width of the return plate are shown in Figure 13. The average experimental data in each point were used in Figure 13. From Figure 13 it may be seen that for the grains accumulated in the middle section of the hard board along the rotor axial direction (z-axis direction), the maximum mass was up to 2800 g, while for the return plate with the guide blades, the distribution of grains was more even, with the grain mass in different zones spreading in the range of 1700–2200 g. The distribution of the short straw also expresses a pronounced even distribution along the hard board after the guide blade was installed; the mass of the short straw was distributed in the range of 335–410 g for each zone. From the above analysis it is clear that the threshed mixture was more evenly distributed before entering the cleaning shoe after the guide blade was installed with the optimum arrangement.

3.3. Field Experiment Results

Field experiments were carried out in Lianhu farm, Danyangcity, Jiangsu Province, China. The tested rice was “Long Jing 29”, with a plant height of 780–800 mm and an average spike length of 16.3 mm. The average weight of one thousand kernels was 28 g and the average grain output was 8922 kg ha−1. The average grain-to-MOG (material other than grain) ratio was 2.7:1, and the average moisture contents of the stalks and the kernels were, respectively, 71.1% and 27.6%.
From the field experiment results shown in Table 4, it may be seen that the average grain impurity ratio declined significantly from 1.26 to 0.67% after installing the guide blades on the return plate; the average grain sieve loss ratio, with a decrease of 53.2%, was reduced from 1.11 to 0.52%. The above experimental results indicate that the clearing performance significantly improved with proper guide blade arrangement.

4. Conclusions

(1)
The optimum arrangement location of the guide blades was obtained by analyzing the simulated results under different arrangements. A height of 50 mm for the guide blade, an installation angle of 25° on the surface of the return plate, and two guide blades placed parallel to each other were found to constitute the optimum arrangement.
(2)
The field experiment’s results indicate that the simulated results were validated by the experimental results. The field experiment’s results indicate that the cleaning performance significantly improved with proper guide blade arrangement. The average grain impurity ratio declined significantly from 1.26 to 0.67%, and the average grain sieve loss ratio, with a decrease of 53.2%, was reduced from 1.11 to 0.52%.

Author Contributions

Conceptualization, Z.L. and Y.L.; methodology, J.L. (Jianmin Liang); software, Y.S.; validation, T.Z.; formal analysis, Z.S.; data curation, T.Z.; writing—original draft preparation, J.L. (Jun Li); writing—review and editing, Z.L.; supervision, Z.L.; funding acquisition, Y.L. All authors have read and agreed to the published version of the manuscript.

Funding

This research was supported by the Natural Science Foundation of Jiangsu Province (BK20190859), China; a project funded by the China Postdoctoral Science Foundation (2019M651746 and 2020T130260), China; a project for postdoctoral researchers in Jiangsu Province, China (2019Z106); the Jiangsu Association of Science and Technology Young Talent Support Project (2020–2021); the Key R&D projects in Zhenjiang (NY2021009); a project funded by the Key Laboratory of Modern Agricultural Equipment and Technology, Jiangsu University (MAET202124); and by a project funded by the Priority Academic Program Development of Jiangsu Higher Education Institutions (No. PAPD-2018-87), China, and the Key R&D projects in the Shandong Province of China (no. 2019JZZY010729).

Institutional Review Board Statement

Not applicable.

Informed Consent Statement

Not applicable.

Data Availability Statement

The datasets generated during and/or analyzed during the current study are available from the corresponding author upon reasonable request.

Conflicts of Interest

The authors declare no conflict of interest.

References

  1. Liang, Z.W.; Li, Y.M.; Xu, L.Z.; Zhao, Z. Sensor for monitoring rice grain sieve losses in combine harvesters. Biosyst. Eng. 2016, 147, 51–66. [Google Scholar] [CrossRef]
  2. Yuan, L.P. Progress in super-hybrid rice breeding. Crop. J. 2017, 5, 100–102. [Google Scholar] [CrossRef]
  3. Li, Y.M.; Xu, T.B.; Xu, L.Z.; Zhao, Z. Test-bed of threshing and separating unit with multi cylinder. Trans. CSAM 2013, 4, 95–98. [Google Scholar]
  4. Li, Y.M.; Zhou, W.; Xu, L.Z.; Sun, T.; Tang, Z. Parameter test and optimization of tangential-horizontal- horizontal threshing and separating device. Trans. CSAM 2015, 46, 62–67. [Google Scholar]
  5. Tang, Z.; Li, Y.; Zhao, Z.; Sun, T. Structural and parameter design of transverse multi-cylinders device on rice agronomic characteristics. Span. J. Agric. Res. 2015, 13, e0216. [Google Scholar] [CrossRef] [Green Version]
  6. Liang, Z.W.; Li, Y.M.; De Baerdemaeker, J.; Xu, L.Z.; Saeys, W. Development and testing of a multi-duct cleaning device for tangential-longitudinal flow rice combine harvesters. Biosyst. Eng. 2019, 182, 95–106. [Google Scholar] [CrossRef]
  7. Cundall, P.A.; Strack, O.D. A discrete numerical model for granular assemblies. Géotechnique 1979, 29, 47–65. [Google Scholar] [CrossRef]
  8. Kawaguchi, T.; Tanaka, T.; Tsuji, Y. Numerical simulation of two-dimensional fluidized beds using the discrete element method (comparison between the two- and three-dimensional models). Powder Technol. 1998, 96, 129–138. [Google Scholar] [CrossRef]
  9. Sakaguchi, E.; Suzuki, M.; Favier, J.; Kawakami, S. PH—Postharvest Technology: Numerical Simulation of the Shaking Separation of Paddy and Brown Rice using the Discrete Element Method. J. Agric. Eng. Res. 2001, 79, 307–315. [Google Scholar] [CrossRef]
  10. Tijskens, E.; Ramon, H.; Baerdemaeker, J. Discrete element modelling for process simulation in agriculture. J. Sound Vib. 2003, 266, 493–514. [Google Scholar] [CrossRef]
  11. Landry, H.; Laguë, C.; Roberge, M. Discrete element modeling of machine–manure interactions. Comput. Electron. Agric. 2006, 52, 90–106. [Google Scholar] [CrossRef]
  12. Wynn, E. Simulations of rebound of an elastic ellipsoid colliding with a plane. Powder Technol. 2009, 196, 62–73. [Google Scholar] [CrossRef]
  13. Wojtkowski, M.; Pecen, J.; Horabik, J.; Molenda, M. Rapeseed impact against a flat surface: Physical testing and DEM simulation with two contact models. Powder Technol. 2010, 198, 61–68. [Google Scholar] [CrossRef]
  14. Alian, M.; Ein-Mozaffari, F.; Upreti, S.R. Analysis of the mixing of solid particles in a plowshare mixer via discrete element method (DEM). Powder Technol. 2015, 274, 77–87. [Google Scholar] [CrossRef]
  15. Horabik, J.; Molenda, M. Parameters and contact models for DEM simulations of agricultural granular materials: A review. Biosyst. Eng. 2016, 147, 206–225. [Google Scholar] [CrossRef]
  16. Lenaerts, B.; Aertsen, T.; Tijskens, E.; De Ketelaere, B.; Ramon, H.; De Baerdemaeker, J.; Saeys, W. Simulation of grain–straw separation by Discrete Element Modeling with bendable straw particles. Comput. Electron. Agric. 2014, 101, 24–33. [Google Scholar] [CrossRef] [Green Version]
  17. Hager, A.; Kloss, C.; Pirker, S.; Goniva, C. Parallel Resolved Open Source CFD-DEM: Method, Validation and Application. J. Comput. Multiph. Flows 2014, 6, 13–27. [Google Scholar] [CrossRef] [Green Version]
  18. Salikov, V.; Antonyuk, S.; Heinrich, S.; Sutkar, V.S.; Deen, N.G.; Kuipers, H. Characterization and CFD-DEM modelling of a prismatic spouted bed. Powder Technol. 2015, 270, 622–636. [Google Scholar] [CrossRef] [Green Version]
  19. Markauskas, D.; Kruggel-Emden, H.; Sivanesapillai, R.; Steeb, H. Comparative study on mesh-based and mesh-less coupled CFD-DEM methods to model particle-laden flow. Powder Technol. 2017, 305, 78–88. [Google Scholar] [CrossRef] [Green Version]
  20. Volk, A.; Ghia, U.; Stoltz, C. Effect of grid type and refinement method on CFD-DEM solution trend with grid size. Powder Technol. 2017, 311, 137–146. [Google Scholar] [CrossRef] [Green Version]
  21. Yang, M.J.; Yang, L.; Li, Q.D. Simple measurement of restitution coefficient of granular material and its application. J. Agric. Mech. Res. 2009, 31, 25–27. [Google Scholar]
  22. Qiao, Z.X. Studies on characteristics of material mechanics of rice grains. Acta Agric. Univ. Jiangxiensis 1992, 14, 1–9. [Google Scholar]
  23. Zhang, H.X.; Li, D.Y.; Yang, X.S. Research on shear properties of brown rice grain. J. Heilongjiang August First Land Reclam. Univ. 2006, 18, 46–49. [Google Scholar]
  24. Li, H.C.; Li, Y.M.; Gao, F.; Zhao, Z.; Xu, L.Z. CFD-DEM simulation of material motion in air-and-screen cleaning device. Comput. Electron Agric. 2012, 88, 111–119. [Google Scholar] [CrossRef]
  25. DG/T 014-2009; Ministry of Agriculture of People’s Republic of China. The Outline of Agricultural Machinery Popularization and Identification: Grain Crops Harvesting Machinery. Ministry of Agriculture of People’s Republic of China: Beijing, China, 2009.
  26. JB/T 5117-2006; National Development and Reform Commission of China. Whole-Feed Combine Harvester Technical Requirements. National Development and Reform Commission of China: Beijing, China, 2006.
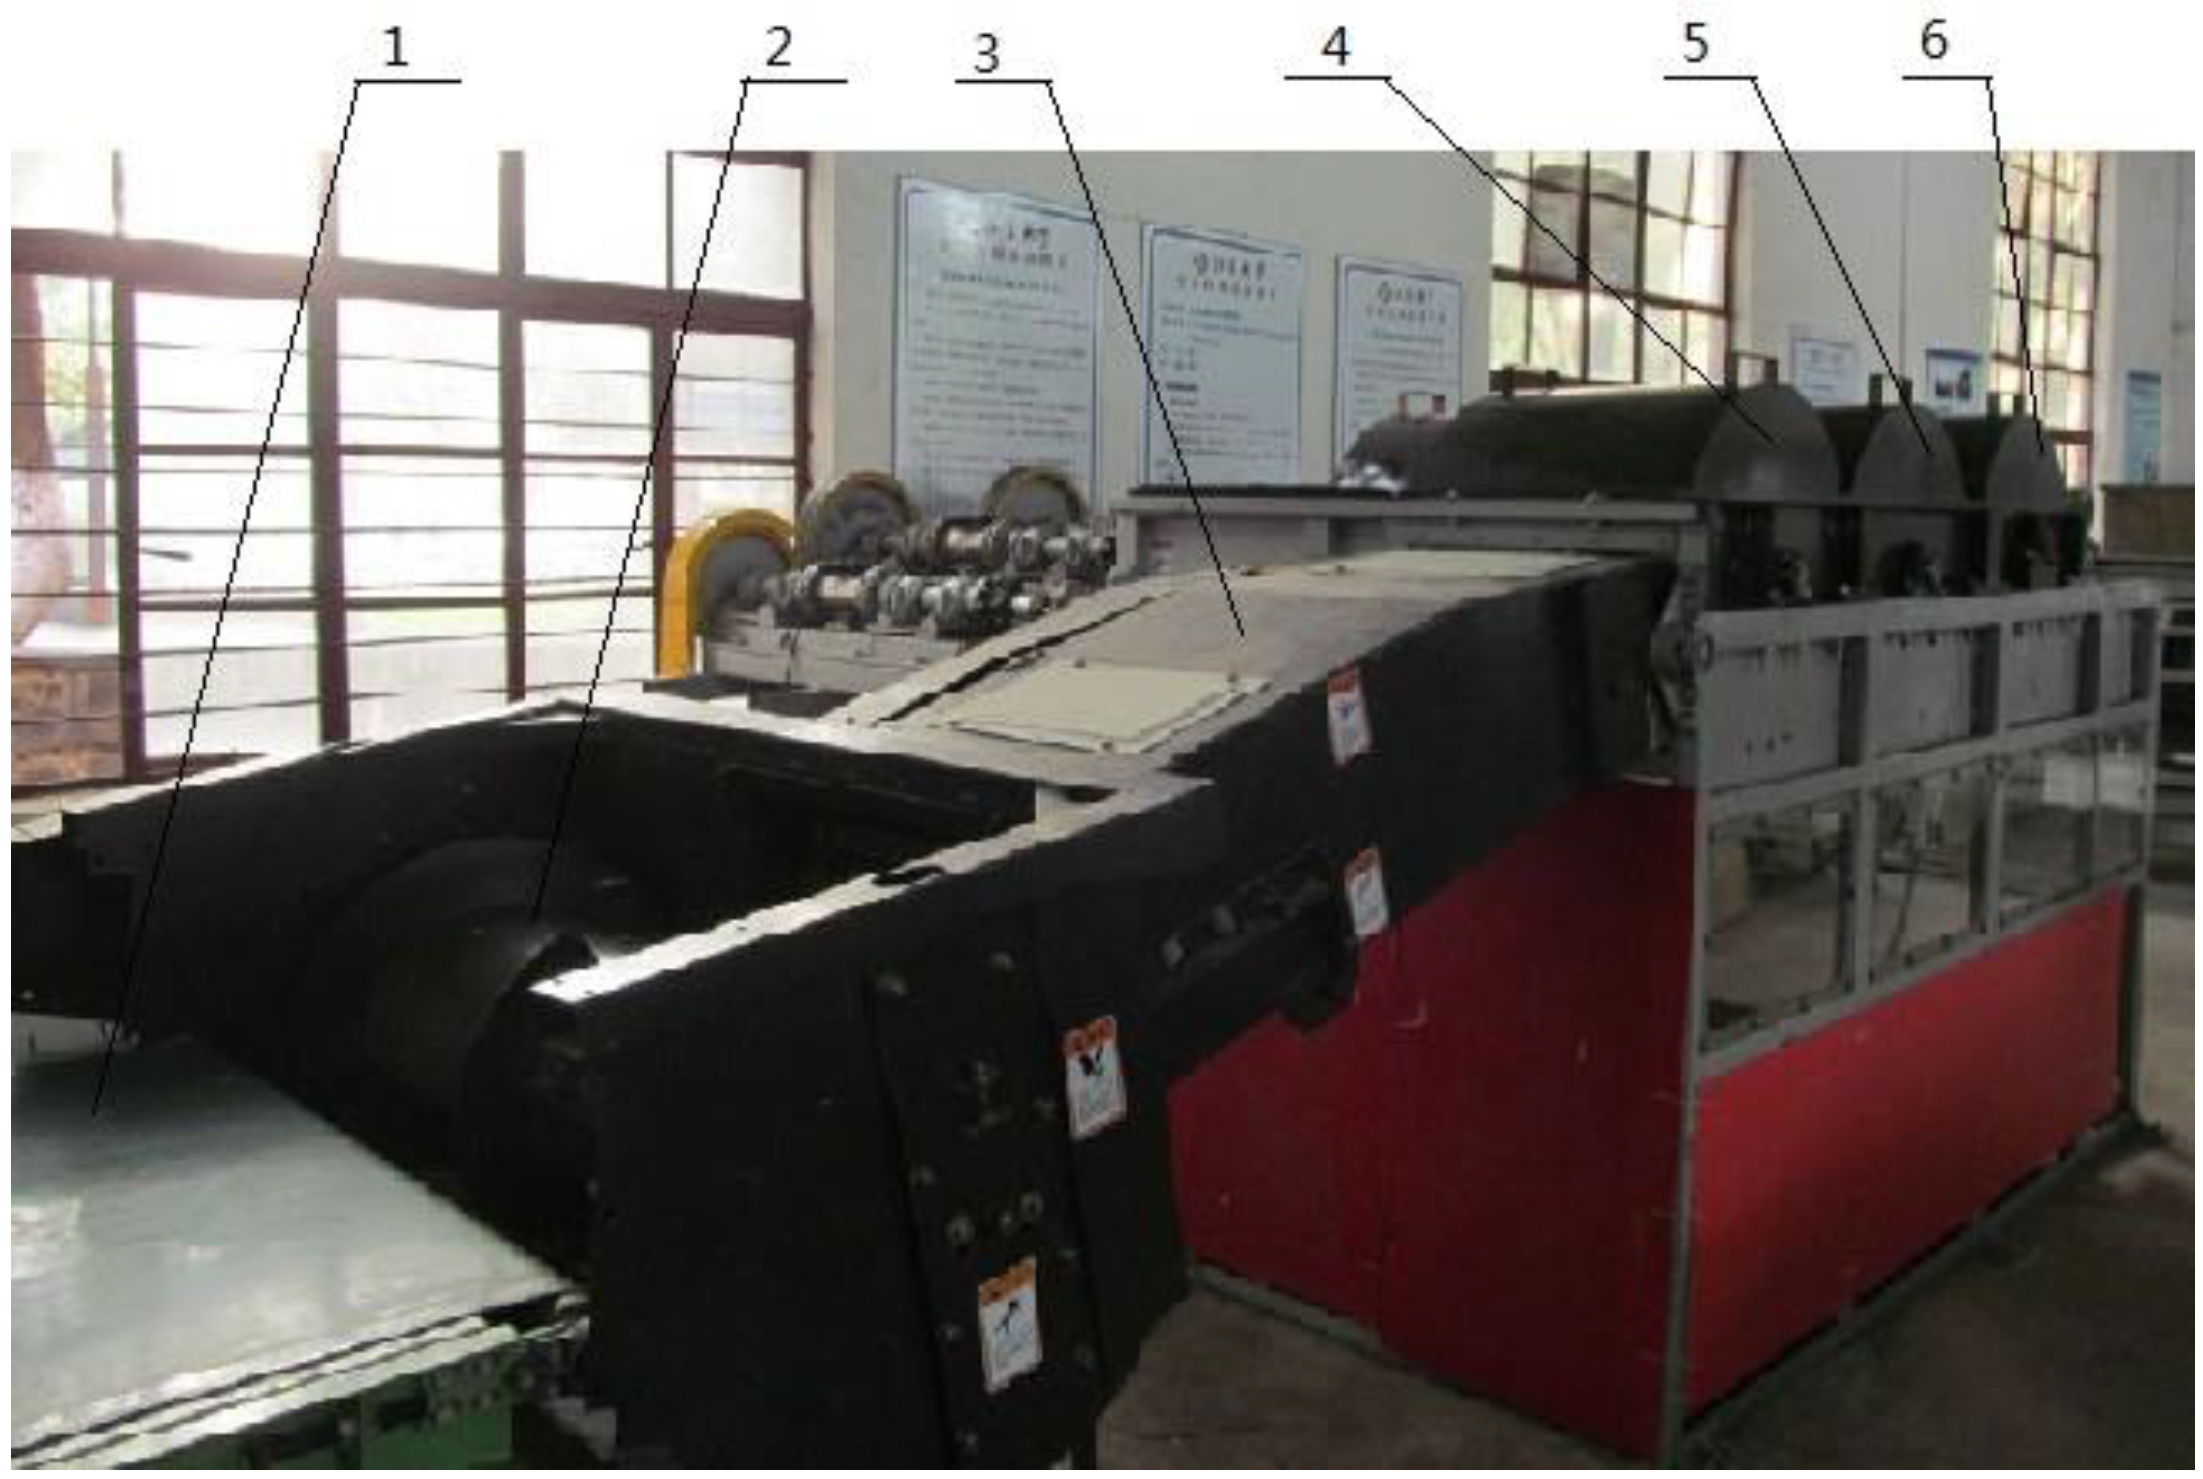
Figure 1. Schematic diagram of multi-cylinder threshing and separating device: 1, conveyor. 2, feeder auger. 3, feeder conveyor. 4, tangential rotor. 5, the horizontal axis flow rotor I. 6, the horizontal axis flow rotor II.
Agriculture 12 00435 g001
Figure 2. Developed grain particle model and short straw particle model: (a) grain model; (b) short straw model.
Agriculture 12 00435 g002
Figure 3. Distribution of threshed output mixture delivery model: (a) Simulation model (1, receiving box; 2, guide blade; 3, return plate; 4, particle generators). (b) Particle generator distribution.
Agriculture 12 00435 g003
Figure 4. Front view of the overall structure of stepped tangential–horizontal–horizontal combine harvester. 1, header. 2, conveyor. 3, cabin. 4, engine. 5, chassis. 6, threshing rotors. 7, cleaning systems. 8, exhaust pick-up device.
Agriculture 12 00435 g004
Figure 5. Crop flow process in the multi-rotor threshing unit (top view). 1, tangential rotor. 2, horizontal axis flow rotor I. 3, horizontal axis flow rotor II. 4, transition plate I. 5, transition plate II. 6, straw-crushing device.
Agriculture 12 00435 g005
Figure 6. Schematic diagram of multi-duct cleaning system. 1, tangential rotor. 2, concave of the tangential rotor. 3, concave of the horizontal axis flow rotor I. 4, grain pan. 5, upper outlet. 6, fan blades. 7, guide plate I. 8, guide plate II. 9, grain auger. 10, sieve opening adjustor. 11, return plate. 12, woven sieve. 13, louver sieve. 14, tailings auger. 15, tail. 16, horizontal axis flow rotor I. 17, horizontal axis flow rotor II, 18, horizontal axis flow rotor II.
Agriculture 12 00435 g006
Figure 7. Schematic diagram of the guide blade installation position.
Agriculture 12 00435 g007
Figure 8. Installation location of the guide blades.
Agriculture 12 00435 g008
Figure 9. Pick-up board installation location.
Agriculture 12 00435 g009
Figure 10. Distribution curves of mixture along the z-axis. A, grain separated by the tangential rotor. B, grain separated by horizontal axis flow rotor I. C, grain separated by the horizontal axis flow rotor II. D, short straw separated by the tangential rotor. E, short straw separated by the horizontal axis flow rotor I. F, short straw separated by the horizontal axis flow rotor II.
Agriculture 12 00435 g010
Figure 11. Comparison of simulated and measured results on threshed output distribution: (a) grain, (b) short straw.
Agriculture 12 00435 g011
Figure 12. Simulation results from different guide blade arrangements: (a) The angle of the guide blade is 25° (A: Grain distribution of Simulation 1; B: Grain distribution of Simulation 2; C: Grain distribution of Simulation 3; D: Straw distribution of Simulation 1; E: Straw distribution of Simulation 2; F: Straw distribution of Simulation 3). (b) The angle of the guide blade is 30° (A: Grain distribution of Simulation 4; B: Grain distribution of Simulation 5; C: Grain distribution of Simulation 6; D: Straw distribution of Simulation 4; E: Straw distribution of Simulation 5; F: Straw distribution of Simulation 6). (c) The angle of the guide blade is 35° (A: Grain distribution of Simulation 7; B: Grain distribution of Simulation 8; C: Grain distribution of Simulation 9; D: Straw distribution of Simulation 7; E: Straw distribution of Simulation 8; F: Straw distribution of Simulation 9).
Agriculture 12 00435 g012aAgriculture 12 00435 g012b
Figure 13. Comparison of before and after installation of the bar: A, grain distribution for return plate with guide blade; B, grain distribution for return plate without guide blade; C, straw distribution for return plate with guide blade; D, straw distribution for return plate without guide blade.
Agriculture 12 00435 g013
Table 1. Summary of EDEM simulation parameters.
Material PropertiesShort StrawReturn PlateRice Grain
Density (kg/m3)16078501350
Young’s modulus (Pa)1.3 × 1072.0 × 10115.0 × 108
Poisson’s ratio0.450.290.25
Collision propertiesGrain–plateShort straw–return plateGrain–grain
Restitution coefficient0.50.260.43
Rolling friction coefficient0.010.010.01
Static friction coefficient0.560.80.75
Table 2. L9(33) orthogonal experimental design.
Test No.Angle of the Guide Blade (°)Height of the Guide Blade (m)Guide Blade Number
125301
225402
325503
430302
530403
630501
735303
835401
935502
Table 3. Grain and short straw number in each particle generator.
LocationGrain NumberShort Straw Number
175001200
21900350
31600300
42200450
51200380
63000400
71500450
829001000
Table 4. Comparison of experimental results for cleaning performance.
Test ConditionsTest No.Grain Impurity Ratio
(%)
Average Grain Impurity Ratio
(%)
Grain Sieve Loss Ratio
(%)
Average Grain Sieve Loss Ratio
(%)
Without guide blade11.111.260.971.11
21.231.19
31.431.12
With guide blade10.700.670.520.52
20.680.54
30.620.49
Publisher’s Note: MDPI stays neutral with regard to jurisdictional claims in published maps and institutional affiliations.