Article

N2O Emission and Nitrification/Denitrification Bacterial Communities in Upland Black Soil under Combined Effects of Early and Immediate Moisture

1
Liaoning Provincial Universities Key Laboratory of Environmental Science and Technology, School of Environment and Chemical Engineering, Dalian Jiaotong University, Dalian 116028, China
2
Institute of Molecular Plant Science, University of Edinburgh, Edinburgh EH9 3BF, UK
3
Institute of Applied Ecology, Chinese Academy of Sciences, Shenyang 110016, China
4
Institute of Soil Science, Chinese Academy of Sciences, Nanjing 210008, China
*
Author to whom correspondence should be addressed.
These authors contributed equally to this work.
Agriculture 2022, 12(3), 330; https://doi.org/10.3390/agriculture12030330
Submission received: 13 January 2022 / Revised: 10 February 2022 / Accepted: 15 February 2022 / Published: 25 February 2022
(This article belongs to the Special Issue Advanced Research of Soil Microbial Functional Diversity)

Abstract

:
Soil moisture is the major factor influencing microbial properties and nitrous oxide (N2O) production. Agricultural soils can be probed under wetting, wet/dry alternating, and constant moisture conditions to evaluate the combined effects of early (previous) and immediate (current) moisture on N2O emission and nitrification/denitrification. In view of the water history of upland black soil, five moisture regimes comprising different antecedent and present water holding capacity (WHC) levels were set up in the microcosm study. The 20% WHC was adopted as the initial legacy moisture, while three immediate water statuses include constant WHC, dry-wet cycle, and incremental moisture. Quantitative PCR and 16S rRNA amplicon sequencing were used to assess the impact of current and previous moisture on the bacterial community composition and abundance of nitrification/denitrification genes (amoA, nirS, and nosZ); the soil physicochemical properties, and N2O emission were monitored. The N2O production and nitrifying-denitrifying microbial communities were influenced by the antecedent moisture and pattern of the dry-wet cycle. The nitrifying-denitrifying microbial communities, especially members of β-/γ-Proteobacteria, Bacteroidetes and Gemmatimonadetes, in black soil were important in explaining the variation of N2O production. The key taxonomic groups in response to the moisture alteration, e.g., Acidobacteria, Sphingobacteriia, Deltaproteobacteria, Methylobacterium, Gemmatimonas and Pseudarthrobacter, etc., were also highlighted. The soil nitrate, ammonium nitrogen, N2O emission, nitrification/denitrification and mineralization were profoundly impacted by water regimes and showed statistically significant correlation with specific bacterial genera; the nitrite/nitrate reduction to ammonium could be boosted by high moisture. Both nitrifier denitrification and heterotrophic denitrification could be enhanced substantially when the black soil moisture was increased to above 60% WHC. These findings help evaluate the effects of the water mode on the N2O emission from black soil, as well as the associated impacts on both soil fertility and the global environment.

1. Introduction

Black soil is rich in organic matter and of high fertility [1]. In light of the water and heat conditions of soil, the soil aeration and heat absorption, the microbial functions that accelerate the decomposition of organic matter, and the soil effective fertility, black soil is very suitable for plant growth. The northeast black soil region is one of the main cereal crop producing areas in China. Because of intensive utilization, black soil is very degraded [2], and the utilization rate of nitrogen fertilizer is reduced, accompanied by nitrogen loss and environmental problems, e.g., the emission of greenhouse gas nitrous oxide (N2O). Soil physicochemical and biological properties, such as moisture, aeration, pH, inorganic nitrogen, organic carbon, and microbial community/populations largely determine the production and emission of N2O [3,4]; among them, soil moisture status has a particularly strong impact on N2O production [5]. While there have been studies investigating the effects of water regime on N2O in soils, a majority of them focused on the effects of water content [4,6] or the wet-dry cycle [7] and the relationship between N2O production/discharge and soil moisture history (preceding water) was comparatively less-studied. In recent years, however, the effects of early soil moisture on soil N2O and nitrification and denitrification microbial communities have attracted attention [8,9]. Studying those effects is of great significance for accurately assessing greenhouse gas production and emission in black soils and exploring the response and adaptation mechanism of soil microbes to water conditions.
Soil water content has a complex effect on N2O emission and nitrification/denitrification [10]. In microcosm experiments of northern acidic soils in Finland, high moisture soils of drained peatlands had the highest N2O and nitric oxide (NO) emissions [11], as well as the highest HONO production rates [12]. It is generally believed that, below a certain critical level of moisture, N2O emissions increase with the increase of water content [4]. When the soil moisture reaches 60–80% water holding capacity (WHC), the N2O emission is the highest. Our previous studies showed that N2O emissions were the highest in Wuxi (Jiangsu, China) paddy-upland rotation loess soils with 80% WHC, while those in Yingtan (Jiangxi, China), red soils, with 100% WHC, were the most intense [13]. In addition, under aerobic or anaerobic conditions, the soil water content also affects the consumption of N2O in different modes [6].
Soil N2O is mainly produced by nitrification and denitrification of soil microorganisms [14]. Soil nitrification is the main process of N2O production under low water content, while denitrification and nitrifier-induced denitrification (NiD) are the main sources of N2O under high water content [15,16,17]. The direct relationship between the soil water content and soil microorganisms can be scrutinized by real-time quantitative PCR [18] and high throughput DNA sequencing [19]. For instance, with MiSeq sequencing of 16S rRNA genes, it was found that short-term irrigation had a negligible impact on soil microbiomes under field conditions [20]. The quantitative PCR was utilized to quantify the abundance and community composition of nitrification and denitrification microbes [21,22]; the N2O emissions and the succession of nitrifying/denitrifying communities were selectively affected by soil moisture in red soil and alluvial soil [21], and ammonia-oxidation (AO) and successive nitrifier denitrification (ND) were the main pathways contributing to N2O emissions at the earlier period after ammonium sulfate application [22]. It was found that the wet-dry cycle greatly promoted N2O emissions [7], possibly mediated by the alternation of nitrification and denitrification processes. Another study found that the N2O production of the dry-wet cycle was higher than that of constant-wet soil treatment in both drought and wet stages [23]. However, it was also reported that alternating wetting and drying reduced soil N2O emissions in Canada [24]. The dry-wet cycle affects soil microbial activity and community structure [25]. Under drought conditions, mortality of soil microorganisms may be high [26], with degradation of microbial residues facilitating the availability of labile organic carbon. Both nitrifying bacteria and denitrifying bacteria can tolerate extreme drought conditions and have high activity in a short time when dry soil becomes wet. Denitrifiers are more sensitive to water changes; when soil becomes wet, denitrifiers increased rapidly [27], and the effect of the wet-dry cycle on denitrifiers was much stronger than that on nitrifiers. The dry-wet cycle alters the soil microbial community and edaphic nitrification/denitrification, thus affecting the pathways of N2O production; changes in microbial activity affect the progress of each pathway. In alluvial soil and red soil, increased soil moisture stimulated the growth of ammonia-oxidizing bacteria (AOB) and nitrite reducer (nirK) [21], but total N2O emissions were only positively correlated to AOB abundance. Re-wetting agricultural soil, instead of wetland soil, led to an increased denitrification rate [28], and N2O production was reduced after the first drying and rewetting event. However, there is a knowledge gap in the correlation between black soil moisture regime, microbial community, and N2O alteration.
N2O is an intermediate product of nitrogen transformation. The form of soil nitrogen varies with the change of environmental conditions. When environmental conditions are variable, the change of nitrogen form could promote N2O production and emission. Thus, the intensity and frequency of environmental alterations could have a major impact on N2O emissions. The majority of studies assessed N2O emissions under relatively stable moisture regimes [14,29], and thus, the extent of the impact of dynamic soil moisture changes on N2O production remains underexplored. We hypothesize that the cycle of wetting and drying affects the activity of soil nitrification/denitrification microorganisms, and subsequent changes of the absolute and relative intensity of nitrification/denitrification and soil enzyme activity swiftly increase the production and emission of N2O.
The aim of the present study is to investigate the N2O emission and nitrification/denitrification bacterial communities in upland black soil under combined effects of early and immediate moisture. Given various kinds of water conditions in black soil areas, soils with the antecedent moisture of 20–80% were used in the present study; the original field moisture is 20%, while 40–100% WHC was achieved via sample pretreatment. The microcosm experiments were conducted to study three moisture regimes (static/constant, wet-dry cycle, and wetting); the abundance and community structure of nitrifiers and denitrifiers were quantified, while the N2O emission, inorganic nitrogen, and gene abundance alterations were monitored, which shed light on the respective role of antecedent and immediate soil moisture, as well as ecological adaptation of related soil bacteria.

2. Materials and Methods

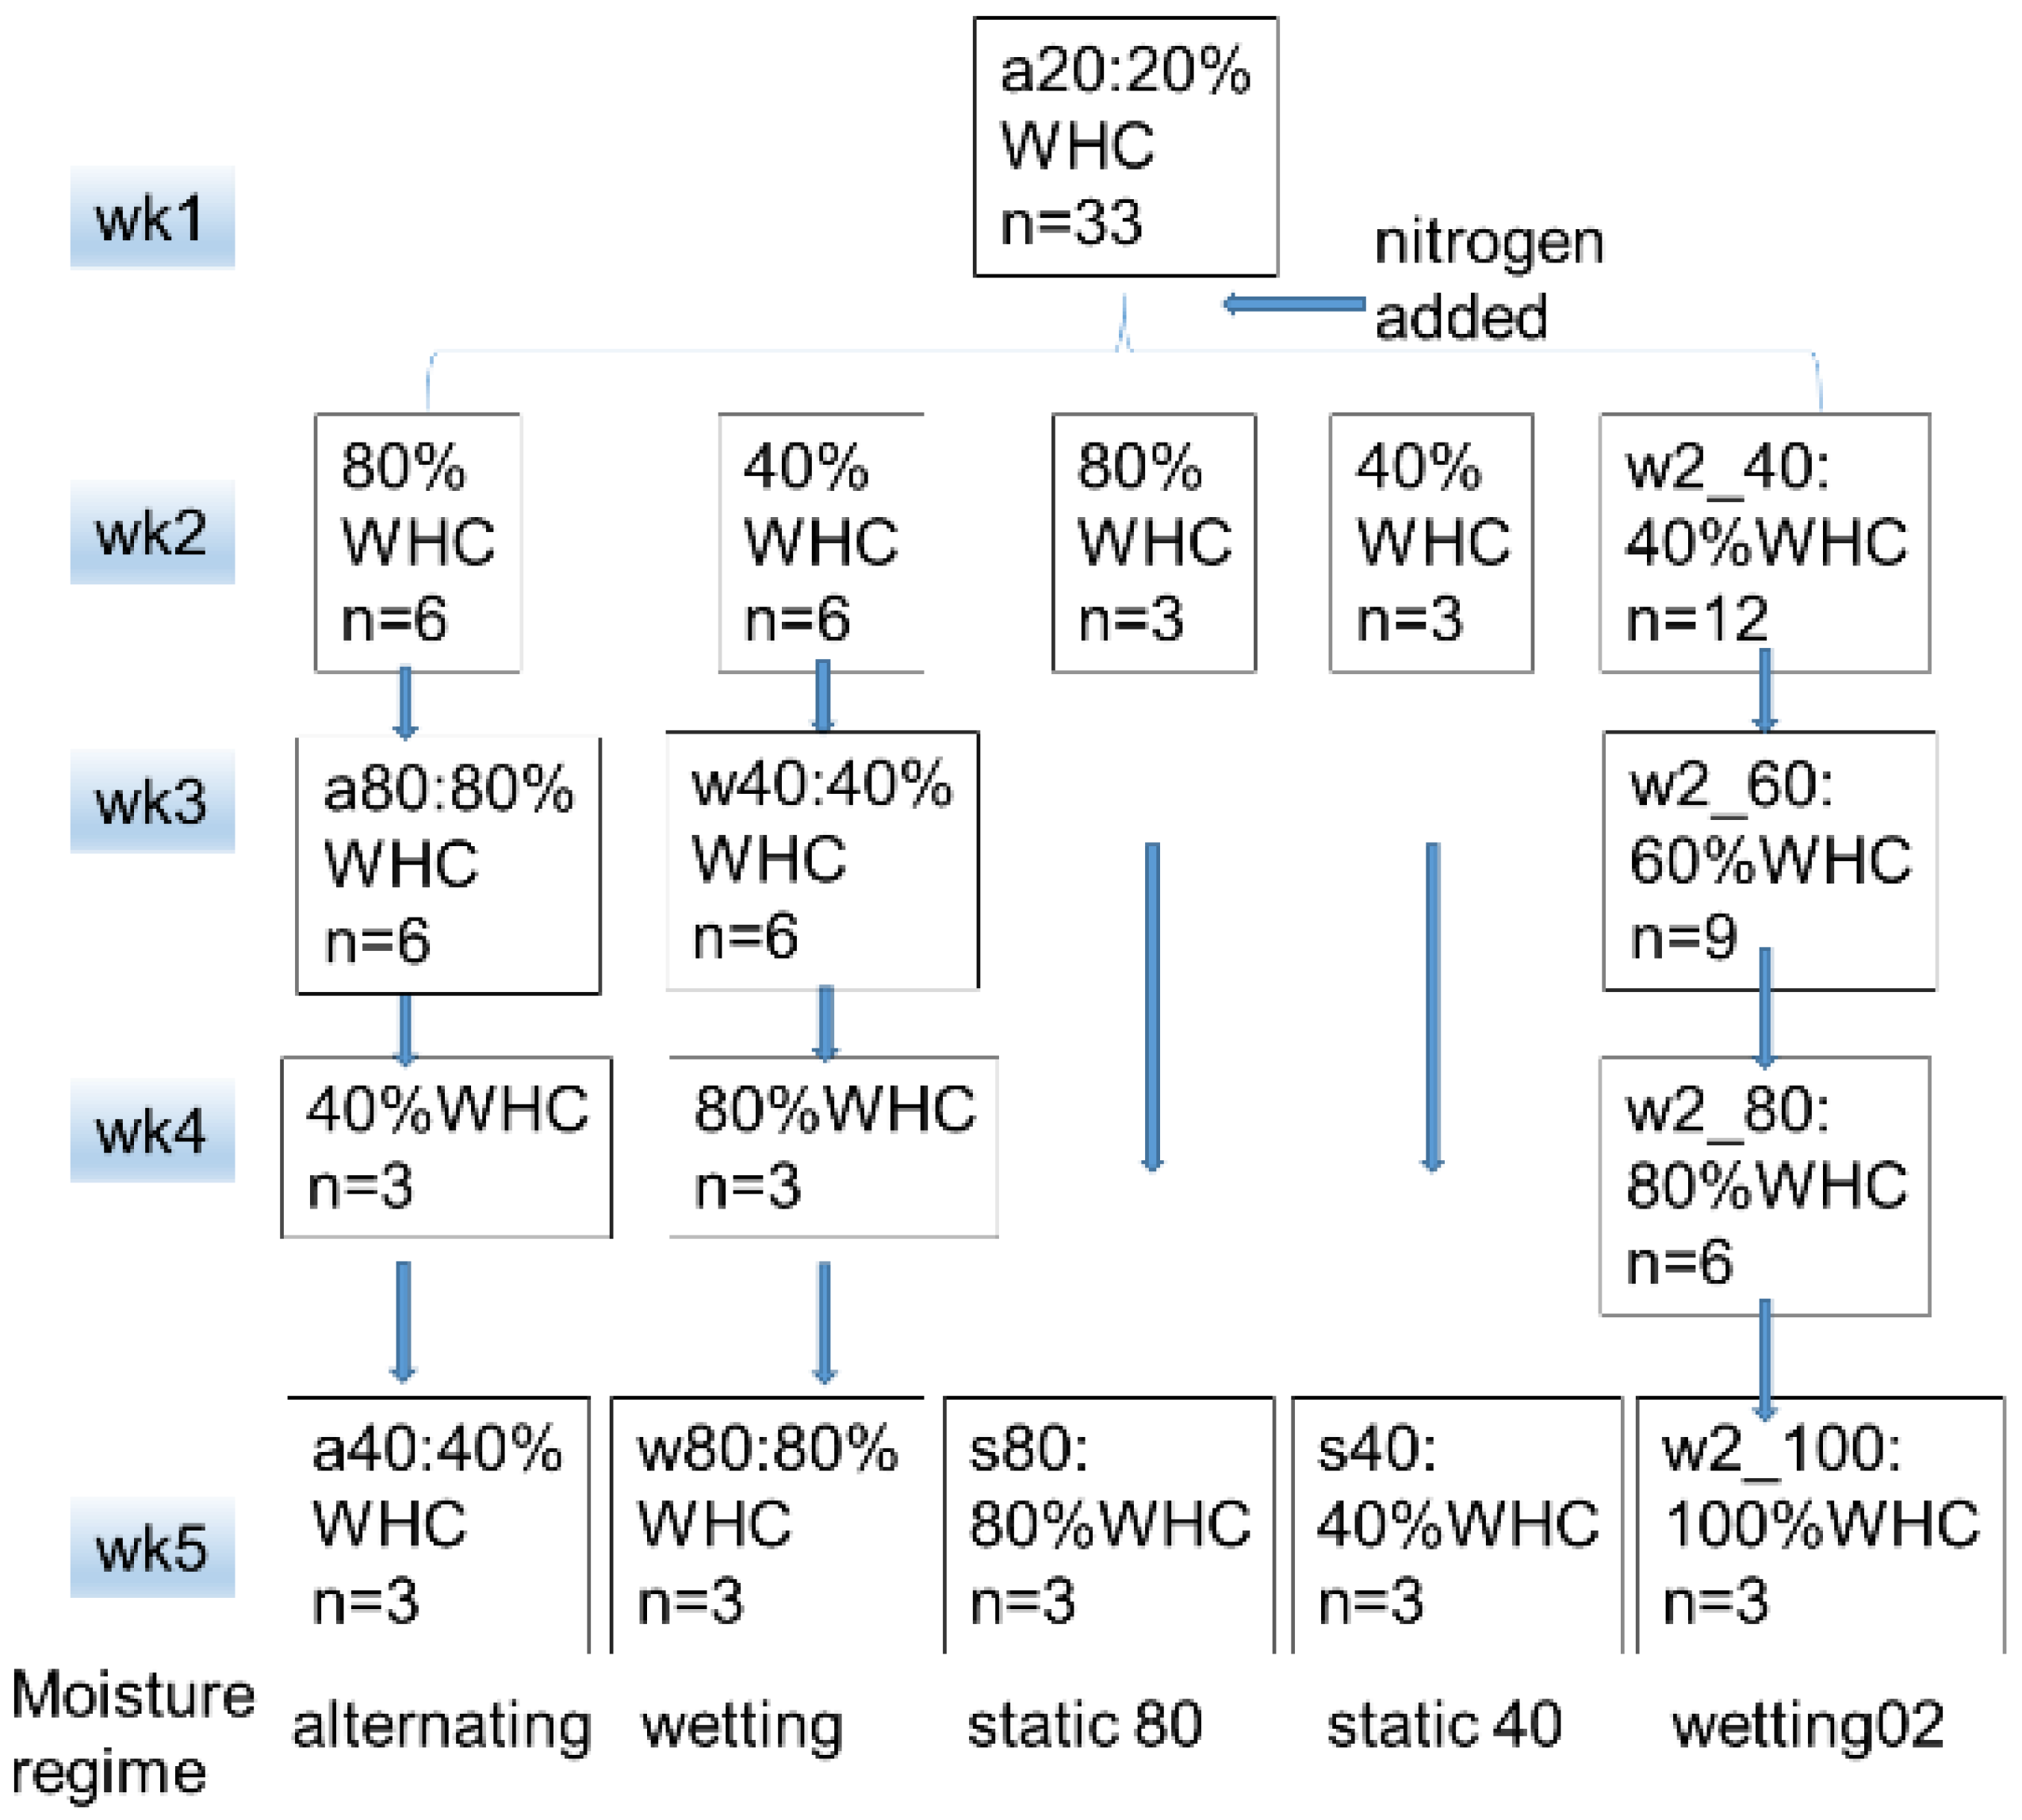
2.1. Soil Sampling and Treatment

The tested black soil samples were collected from the Modern Agricultural Science and Technology Demonstration Park of Heilongjiang Academy of Agricultural Sciences in Harbin city, Heilongjiang province, Northeast China (45°50′ N, 126°51′ E; elev. 130 m). The black soil is developed from Quaternary loess-like parent materials. The climate belongs to the continental monsoon climate in the middle temperate zone, and the average annual temperature is 3.6 °C. The average annual rainfall is 486 mm, and the frost-free period is 137 days. Due to the long cold and short warm seasons, the microbial activities in the soil are relatively weak, and a large amount of organic matter and humus accumulate in the black soil. The sampled plough layer soil with a depth of 0–20 cm was loose and brown, with small granular structures and some plant roots. WHC is the maximum amount of water that the soil can absorb in a fixed state, and WFPS (water-filled pore space) is the amount of water in a fixed state of the soil; WHC can be understood as the maximum saturated water content of the soil, so WHC was used instead of WFPS. Three aluminum boxes were dried in an oven at 105 ± 5 °C for three hours to constant weight, they were taken out to cool to room temperature and their weight was W1. Three soil samples of 30 g were weighed and put into the aluminum box, and the weight of soil plus box was W2; they were put into an oven at 105 ± 5 °C for drying for eight hours to constant weight, then were cooled to room temperature to weigh as W3. WHC = (W2 − W3)/(W3 − W1), and the average value of three groups was used in the subsequent analyses. The original moisture was around 20% WHC. The soil samples were transported back to the laboratory and air-dried at room temperature for preservation.
The ground soil was sieved with a 2 mm (10 mesh) sieve. The soils were divided into five groups and incubated in 20% WHC for one week (Figure 1), and the soil sample a20 was taken at the end of the week for physicochemical examination and 16S rRNA amplicon sequencing. In the first group (a20→a80→a40, alternating regime), the WHC of soil samples was adjusted to 80% for a two-week incubation, then the WHC was decreased to 40% for an additional two-week incubation. In the second group (a20→w40→w80, wetting regime), the WHC of soil samples was adjusted to 40% WHC for a two-week incubation, then 80% WHC was maintained for an additional two-week incubation. In the third group (a20→s80, static/constant 80% regime), the WHC of soil samples was adjusted to 80% for a four-week incubation. In the fourth group (a20→s40, static/constant 40% regime), the WHC of soil samples was adjusted to 40% for a four-week incubation. In the fifth group (a20→w2_40→w2_60→w2_80→w2_100, wetting02 regime), there was a gradient change in the soil moisture, i.e., 20%→40%→60%→80%→100% WHC; the soil was incubated at each WHC for one week. Triplicates were used in each group, and the incubation temperature was 25 °C (Figure 1). If the sample processing time is one week, the soil sample is taken on the last day of the week for physicochemical examination and 16S rRNA amplicon sequencing; if the processing time is two weeks, the sample is also taken on the last day, and so on, except stated otherwise in the figure legend.
The experiments are detailed as follows: 33 air-dried soil samples, 25 g each, were put into 120 mL glass serum bottles and numbered. The soil moisture was adjusted to 20% WHC by dripping the sterile water evenly into all soil samples, then samples were incubated at 25 °C for one week in order to restore the microbial activity in the air-dried soil, stabilize the microbial community, and prevent the start-up effect related to wetting conditions. After one week of pre-incubation, a 2 mL mixture of potassium nitrate and ammonium bicarbonate was added to each glass serum bottle with a pipette. The contents of ammonium nitrogen and nitrate nitrogen in 25 g of soil were 50 ppm each, and then in five groups of samples, the moisture was adjusted to the respective value. The soil moisture was monitored every day by accurate weighing and was maintained by making up sterile water to constant weight. According to the experimental design, 0.25g of soil was taken from each triplicate at planned time points stated above (Figure 1) and stored at −80 °C for genomic DNA extraction and amplicon sequencing. The remaining samples were adjusted to the corresponding moisture and incubated further. For physicochemical analyses, the soil was added with 50 mL 1 M KCl and shaken at room temperature for one hour. The extract was filtered with Whatman 42 qualitative filter paper, and the filtrate was stored at 4 °C for testing (detailed below).

2.2. Soil Physicochemical Analyses

Soil analyses were performed as previously described [7]. Briefly, the above filtrate was analyzed for NH4+-N and NO3-N using a Skalar’s San++ continuous flow analyzer (Skalar Analytical B.V., Breda, The Netherlands). The formulas are as follows:
Soil nitrogen mineralization = difference between mineral nitrogen (NH4+-N + NO3-N) after incubation and before incubation
Soil nitrogen mineralization rate (%) = soil nitrogen mineralization amount/total soil nitrogen × 100%
Nitrification rate of soil nitrogen (%) = (nitrate nitrogen content after incubation − nitrate nitrogen content before incubation)/mineral nitrogen content of soil × 100%
Denitrification rate of soil nitrogen (%) = (nitrate content before incubation − nitrate content after incubation)/nitrate content before incubation × 100%
By using the 5 mL disposable syringe, the air was sucked thrice before sampling, then the syringe was inserted into the bottle, sucking up and down thrice to get a uniformly mixed sample; the 5 mL gas sample was collected and injected slowly into the gas chromatography (GC) injection port with a screw cap sealed with a rubber pad. After each sampling, the gas in the bottle was exhausted with a vacuum pump, and the bottle stopper was opened to make the gas in the bottle air. The concentration of N2O was determined by GC (Agilent 7890B) and 63Ni electron capture detector. When compared with single standards with curve ratio correction, single-point calibration with linear regression, and multi-point calibration with linear regression the relative errors of single standards with offset compensation (SA) were the smallest, with the average bias of 0.09 × 10⁻⁹ for the six testing standards. Emission flux of N2O (μg N2O-N/kg/h) = (N2O density in standard state (1.25 kg/m3) × N2O concentration difference (ppbv) × Effective space for gas in bottle (m3) × 273)/(Dry soil weight in bottle (kg) × Time interval between two adjacent measurements (h) × (T + 273)); the N2O flux results are expressed as the mean values ± standard deviations of three replicates. The N2O emissions in each measurement interval are calculated by the product of the average value of the gas flux at each measurement and the interval between the two adjacent measurements. The cumulative N2O emissions during the whole incubation period were calculated by adding the N2O emissions calculated from each stage.

2.3. Soil Microbial Community Analyses

2.3.1. Soil DNA Extraction and Quantitative PCR (qPCR)

The DNeasy® PowerSoil® Kit (Qiagen) was used to extract genomic DNA from soil samples. DNA was checked by agarose gel electrophoresis and its purity was examined by NanoDrop spectrophotometer (Thermo Fisher, Shanghai, China). SYBR Green method and SYBR Premix Ex TaqTM (Takara, Dalian, China) were used to quantify the copy numbers of genes AOB (ammonia-oxidizing bacteria) amoA, AOA (ammonia-oxidizing archaea) amoA, nirS and nosZ on the CFX Connect Real-time PCR Detection System (Bio-Rad, Shanghai, China). The target gene was transformed into the vector plasmid, and the positive clone containing the target gene was cultured overnight in the liquid media. The MiniBEST Plasmid Purification Kit (Takara, Dalian, China) was used to purify the plasmids. The original gene copy number was calculated from the plasmid DNA concentration and the molecular mass. The original plasmid solution was subject to the tenfold gradient dilution to obtain the standard curve for copy number quantification. The 20 μL qPCR mixture for quantifying nirS and nosZ genes contained 10 μL SYBR Premix Ex Taq, 0.25 μL (50 μmol/L) forward primer, 0.25 μL (50 μmol/L) reverse primer, 1 μL tenfold diluted DNA template, and 8.5 μL sterile water. The 20 μL qPCR mixture for quantifying amoA gene contained 10 μL SYBR Premix Ex Taq, 0.5 μL (50 μmol/L) forward primer, 0.5 μL (50 μmol/L) reverse primer, 1 μL tenfold diluted DNA template, and 8 μL sterile water. The PCR primer sequences and thermal cycling conditions are listed in Table S1.

2.3.2. 16S rRNA Amplicon Sequencing and Bioinformatics

The variable region V4–5 of the bacterial 16S rRNA gene was amplified for the construction of the sequencing library as described previously [19]. The sequencing of two samples, no. 175 of w2_80 and no. 191 of a80, failed and cannot be submitted to the public database. Sequencing reads of 31 samples can be retrieved from CNSA of China National GeneBank (https://db.cngb.org/cnsa/home, accessed on 9 January 2022) with accession numbers CNX0085253-CNX0085283.
The Qiime platform (http://qiime.org/scripts/assign_taxonomy.html, accessed on 9 January 2022) and RDP Classifier (version 2.11, http://sourceforge.net/projects/rdp-classifier/, accessed on 9 January 2022) were used to analyze the OTU (operational taxonomic unit); the default confidence threshold was 0.7. The software mothur (https://github.com/mothur/mothur.github.io, accessed on 9 January 2022) was used to calculate the alpha diversity index under different random sampling, and the R language tool was used to make the rarefaction curve, so as to compare the richness, evenness, or diversity of species in samples with a different amount of sequencing data, and to explain whether the amount of sequencing data is reasonable. The analyses of α- and β- diversity were performed on https://cloud.majorbio.com/ (accessed on 9 January 2022). All samples were rarefied at both OTU and genus levels to confirm the sequencing quantity. The commonly used metrics Chao, Ace, Shannon, Simpson, and Coverage were calculated. The one-way ANOVA was implemented in the software SPSS 23 to compare index values of samples. The homogeneity test of variances was firstly conducted; when the variance was homogeneous, LSD (least significant difference) was used in the post hoc test for the pairwise comparison, otherwise Dunnett’s T3 was adopted. The Bonferroni correction was used in multiple hypotheses testing. A venn diagram was used to quantify the number of common and unique OTUs. Bar plots and heat maps were generated to present the information of community composition. The vegan package in R [19] was used to draw the heat map. The software Circos-0.67–7 (http://circos.ca/, accessed on 9 January 2022) was used to draw the Circos plot, in order to reflect the composition proportion of dominant species in each sample group, as well as the distribution proportion of dominant species in different groups. For microbial β-diversity analyses, the vegan package of R language was used to draw the heat map based on the distance matrix. The principal component analysis (PCA) and principal coordinate analysis (PCoA) were performed using Bray-Curtis, Jaccard, and UniFrac distances with princomp and pcoa functions in R, respectively. The vegan package and Qiime were used for nonparametric permutational MANOVA (PERMANOVA) analysis. The semi-metric (e.g., Bray-Curtis) or metric distance matrix (e.g., Euclidean) was utilized to decompose the total variance, and the explanatory power of different physicochemical factors on sample differences was analyzed, then the permutation test was used to analyze the statistical significance of the division.
The Kruskal-Wallis H test and/or one-way ANOVA were used in the comparison of multiple soil samples with different moisture contents. The two-way ANOVA was implemented in SPSS 23 to explore the effects of dual factors and their potential interaction. Variance Inflation Factor (VIF) analysis was performed to select less interactive environmental factors. The environmental factors with VIF greater than 10 were filtered out. Redundancy analysis (RDA) was used in vegan to explore the relationship between sample distribution and influential factors. In the correlation heatmap analysis, the pheatmap package of R language was used to calculate the Spearman rank correlation coefficients between various factors and selected taxa, and the obtained numerical matrix was visually displayed via heatmap.
FAPROTAX, a database that maps prokaryote taxa (e.g., genera or species) to metabolism or other ecological related functions (such as nitrification and denitrification) based on the representative literature of laboratory culture [30], was used to characterize functional categories of microbiome in black soil. If all cultured species in a bacterial genus are identified as denitrifier, FAPROTAX assumes that all uncultured microorganisms in the genus are also denitrifier. The functions of FAPROTAX focus on the sulfur, nitrogen, hydrogen and carbon cycle. Presently, more than 7600 functional annotation information of more than 80 functional groups collected from more than 4600 prokaryotes are still being updated. Through the python script, the OTU table of the sample was converted into six tables.

3. Results

3.1. Impact of Soil Moisture on N2O Emission and Soil Properties

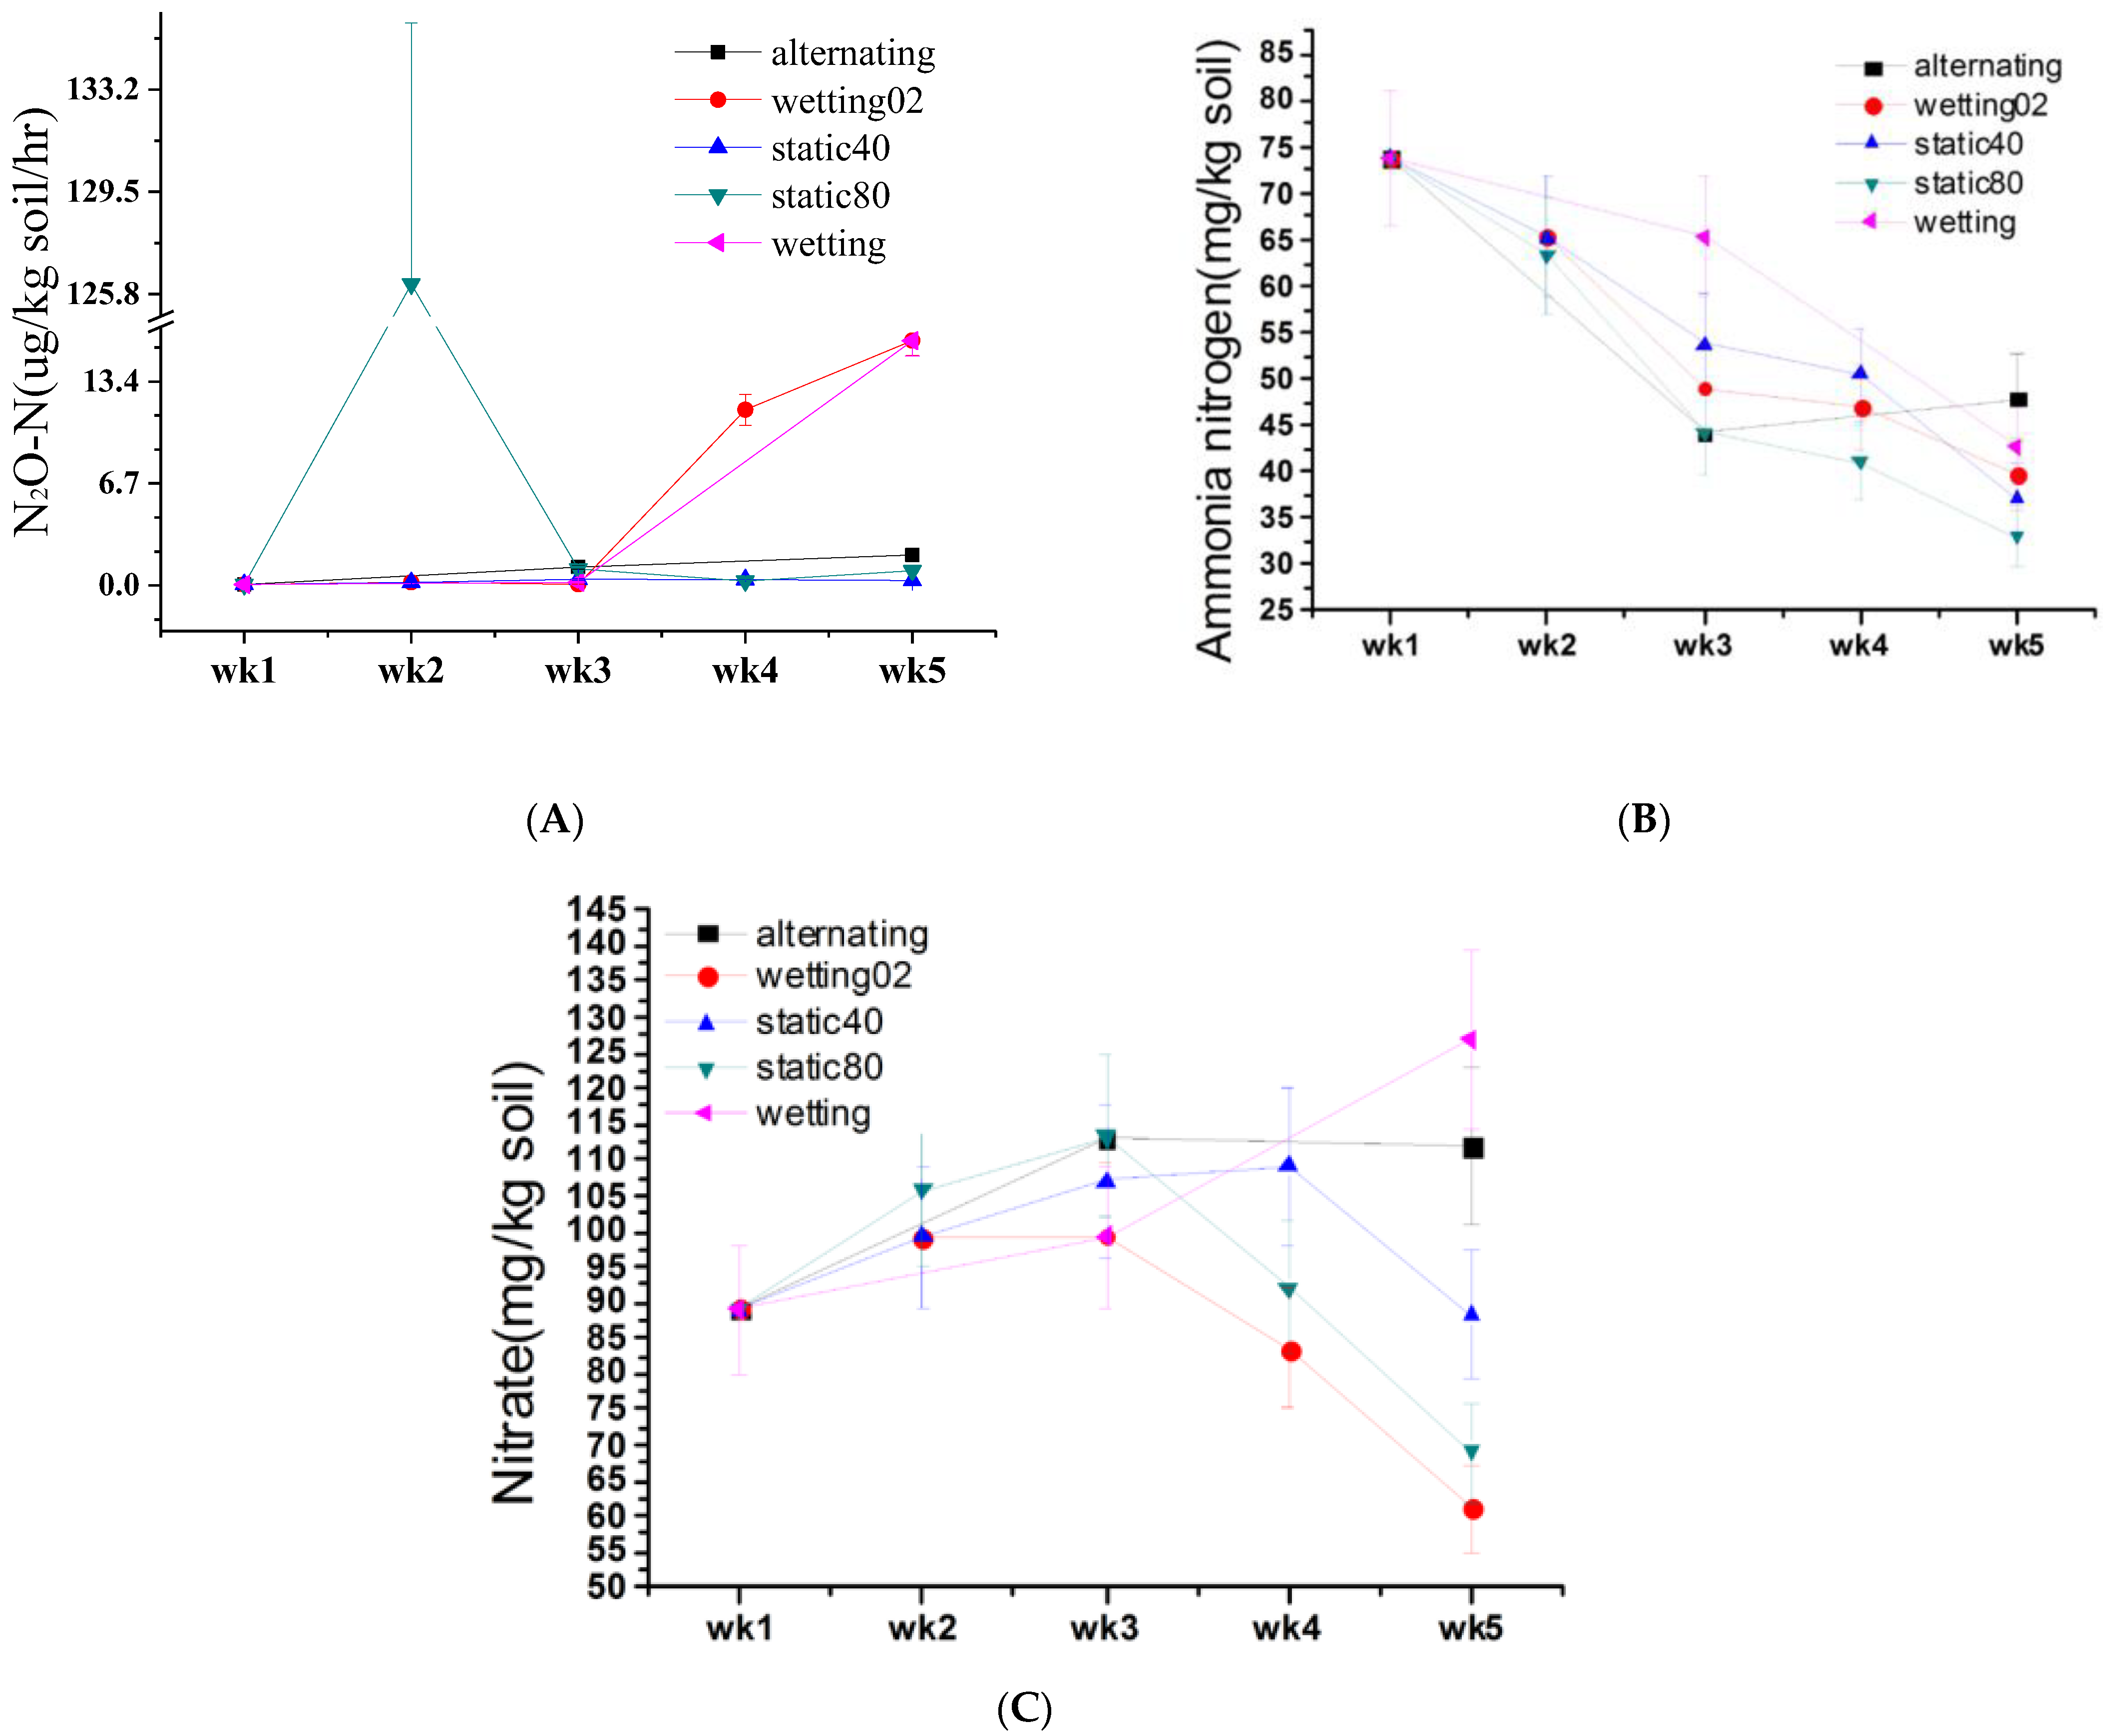
3.1.1. Impact of Soil Moisture on N2O Emission

In Figure 2A, taking incubation time (wk) as the abscissa and N2O emission flux (μg N2O-N kg−1 soil h−1) as the ordinate, the dynamic changes of N2O emission in three soil moisture regimes were quantified and proved to be distinct (two-way ANOVA: p < 0.001, Table S2), suggesting the significant effect of soil moisture regime on N2O emission. The incubation time also significantly affected the N2O emission (p < 0.001), and there was considerable interaction between water regime and incubation time (p < 0.001). Under the constant 40% WHC, the N2O emission was trivial; under the constant 80% WHC, the N2O emission in the early stage significantly increased, and the peak value of 126.16 μg N2O-N kg−1 soil h−1 was found at the end of the second week. At the first half of 80% WHC, the heterotrophic denitrification (HD) and NiD could be very active, but the later discharge of N2O was negligible, possibly due to the decrease of NO2/NO3-N and nosZ increase (see below qPCR results). Under the gradually increasing soil moisture, the N2O emission was trivial during the first three weeks but gradually increased in the following weeks. These suggest the weak denitrification under 40–60% WHC. With the increase of WHC, the N2O emission was enhanced, with a peak value of 16.1 μg N2O-N kg−1 h−1. The denitrification was the strongest at the WHC of above 60%, and the cumulative emission of N2O increased with the increase of soil moisture. Under the constant 80% WHC, the cumulative emission of N2O significantly surged, reaching 1911 μg N2O-N kg−1. The cumulative emission of 448 μg N2O-N kg−1 under wetting02 might be mainly attributed to the increase of water content to 60% and higher.

3.1.2. Impact of Soil Moisture on Soil Properties

The basic physicochemical properties of the black soil sample are shown in Table S3. At the beginning of incubation, the soil is rich in nutrients, which is helpful for the transformation of organic nitrogen to NH4+-N. In addition, 50 ppm exogenous ammonium nitrogen was added in the early stage, rendering the higher content of ammonium nitrogen in the soil. In the second week, with the increase of water content, the soil nitrification was enhanced, and the ammonium nitrogen was consumed and significantly decreased in the second week (Figure 2B). In the third and fourth weeks, the NH4+-N content of constant 40% WHC was always higher than that of the s80, suggesting the differential nitrification/NiD intensity of different moisture. The content of ammonium nitrogen further decreased in the fifth week under wetting and constant regimes, which was contrary to that of the alternating regime (Figure 2B). The two-way ANOVA shows that the exposure time, instead of the water regime and the interaction item regime × time, had a significant effect on NH4+-N level (p < 0.001, Table S2).
The nitrate nitrogen under the constant moisture had been increasing in the first three weeks (Figure 2C). The nitrate nitrogen under the wetting02 increased within the first two weeks and was relatively stable in the third week. In the later stages of constant and wetting02 regimes, the NO3-N content decreased sharply due to the reduced nutrients in the soil, the weakening of nitrification intensity, and the gradual enhancement of denitrification. However, under the alternating regime, the nitrate nitrogen of a40 (40% WHC for two weeks after 2-wk 80% WHC) did not decline significantly, while the nitrate nitrogen of w80 (80% WHC for two weeks after 2-wk 40% WHC) at the end of the fifth week dramatically increased, possibly illustrating the carry-over effect of preceding moisture. The two-way ANOVA shows that the water regime had a significant effect on NO3-N (p = 0.028, Table S2), while incubation time and regime×time had a marginally significant effect on NO3-N (p = 0.052 and 0.083 respectively).

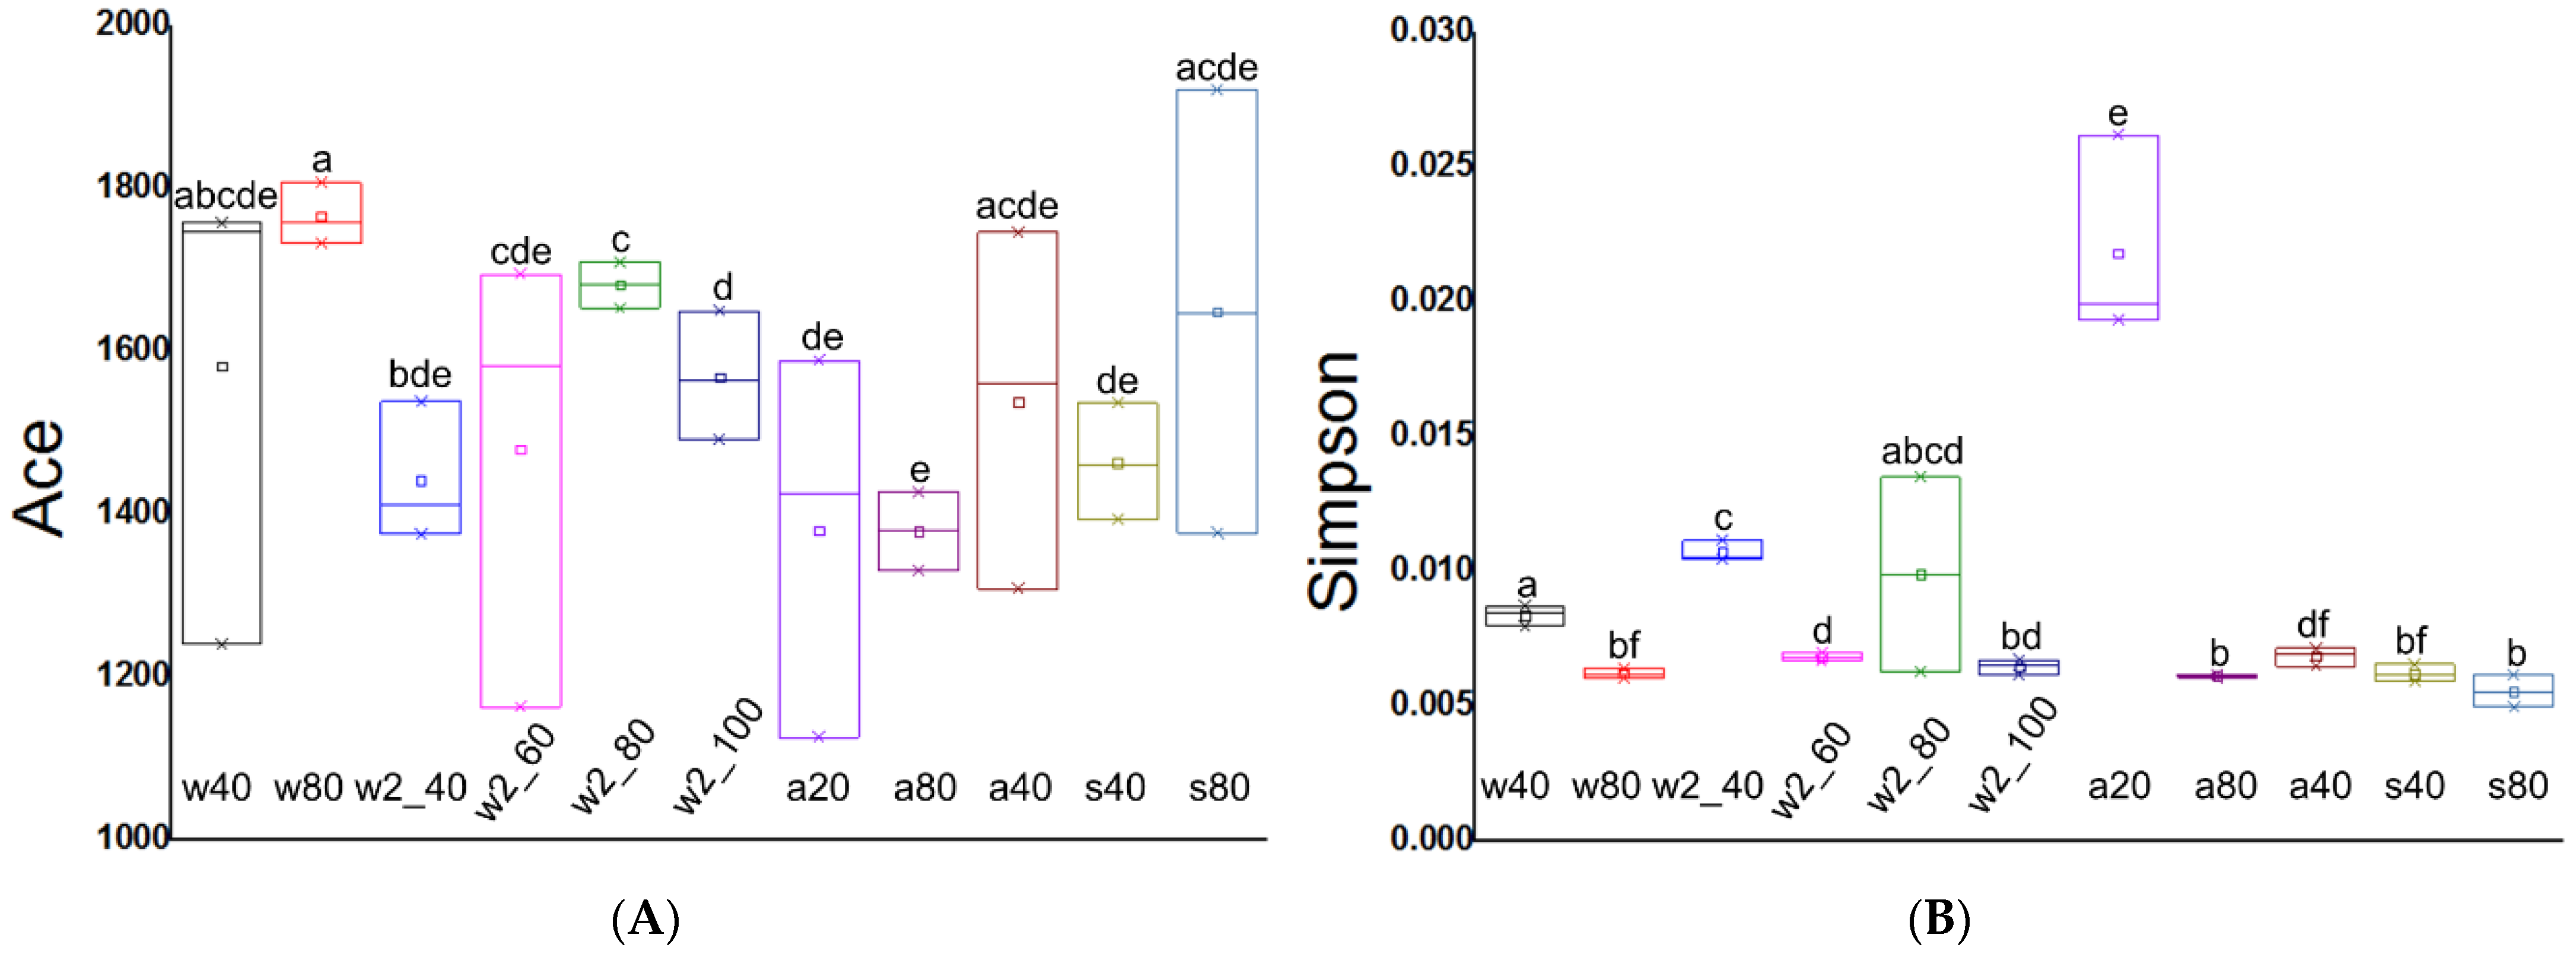
3.2. Alpha Diversity of Soil Microbial Community

In the present study, 31 valid samples were from wetting (a20→w40→w80, Figure 1), wetting02 (a20→w2_40→w2_60→w2_80→w2_100), alternating (a20→a80→a40), and constant (s40, s80) groups. The rarefaction curves show that the amount of sequencing data is reasonable (Figure S1). At the OTU level, the community richness of 11 sample groups was not significantly different (one-way ANOVA: p = 0.304 for Chao and 0.376 for Ace) (Figure 3A and Figure S2A); however, the community diversity of these groups was significantly different (one-way ANOVA: p < 0.001 for both Simpson and Shannon) (Figure 3B). In the Simpson index, the community diversity of dry communities (20% WHC) was significantly lower than that of higher moisture (Dunnett’s T3: p < 0.01), but the community diversity of w80 (80% WHC for two weeks after 2-wk 40% WHC) was meaningfully higher than that of w40 (40% WHC for two weeks after 1-wk 20% WHC) (p = 0.032). The community diversity of w2_40 (40% WHC for one week after 1-wk 20% WHC) was significantly lower than that of a40 (40% WHC for two weeks after 2-wk 80% WHC) (p = 0.004), and w40 was lower than a40. At the higher moisture, the community diversity of w2_80 (80% WHC for one week after 1-wk 60% WHC) and w80 was similar to that of a80 (80% WHC for two weeks after 1-wk 20% WHC) (p > 0.97). In the Shannon index, a similar trend was identified (Figure S2B).

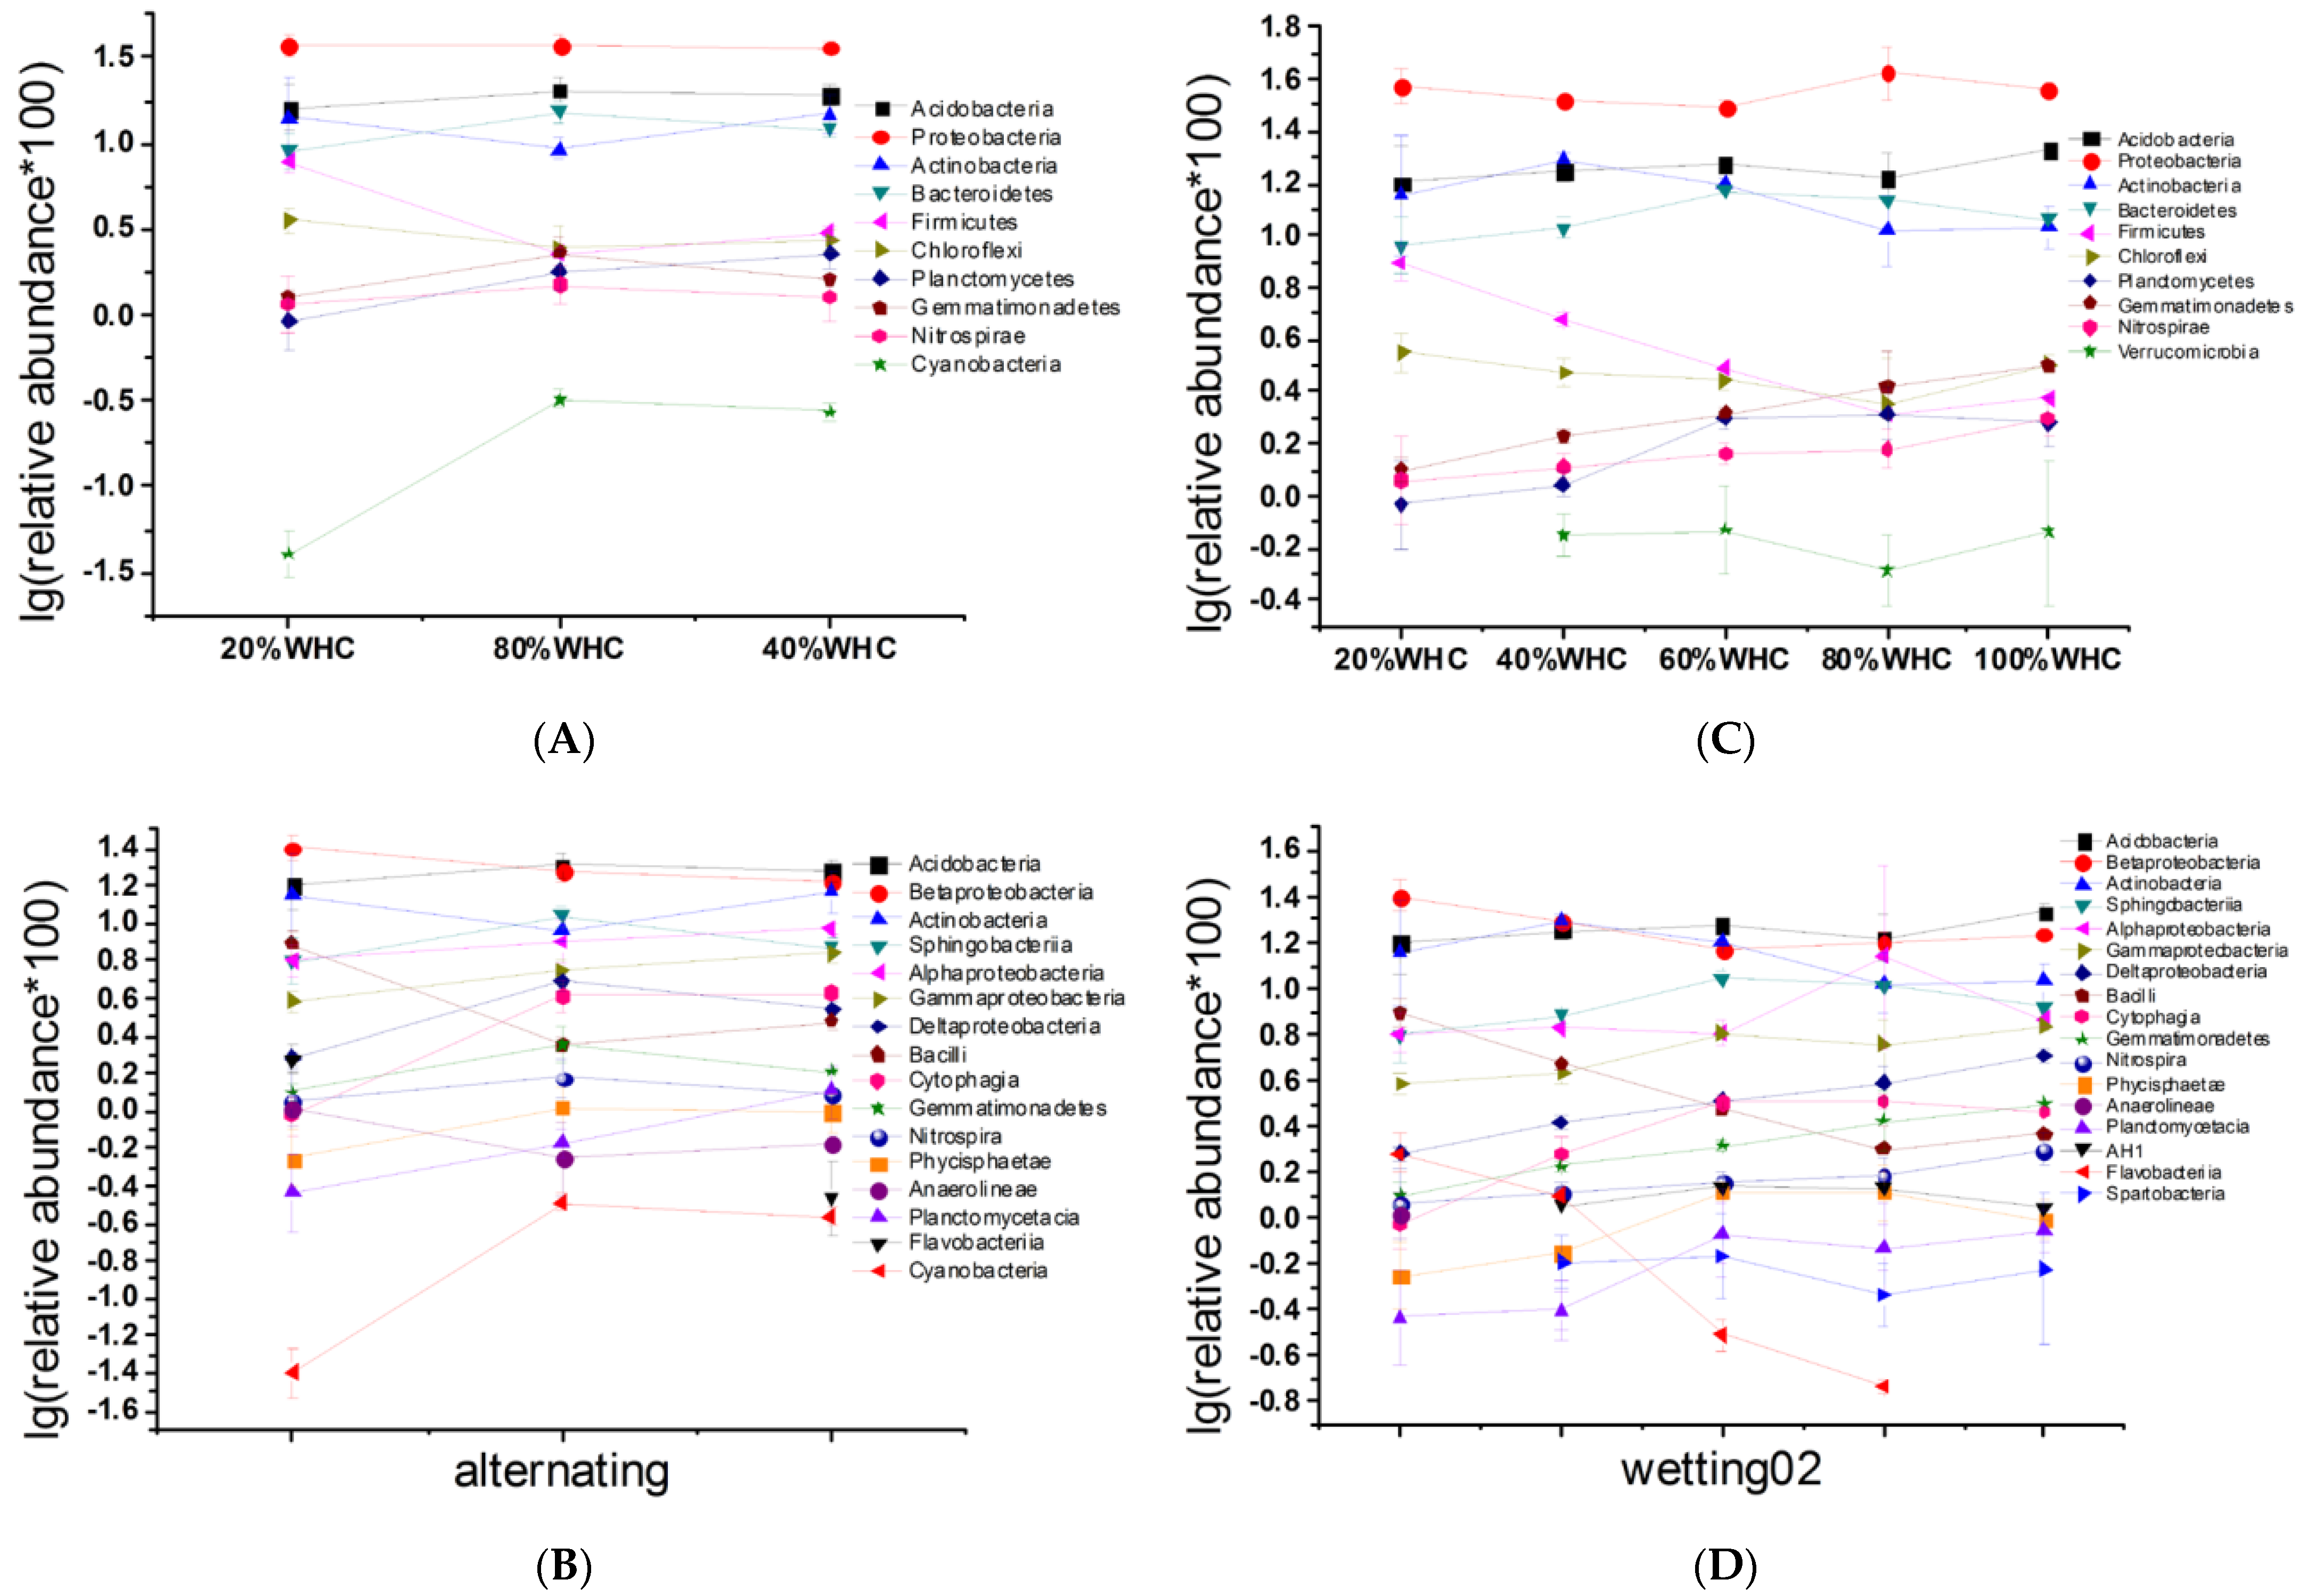
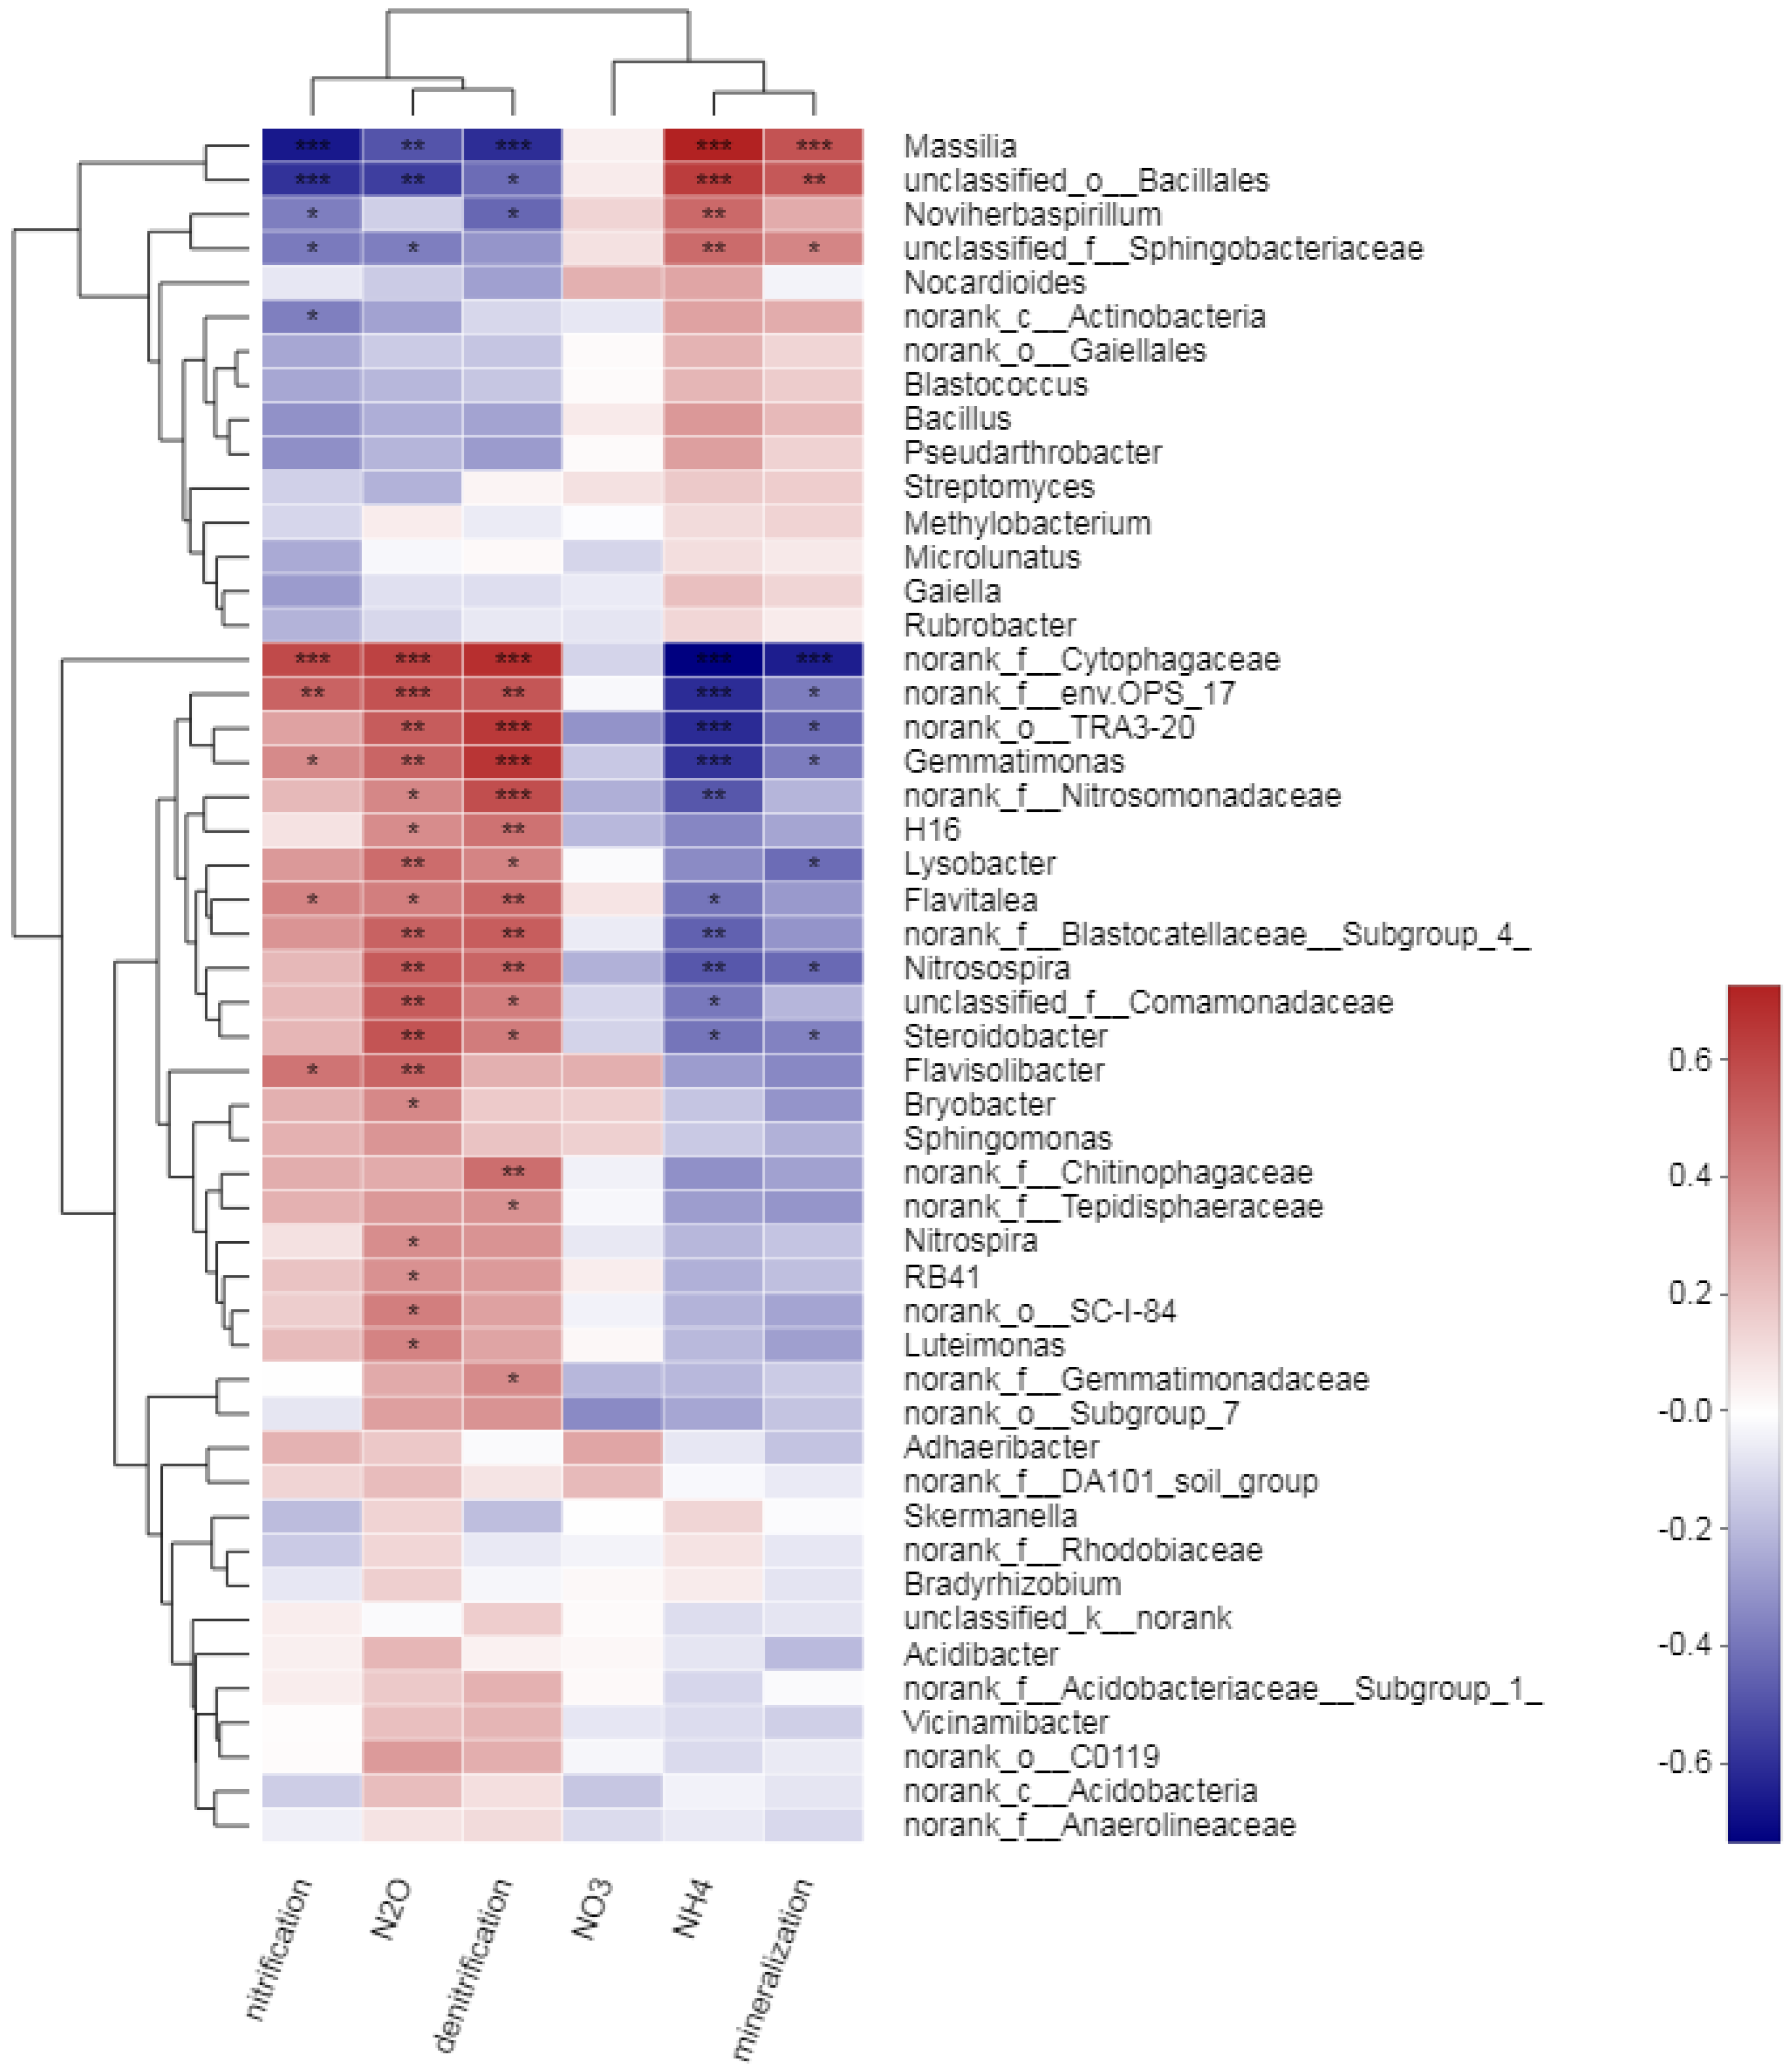
3.3. Microbial Community Composition and Key Responsive Taxonomic Groups

Totally 2060, 2133, 2172, and 2335 OTUs were identified in constant, alternating, wetting, and wetting02 communities respectively, among which 1508 were shared by four communities (Figure S3A), 425 and 519 were shared by three and two communities respectively, and 355 were unique to one community. At the class level, 18.58% of all species in the studied black soil were Acidobacteria (Figure S3B), followed by Betaproteobacteria (16.74%) and Actinobacteria (15.03%), etc. However, the microbial community composition differed substantially under different water regimes (Figure 4A–D and Figure S3C–F). In alternating regime, the relative abundance of phyla Firmicutes was significantly different among three moisture levels (ANOVA & Bonferroni correction, p = 0.0097; Figure 4A); at the class level, the relative abundance of Cytophagia (Bacteroidetes) was lowest at 20%WHC and highest at 40%WHC (p = 0.0078 respectively; Figure 4B), and Deltaproteobacteria and Cyanobacteria had the similar pattern. In the wetting02 regime, the relative abundance of phyla Bacteroidetes and Gemmatimonadetes significantly increased at high moisture contents (ANOVA, p = 0.0036 and 0.00041; Figure 4C). At the class level, Deltaproteobacteria was the most responsive, increasing strongly with wet-up from 1.897 to 5.108% relative abundance (p = 0.0018; Figure 4D); the relative abundance of Betaproteobacteria was higher at 20% WHC and lower at 60% and 80% WHC, while Cytophagia, Sphingobacteriia (Bacteroidetes), and Gemmatimonadetes increased dramatically at high moisture. The alterations of bacterial phyla and classes in the wetting regime (Figure S3C,D) validate the results of the wetting02 regime. In constant regime, the relative abundance of Betaproteobacteria at 80% WHC was much higher than that at 40% WHC (Figure S3E,F).
Acidobacteria and β-Proteobacteria were the most abundant classes across all samples, representing 31.3–39.22% of the total bacterial community and displaying differential responses to soil moisture (Figure 4 and Figure S3). Acidobacteria members were most abundant in w2_100 (100% WHC for one week), w80, and a80, and they were less at a20 (20% WHC for one week) and w40 (Figure S4).
The increase of black soil moisture was accompanied by the decrease of relative abundance of Actinobacteria (Figure 4C). Sphingobacteriia and Deltaproteobacteria were most prevalent in w80 and s80 (80% WHC for four weeks) respectively (p = 0.0056 and 0.0021 respectively). Gemmatimonas and Pseudarthrobacter (Actinobacteria) were solely increased to 1.21% and 1.58% respectively in s80. At the family level, the community mosaic of a40 (40% WHC for two weeks after 2-wk 80% WHC) on the heatmap was more like those of high moisture (Figure S5), while the a80 (80% WHC for two weeks after 1-wk 20% WHC) community was closer to those of low moisture. These results imply the influence of legacy moisture on the microbial community of black soil.

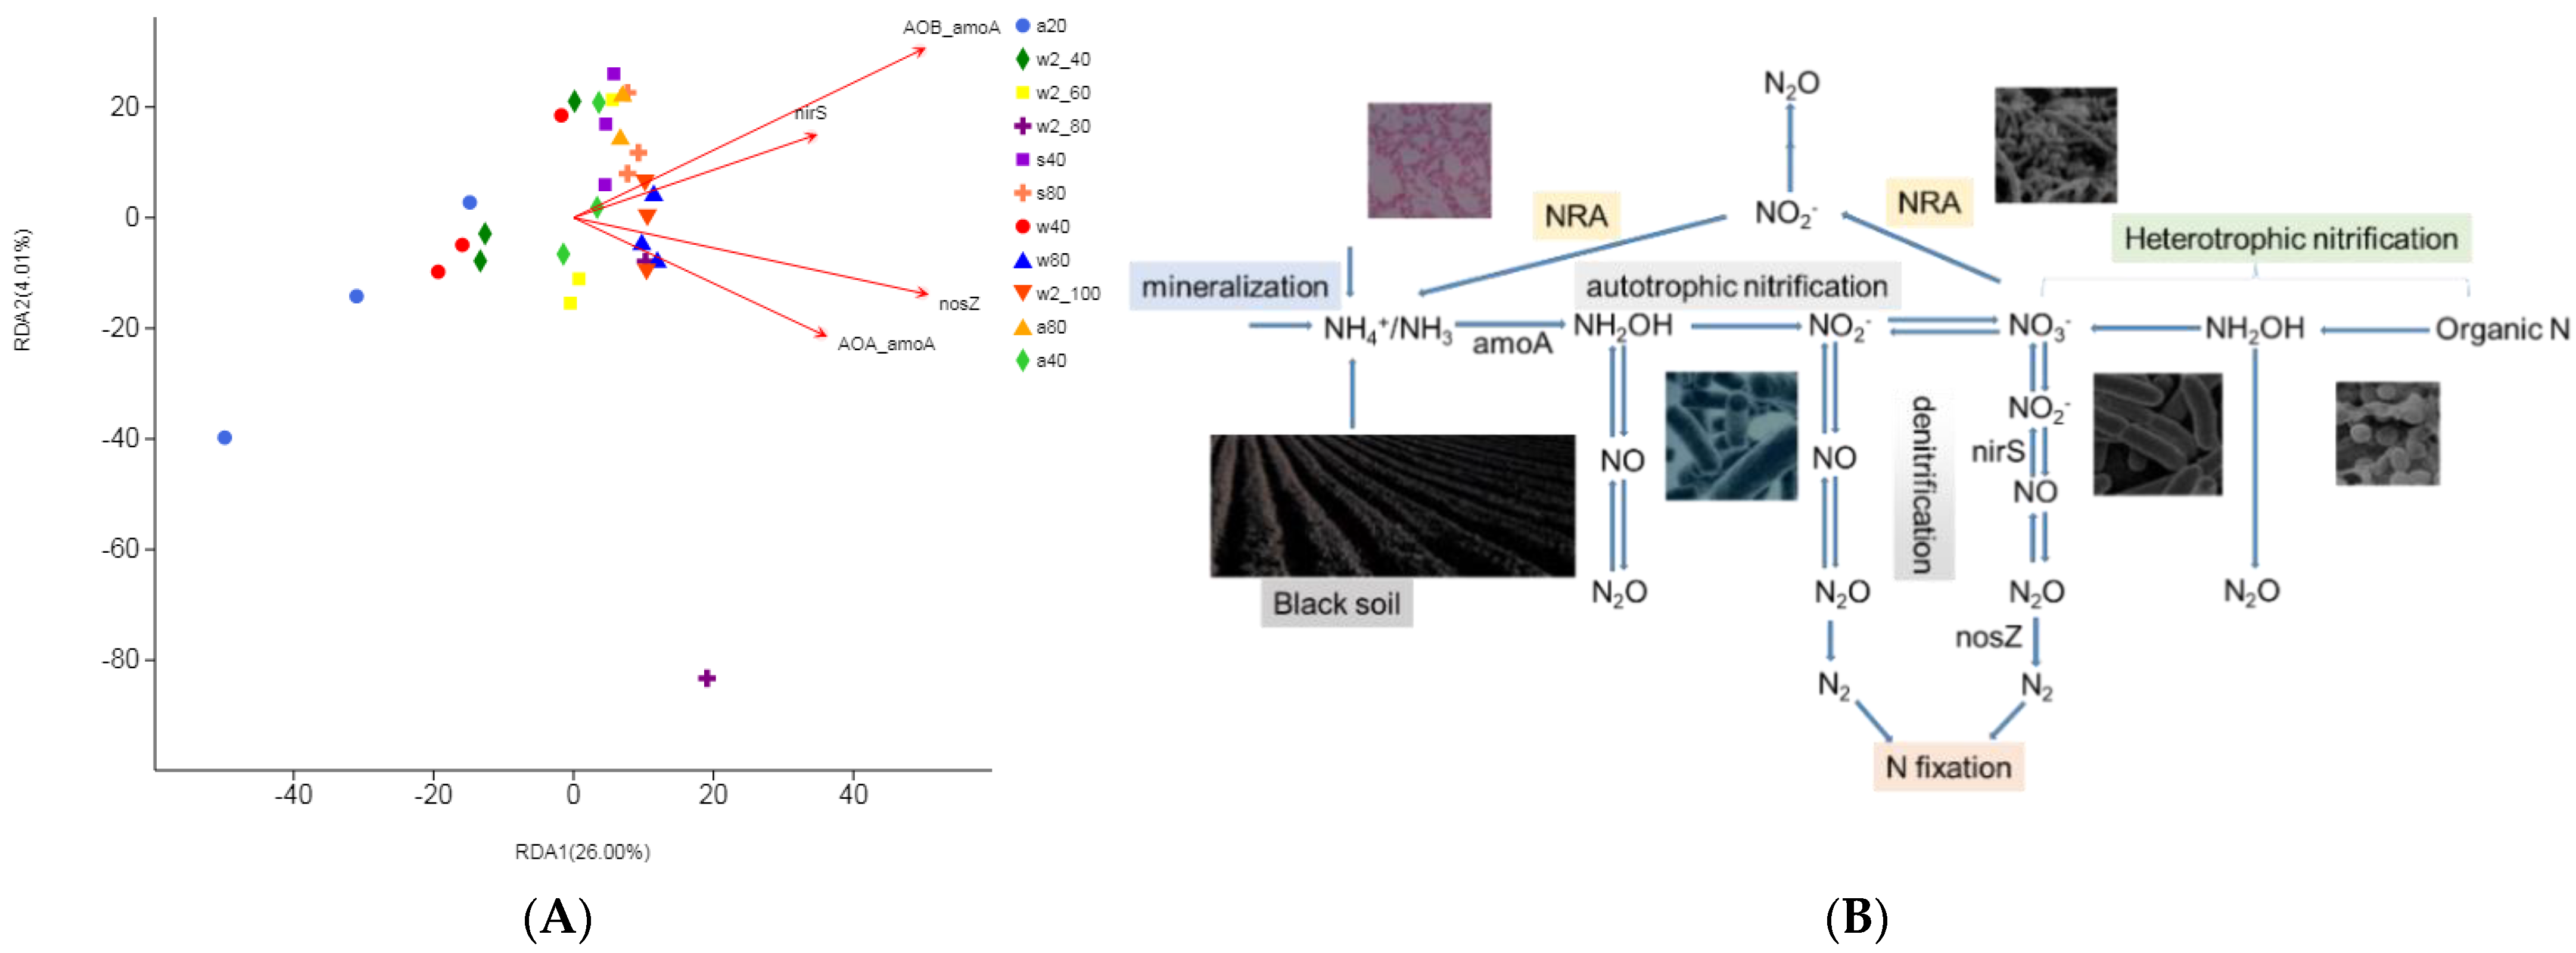
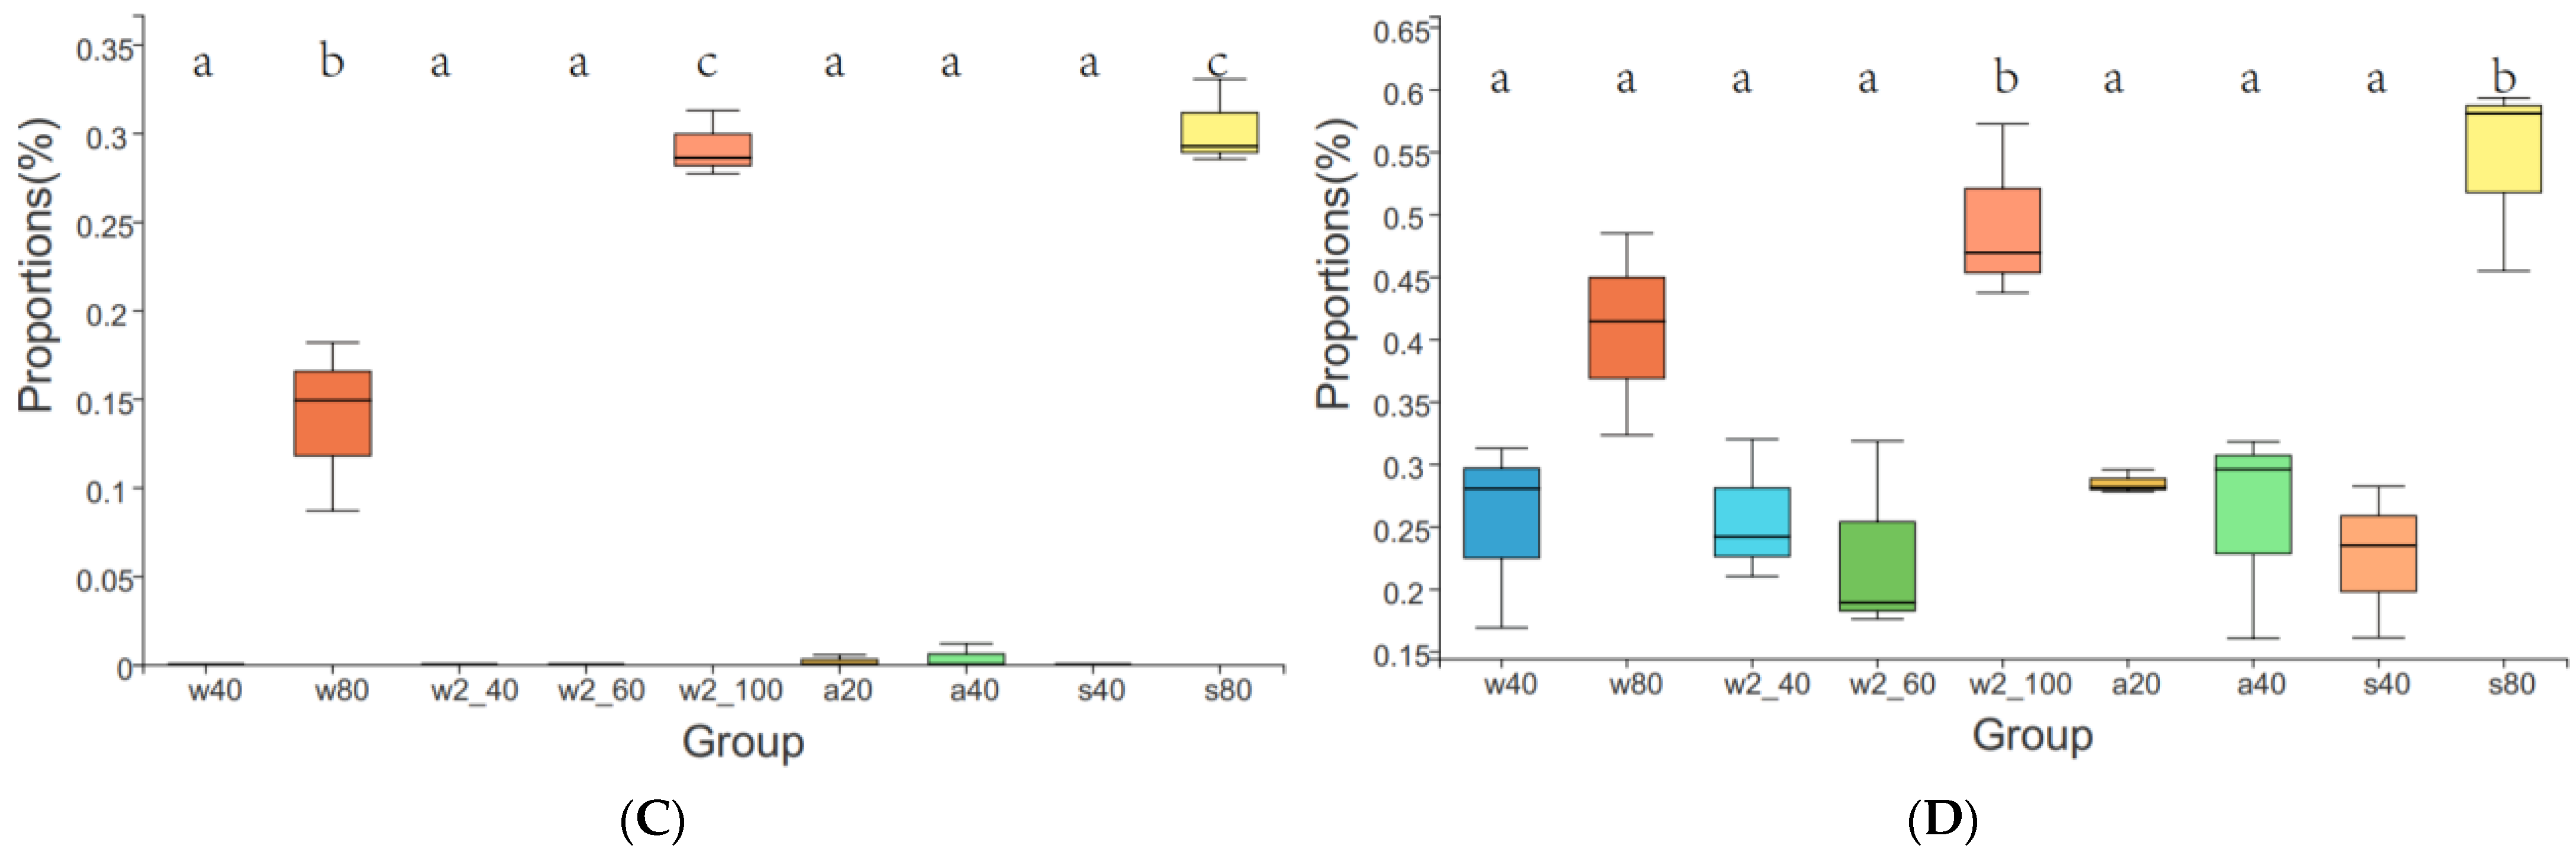
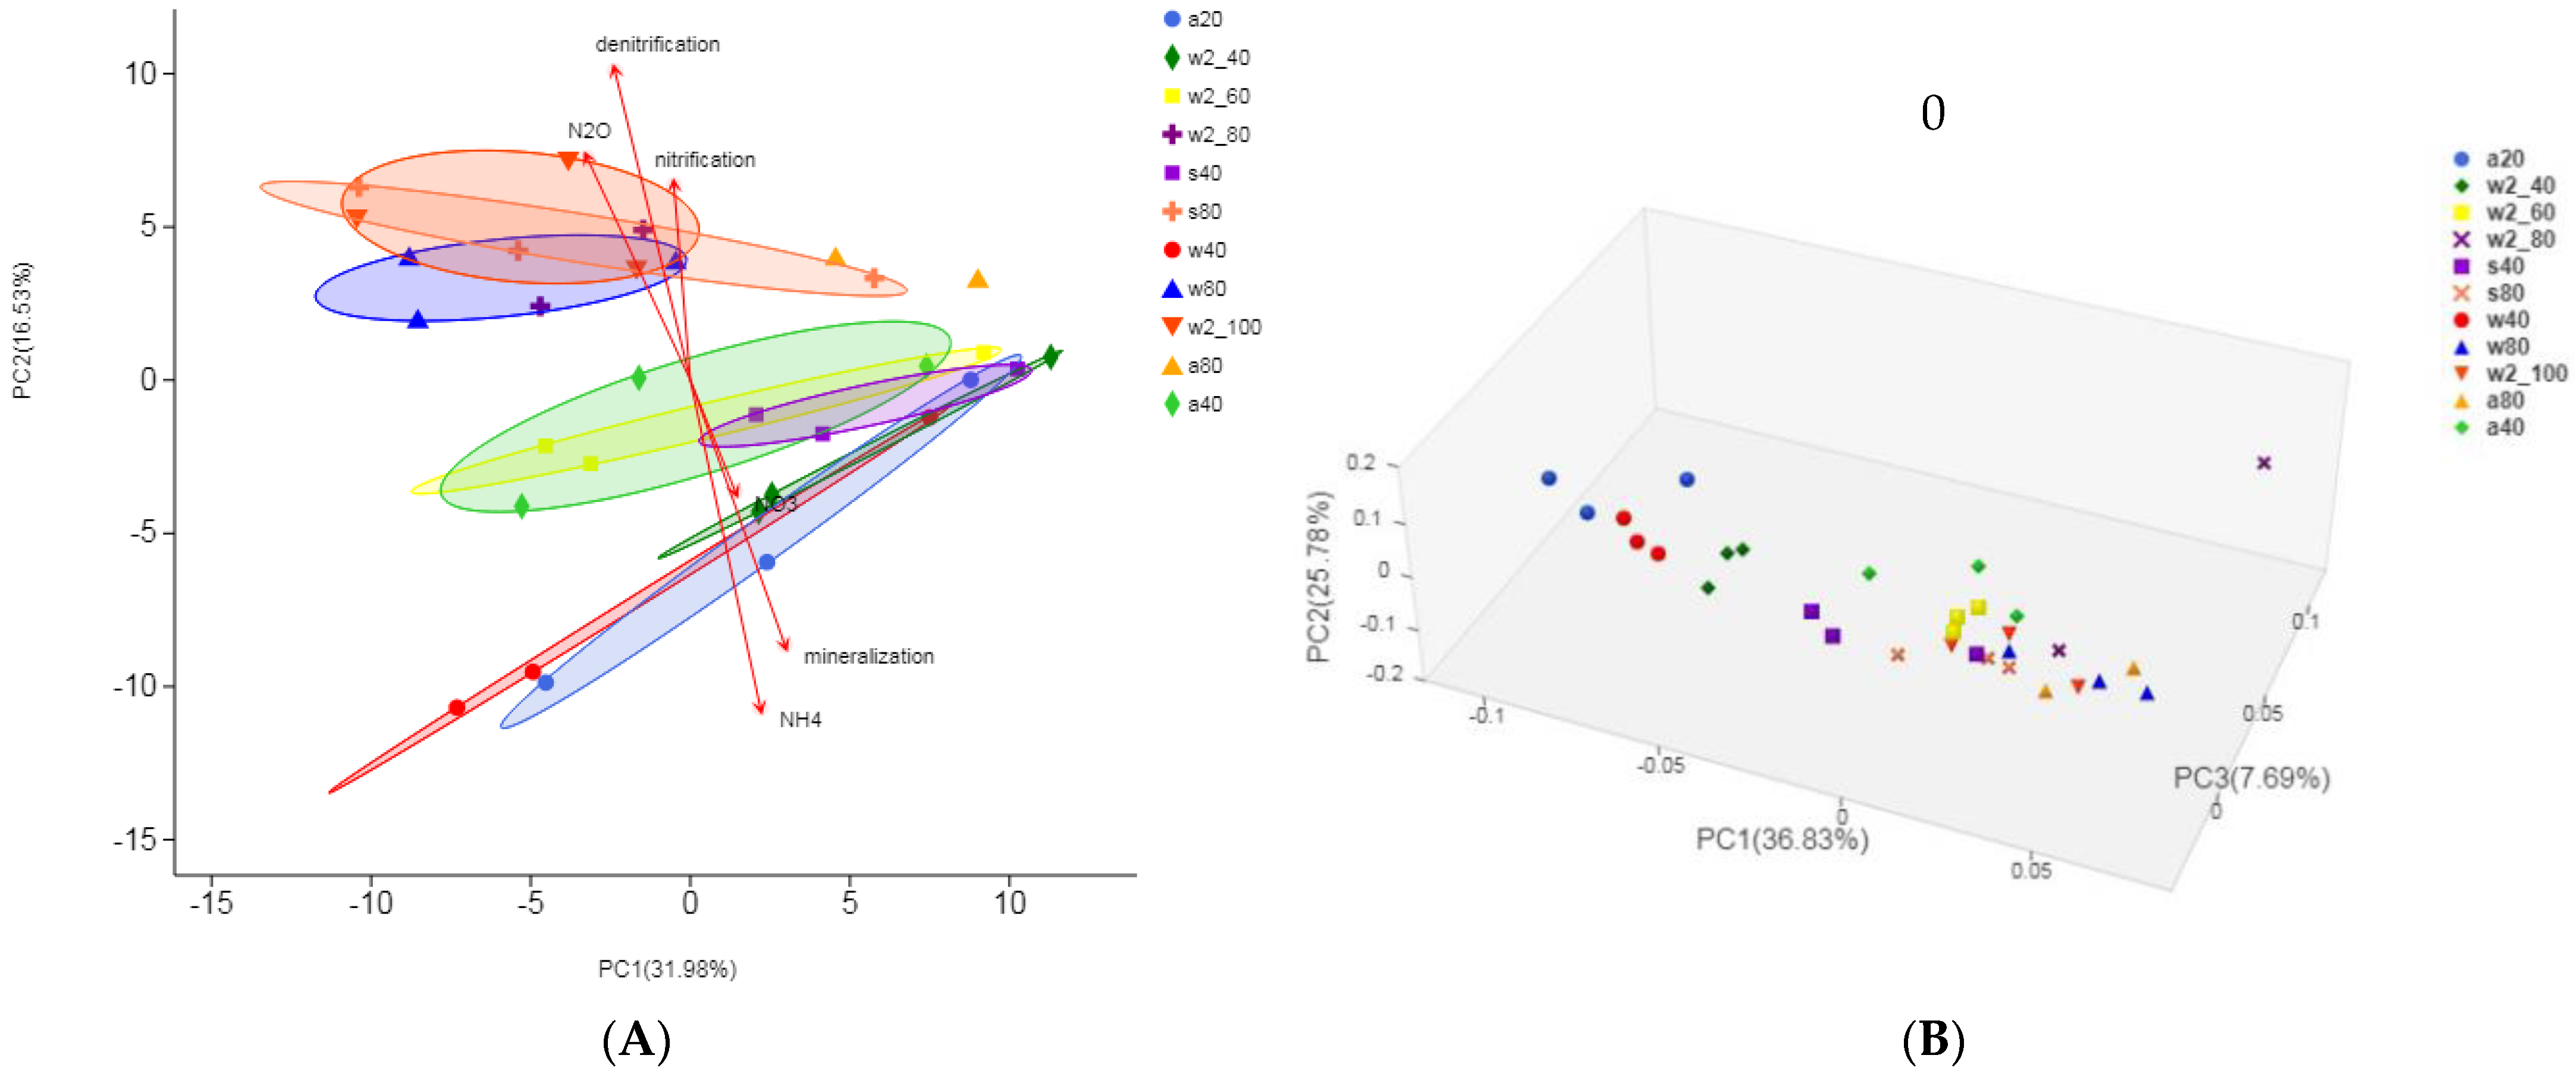
3.4. Beta Diversity of Soil Microbial Community and Taxonomic Difference Analysis

PCA demonstrated the differences in bacterial communities under wetting, alternating and constant moisture regimes (Figure 5A and Figure S6A). The communities under constant 40% WHC and constant 80% WHC were diverse and distinct, forming separate assemblages at each moisture. The alternating communities a20, a80, and a40 were also discrete, with a40 between the other two. The communities with high moisture (≥80% WHC) were mainly linked to denitrification rate (PERMANOVA, adjusted p = 0.025), N2O emission (p = 0.025) and nitrification rate (p = 0.025), while communities with low moisture (≤60% WHC) were associated with ammonium nitrogen (adjusted p = 0.014) and mineralization rate (p = 0.017). Intriguingly, a40 was between low and high moisture communities, which was also apparent in FAPROTAX analysis (Figure 5A–D, Table S4). The moisture increase was conducive to the nitrification and nitrite/nitrate reduction to ammonium (NRA, Dissimilatory NRA), instead of nitrogen mineralization (e.g., ureolysis).
The PCoA based on a weighted UniFrac distance matrix also revealed the separation of bacterial communities under different moisture regimes (Figure 6B). At the order level, PCo1, 2 and 3 explained 70.3% of the total variance; at the genus level, PCo1, 2 and 3 explained 70.51% of total variance (Figure S6B). Although there was a small overlap between s80 (80% WHC for four weeks after 1-wk 20% WHC) and w80 (80% WHC for two weeks after 2-wk 40% WHC), the community boundaries are clearly distinct under three treatments. The a40 community was closer to high moisture communities than to low moisture ones. The NMDS analyses based on Bray-Curtis similarity matrix largely agree with the above results. Overall, bacterial community characteristics varied with different moisture regimes, and differences in beta diversity between wetting, alternating and constant regimes were unambiguous, supporting that the direction of black soil moisture change is associated with bacterial community structure and composition.
In further probing which taxonomic groups are closely correlated with physicochemical properties of black soil, it was found that the nitrification of soil was positively correlated with an unclassified Cytophagaceae (Bacteroidetes) genus (p < 0.001, Figure 7), and the soil denitrification was also positively correlated with this genus, as well as Gemmatimonas (Gemmatimonadetes), a novel Nitrosomonadaceae (Betaproteobacteria) genus and an unknown genus norank_o_TRA3-20 (p < 0.001). The nitrogen mineralization was positively correlated with Massilia (Betaproteobacteria) and negatively correlated with norank_f_Cytophagaceae (p < 0.001). The soil ammonium nitrogen was significantly positively correlated with Massilia and unclassified_o_Bacillales (Firmicutes), while nitrate nitrogen was not significantly correlated with any genus (Figure 7). Compared to other physicochemical properties, more genera were significantly correlated with N2O emission of black soil. Intriguingly, in FAPROTAX analysis based on culturable bacteria, the relative abundance of denitrification functions such as N2O denitrification and nitrate denitrification was not significantly different between high moisture and low moisture groups (Table S4), implying the dominant roles of the not-yet-cultured bacterial community in denitrification and N2O emission of black soil.

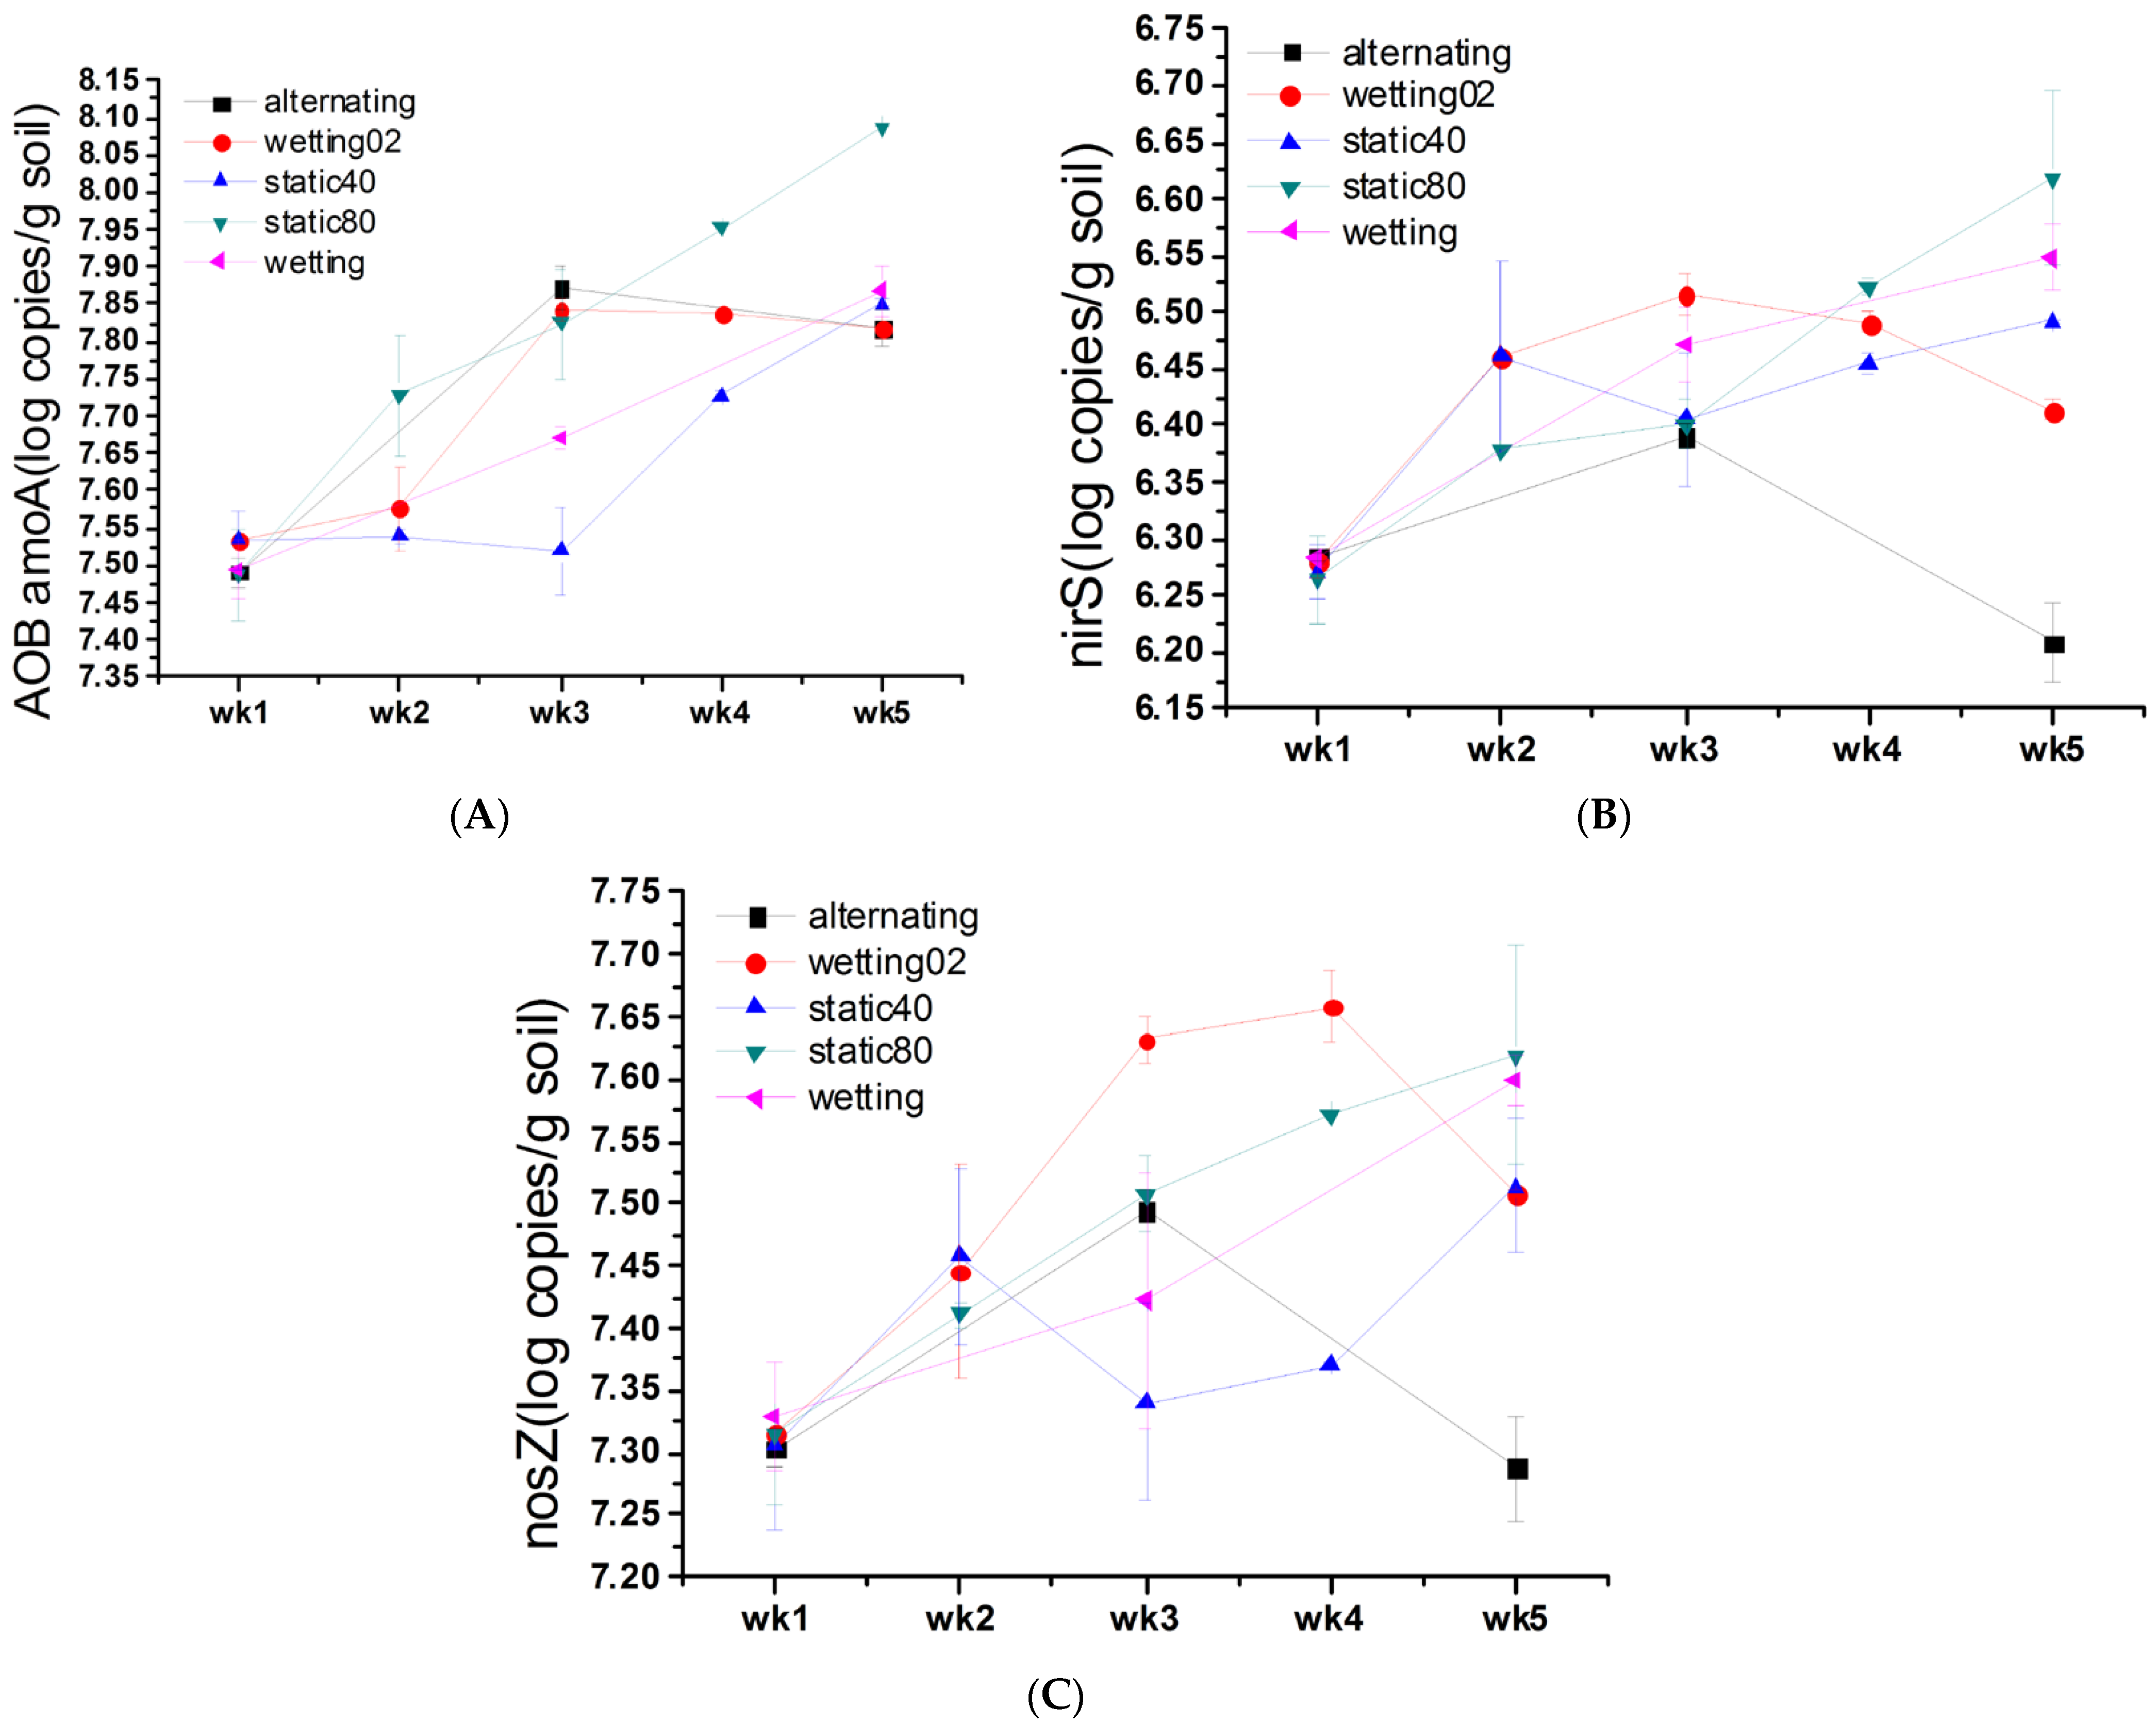
3.5. Impact of Soil Moisture on Gene Abundance

The gene abundance of AOA and AOB was significantly influenced by the water regime (Figure 8A and Figure S7). Under the wetting condition, the AOA amoA gene abundance of w2_80 (wk 4) was the highest, while the AOB amoA abundance was the highest at w80 (wk 5). Similar to N2O flux, the greatest intergroup differences in gene abundance were at 80% WHC (Figure 8A–C); the AOA amoA copies were less under s80 as compared to a80, w80 and w2_80, while during the last two weeks of experiments, AOB amoA copies were more under s80 as compared to a80, w80 and w2_80. The two-way ANOVA shows that both moisture regime and exposure time had significant effects on both AOA and AOB amoA (p < 0.001, Table S2), and there was noteworthy interaction between moisture regime and exposure time (p < 0.001).
In denitrification, the nirS gene abundance was significantly lower in a80 (6.39 log copies g−1 soil) than in s80 (6.62 log copies g−1 soil), w80 (6.55 log copies g−1 soil), and w2_80 (6.49 log copies g−1 soil), and the nosZ abundance was also significantly lower in a80 than in s80, w80, and w2_80, indicating the influence of previous moisture. Of note, both nirS and nosZ abundance was much lower in a40 than in s40. These results imply the interaction between the current and previous soil moisture. Compared to nirS and nosZ, the overall AOB amoA abundance was more responsive to the direction and magnitude of moisture alteration, varying 0.7 orders of magnitude, from 7.45 to 8.15 log copies g−1 soil. It was more abundant than nirS and nosZ and less abundant than AOA amoA (10.1–11.0 log copies g−1 soil). The two-way ANOVA shows that both moisture regime and exposure time had momentous effects on both nirS and nosZ (p ≤ 0.001, Table S2), and there was noteworthy interaction between moisture regime and exposure time (p < 0.001 and 0.013 respectively).
RDA is a method to extract and summarize the variation in a set of response variables that can be explained by a set of explanatory variables. It was used here to explore the association between the black soil bacterial community of different moisture regimes and nitrification/denitrification gene abundance. The AOB amoA abundance was the key determinant of s80 and s40 clustering alongside the AOB amoA vector (Figure 9A), and the nirS abundance was the second important determinant. Samples of w2_80 were alongside the nosZ and AOA amoA vectors; their gene abundance was positively correlated with that of AOB amoA and nirS. The w2_100 and w80 were close to these four vectors. In the Spearman correlation heatmap (Figure S8), the AOB amoA abundance was significantly positively correlated with norank_f_Cytophagaceae and norank_f_env.OPS_17 (p < 0.001), and negatively correlated with Massilia and unclassified_o_Bacillales. The nosZ abundance was significantly positively correlated with seven genera (p < 0.001), while the nirS abundance was positively correlated with norank_f_Cytophagaceae and Gemmatimonas (p < 0.01).

4. Discussion

Is there a legacy effect of soil moisture on bacterial community structure and N2O emission in upland black soil?
In each moisture regime, the antecedent moisture is relative to the subsequent moisture, thus the time duration of early moisture varied in different regimes. Therefore, this study can provide a lot of relevant information about the legacy effect of early moisture. In the present study, we try to answer: Is there a legacy effect of soil moisture on bacterial community structure and N2O emission in the upland black soil of northeast China? How do the structure and quantitative activity of nitrification and denitrification microbe communities change in black soil with regard to the antecedent moisture? What is the water threshold of the maximal N2O emission? These questions are related but different. In accordance with our hypothesis, for the first time, we found that the N2O production and nitrifying-denitrifying microbial properties were influenced by the preceding moisture and the pattern of the dry-wet cycle. The legacy effects of early moisture can be perceived by comparing the N2O flux of wetting and alternating regimes (Figure 2A), as well as that of wetting and constant regimes, which are also obvious in one-way ANOVA of community diversity indices (Figure 3B) and when comparing dynamic alterations of 16S rDNA based relative abundance of the preponderant bacterial phyla/classes in different water regimes (Figure 4A–D and Figure S3C–F). The effect difference of various regimes can also be understood in the order level PCA, PCoA (Figure 6) and NMDS analyses, which is further illustrated in the Circos chart at the class and genus levels (Figure S3B,G). These mutually verifiable findings could be useful in evaluating the effects of water mode on the greenhouse gas emission from black soil, as well as the associated impacts on both soil fertility and the global environment.
How do the structure and quantitative activity of nitrification and denitrification microbe communities change in black soil with regard to the modification of moisture?
Black soil is widely distributed, and the amount of precipitation accepted by black soil in different areas varies, leading to the moisture difference in black soil [31]. Even if the amount of precipitation in the same area is the same, there are moisture differences in black soil due to topography and terrain, etc. The soil water stress histories (e.g., irrigated and non-irrigated) affected the microbial abundance [32], and the bacterial abundance was more sensitive to altered soil water content than fungal abundance [33,34]. The processes affecting the assemblage of microbial communities are mostly deterministic in terrestrial ecosystems [35]. Correspondingly, when the soil is rich in organic matter, autotrophic nitrification rates generally increase with the soil moisture increase from 30–60% WFPS [36]. Analogously, our results suggest that the moisture difference will affect the N2O emission by microbes and microbial nitrification/denitrification in black soil (Figure 9B). With the year as the time scale, the water content of black soil sways between dry and wet, and the monthly precipitation distribution is uneven. In northeast China, June-August is both hot and rainy, and the intensity of rainfall differs each time. The high intensity and frequency of the wetting/drying cycle of black soil could affect the N2O emission and the characteristics of nitrification/denitrification microbes in this year. When we monitor N2O emission and nitrification/denitrification microbes of black soil in a growing period or a certain period of time, it is just in the process of the soil changing from dry to wet or from wet to dry, which will affect our monitoring accuracy. The nitrifying-denitrifying microbial communities, especially some members of Betaproteobacteria, Bacteroidetes and Gemmatimonadetes, could be important factors explaining the variation of N2O production. The key groups at various taxonomic levels are responsive to different water regimes and directly/indirectly associated with the N2O production, e.g., Acidobacteria, Sphingobacteriia, Deltaproteobacteria, Methylobacterium, Gemmatimonas and Pseudarthrobacter, etc., were also highlighted by both chemical and biological analyses. These bacterial groups, except Proteobacteria [37,38], have not been reported to alter dramatically with soil moisture or be involved in N2O emission. As compared with soil nitrate, the soil ammonia, N2O emission, nitrification/denitrification and mineralization were profoundly impacted by the water regime and showed meaningful correlations with respective taxonomic groups.
In s40 and wetting regimes, the contribution rate of nitrification to N2O production was lower under low water content (Figure 2A), while the contribution of denitrification to N2O production could be higher under 80–100% WHC. Particularly, ND [17,39] cannot be excluded. First, the copy number of AOB amoA generally increased to a higher level under high moisture (Figure 8A and Figure S7), suggesting that at the later stage of the experiment, nitrifiers were still active, which is supported by RDA, as the AOB amoA abundance was one of the most important determinants of w2_100, w80, and s80 clustering (Figure 9A), and is also supported by FAPROTAX (Figure 5A, Table S4). Second, at low O2 concentration and high moisture, ND contributed slightly more than HD in N2O production [17]; HD was responsible for all N2O production at 0% O2 (100% WHC), and only in the absence of molecular oxygen, denitrifiers can use the oxygen in nitrate/nitrite to breathe and reduce nitrogen atoms. These are probably true in our case, although isotope and gas inhibition methods should be used in future studies to quantify the relative contribution of ND and HD. Last but not least, RDA shows that some samples of w80, w2_80 and w2_100 were alongside the nosZ vector, and its gene abundance was positively correlated with that of AOB amoA and nirS, implying that ND was at least as important as HD in the denitrification process and N2O emission. Given the comparable abundance of denitrification among different sample groups shown by FAPROTAX (Table S4), at least for known bacteria, this argument is tenable. Another kind of NiD, nitrification-coupled denitrification (NCD) [16,40], could not be as conspicuous as ND in hypoxic soil. Spearman correlation heatmaps (Figure 7 and Figure S8) further highlight the possibility of ND.
The paddy field soils are mostly used in studying the effects of the wet-dry cycle on soil N2O emission and microbial characteristics [7]. The water management modes of paddy field, i.e., continuous flooding vs. intermittent irrigation in the growing period, and irrigation/non-irrigation in winter result in the alternating dry and wet environment of soil and affect the comprehensive effects of N2O emission [41]. Similar results were obtained in the monitoring experiment of paddy black soil [42], with pronounced changes of nitrifier/denitrifier. However, the effect of the wet-dry cycle on N2O emissions from upland soil and responses of nitrification/denitrification genes toward early/immediate moisture is still elusive. The present results help understand upland soil systems that are characterized by fluctuating water availability over time, where rewetting events trigger intense microbial activity and soil N2O efflux pulses. Nitrogen substrates could accumulate during the dry period (Figure 2C) and fuel a large microbial-driven denitrification pulse upon soil rewetting.
What is the water threshold of maximal N2O emission?
Soil moisture and nitrogen are two important factors influencing N2O emissions and the growth of microorganisms. WFPS is the amount of water in a fixed state of the soil; in both alluvial soil and red soil, the N2O production was higher at 90% WFPS than at 50% WFPS [21]. In a pot experiment, the N2O fluxes were ca. 5-fold higher at 85% than at 65% WHC [43]. In the present study, the N2O emission of black soil was not only related to the immediate moisture but also strongly influenced by the legacy moisture. Favorably, when cultured at 90% WFPS of instant moisture, the soil dried at the early stage (20% WFPS) emitted more N2O with a higher N2O/N2 ratio than the soil wetted at the earlier stage [44]. Our black soil results are analogous to some extent. In a planting system, the water status during the previous cropping period will affect the N2O emission in the later cropping period. It is possible to reduce the later N2O emission via modifying the previous moisture, e.g., adjusting the pre-irrigation and drainage treatment before fertilization. It is essential to pay attention to the historical status of soil water in the study of N2O. With increasing moisture, weak denitrification occurred and there was less N2O production under 40–60% WHC (Figure 2A,C and Figure 8B,C). When the water content was higher than 60% WHC, the denitrification reaction, possibly including both HD and ND, was stronger, causing higher N2O emission; re-wetting can increase substrate (C and N) remobilization, which by itself can bolster N transformations including N2O production. Therefore, 60% WHC could be regarded as the water threshold of maximal N2O emission. Correspondingly, 12 genera were identified in the correlation heatmap analysis to be significantly associated with both N2O production and denitrification process (Figure 7), among which a novel genus of Cytophagaceae and Flavitalea belong to the phylum Bacteroidetes, the novel genera of Nitrosomonadaceae/Comamonadaceae and Nitrosospira belong to Betaproteobacteria, while Steroidobacter and Lysobacter are Gammaproteobacteria genera. The relative abundance of these taxonomic groups generally increased when the soil moisture was above 60% WHC (Figure 4A–D and Figure S3C–G). Nitrosomonas, Nitrosospira and Cytophagaceae are well-known nitrifiers [16,45], whereas Comamonadaceae and Lysobacter are typical denitrifiers [46], which support the presence of both ND and HD processes in higher moisture black soil.
As for the bacterial community composition and structure, a passivation (or neutralizing) effect was generated by putting the high moisture condition in front of the low one in the alternating regime, i.e., the number of taxonomic groups with statistically significant (p < 0.05) change in relative abundance under this regime was significantly less than those under wetting and wetting02 regimes (Table 1). In the alternating regime, the bacterial community composition and structure tend to be homogeneous under different levels of moisture (Figure 4 and Figure 5A). In contrast, under constant regime, the relative abundance of Beta-, Alpha- and Deltaproteobacteria, Cytophagia and Planctomycetacia were much higher under 80%WHC than under 40%WHC (Figure S3E,F). This is reminiscent of the higher abundance of proteobacterial denitrifiers in N2O-metabolizing palsa peat [37]; wet soils create oxygen-limited microzones, where HONO/N2O emissions from soil were associated with nitrate reduction activities of diverse Proteobacteria [38]. Moreover, the changes of Cytophagia and Planctomycetacia are for the first time revealed. The microbial response to dampening and desiccation reflects adaptation strategies [18,47], setting the stage for a large rainfall/irrigation-induced soil gas pulse upon rewetting, an important component of the ecosystem nitrogen budget.
In both alluvial soil and red soil, increased soil moisture stimulated the growth of AOB and nitrite reducer [21]. Changed soil moisture significantly affected AOA rather than AOB community composition in both soils. However, in the black soil of northeast China, the moisture regime substantially affected both AOA and AOB (Figure 8A and Figure S7), and the denitrification rate was related to the historical change of moisture. When the soil changed from 20% WHC to wet, the denitrification increased sharply, and at the same moisture, the denitrification rate was significantly higher than that from wet to dry. The early moisture status might have an impact on the denitrification reductase abundance or its transformation ability (Figure 8B,C), which in turn affect the denitrification intensity. The more the bacteria such as Gemmatimonas, Nitrosomonadaceae and Bacteroidetes genera, the higher the denitrification gene abundance (Figure S8) and the more N2O production. The antecedent high WHC treatment increased the functional capacity of soil denitrification reductase in this study, and the reduction of N2O to N2 was strong in the pre-wet soil [44]; more denitrifiers were found in soils with sufficient antecedent moisture [8]. Yet, it should be noted that our amplicon sequencing was not conducted specifically on nitrifying/denitrifying communities but on the whole bacterial community that also includes species not directly involved in these processes. That the Betaproteobacteria, Bacteroidetes and Gemmatimonadetes genera could be important factors explaining the variation of N2O production is just speculation; members of these taxonomic groups could be influenced by the early/immediate moisture but may not be directly involved in the nitrification/denitrification dynamics. As compared to nitrification/denitrification genes, the 16S rDNA is easier to be universally amplified, and understanding the global changes of black soil bacterial community in response to the fluctuation of moisture, not just those of nitrification/denitrification part, is essential to gain a holistic view on the effects of moisture regime and intricate interplay between various factors. In the future, with the availability of universal nitrification/denitrification gene primers and/or other state-of-the-art techniques, complementary data could help understand more details about nitrogen turnover (Figure 9B). Accordingly, a long-term global soil moisture database can be developed and expanded [48,49], enhancing a basic understanding of the role of soil moisture in nutrient cycles and agriculture.

Supplementary Materials

The following are available online at https://www.mdpi.com/article/10.3390/agriculture12030330/s1, Table S1: qPCR primers and conditions [50,51,52]; Table S2: Summary of two-way ANOVA; Table S3: Physicochemical properties of black soil sample; Table S4: Intergroup difference of relative abundance of microbial functions predicted by FAPROTAX; Figure S1A: rarefac,Shannon; Figure S1B: rarefac,Chao; Figure S2A: Chao box plot; Figure S2B: Shannon box plot; Figure S3A: Venn,4 regime,OTU; Figure S3B: circos,class level,11 sample group; Figure S3C: phyla,wetting; Figure S3D: class,wetting; Figure S3E: static,phyla; Figure S3F: class,static; Figure S3G: genus,circos,11 sample group; Figure S4: rank sum,11 group,class level; Figure S5: 50 families,11 sample group,heatmap; Figure S6A: PCA,genus level; Figure S6B: PCoA,genus level; Figure S7: AOA amoA; Figure S8: Spearman,4 gene.

Author Contributions

Conceptualization, L.W. (Lianfeng Wang), Z.J. and H.X.; methodology, L.W. (Lei Wang), D.-C.H. and S.F.; validation, X.B.; formal analysis, L.W. (Lei Wang), D.-C.H. and S.F.; resources, L.W. (Lianfeng Wang) and Z.J.; data curation, L.W. (Lei Wang) and D.-C.H.; writing—original draft preparation, D.-C.H.; writing—review and editing, D.-C.H. and L.W. (Lianfeng Wang); supervision, L.W. (Lianfeng Wang), Z.J. and H.X.; funding acquisition, D.-C.H., L.W. (Lianfeng Wang) and X.B. All authors have read and agreed to the published version of the manuscript.

Funding

This research was funded by the National Natural Science Foundation of China (No. 41471205, 41977048), Scientific Research Funds Project of Liaoning Education Department (LR2016067, JDL2019012).

Institutional Review Board Statement

Not applicable.

Data Availability Statement

Sequencing reads of 31 soil samples can be retrieved from CNSA of China National GeneBank (https://db.cngb.org/cnsa/home, accessed on 9 January 2022) with accession numbers CNX0085253-CNX0085283.

Acknowledgments

We thank Zhang Xilin (Heilongjiang Academy of Agricultural Sciences) for his help in black soil sampling. We thank two anonymous review experts for their critical comments and constructive suggestions.

Conflicts of Interest

The authors declare no conflict of interest.

Abbreviations

AO, ammonia-oxidation; AOA, ammonia-oxidizing archaea; AOB, ammonia-oxidizing bacteria; DNRA, dissimilatory NRA; FDR, false discovery rate; GC, gas chromatography; HD, heterotrophic denitrification; NCD, nitrification-coupled denitrification; ND, nitrifier denitrification; NiD, nitrifier-induced denitrification; nir, nitrite reducer; NMDS, non-metric multidimensional scaling; NRA, nitrite/nitrate reduction to ammonium; N2O, nitrous oxide; OTU, operational taxonomic unit; PCA, principal component analysis; PCoA, principal coordinate analysis; PERMANOVA, permutational MANOVA; qPCR, quantitative PCR; RDA, redundancy analysis; VIF, variance inflation factor; WFPS, water-filled pore space; WHC, water holding capacity.

References

  1. Han, Z.; Deng, M.; Yuan, A.; Wang, J.; Li, H.; Ma, J. Vertical variation of a black soil’s properties in response to freeze-thaw cycles and its links to shift of microbial community structure. Sci. Total Environ. 2018, 625, 106–113. [Google Scholar] [CrossRef] [PubMed]
  2. Lang, M.; Li, P.; Han, X.; Qiao, Y.F.; Miao, S.J. Gross nitrogen transformations in black soil under different land uses and management systems. Biol. Fertil. Soils 2016, 52, 233–241. [Google Scholar] [CrossRef]
  3. Wang, L.F.; Cai, Z.C.; Yang, L.F.; Meng, L. Effect of disturbance and glucose addition on nitrous oxide and carbon dioxide emissions from a paddy soil. Soil Till. Res. 2005, 82, 185–194. [Google Scholar] [CrossRef]
  4. Lin, S.; Hernandez-Ramirez, G. Nitrous oxide emissions from manured soils as a function of various nitrification inhibitor rates and soil moisture contents. Sci. Total Environ. 2020, 738, 139669. [Google Scholar] [CrossRef]
  5. Thilakarathna, S.K.; Hernandez-Ramirez, G. Primings of soil organic matter and denitrification mediate the effects of moisture on nitrous oxide production. Soil Biol. Biochem. 2021, 155, 108166. [Google Scholar] [CrossRef]
  6. Wu, D.M.; Dong, W.X.; Oenema, O.; Wang, Y.Y.; Trebs, I.; Hu, C.S. N2O consumption by low-nitrogen soil and its regulation by water and oxygen. Soil Biol. Biochem. 2013, 60, 165–172. [Google Scholar] [CrossRef]
  7. Wang, L.F.; Cai, Z.C. Nitrous oxide and carbon dioxide emissions from upland acidic soils under flooding and moistening pretreatments. Acta Sci. Circumstantiae 2011, 31, 1736–1744. [Google Scholar]
  8. Peralta, A.L.; Ludmer, S.; Kent, A.D. Hydrologic history influences microbial community composition and nitrogen cycling under experimental drying/wetting treatments. Soil Biol. Biochem. 2013, 66, 29–37. [Google Scholar] [CrossRef]
  9. Banerjee, S.; Helgason, B.; Wang, L.F.; Winsley, T.; Ferrari, B.C.; Siciliano, S.D. Legacy effects of soil moisture on microbial community structure and N2O emissions. Soil Biol. Biochem. 2016, 95, 40–50. [Google Scholar] [CrossRef]
  10. Krichels, A.; DeLucia, E.H.; Sanford, R.; Chee-Sanford, J.; Yang, W.H. Historical soil drainage mediates the response of soil greenhouse gas emissions to intense precipitation events. Biogeochemistry 2019, 142, 425–442. [Google Scholar] [CrossRef]
  11. Maljanen, M.; Yli-Pirilä, P.; Hytönen, J.; Joutsensaari, J.; Martikainen, P.J. Acidic northern soils as sources of atmospheric nitrous acid (HONO). Soil Biol. Biochem. 2013, 67, 94–97. [Google Scholar] [CrossRef]
  12. Donaldson, M.A.; Bish, D.L.; Raff, J.D. Soil surface acidity plays a determining role in the atmospheric-terrestrial exchange of nitrous acid. Proc. Natl. Acad. Sci. USA 2014, 111, 18472–18477. [Google Scholar] [CrossRef] [PubMed] [Green Version]
  13. Wang, L.F.; Cai, Z.C. Nitrous oxide production at different soil moisture contents in an arable soil in China. Soil Sci. Plant Nutr. 2008, 54, 786–793. [Google Scholar] [CrossRef]
  14. Qin, H.L.; Xing, X.; Tang, Y.; Zhu, B.L.; Wei, X.M.; Chen, X.B.; Liu, Y. Soil moisture and activity of nitrite- and nitrous oxide-reducing microbes enhanced nitrous oxide emissions in fallow paddy soils. Biol. Fert. Soil. 2020, 56, 53–67. [Google Scholar] [CrossRef]
  15. Nguyen, L.T.; Osanai, Y.; Lai, K.; Anderson, I.C.; Bange, M.P.; Tissue, D.T.; Singh, B.K. Flooding and prolonged drought have differential legacy impacts on soil nitrogen cycling, microbial communities and plant productivity. Plant Soil 2018, 431, 371–387. [Google Scholar] [CrossRef]
  16. Shi, X.; Hu, H.W.; Zhu-Barker, X.; Hayden, H.; Wang, J.; Suter, H.; Chen, D.; He, J.Z. Nitrifier-induced denitrification is an important source of soil nitrous oxide and can be inhibited by a nitrification inhibitor 3,4-dimethylpyrazole phosphate. Environ. Microbiol. 2017, 19, 4851–4865. [Google Scholar] [CrossRef] [PubMed]
  17. Zhu, X.; Burger, M.; Doane, T.A.; Horwath, W.R. Ammonia oxidation pathways and nitrifier denitrification are significant sources of N2O and NO under low oxygen availability. Proc. Natl. Acad. Sci. USA 2013, 110, 6328–6333. [Google Scholar] [CrossRef] [PubMed] [Green Version]
  18. Barnard, R.L.; Osborne, C.A.; Firestone, M.K. Changing precipitation pattern alters soil microbial community response to wet-up under a Mediterranean-type climate. ISME J. 2015, 9, 946–957. [Google Scholar] [CrossRef] [Green Version]
  19. Hao, D.C.; Song, S.M.; Mu, J.; Hu, W.L.; Xiao, P.G. Unearthing microbial diversity of Taxus rhizosphere via MiSeq high-throughput amplicon sequencing and isolate characterization. Sci. Rep. 2016, 6, 22006. [Google Scholar] [CrossRef] [PubMed] [Green Version]
  20. Obayomi, O.; Edelstein, M.; Safi, J.; Mihiret, M.; Ghazaryan, L.; Vonshak, A.; Bernstein, N.; Gillor, O. The combined effects of treated wastewater irrigation and plastic mulch cover on soil and crop microbial communities. Biol. Fert. Soils 2020, 56, 729–742. [Google Scholar] [CrossRef]
  21. Wang, Q.; Liu, Y.R.; Zhang, C.J.; Zhang, L.M.; Han, L.L.; Shen, J.P.; He, J.Z. Responses of soil nitrous oxide production and abundances and composition of associated microbial communities to nitrogen and water amendment. Biol. Fertil. Soils 2017, 53, 601–611. [Google Scholar] [CrossRef]
  22. Guo, L.; Wang, X.; Diao, T.; Ju, X.; Niu, X.G.; Zheng, L.; Zhang, X.; Han, X. N2O emission contributions by different pathways and associated microbial community dynamics in a typical calcareous vegetable soil. Environ. Pollut. 2018, 242, 2005–2013. [Google Scholar] [CrossRef] [PubMed]
  23. Beare, M.H.; Gregorich, E.G.; St-Georges, P. Compaction effects on CO2 and N2O production during drying and rewetting of soil. Soil Biol. Biochem. 2009, 41, 611–621. [Google Scholar] [CrossRef]
  24. Guo, X.B.; Drury, C.F.; Yang, X.M.; Zhang, R.D. Influence of constant and fluctuating water contents on nitrous oxide emissions from soils under varying crop rotations. Soil Sci. Soc. Am. J. 2010, 74, 2077–2085. [Google Scholar] [CrossRef]
  25. Barnard, R.L.; Blazewicz, S.J.; Firestone, M.K. Rewetting of soil: Revisiting the origin of soil CO2 emissions. Soil Biol. Biochem. 2020, 147, 107819. [Google Scholar] [CrossRef]
  26. Nguyen, L.T.; Osanai, Y.; Lai, K.; Anderson, I.C.; Bange, M.P.; Tissue, D.T.; Singh, B.K. Responses of the soil microbial community to nitrogen fertilizer regimes and historical exposure to extreme weather events: Flooding or prolonged-drought. Soil Biol. Biochem. 2018, 118, 227–236. [Google Scholar] [CrossRef]
  27. Szukics, U.; Abell, G.C.; Hödl, V.; Mitter, B.; Sessitsch, A.; Hackl, E.; Zechmeister-Boltenstern, S. Nitrifiers and denitrifiers respond rapidly to changed moisture and increasing temperature in a pristine forest soil. FEMS Microbiol. Ecol. 2010, 72, 395–406. [Google Scholar] [CrossRef] [PubMed]
  28. Bowen, H.; Maul, J.E.; Cavigelli, M.A.; Yarwood, S. Denitrifier abundance and community composition linked to denitrification activity in an agricultural and wetland soil. Appl. Soil Ecol. 2020, 151, 103521. [Google Scholar] [CrossRef]
  29. Wang, J.Y.; Jia, J.X.; Xiong, Z.Q.; Khalil, M.A.; Xing, G.X. Water regime-nitrogen fertilizer-straw incorporation interaction: Field study on nitrous oxide emissions from a rice agroecosystem in Nanjing, China. Agri. Ecosys. Environ. 2011, 141, 437–446. [Google Scholar] [CrossRef]
  30. Louca, S.; Parfrey, L.W.; Doebeli, M. Decoupling function and taxonomy in the global ocean microbiome. Science 2016, 353, 1272–1277. [Google Scholar] [CrossRef]
  31. Pajares, S.; Campo, J.; Bohannan, B.J.M.; Etchevers, J.D. Environmental controls on soil microbial communities in a seasonally dry tropical forest. Appl. Environ. Microbiol. 2018, 84, e00342-18. [Google Scholar] [CrossRef] [PubMed] [Green Version]
  32. Azarbad, H.; Constant, P.; Giard-Laliberté, C.; Bainard, L.D.; Yergeau, E. Water stress history and wheat genotype modulate rhizosphere microbial response to drought. Soil Biol. Biochem. 2018, 126, 228–236. [Google Scholar] [CrossRef]
  33. Shen, Q.L.; Zhang, K.L.; Song, J.W.; Shen, J.X.; Xu, J.M.; Inubushi, K.; Brookes, P.C. Contrasting biomass, dynamics and diversity of microbial community following the air-drying and rewetting of an upland and a paddy soil of the same type. Biol. Fert. Soil. 2018, 54, 871–875. [Google Scholar] [CrossRef]
  34. Preece, C.; Verbruggen, E.; Liu, L.; Weedon, J.T.; Peñuelas, J. Effects of past and current drought on the composition and diversity of soil microbial communities. Soil Biol. Biochem. 2019, 131, 28–39. [Google Scholar] [CrossRef]
  35. Calderón, K.; Spor, A.; Breuil, M.C.; Bru, D.; Bizouard, F.; Violle, C.; Barnard, R.L.; Philippot, L. Effectiveness of ecological rescue for altered soil microbial communities and functions. ISME J. 2017, 11, 272–283. [Google Scholar] [CrossRef] [Green Version]
  36. Sun, L.F.; Xia, Z.W.; Sang, C.P.; Wang, X.; Peng, B.; Wang, C.; Zhang, J.B.; Müller, C.; Bai, E. Soil resource status affects the responses of nitrogen processes to changes in temperature and moisture. Biol. Fert. Soils 2019, 55, 629–641. [Google Scholar] [CrossRef]
  37. Palmer, K.; Horn, M.A. Actinobacterial nitrate reducers and proteobacterial denitrifiers are abundant in N2O-metabolizing palsa peat. Appl. Environ. Microbiol. 2012, 78, 5584–5596. [Google Scholar] [CrossRef] [Green Version]
  38. Wu, D.; Horn, M.A.; Behrendt, T.; Müller, S.; Li, J.; Cole, J.A.; Xie, B.; Ju, X.; Li, G.; Ermel, M.; et al. Soil HONO emissions at high moisture content are driven by microbial nitrate reduction to nitrite: Tackling the HONO puzzle. ISME J. 2019, 13, 1688–1699. [Google Scholar] [CrossRef]
  39. Zhou, Y.; Hu, B.; Zhang, W.; Zhang, Y.; Zhang, Y.; Zhang, T. Nitrous oxide emission from stormwater biofilters in alternating dry and wet weather. Environ. Res. 2020, 191, 110137. [Google Scholar] [CrossRef]
  40. Zhang, J.B.; Müller, C.; Cai, Z.C. Heterotrophic nitrification of organic N and its contribution to nitrous oxide emissions in soils. Soil Biol. Biochem. 2015, 84, 199–209. [Google Scholar] [CrossRef]
  41. Shang, Q.Y.; Yang, X.X.; Gao, C.M.; Wu, P.P.; Liu, J.J.; Xu, Y.C.; Shen, Q.R.; Zou, J.W.; Guo, S.W. Net annual global warming potential and greenhouse gas intensity in Chinese double rice-cropping systems: A 3-year field measurement in long-term fertilizer experiments. Glob. Change Biol. 2011, 17, 2196–2210. [Google Scholar] [CrossRef]
  42. Yue, J.; Shi, Y.; Liang, W.; Wu, J.; Wang, C.R.; Huang, G.H. Methane and nitrous oxide emissions from rice field and related microorganism in black soil, northeastern China. Nutr. Cycl. Agroecosys. 2005, 73, 293–301. [Google Scholar] [CrossRef]
  43. Senbayram, M.; Chen, R.; Mühling, K.H.; Dittert, K. Contribution of nitrification and denitrification to nitrous oxide emissions from soils after application of biogas waste and other fertilizers. Rapid Comm. Mass Spectro. 2009, 23, 2489–2498. [Google Scholar] [CrossRef] [PubMed]
  44. Bergstermann, A.; Cardenas, L.; Bol, R.; Gilljam, L.; Gounlding, K.; Meijide, A.; Scholefield, D.; Vallejo, A.; Well, R. Effect of antecedent soil moisture conditions on emissions and isotoplogue distribution of N2O during denitrification. Soil Biol. Biochem. 2011, 43, 240–250. [Google Scholar] [CrossRef]
  45. Cai, X.; Wen, P.; Yuan, Y.; Tang, J.; Yu, Z.; Zhou, S. Identification of nitrogen-incorporating bacteria in a sequencing batch reactor: A combining cultivation-dependent and cultivation-independent method. Bioreso. Technol. 2020, 316, 123964. [Google Scholar] [CrossRef]
  46. Li, Y.; Zhu, J.; Wang, L.; Gao, Y.; Zhang, W.; Zhang, H.; Niu, L. Grain size tunes microbial community assembly and nitrogen transformation activity under frequent hyporheic exchange: A column experiment. Water Res. 2020, 182, 116040. [Google Scholar] [CrossRef] [PubMed]
  47. Barnard, R.L.; Osborne, C.A.; Firestone, M.K. 2013. Responses of soil bacterial and fungal communities to extreme desiccation and rewetting. ISME J. 2013, 7, 2229–2241. [Google Scholar] [CrossRef] [PubMed]
  48. Liu, Y.Y.; Parinussa, R.M.; Dorigo, W.A.; De Jeu, R.A.M.; Wagner, W.; van Dijk, A.I.J.M.; McCabe, M.F.; Evans, J.P. Developing an improved soil moisture dataset by blending passive and active microwave satellite-based retrievals. Hydrol. Earth Syst. Sci. 2011, 15, 425–436. [Google Scholar] [CrossRef] [Green Version]
  49. Su, Z.; Wen, J.; Dente, L.; van der Velde, R.; Wang, L.; Ma, Y.; Yang, K.; Hu, Z. The Tibetan Plateau observatory of plateau scale soil moisture and soil temperature (Tibet-Obs) for quantifying uncertainties in coarse resolution satellite and model products. Hydrol. Earth Syst. Sci. 2011, 15, 2303–2316. [Google Scholar] [CrossRef] [Green Version]
  50. Francis, C.A.; Roberts, K.J.; Beman, J.M.; Santoro, A.E.; Oakley, B.B. Ubiquity and diversity of ammonia-oxidizing archaea in water columns and sediments of the ocean. Proc. Natl. Acad. Sci. USA 2005, 102, 14683–14688. [Google Scholar] [CrossRef] [PubMed] [Green Version]
  51. Szukics, U.; Hackl, E.; Zechmeister-Boltenstern, S.; Sessitsch, A. Rapid and dissimilar response of ammonia oxidizing archaea and bacteria to nitrogen and water amendment in two temperate forest soils. Microbiol. Res. 2012, 167, 103–109. [Google Scholar] [CrossRef] [PubMed]
  52. Throbäck, I.N.; Enwall, K.; Jarvis, A.; Hallin, S. Reassessing PCR primers targeting nirS, nirK and nosZ genes for community surveys of denitrifying bacteria with DGGE. FEMS Microbiol. Ecol. 2004, 49, 401–417. [Google Scholar] [CrossRef] [PubMed]
Figure 1. The overview of experimental design and workflow. a20, 20% WHC for one week; a80, 80% WHC for two weeks; a40, 40% WHC for two weeks; w40, 40% WHC for two weeks; w80, 80% WHC for two weeks; s40, 40% WHC for four weeks; s80, 80% WHC for four weeks; w2_40, 40% WHC for one week; w2_60, 60% WHC for one week; w2_80, 80% WHC for one week; w2_100, 100% WHC for one week. If the sample processing time is one week, the soil sample is taken on the last day of the week for physicochemical examination and 16S rRNA amplicon sequencing; if the processing time is two weeks, the sample is also taken on the last day, and so on.
Agriculture 12 00330 g001
Figure 2. The temporal alterations of N2O emission (A), ammonium nitrogen (B) and nitrate (C) under four types of moisture regimes. Bars indicate ± 1SD; the statistical significance is detailed in the main body of the text and Table S2. Alternating: a20 (sampling at the end of the first week)→a80 (sampling at the end of the third week)→a40 (sampling at the end of the fifth week); wetting: a20→w40 (sampling at the end of the third week)→w80 (sampling at the end of the fifth week); wetting02: a20→w2_40 (sampling at the end of the second week)→w2_60 (sampling at the end of the third week)→w2_80 (sampling at the end of the fourth week)→w2_100 (sampling at the end of the fifth week); static(constant)40: a20→s40 (sampling at the end of each week); static(constant)80: a20→s80 (sampling at the end of each week).
Agriculture 12 00330 g002
Figure 3. Alpha diversity variations among soil samples under various moisture regimes. (A) Community richness represented by Ace; (B) Community diversity represented by Simpson index. Boxes represent 25–75% of the data, middle lines the median, and the small boxes inside represent the average values. Means that do not share a letter are significantly different. a20, 20% WHC for one week; a80, 80% WHC for two weeks; a40, 40% WHC for two weeks; w40, 40% WHC for two weeks; w80, 80% WHC for two weeks; s40, 40% WHC for four weeks; s80, 80% WHC for four weeks; w2_40, 40% WHC for one week; w2_60, 60% WHC for one week; w2_80, 80% WHC for one week; w2_100, 100% WHC for one week.
Agriculture 12 00330 g003
Figure 4. (A) Dynamics of the 16S rRNA gene-based relative abundance of the main present bacterial phyla, sequenced during wet-up and dry-down (alternating regime). (B) Dynamics of the 16S rRNA gene-based relative abundance of the main present bacterial classes, sequenced during wet-up and dry-down (alternating regime). (C) Dynamics of the 16S rRNA gene-based relative abundance of the main present bacterial phyla, sequenced during wet-up (wetting02 regime). (D) Dynamics of the 16S rRNA-based relative abundance of the main present bacterial classes, sequenced during wet-up (wetting02 regime). Bars indicate ±1 SD.
Agriculture 12 00330 g004
Figure 5. FAPROTAX analysis of variations in functional groups of bacteria in black soil. (A) Differential abundance of bacterial nitrification among sample groups (Table S4). (B) Differential abundance of ureolysis, a dominant nitrogen mineralization process. (C) Differential abundance of nitrite ammonification (DNRA). (D) Differential abundance of nitrate respiration (NRA). Boxes represent 25–75% of the data, middle lines the median, and the two lines above and below the box represent the maximum and minimum values respectively. Kruskal-Wallis H rank sum test was used in the multi-group comparison; false discovery rate (FDR) was used for the multiple test correction, and Tukey-kramer method was used as the post-hoc test of pairwise comparison. Means that do not share a letter are significantly different.
Agriculture 12 00330 g005aAgriculture 12 00330 g005b
Figure 6. (A) Order level PCA plot showing patterns of beta diversity in 11 soil samples of various immediate and early moisture. Bacterial communities are ordinated against six variables. (B) Order level 3D-PCoA is based on the weighted Unifrac distance and shows the separation of different bacterial communities under five moisture regimes. a20, 20% WHC for one week; a80, 80% WHC for two weeks; a40, 40% WHC for two weeks; w40, 40% WHC for two weeks; w80, 80% WHC for two weeks; s40, 40% WHC for four weeks; s80, 80% WHC for four weeks; w2_40, 40% WHC for one week; w2_60, 60% WHC for one week; w2_80, 80% WHC for one week; w2_100, 100% WHC for one week.
Agriculture 12 00330 g006
Figure 7. Spearman correlation heatmap showing the link between environmental variables and various bacterial genera. A certain color gradient is used to represent the correlation coefficient between the environmental variable and the genus; the correlation coefficient values represented by the color gradient are shown on the right bar. * p < 0.05; ** p < 0.01; *** p < 0.001. The top 50 genera in total abundance are shown. Hierarchical clustering of environmental factors: Average; hierarchical clustering of genera: Average.
Agriculture 12 00330 g007
Figure 8. qPCR shows the temporal alterations of AOB amoA abundance (A), nirS abundance (B), and nosZ abundance (C) under four types of moisture regimes. Alternating: a20 (sampling at the end of the first week)→a80 (sampling at the end of the third week)→a40 (sampling at the end of the fifth week); wetting: a20→w40 (sampling at the end of the third week)→w80 (sampling at the end of the fifth week); wetting02: a20→w2_40 (sampling at the end of the second week)→w2_60 (sampling at the end of the third week)→w2_80 (sampling at the end of the fourth week)→w2_100 (sampling at the end of the fifth week); static(constant)40: a20→s40 (sampling at the end of each week); static(constant)80: a20→s80 (sampling at the end of each week).
Agriculture 12 00330 g008
Figure 9. (A) OTU level RDA of gene abundance. The abundance of four genes, as four factors, were screened using VIF method. The VIF values of four genes are well below 10 (1.39–4.26). a20, 20% WHC for one week; a80, 80% WHC for two weeks; a40, 40% WHC for two weeks; w40, 40% WHC for two weeks; w80, 80% WHC for two weeks; s40, 40% WHC for four weeks; s80, 80% WHC for four weeks; w2_40, 40% WHC for one week; w2_60, 60% WHC for one week; w2_80, 80% WHC for one week; w2_100, 100% WHC for one week. (B) Microbial nitrification/denitrification and related nitrogen transformation pathways in black soil.
Agriculture 12 00330 g009
Table 1. Number of taxonomic groups with significant change in relative abundance under four black soil water regimes.
Water RegimeNo. of Phyla with Statistically Significant (p < 0.05) Change in Relative AbundanceNo. of Classes with Statistically Significant (p < 0.05) Change in Relative Abundance
Alternating3/307/30
Wetting9/3018/30
Wetting028/3016/30
Static/constant8/3019/30
Note: The one-way ANOVA was used to identify taxonomic groups with significant change in relative abundance under three black soil water regimes, i.e., Alternating, Wetting and Wetting02; the Student’s T test was used to identify taxonomic groups with significant change in relative abundance under constant moisture regime. Only top 30 taxonomic groups in abundance were considered.
Publisher’s Note: MDPI stays neutral with regard to jurisdictional claims in published maps and institutional affiliations.

