Article

Short-Term Resilience of Soil Microbial Communities and Functions Following Severe Environmental Changes

1
Research Centre for Agriculture and Environment, Council for Agricultural Research and Economics, Via di Lanciola 12/A, Cascine del Riccio, 50125 Firenze, Italy
2
Department of Agricultural Sciences, Mediterranean University of Reggio Calabria, Feo di Vito, 89122 Reggio Calabria, Italy
3
Department of Agriculture, Food, Environment and Forestry, University of Florence, P.le delle Cascine, 28, 50144 Firenze, Italy
4
Department of Civil Engineering, Architecture, Environmental and Mathematics (DICATAM), University of Brescia, Via Branze, 43, 25123 Brescia, Italy
5
Department of Agronomy, Food, Natural Resources Animals and Environment (DAFNAE), University of Padua, Viale dell’Università 16, Legnaro, 35020 Padova, Italy
*
Author to whom correspondence should be addressed.
Agriculture 2022, 12(2), 268; https://doi.org/10.3390/agriculture12020268
Submission received: 31 December 2021 / Revised: 6 February 2022 / Accepted: 6 February 2022 / Published: 14 February 2022
(This article belongs to the Special Issue Advanced Research of Soil Microbial Functional Diversity)

Abstract

:
Soil microorganisms are key drivers of soil biochemical processes, but the resilience of microbial communities and their metabolic activity after an extreme environmental change is still largely unknown. We studied structural (bacterial and fungal communities) and functional responses (soil respiration, adenosine triphosphate (ATP) content, hydrolase activities involved in the mineralization of organic C, N, P and S, and microbial community-level physiological profiles (CLPPs)) during the microbial recolonization of three heat-sterilized forest soils followed by cross- or self-reinoculation and incubation for 1, 7 and 30 days. Soil ATP content, biochemical activities and CLPP were annihilated by autoclaving, whereas most of the hydrolase activities were reduced to varying extents depending on the soil and enzyme activity considered. During the incubation period, the combination of self- and cross-reinoculation of different sterilized soils produced rapid dynamic changes in enzymatic activity as well as in microbial structure and catabolic activity. Physicochemical properties of the original soils exerted a major influence in shaping soil functional diversity, while reinoculation of sterilized soils promoted faster and greater changes in bacterial community structure than in fungal communities, varying with incubation period and soil type. Our results also confirmed the importance of microbial richness in determining soil resilience under severe disturbances. In particular, the new microbial communities detected in the treated soils revealed the occurrence of taxa which were not detected in the original soils. This result confirmed that rare microbial taxa rather than the dominant ones may be the major drivers of soil functionality and resilience.

1. Introduction

Soil microbial communities display high metabolic diversity and functional redundancy, two features that make them major drivers of nutrient biogeochemical cycles and globally a key factor of soil resilience [1,2,3,4]. Despite the fast proliferation rates and high colonization capacities of microbial species, the long-held historical view that “everything is everywhere, but the environment selects” [5] is no longer accepted in soil microbial ecology to explain the complex interactions occurring among environmental characteristics, microbial community structure and microbial functional activity. In fact, large-scale studies of soil microbial distribution supported by ‘omics’ methods have led to the development of new conceptual frameworks of species assembly, such as the ‘coalescence’ [6] and ‘metacommunity’ theories [7]. The coalescence theory proposes that previously separated microbial communities can completely mix in the soil environment and form a new community, whereas the metacommunity theory describes the diversity of microbial communities in terms of species compatibility with soil physicochemical properties and microbial interactions of individuals or species by stochastic and deterministic dispersal processes.
In actual agricultural contexts, where soils are often threatened by anthropic and environmental factors, it is extremely important to better understand the role of soil microbiota in maintaining soil functions, even after severe disturbances. In fact, although soil-borne microorganisms possess high metabolic flexibility and display tolerance to changing environmental conditions [8], the response of soil microbial communities to external disturbance or environmental changes is still poorly understood [9,10,11,12]. Experiments with soil sterilization and soil mixing have been considered a suitable approach to understand the recovery of microbial diversity and soil functions after extreme impacts and variations induced by the coalescence of soil communities. Previous studies on soil microbial recolonization after sterilization by fumigation, autoclaving or γ-irradiation [13,14,15,16] have shown that microbial metabolic activities are primarily involved in the colonization capacity of microbial communities of the same and/or different sterilized soils. Complex ecological interactions as well as adaptive responses between microbial species during soil recolonization have been also reported [17,18]. However, few studies have assessed the recovery of bacterial and fungal community structure and functions during the recolonization of sterilized soils. For example, Latour et al. [19] reported that the composition of a mixed Pseudomonas community developed differently when inoculated into sterile soils with different characteristics. Delmont et al. [20] observed that distinct microbial communities from soils of different locations and land use evolved similarly when recolonizing the same sterilized soil. The combination of self- and cross-inoculation of different soils and sterilized soils showed how the new microbial community structure is shaped by soil properties and levels of fertilization, confirming the importance of nutrient availability as a key factor shaping the composition of mixed microbial communities [21,22]. In a microcosm experiment, Wertz et al. [18] modified the soil microbial community composition by serial dilution and reinoculation of sterile soil. However, they observed no effects of microbial community composition on soil functionality. In a soil cross-inoculation experiment, Kapagianni et al. [23] showed that the soil type had a major influence on the composition of the new soil microbial communities, whereas enzymatic activities were related to the inoculum source initially and to the soil pH value at later stages.
Based on such studies, two central questions still have no univocal answer: (i) do soil microbial communities recover to their original structure and functionality after drastic disturbance? and (ii) do the same microbial communities colonizing different soils express similar biochemical functions? We hypothesized that microbial communities originating from different soils are able to recolonize the same soil after a drastic disturbance or even colonize soils with different physicochemical properties and that the newly introduced microbial communities are capable of expressing their metabolic potential in different soil types. We tested these hypotheses in a laboratory incubation experiment using a combination of sterilization and self- and cross-inoculation of three soils with contrasting pH, texture and organic C contents.
We measured the microbial biomass, soil respiration and N mineralization and the activity of soil enzymes involved in C, N, P and S mineralization and related them to the diversity of bacterial and fungal community structure and the community-level physiological profile (CLPP) of the culturable fraction of soil microbial communities in all sterilized non-inoculated, self- and cross-inoculated soils.
The present work can improve knowledge of the resilience of soil microbial community structure and functions, including potential CO2 emission and N mineralization, catabolic activity and enzymatic activity in newly colonized soils. Improvement of base knowledge on soil microbial ecology can also be important in the current scenario of climate change, in which increased intensity and/or frequency of extreme drought and rain events may lead to more drastic alterations of soil microbial community structure with unknown consequences on soil microbial diversity and metabolic activity [24], and to evaluate the potential of soil reclamation interventions.

2. Materials and Methods

2.1. Soils and Soil Treatments

Soils with contrasting physicochemical properties (Table 1) were collected from the A horizon of three forest sites. The Vallombrosa soil (Val) was collected from a protected silver fir (Abies alba Mill.) forest (43°43′58″ N, 11°33′23″ E, 950 m a.s.l.) which developed on Oligocene sandstone and is classified as fine-loamy, mixed, mesic Fragic Dystrudept (Soil Survey Staff, 2010). The Romola soil (Rom) was collected from former arable land (43°41′53″ N, 11°09′41″ E, 205 m a.s.l.) abandoned for 40 years, vegetated with mixed shrubs and herbs and dominated by holm oak (Quercus ilex L.), formed on alluvial deposits, and is classified as coarse, mixed, thermic Eutric Cambisol (Soil Survey Staff, 2010). The Vicarello soil (Vic) was sampled from the CREA experimental station in Volterra (43°36′48″ N, 10°27′53″ E, 150 m a.s.l.), developed on Pliocene clayey marine deposits, is classified as fine, mixed, thermic Vertic Xerochrept (Soil Survey Staff, 2010), and was sampled from 50-year-old mixed woodland vegetation dominated by a downy oak (Quercus pubescens Wild.).
After sampling, field moist soils were sieved at <2 mm particle size, brought to 50% water-holding capacity (WHC) and then conditioned at 25 °C in the dark for 7 days to stabilize the microbial activity. After conditioning, an amount of soil equivalent to 1 kg dry weight of each soil was autoclaved (121 °C, 1 bar, 1 h) in glass Petri dishes containing 100 g of soil each, incubated in the dark (25 °C, 24 h) and then further autoclaved (121 °C, 1 bar, 1 h) according to Wolf and Skipper [25].
We sterilized the original soils by autoclaving because soil sterilization with γ-irradiation or fumigants (e.g., chloroform) leaves most of the soil enzymes still active [15,26,27,28,29], whilst autoclaving reduces most soil enzyme activities below detection levels, allowing us to assess the newly microbial-derived enzyme production during the recolonization of sterilized soils [30]. Each autoclaved soil (‘recipient soil’) was reinoculated in a factorial way with the same (self-reinoculation) or the other (cross-inoculation) non-sterile fresh soil at 5% (w/w) rate and then thoroughly mixed until a homogeneous incorporation had been reached. Control treatments were both autoclaved non-inoculated soils (Val*, Vic*, Rom*) and non-autoclaved non-inoculated fresh soils (Val, Vic, Rom). After sterilization and inoculation, 100 g of each soil were placed into 1 L air-tight glass flasks provided with 3-way valves for head-space gas sampling and incubated in the dark at 25 °C for 24 h (day 1), 7 and 30 days. Based on the results provided by similar experiments [20,21,22,23], we choose an incubation time of 30 days to focus on the very first changes occurring after the disturbance. All treatments were prepared as three independent replicates for each treatment and incubation time, and at each sampling time the incubated samples were destructively sampled and immediately used for chemical and biochemical analyses, CLPP and microbial community fingerprinting.

2.2. Soil Respiration, N Ammonification, Microbial Biomass and Enzymatic Activities

Soil respiration was determined by the quantification of CO2 emission by head-space gas sampling and gas chromatographic analysis (Hewlett-Packard Model 6890, equipped with a thermal conductivity detector and a packed column (Porapak Q, Supelco, Bellefonte, PA, USA)), according to Blackmer and Bremner [31]. Three control jars with no soil were used to correct for atmospheric CO2-C background concentration. N ammonification was determined by extractions with 1 M KCl (1:5, w:v), followed by colorimetric determination of NH4+-N concentration with the Nessler reagent. Soil microbial biomass was estimated by the adenosine 5′-triphosphate (ATP) soil content, determined according to Ciardi and Nannipieri [32]. Acid and alkaline phosphomonoesterase, β-glucosidase, protease and urease were determined with colorimetric assays, as described by Dick et al. [33].

2.3. Community-Level Physiological Profile (CLPP) Fingerprinting

The community-level physiological profile (CLPP) was analyzed using the Biolog Ecoplates® for bacteria and the FF Microplates® for fungi (Biolog Inc., Hayward, California, USA). Each plate was inoculated with 150 µL per well of a 10–1 (w/v) soil suspension obtained in sterile NaCl solution (9 g L−1) after bead beating at 250 rpm for 30 min. Then, soil suspensions were fortified with cycloheximide (100 µg mL−1) or kanamycin (100 µg mL−1) to selectively favour bacterial (Biolog Ecoplates®) or fungal (FF Microplates®) growth, respectively. Plates were incubated at 30 °C in the dark for 190 h. The metabolic activity of the microbial communities was monitored by recording the absorbance at 590 nm (OD590) at 12 h intervals using a Biolog Microstation System and expressed as average well color development (AWCD) [34]. The area of each curve was calculated according to Guckert et al. [35], whereas the catabolic versatility (CV) index and the kinetic ‘s’ parameter (the time to the midpoint of the exponential portion of the curve) were calculated according to Burkhardt et al. [36] and Lindstrom et al. [37], respectively.

2.4. Soil DNA Extraction and PCR-DGGE Fingerprinting

Total soil DNA was extracted from 250 mg moist soil using the Fast DNA™ SPIN Kit for soil (MP Biomedicals™, Santa Ana, CA, USA). Yield and quality of soil-extracted DNA were checked by 0.7% agarose gel electrophoresis and quantified according to Marstorp and Witter [38]. For DGGE analysis of the bacterial community, the PCR amplification of soil-extracted DNA was performed using the primer system flanking the hypervariable V6–V8 region of 16S rDNA targets, F968-GC/R1401 [39]. For DGGE analysis of the fungal community, the DNA was amplified by a nested-PCR using specific primers for 18S rDNA targets, NS1f/FR1r for the first step and FF390f/FR1r-GC for the second step [40]. Amplification reactions were carried out using an iCycler™ thermal cycler (Bio-Rad Laboratories, Hercules, California, USA) under the following conditions: 94 °C for 4 min, followed by 35 cycles consisting of denaturing at 95 °C for 45 s, annealing at 55 °C (bacteria) or at 48° C (fungi) for 45 s, extension at 72° C for 45 s and a final extension step at 72 °C for 7 min. The DGGE analysis was carried out using an INGENY phorU-2 System (Ingeny International BV Goes, NL, USA). An amount of 500 ng of amplified DNA was loaded onto a 6% (w/v) polyacrylamide (acrylamide/bis-acrylamide 37.5:1) gel, containing a linear chemical gradient ranging from 50–65% denaturant for 16S rDNA (bacterial) amplicons or from 46–58% denaturant for 18S rDNA (fungal) amplicons (100% denaturant corresponds to 40% (v:v) deionized formamide plus 7 M urea). The electrophoresis was run in 1 × TAE buffer at 60 °C at a constant voltage of 80 V for 17 h. After the run, the gels were stained with SYBR® Gold Nucleic Acid Gel Stain (Thermo Fisher Scientific, Waltham, MA, USA). Gel images were digitally captured under UV light (λ = 302 nm) using the ChemiDoc Imaging System (Bio-Rad Laboratories).

2.5. Data Analysis

Biochemical data are mean values from three independent soil replicates (n = 3) and are expressed on an oven-dry weight basis (105 °C, 24 h). After testing for deviation from normality (Kolmogorov–Smirnov test) and homogeneity of within-group variances (Levene’s test), data were analyzed using standard analysis of variance (ANOVA) (SPSS v. 11.0, IBM, Armonk, New York, NY, USA). Bacterial and fungal CLPP data were analyzed by NMDS (Manhattan index) by means of PAST2 software [41], and the accuracy of the plots was determined by calculating a 2D stress value. In order to simplify the analysis, all the CLPP data were divided into different categories, according with Insam [42], and analyzed by two-way-ANOVA (treatment and time). DGGE banding patterns were analyzed by GelCompar® II software v 4.6 (Applied Maths, Sint-Martens-Latem, Belgium). Normalization of bands within and between gels was conducted by defining an active reference system. The number of bands (species richness) and their relative abundance (Shannon–Weiner and Simpson indices) within each DGGE profile were used as a proxy of richness and diversity of soil bacterial and fungal communities and calculated as described by Pastorelli et al. [43]. Bands with a minimum area below 1% were excluded from the calculations. For each DGGE, a binary matrix based on the position and presence/absence of bands in the different profiles was generated and imported into PAST2 software [41] for multivariate statistical analysis. NMDS, based on the Dice similarity coefficient, was performed to represent the similarity distance between each DGGE profile in a two-dimensional space. One-way analysis of similarity (ANOSIM) and permutational multivariate analysis of variance (PERMANOVA), based on Dice similarity coefficient and 9999 permutational tests, were performed in order to test whether differences in the assemblage grouping observed in NMDS plots were significant. Pairwise Pearson correlation and principal component analysis (PCA) were used to statistically process the entire dataset, including soil chemical, biochemical, molecular and CLPP data.

3. Results

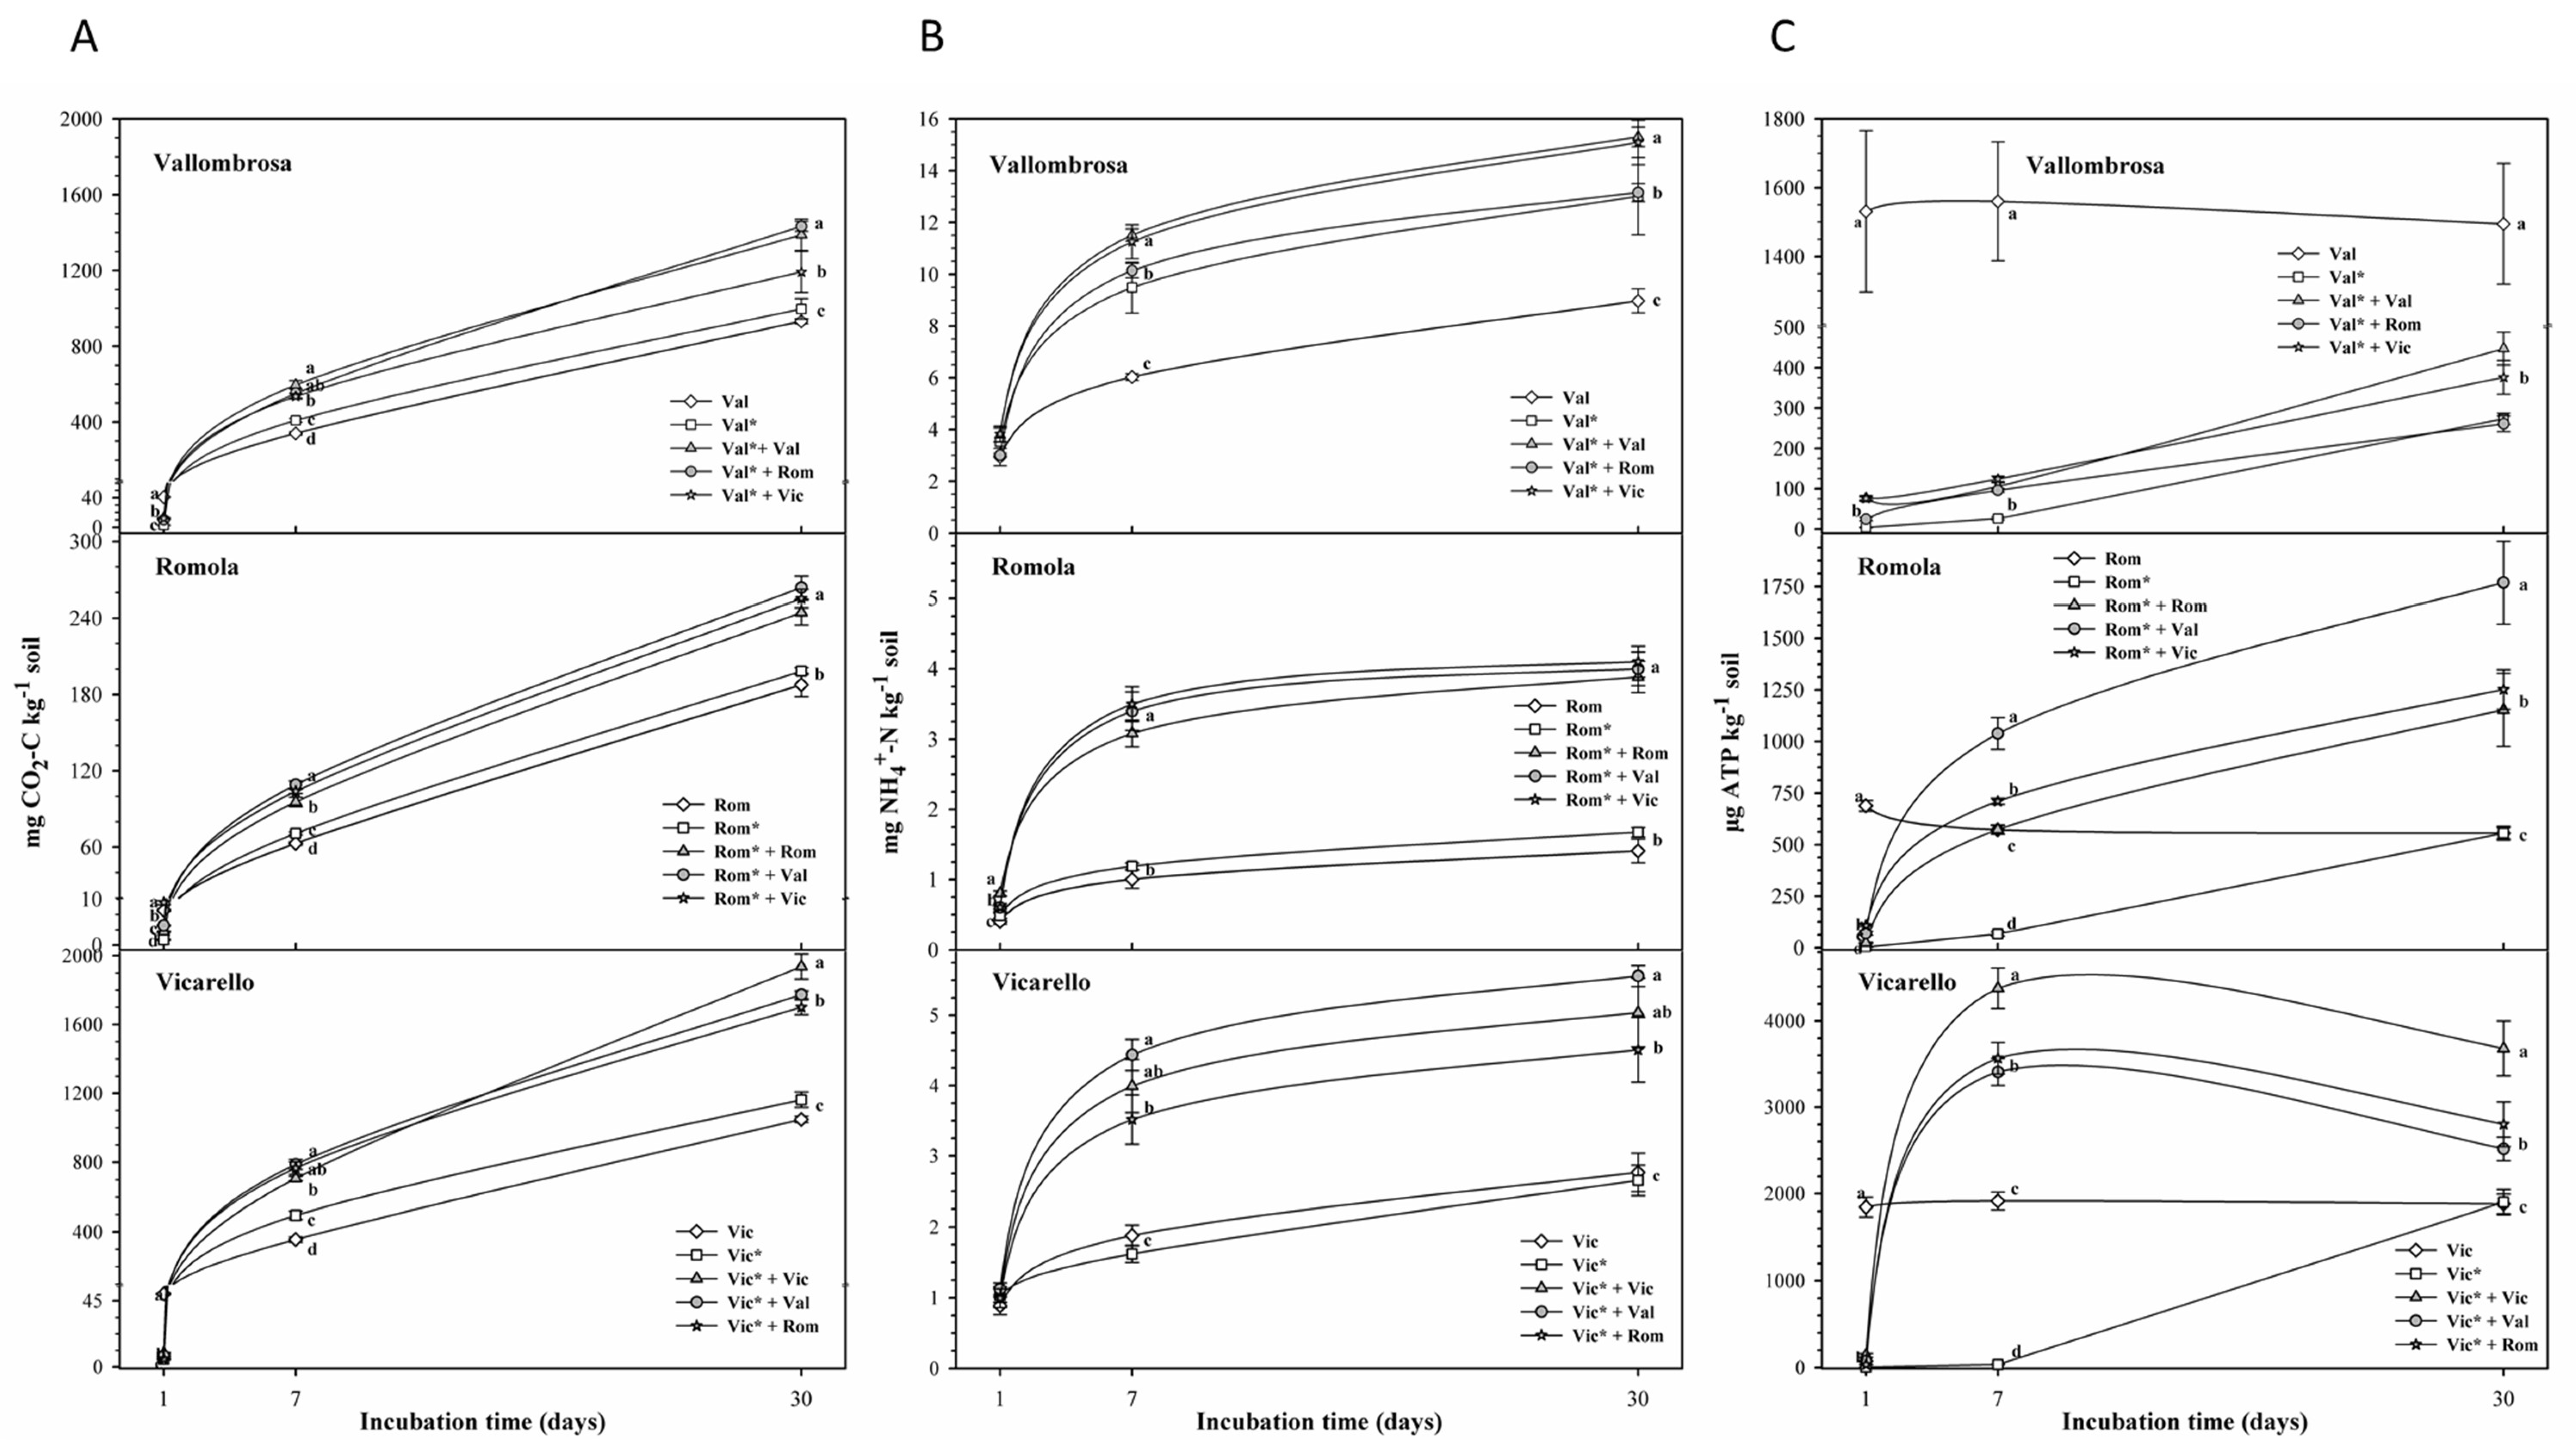
3.1. Soil Respiration, N Ammonification, ATP and Microbial Biomass

Heat-sterilization drastically reduced soil respiration; however, it recovered after reinoculation and incubation with trends similar in all treatments but different in values depending on the recipient soil and the inoculum source (Figure 1A). At the end of the incubation period, the Rom soil showed the lowest cumulative respiration values compared to Vic and Val soils.
The highest N ammonification values were observed in Val soils, whether reinoculated or not, compared to the control Val soil, with values which were up to three-fold those of the Rom and Vic reinoculated soils. Control soils, whether sterilized or not, showed similar ammonification values across the entire incubation period (Figure 1B). Autoclaving immediately reduced the soil ATP to undetectable concentrations in all sterilized soils (Val*, Rom*, Vic*), and values three- or two-fold lower than in the respective pristine soils were observed in Vic and Rom soils, respectively, after 7 days of incubation (Figure 1C). In contrast, in self- and cross-inoculated Val soils the ATP content remained significantly lower than the respective non-autoclaved and non-reinoculated soil over time. At the end of the incubation period the ATP content in all Val* and self- and cross-inoculated Val* soils remained significantly lower than Val soil, whereas Rom* and Vic* soils reached final values similar to those of the respective intact soils. Rom* and Vic* cross-inoculated soils remained significantly lower, whereas cross-inoculation increased the ATP concentrations to levels depending on the recipient soil type and inoculum source (Figure 1C).
The microbial biomass (dsDNA) values were almost zero in all the sterilized soils at day 1. Then, whereas Rom and Val soils showed increasing dsDNA values over time, Vic sterilized and reinoculated soils showed the highest values (up to 40–50 mg/kg in Vic*+Vic and Vic*+Val), just after 7 days, which slightly decreased at the end of incubation.
Interestingly, all the Val* soils (reinoculated or not), displayed lower values than the untreated control. In contrast, after 7 and 30 days the untreated soils of Rom and Vic showed significantly lower values than the sterilized and reinoculated soils (Figure S1).

3.2. Soil Enzymatic Activities

Soil hydrolytic activities showed different values and trends depending on the soil type, soil reinoculation and incubation times.

3.2.1. Enzymatic Activities in the Vallombrosa Soil

After sterilization, the enzymatic activities of Val soils were at undetectable levels, whereas all activities except β-glucosidase recovered immediately following reinoculation (Table 2). After 7 days of incubation, the alkaline phosphomonoesterase was still undetectable in the Val* soil, at significantly lower values in the Val*+Val and Val*+Rom soils, and at a higher level in the Val*+Vic (+167%) as compared to the untreated control soil. After 30 days, the alkaline phosphomonoesterase activity was significantly higher in all the sterilized and inoculated soils compared to the untreated control soil. After 7 days of incubation, the acid phosphomonoesterase activity displayed lower values in the Val* soil and significantly higher in the Val*+Val, Val*+Rom and Val*+Vic soils as compared to the control soil. On the other hand, it reached the same level of the control soil in all sterilized and reinoculated soils after 30 days of incubation.
The β-glucosidase activity showed higher levels in all sterilized and reinoculated soils after both 7 and 30 days of incubation as compared to the control soil (Table 2), with the highest values detected in Val*+Rom soil after 30 days. The protease and urease activities showed significantly lower values in all sterilized and inoculated Val* soils as compared to the control soil after both 7 and 30 days of incubation (Table 2).

3.2.2. Enzymatic Activities in the Romola Soil

Sterilized Rom* samples showed undetectable levels of hydrolytic activity after 1 day of incubation, whereas variable levels of enzymatic activity were detected in all Rom* reinoculated soils (Table 2). After 7 days of incubation, the alkaline phosphomonoesterase in the Rom* and Rom*+Val soils was significantly lower than untreated Rom. The Rom*+Vic soil showed significant higher values as compared to the control soil, whereas the Rom*+Rom soil showed similar results than the untreated Rom soil. After 30 days of incubation, the alkaline phosphomonoesterase activity was significantly higher in all the inoculated soils as compared to the control soils. The acid phosphomonoesterase activity was undetectable in Rom* soil after 7 days of incubation, at significantly lower values in the Rom*+Rom soil and at the same level of the control soil in the Rom*+Val and Rom*+Vic soils. After 30 days of incubation, the acid phosphomonoesterase activity in the Rom* and reinoculated Rom soils was lower than that detected in the Rom soil. The β-glucosidase activity was at the same level as in the control soils and in Rom*+Vic soil after both 7 and 30 days of incubation, whereas it was lower in the Rom*+Rom and Rom*+Val soils as compared to the control soils. The protease and urease activities were at significantly lower levels in all sterilized and reinoculated Rom* soils as compared to the control soil after both 7 and 30 days of incubation.

3.2.3. Enzymatic Activities in the Vicarello Soil

No hydrolytic activities were found in Vic* and Vic*+Rom treatments after 1 day of incubation (Table 2), whereas detectable enzymatic activities were: the alkaline and acid phosphomonoesterase and β-glucosidase activities detected in the Vic*+Vic soil and acid phosphomonoesterase detected in the Vic*+Val soil. After 7 days of incubation, the alkaline phosphomonoesterase was still not detectable in the Vic* soil, whereas it was found in the Vic*+Vic, Vic*+Val* and Vic+Rom soils at similar levels as in Vic soil. After 30 days of incubation, the alkaline phosphomonoesterase was detected in all the samples. Remarkably, Vic*, Vic*+Vic and Vic*+Rom soils showed significantly lower values than in the control soil, whereas in the Vic*+Val* soils it was at similar levels as after 7 days. The acid phosphomonoesterase was detected at significantly lower values in all the sterilized and reinoculated soils after both 7 and 30 days of incubation, with the exception of the Vic*+Val, which showed significantly higher values as compared to the control soil (Table 2). The β-glucosidase activity was significantly lower in all the sterilized and inoculated soils after 7 and 30 days of incubation. The protease activity was not detectable after 7 days of incubation and was at significantly lower levels in all sterilized and inoculated Vic* soils as compared to Vic soil after both 7 and 30 days of incubation. Urease activity was not detectable after 7 days of incubation in the Vic* soil, whereas it was detected at higher levels in the inoculated soils. After 30 days of incubation, it was at higher levels in all sterilized soils as compared to the non-sterilized Vic soil, with the exception of the Vic*+Vic soil, which displayed the same value as the control soil.

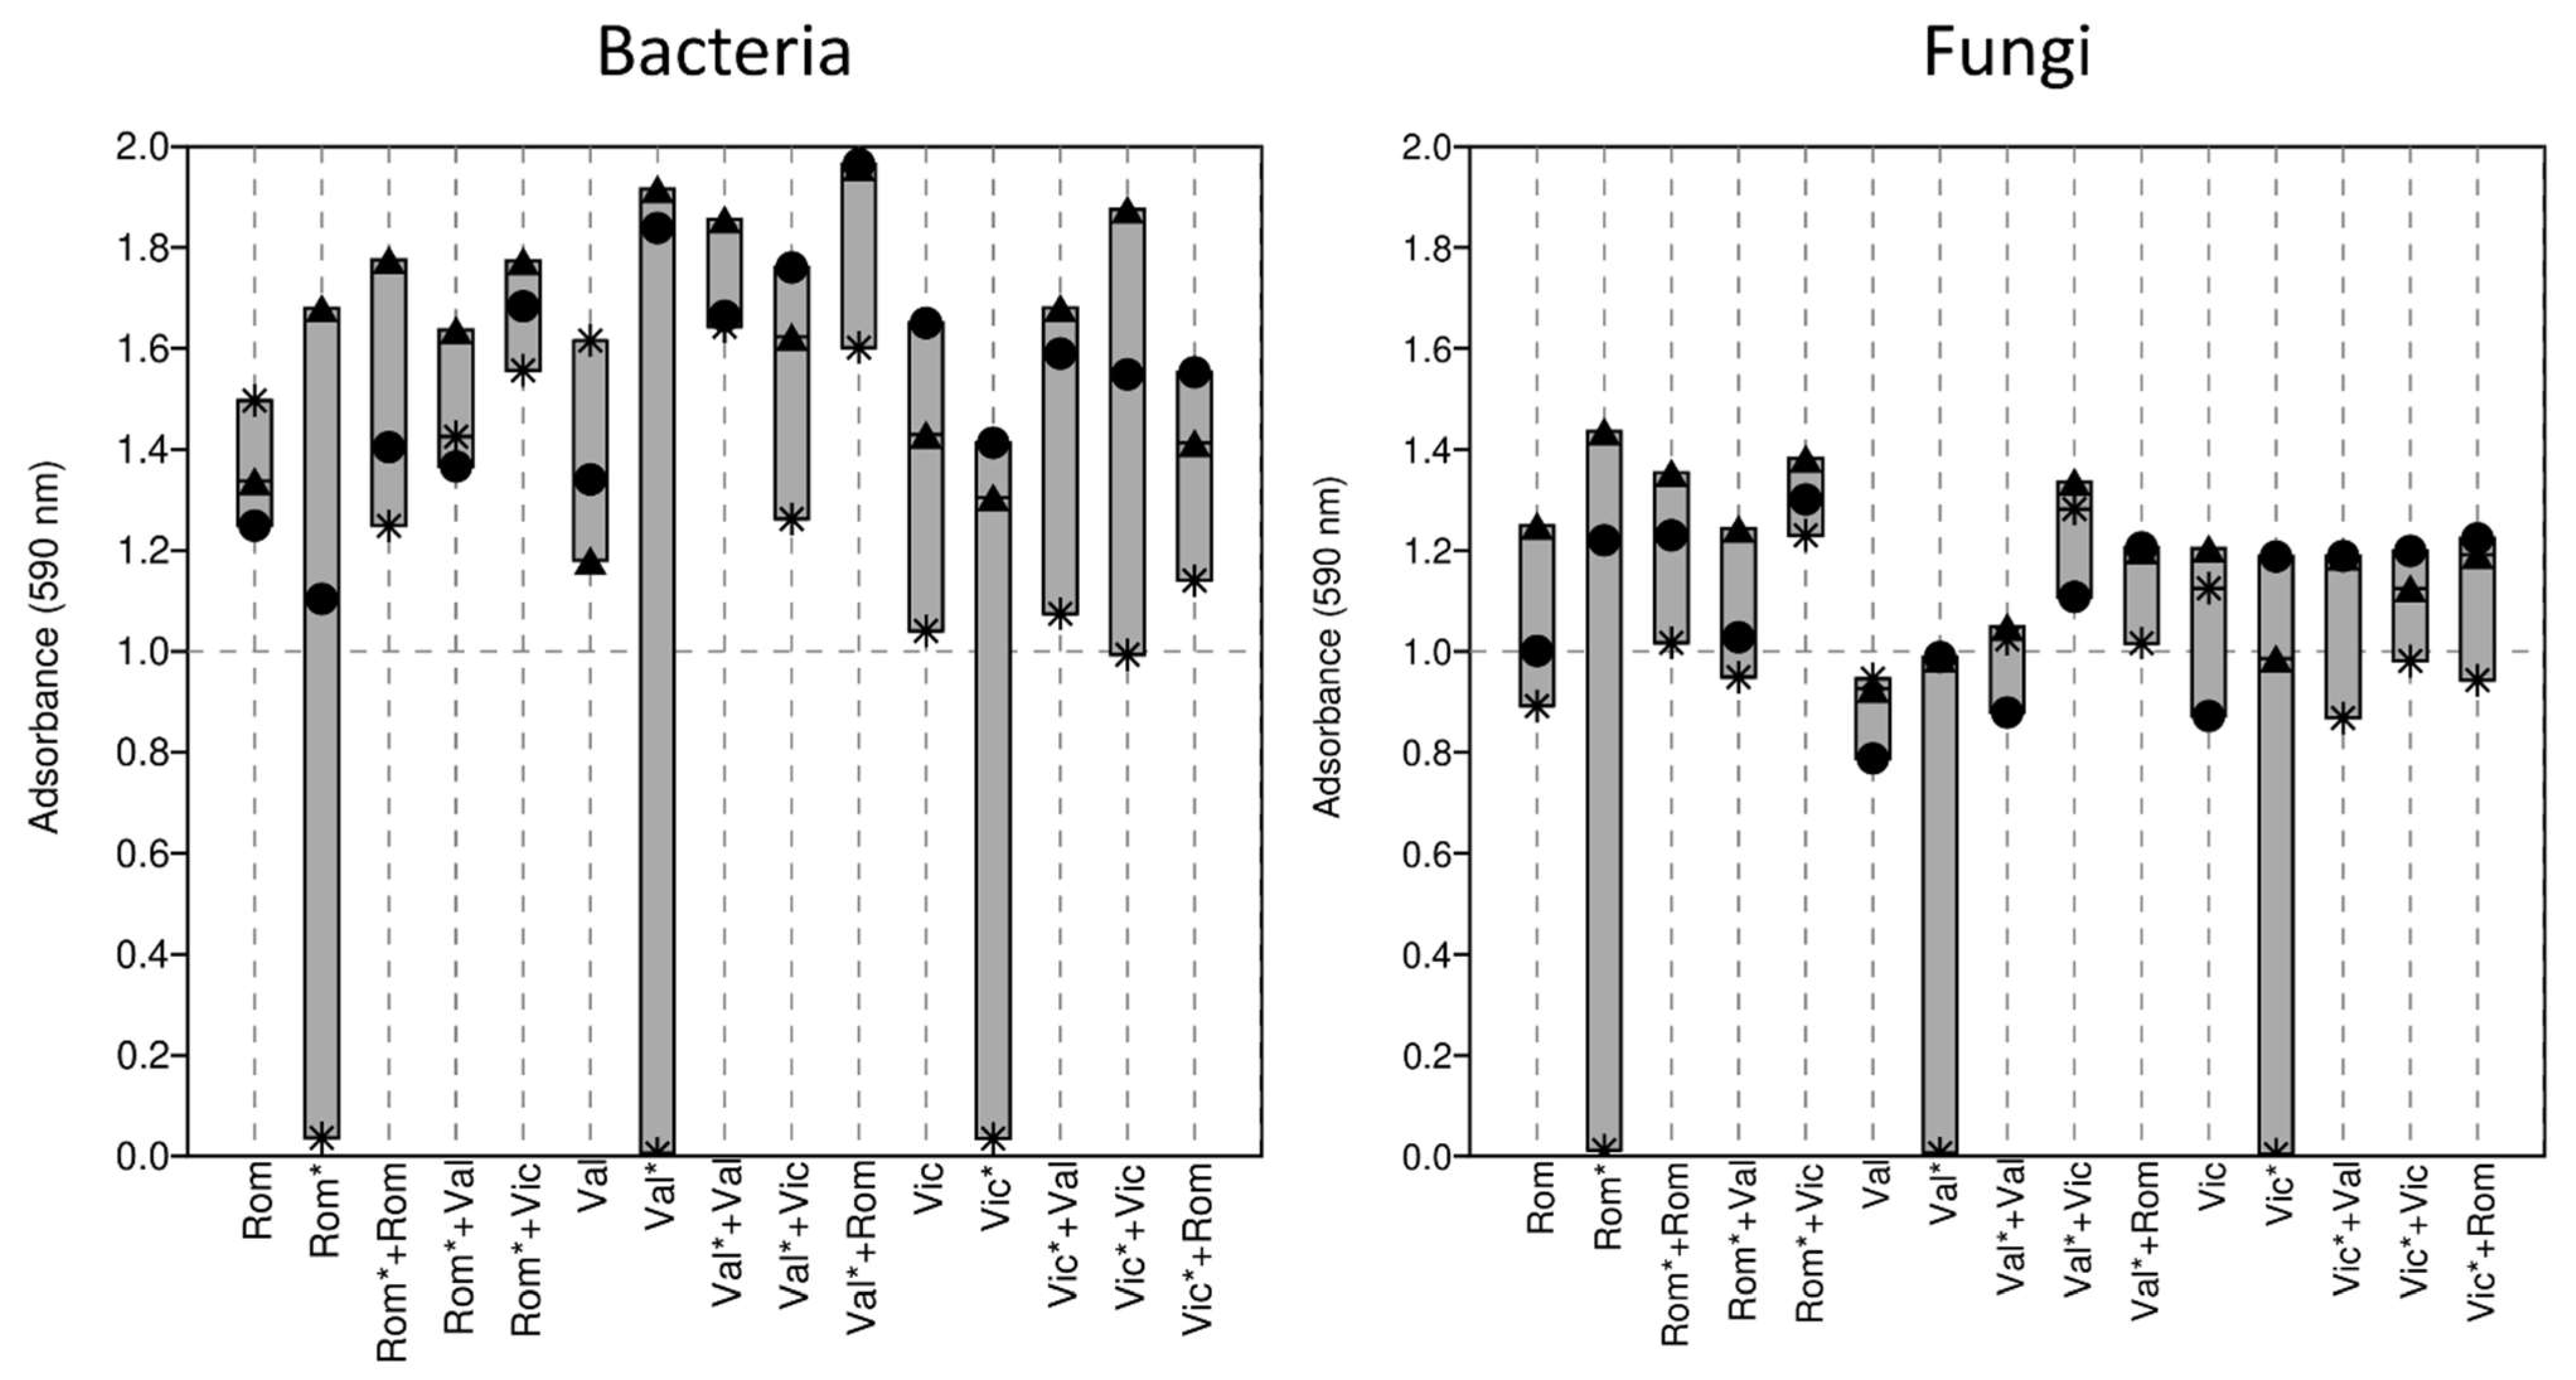
3.3. Soil Community-Level Physiological Profile

The CLPP of the three soils showed different patterns and trends depending on the soil, self- or cross-reinoculation and the incubation time. CLPP data for bacteria and fungi were reported as AWCD (Figure 2) as well as grouped according to their substrate utilizations (Table 3 and Table 4). Overall, the CLPP analysis showed that after 7 days of incubation, the sterilized and reinoculated soils had higher AWCD values than the respective control soils. In general, Val soils displayed the greater catabolic activity, and the highest bacterial AWCD values were obtained in Val*+Rom soils after 7 and 30 days.
Remarkably, the sterilized Val* soils displayed similar values. On the other hand, fungal catabolic activity was less affected by treatments than bacteria and showed more constant values over time across the different soils. Interestingly, at the end of the incubation time, the fungal AWCD values were higher in sterilized soils than in pristine untreated soil. In contrast, bacterial AWCD values of sterilized soils were lower than the untreated control, except for Val*, which exhibited higher values.

3.3.1. Community-Level Physiological Profile of the Vallombrosa Soil

Soon after the heat sterilization (day 1), both bacterial and fungal AWCD values were almost zero in Val* soils. However, with elapsing time they returned to levels comparable to or higher than those of the non-autoclaved pristine soil (Figure 2). In Val*+Val and Val*+Rom soils, the AWCD values of both bacterial and fungal communities followed similar trends and were not significantly different from those of the Val soil (p < 0.05, see Supplementary Materials). In contrast, for the Val*+Vic soil the bacterial AWCD was significantly lower and the fungal AWCD significantly higher as compared to the control soil. Notably, after 7 days of incubation, the AWCD values for bacterial communities were higher in the sterilized and all reinoculated soils than in the Val soil, whereas the AWCD values of the fungal communities were significantly higher than the control soil only in the Val*+Vic treatment. After 30 days of incubation, the AWCD values were significantly higher in the sterilized and all reinoculated soils than the control soil for both the bacterial and fungal communities.
Grouping the results as substrate utilization highlighted the increase of the bacterial catabolic activity of Val* soil after 7 and 30 days compared to its initial value. Interestingly, at the end of the incubation period, Val* showed the highest catabolic activity with amines and carbohydrate substrates (Table 3). On the other hand, Val*+Rom showed the highest values with amino acids, carboxylic acids and phenolic compounds, whereas Val*+Vic showed the highest catabolic activity on polymer substrates.
Regarding the fungal substrate utilization (Table 4), results showed relevant catabolic activity in Val* since the beginning of the experiment, with values similar to the other samples. At day 1, Val*+Rom samples displayed the highest values of catabolic potential on all the substrates compared to the other samples. On the other hand, at day 30 Val*+Vic showed the highest values on all the substrates except for nucleotides, which displayed the highest value in Val*+Val soils.

3.3.2. Community-Level Physiological Profile of the Romola Soil

As already observed in Val soils, autoclaving soils rapidly annihilated microbial physiological activity, especially in bacterial community (Figure 2). However, after 7 and 30 days of incubation the sterilized soils returned to values comparable to the non-sterile soils, with the AWCD values of Rom* being significantly higher than those of the Rom soil after 7 days and lower after 30 days both for bacteria and fungi. After 7 days of incubation, the AWCD values for bacterial communities were significantly higher in all sterilized and reinoculated soils compared to the pristine control soil (Rom), whereas the AWCD values of the fungal communities were significantly lower than the control soil only in Rom*+Val soil. After 30 days of incubation, the bacterial AWCD values of Rom*+Rom and Rom*+Val were similar to those of Rom soil, whereas Rom*+Vic showed significantly higher readings. The AWCD values of fungal communities after 30 days of incubation were significantly higher for the Rom*+Rom and Rom*+Vic soils as compared to that of the Rom soil.
The substrate utilization of Romola soils highlighted the higher values of the bacterial catabolic activity of the Rom*+Vic soil after 30 days compared to the other soils. Interestingly, at the beginning of the incubation period, Rom*+Vic showed the highest catabolic activity with all the substrates, except for carboxylic acids and phenolic compounds, which were higher in Rom soil (Table 3). As observed with Val soils, after 7 and 30 days, the sterilized Rom* samples showed values comparable with the untreated and reinoculated soils. Regarding the fungal substrate utilization (Table 4), results confirmed Rom*+Vic as the soils with the highest catabolic values at the beginning of the experiment (day1) with all the substrates except for nucleotides. Moreover, after 30 days, they also displayed the highest values in all the substrate categories except for amines and nucleotides.

3.3.3. Community-Level Physiological Profile of the Vicarello Soil

Once again, significant differences were found in the AWCD values of bacterial communities between Vic and Vic* soils, whereas those of the fungal communities of sterilized and inoculated soils showed significantly lower AWCD values than Vic soil (Figure 2). After 7 days of incubation, the AWCD values for bacterial communities were significantly lower in Vic* and significantly higher in the Vic*+Val and Vic*+Vic than in Vic treatments, whereas no significant differences were found in the AWCD values of the soil fungal communities. After 30 days of incubation, the AWCD values of the bacterial communities were significantly lower in the Vic* soil as compared to the other treatments, whereas the AWCD of fungal communities reached values significantly higher in the sterilized and all reinoculated soils as compared to Vic.
The bacterial substrate utilization of Vic soils highlighted the increase of the bacterial catabolic activity of phenolic compounds and polymers in Vic*+Vic. Sterilized Vic* after 7 and 30 days showed values similar to the untreated control and the inoculated soils. Overall, there were no significant differences among all the treatments with Vic soils. On the other hand, at day 1 the fungal catabolic activity showed the highest values in the untreated control Vic with all the substrates except for amines and nucleotides. The sterilized Vic* soil showed the highest values with amines, amino acid and carbohydrates substrates whereas Vic*+Rom provided the highest catabolic values after 30 days.

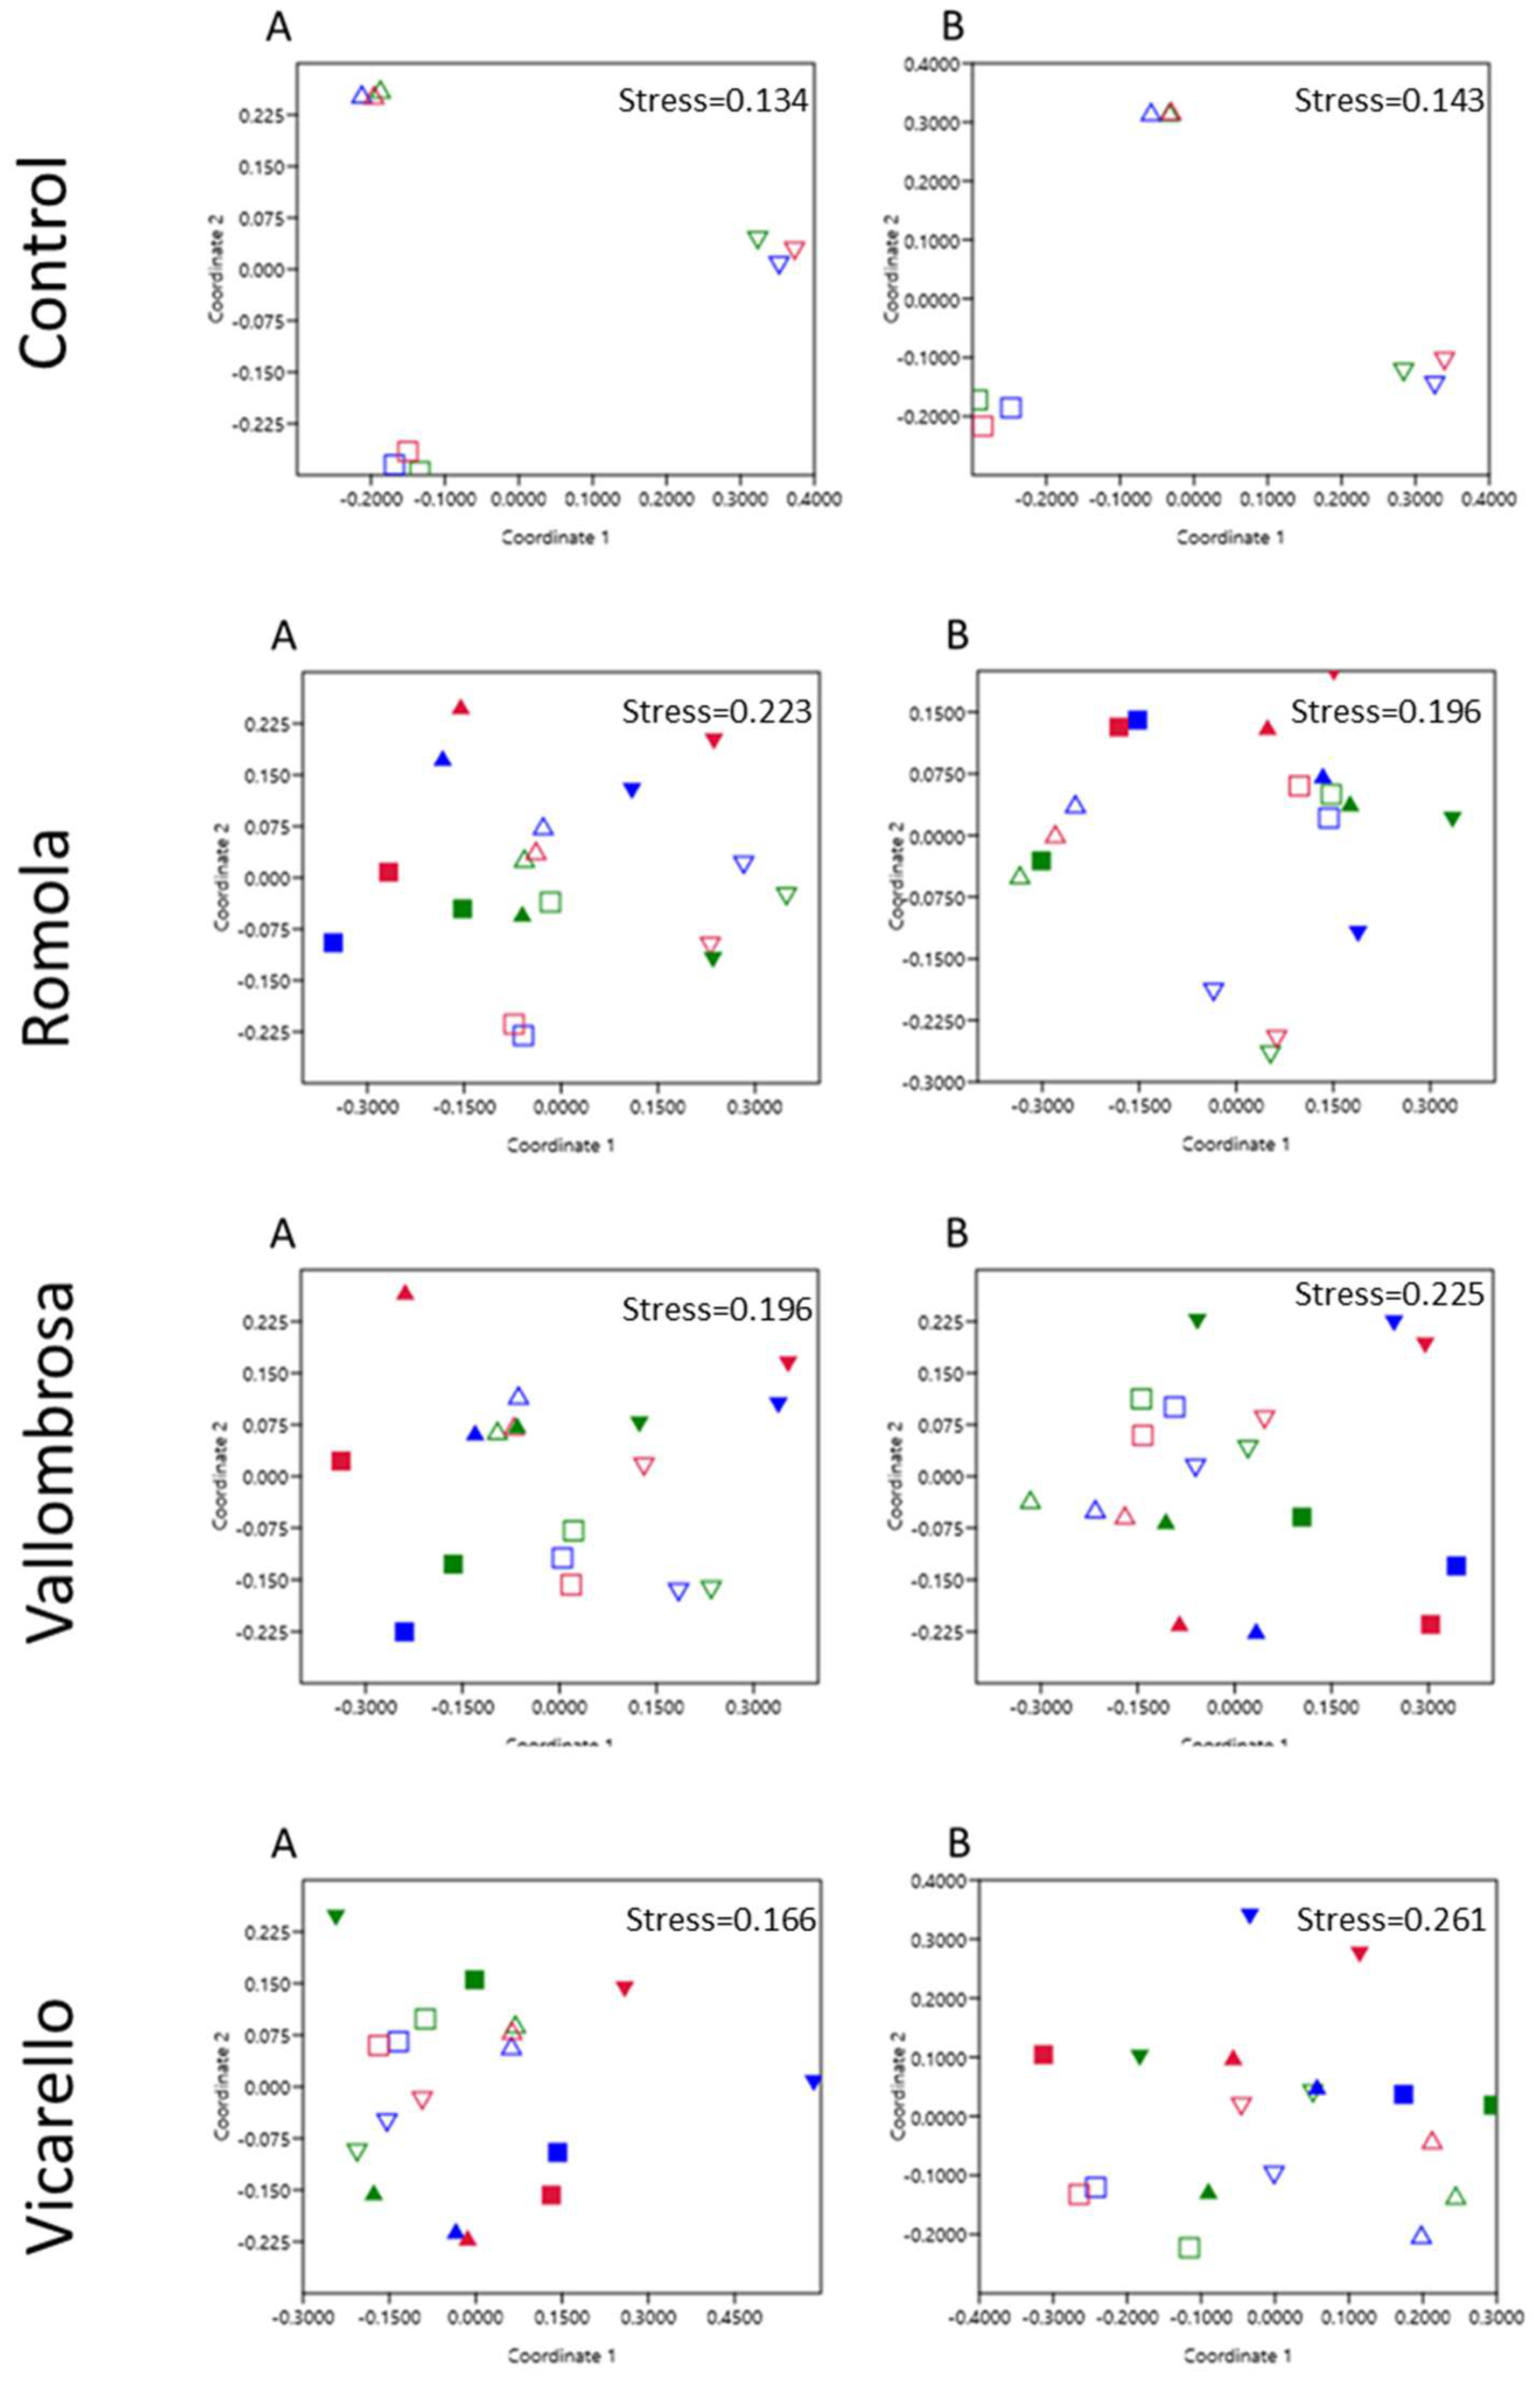
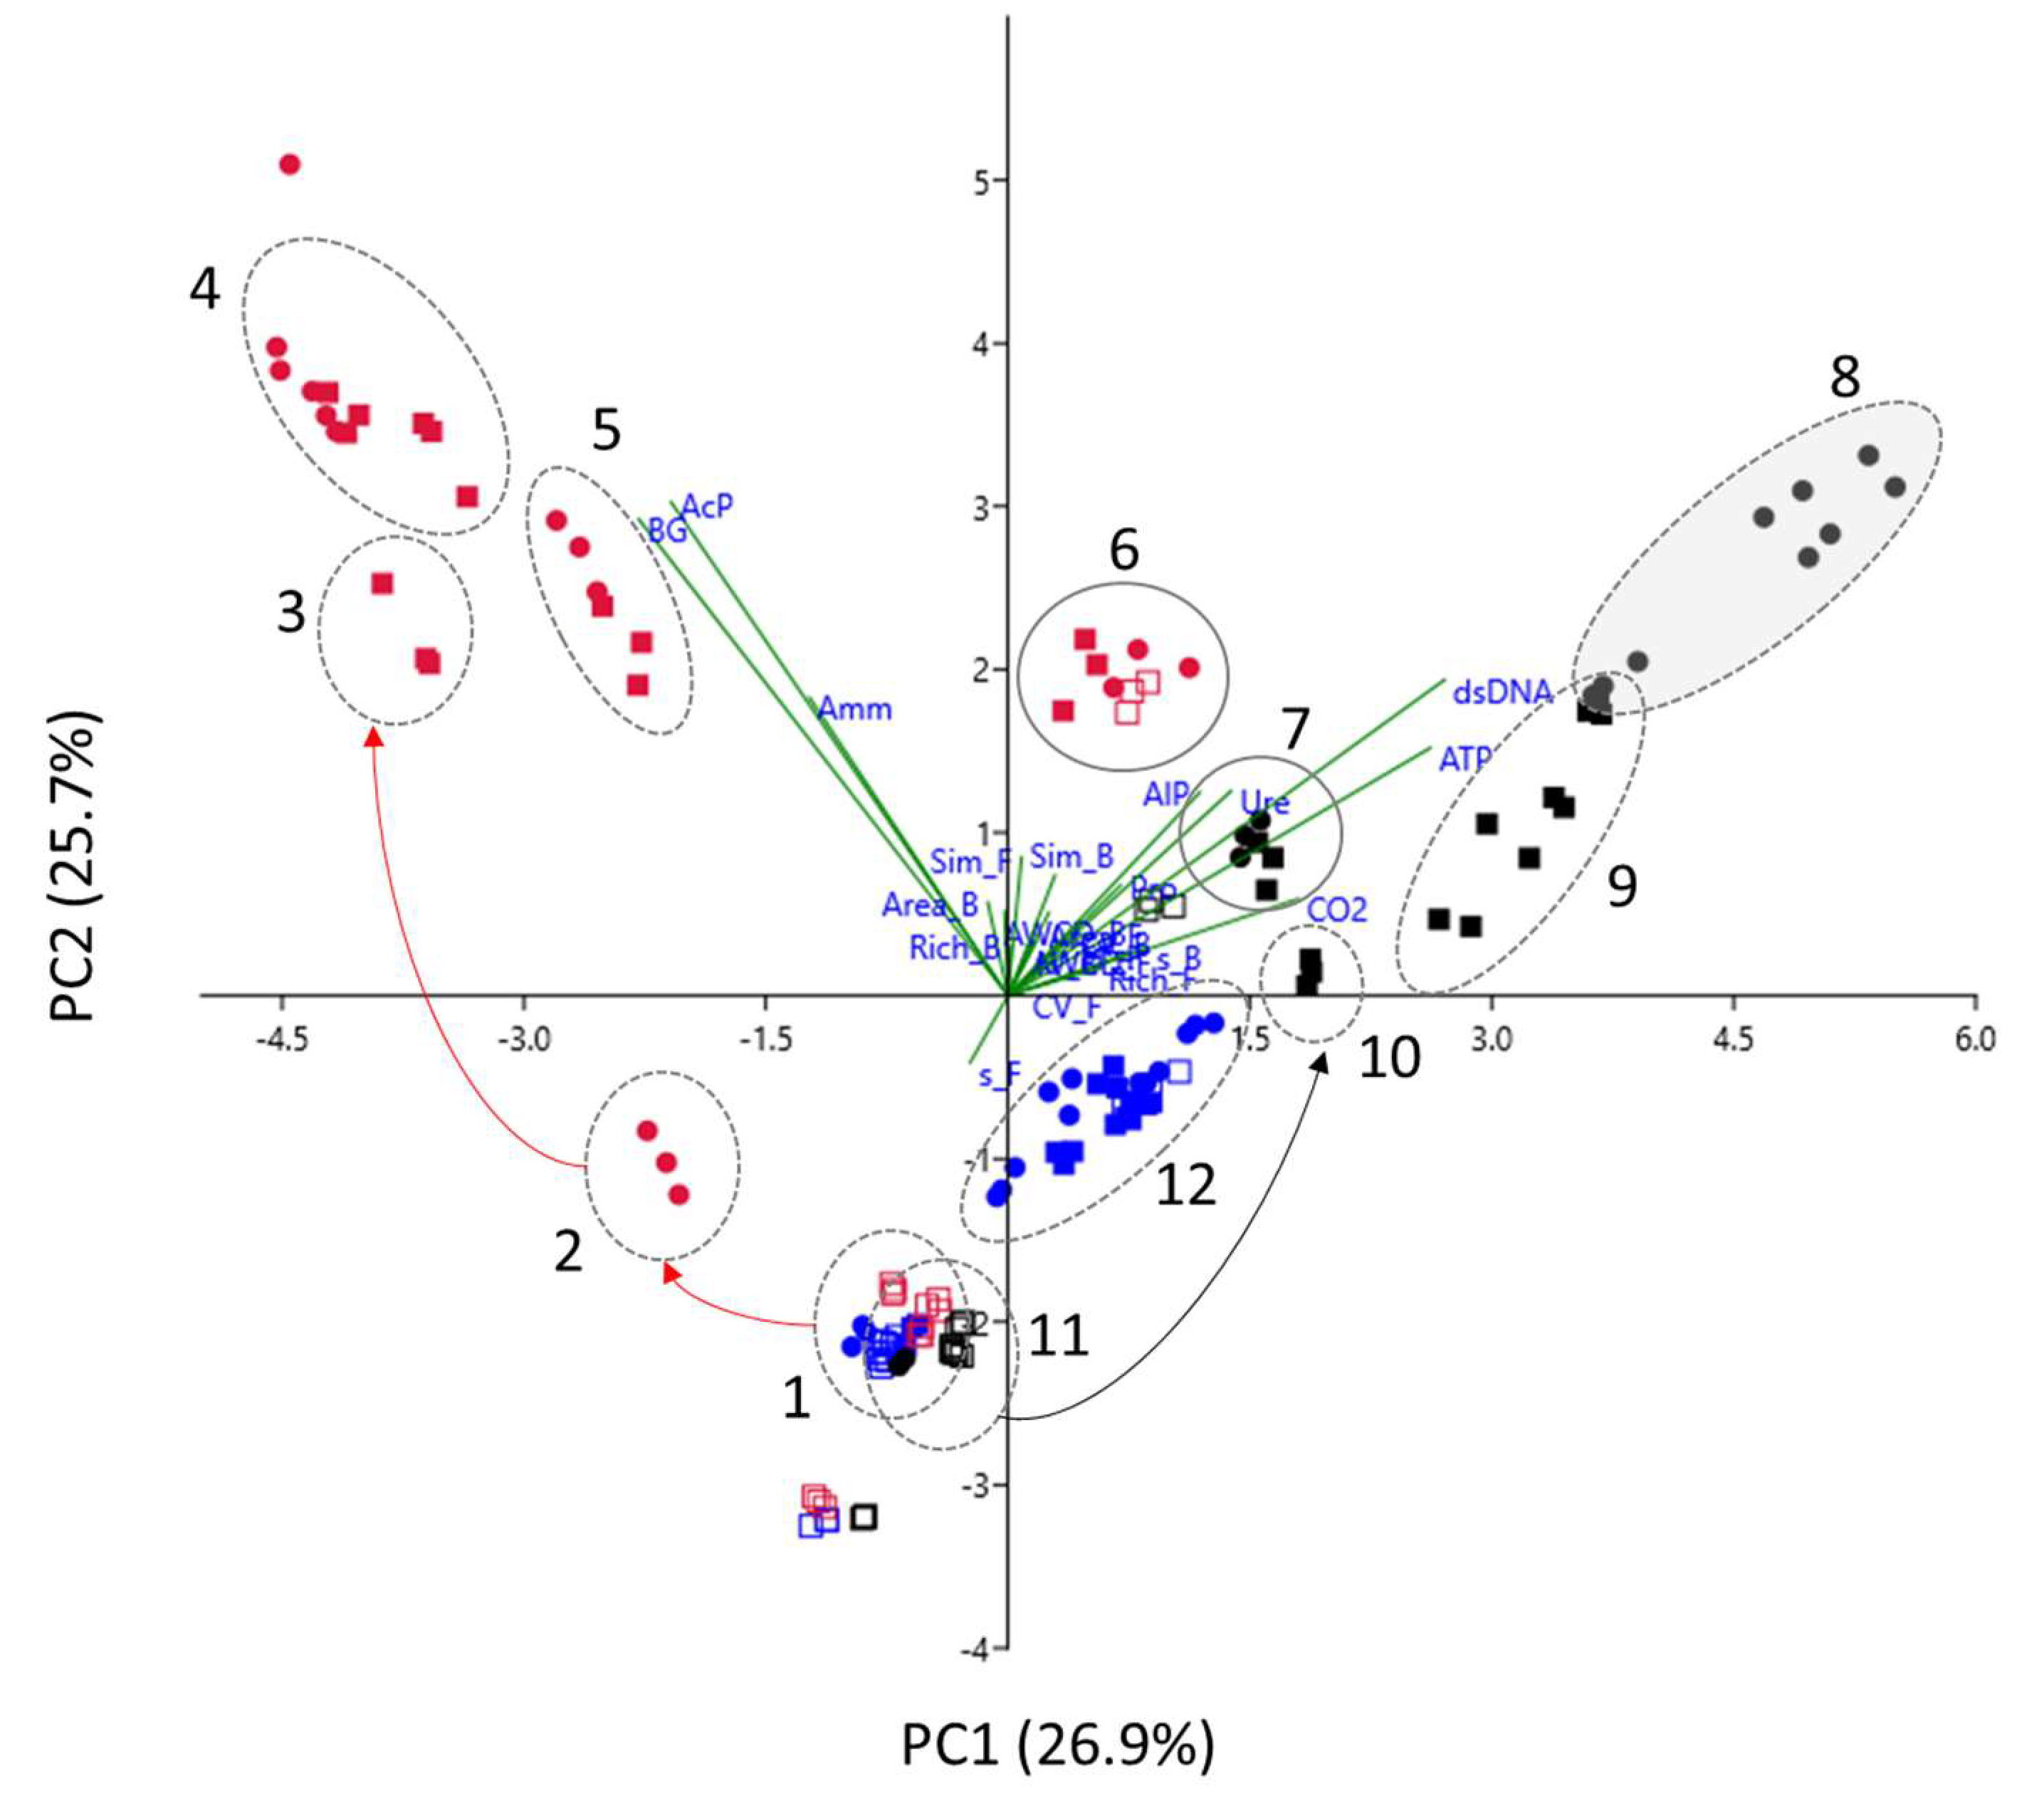
3.3.4. Multivariate Analysis of CLPP Data

The multivariate analysis (NMDS) performed by means of the Manhattan distance of different substrate pattern consumption is reported in Figure 3.
Looking at the bacterial communities in Romola, as expected at the beginning, all the sterilized soils were grouped separately from the non-sterile soils. After 7 days, the different soil groups clustered separately, with Rom*+Val very close to Rom* soils. After 30 days, all the soils grouped together again, regardless of the different inocula, except for Rom*+Vic, which clustered separately. Rom*+Val was the most similar to the control Rom treatment. On the other hand, the AWCD values of the fungal community in sterilized Romola soils were similar at the beginning of the experiment and after 30 days but not after 7 days, when they changed completely. Overall, after 7 days most of the inoculated soils were more similar to autoclaved samples than to the Rom-inoculated soils, especially Rom*+Rom. Interestingly, autoclaved soils clustered very close to Rom*+Rom. At the end of the incubation, such differences were confirmed for all the samples except for sterile control soils and with Rom*+Val as the closest group to Rom control soils.
Overall, bacterial CLPP data from Vallombrosa soils were much more similar to each other than in Romola. After 1 day of incubation, both the sterile soils and all the reinoculated soils except for Val*+Vic clustered together, whereas the untreated and sterile controls clustered separately. After 7 days, all the inoculated soils clustered together, except for Val*+Val, whereas the untreated Val soils clustered separately again. Val* displayed similar results to Val*+Rom and Val*+Vic. After 30 days of incubation, Val* soils and all the inoculated soils clustered together, whereas the Val control clustered separately. The fungal CLPP results showed that after 1 day of incubation the sterilized soils clustered separately from all the other samples. More specifically, the Val* soils clustered together with Val*+Val samples and close to Val*+Rom, whereas Val*+Vic and the untreated Val soils clustered separately. Conversely, after 30 days, all the samples were grouped in a unique wide cluster, showing a high variability also among replicates.
After 1 day of incubation, the bacterial CLPP data showed that Vicarello samples were highly distinct after 7 and 30 days (Figure 3), and sterile soils clustered separately. After 7 days, Vic*+Val and Vic*+Vic exhibited the most relevant differences compared to the other samples, which clustered together, including the controls. However, after 30 days all the samples seemed to be displayed into the same cluster, except for the Vic soils, which grouped separately.
Fungal CLPP values, in contrast, were much more variable: at the beginning of the experiment all the sterilized soils formed a separate cluster on the left, whereas the untreated Vic soils clustered with Vic*+Rom. After 7 days, all the inoculated soils clustered together, whereas both sterile and non-sterile controls clustered separately. Then, after 30 days all the soil groups seemed to cluster separately, except for the sterile soil which was very similar to Vic*+Vic soils.

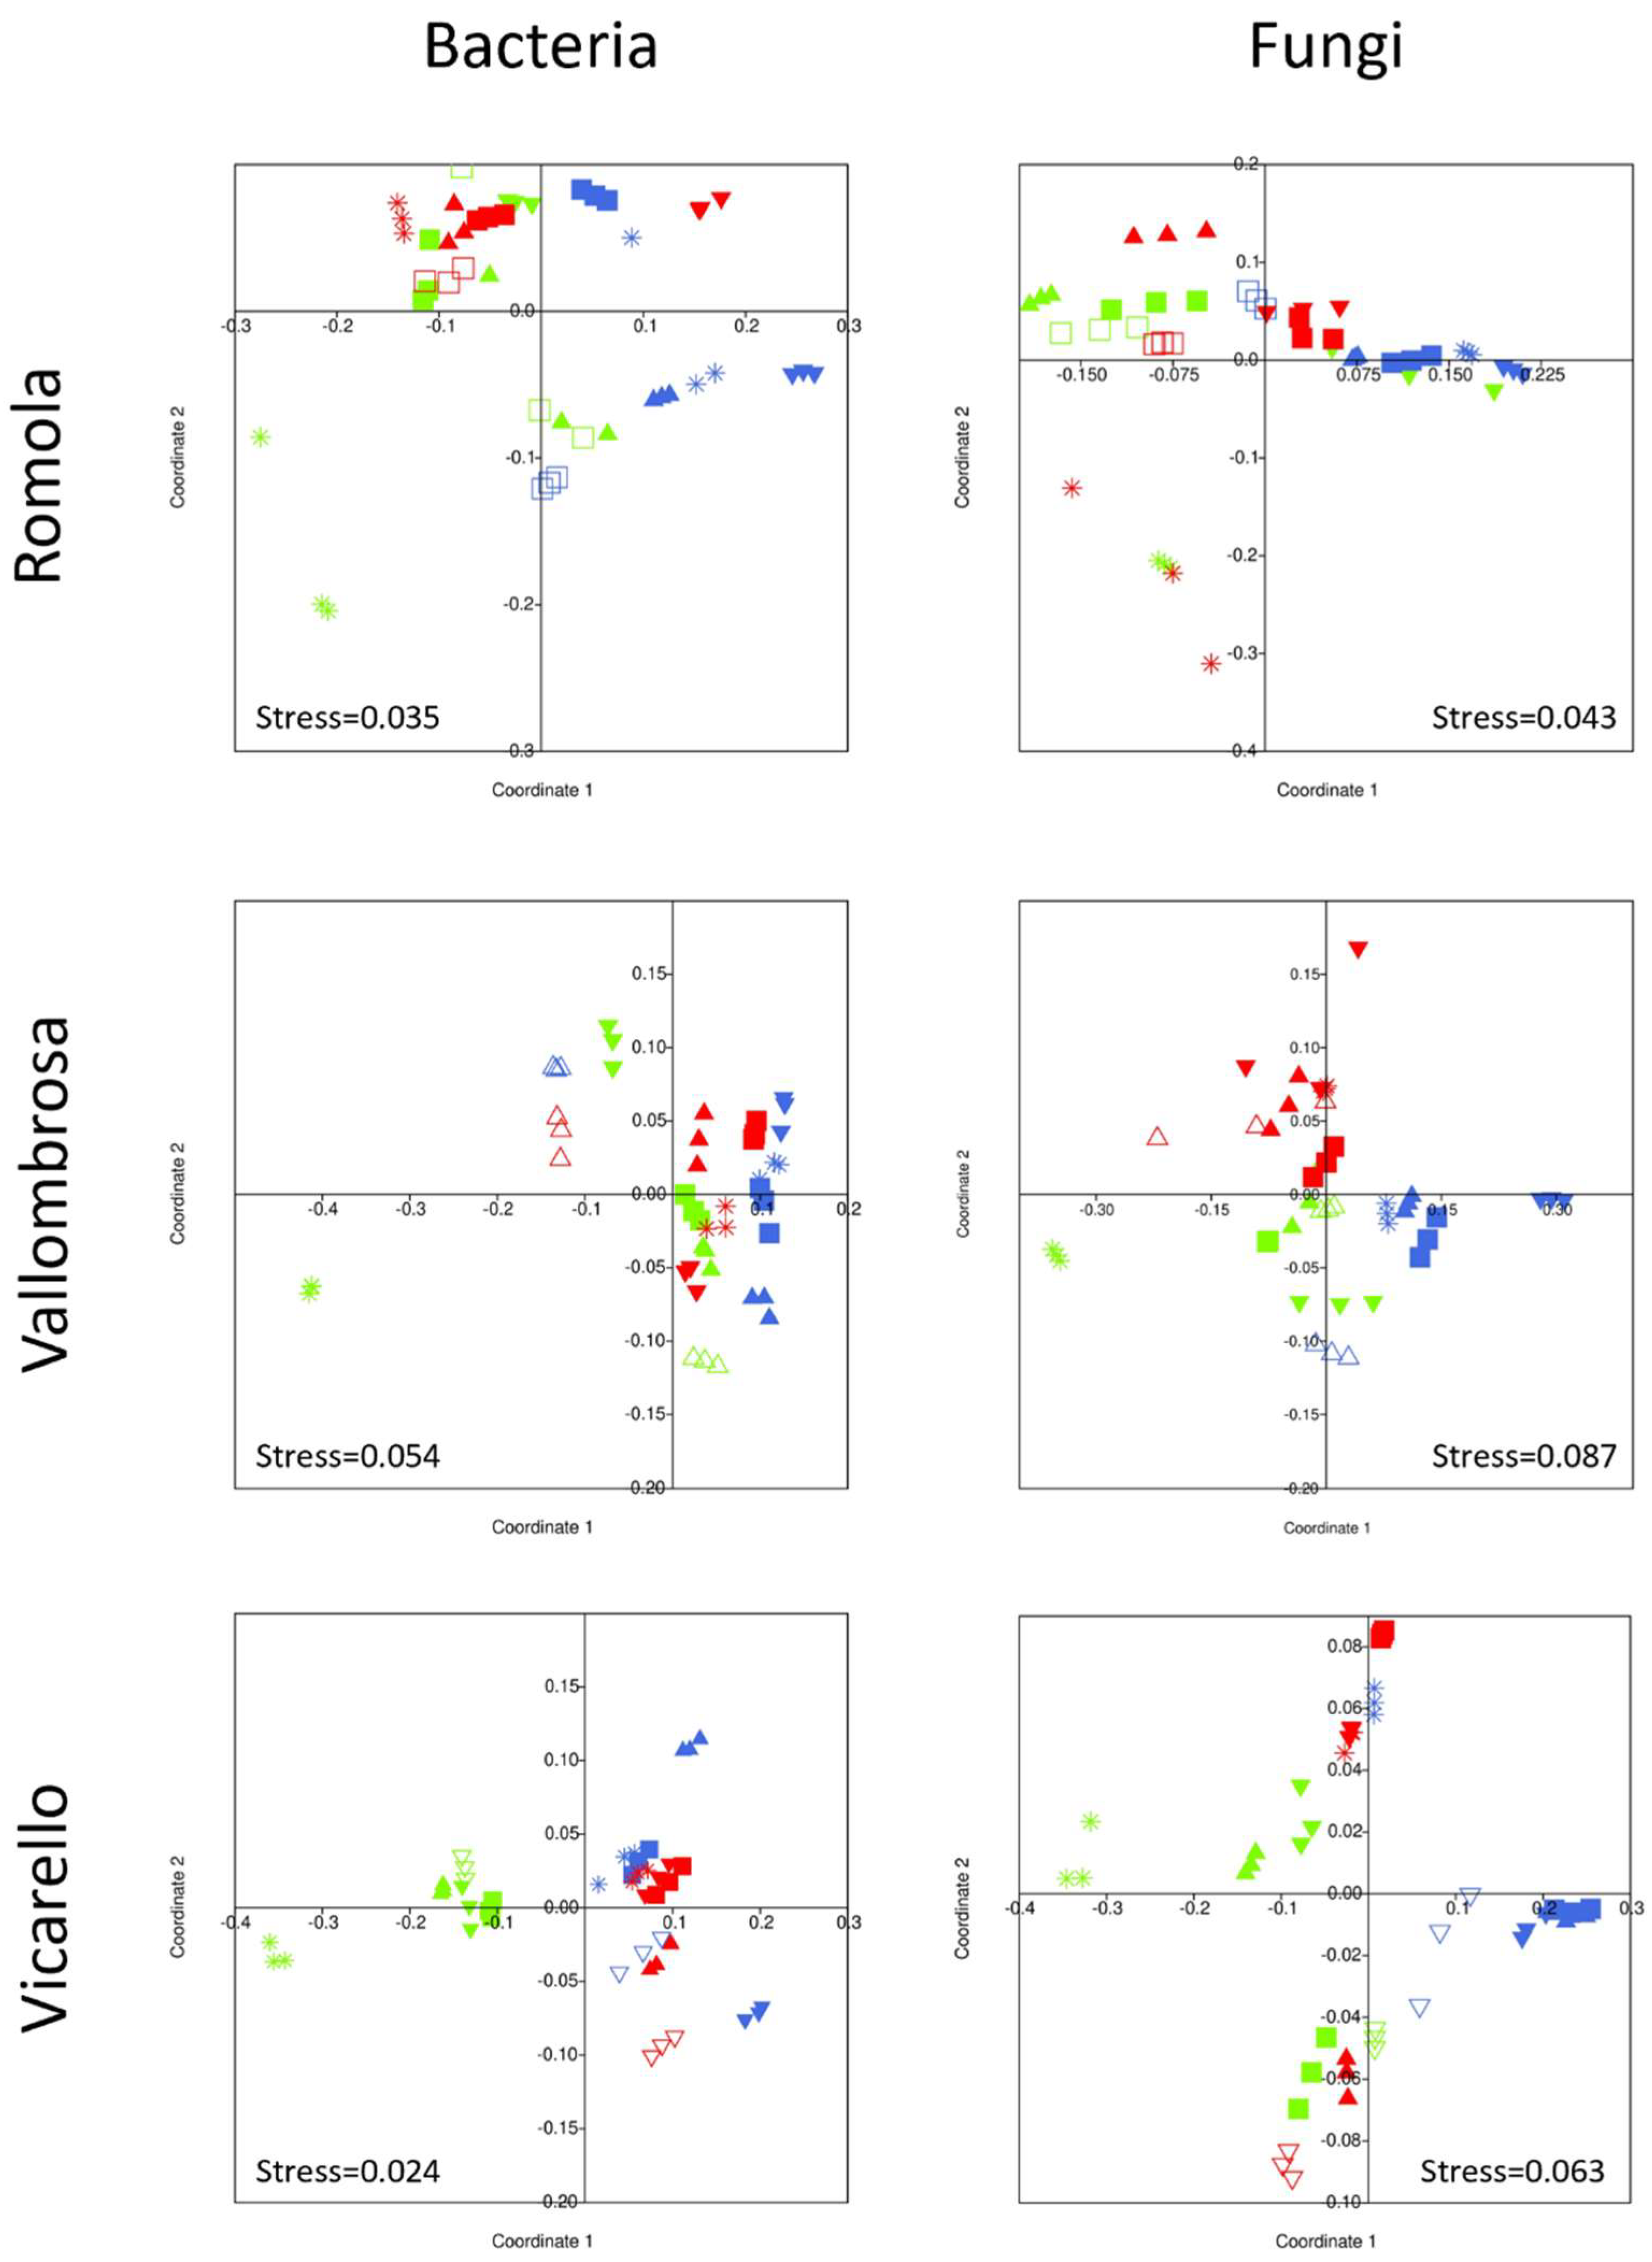
3.4. Bacterial and Fungal Community Structure

The PCR amplifications of bacterial 16S and fungal 18S rRNA genes showed a good reproducibility for all soils. Autoclaving completely degraded nucleic acids, as after one day of incubation only one Rom* sterilized non-inoculated soil replicate showed a faint 16S rDNA amplification signal, but no amplification signal was obtained for 18S rDNA. For sterilized non-inoculated soils incubated for 7 and 30 days, PCR amplification of bacterial 16S rDNA was observed in one replicate of the Rom* soil and in all three replicates of Vic* (after 30 days), whereas PCR amplification of fungal 18S rDNA was observed only for one replicate of Vic* autoclaved soil (after 30 days) (Figure S2).
The bacterial DGGE profiles of the control soils showed a greater complexity than those of the fungal ones, and both bacterial and fungal communities of all control soils showed a high stability during the 30-day incubation period. The sterilized inoculated soils showed all distinct DGGE banding patterns with shifts in the number, distribution and intensity of the banding profiles, indicating the establishment of different microbial communities during the incubation period (Figure 4), and in sterilized inoculated soils, changes in the bacterial DGGE profiles were greater than those of fungal communities (Figure 4).
The NMDS analysis conducted on DGGE profiles of non-sterilized control soils showed that the composition of both bacterial and fungal communities from Val, Rom and Vic pristine soils displayed high similarity for the entire incubation period (Figure 4). Variation in bacterial and fungal community composition of control soils were significant, as revealed by both ANOSIM (R = 1, p < 0.01 for 16S-DGGE; R = 1, p < 0.01 for 18S-DGGE) and PERMANOVA (F = 26.27, p < 0.01 for 16S-DGGE; F = 10.86, p < 0.01 for 18S-DGGE) tests.
NMDS analysis conducted on sterilized self- and cross-reinoculated soils showed that at the beginning of the incubation period the composition of microbial communities was, in general, more similar to that of the pristine soil used for reinoculation than to the other soils. Successively, the composition of both bacterial and fungal communities of reinoculated soils evolved with time, although a broad overlapping grouping could be highlighted depending on the soil used for reinoculation (Figure 4). In all cases, ANOSIM and PERMANOVA analysis confirmed statistically significant evidence in NMDS cluster patterns with R values ranging between 0.433 and 0.955 (p < 0.001) and F values ranging between 3.261 and 9.846 (p < 0.001), respectively.

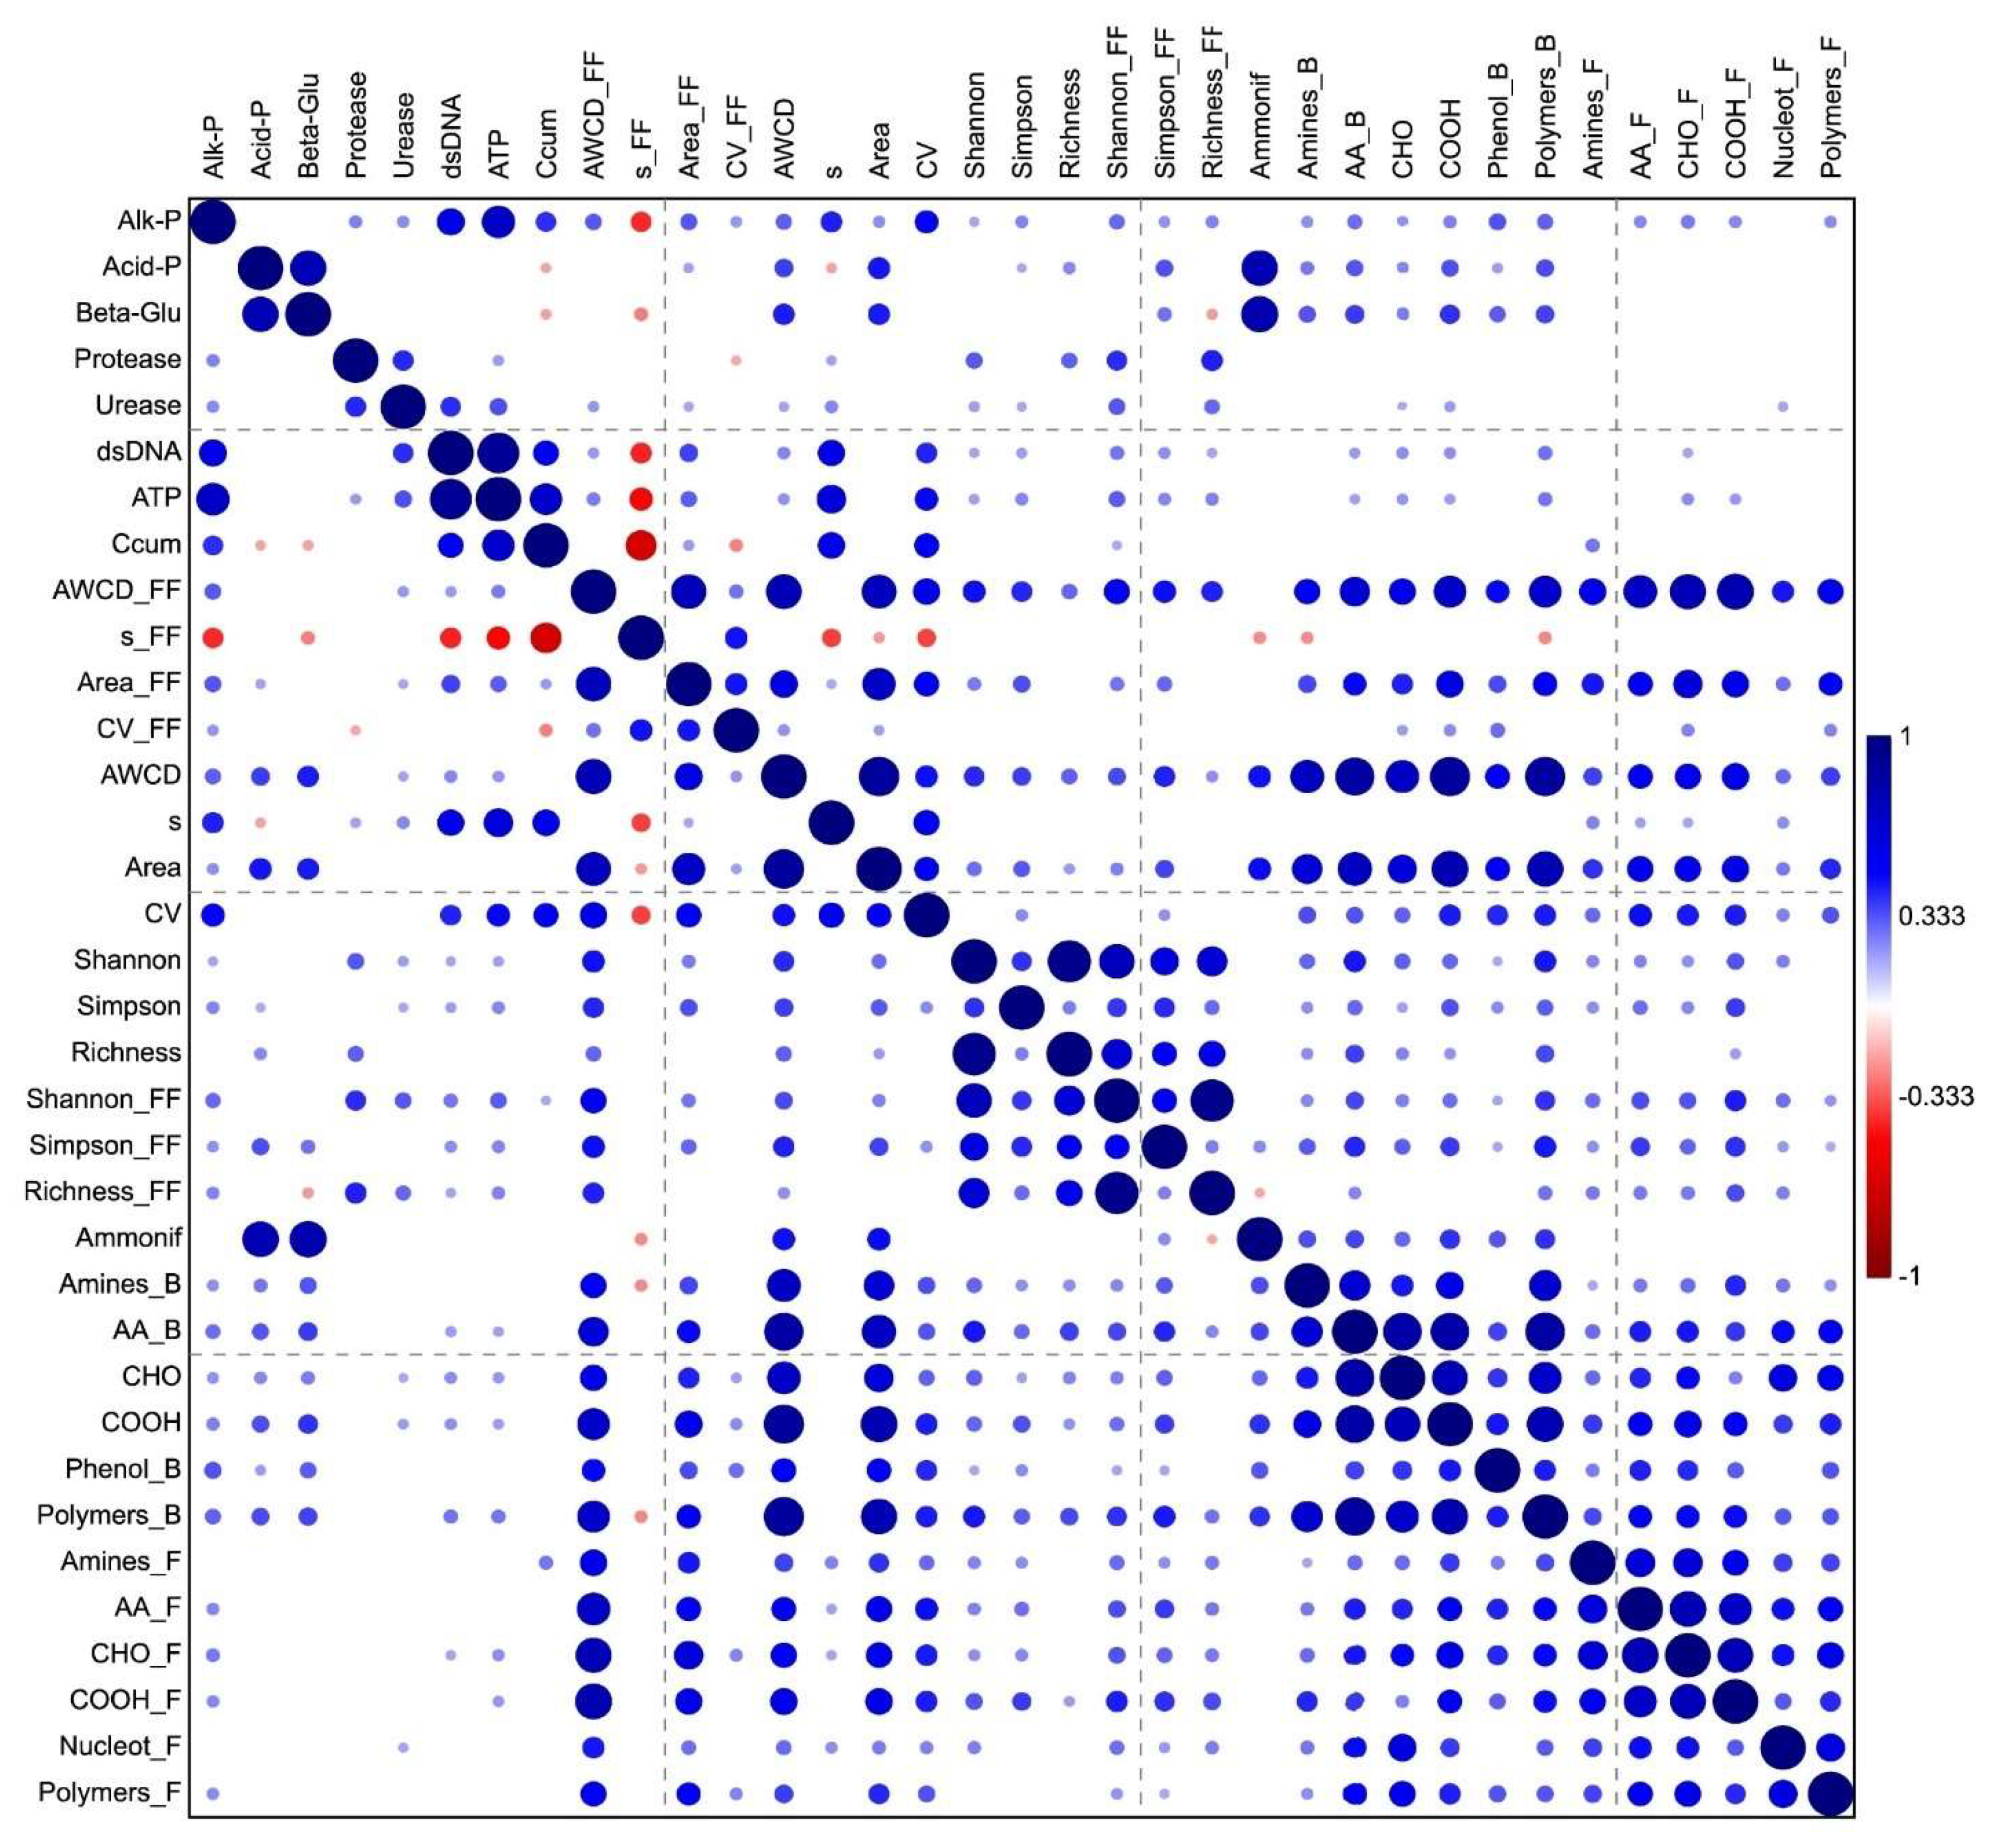
3.5. Linking Enzyme, Biochemical and Metabolic Data

In order to better relate the enzymatic, biochemical, catabolic and molecular results, we performed a pairwise Pearson’s correlation analysis to measure the statistical relationship, or association, between the different functional variables. In Figure 5, the significant positive (blue) and negative (red) correlations were displayed (all the correlation and p-values are reported in Table S1). Most of the correlations were positive, except for fungal ‘s’ value (s_FF), indicating the time required to reach the asymptotic increase of the AWCD curve. It was negatively correlated to alkaline phosphatase, dsDNA, ATP and cumulative respiration (Ccum) and with the kinetic parameters of bacterial catabolic activity ‘s_B’ and CV_B. Alkaline phosphatase is positively correlated to most of the catabolic activity provided by both bacteria and fungi. However, acid phosphatase and β-glucosidase were positively related only to bacterial catabolism and ammonification. Protease and urease did not show any significant correlation with microbial catabolic activity but with the microbial diversity indices (H’ and richness). As expected, most of the microbial catabolic variables were positively correlated.
The principal component analysis (PCA) was carried out on the same variables, including enzyme, biochemical, metabolic and molecular data collected from Val, Rom and Vic soil with all the subsequent sterilized and re- or cross-inoculated soils over time (1, 7 and 30 days) to reveal their effects on the relative distribution of the soils (Figure 6).
The outcomes of the PCA showed a clear separation among Val (red), Rom (blue) and Vic (black) soils along PC1 and PC2, which explained, respectively, 26.9% and 25.7% of variance (Figure 6). The results also indicated contrasting contributions to PC1 by β-glucosidase, acid phosphatase and ammonification (negative loadings) and alkaline phosphatase, urease and most of the biochemical properties (positive loadings). The contribution of microbial catabolic activity and diversity appeared to be less relevant. Interestingly, bacterial catabolic efficiency (Area_B) and taxonomical richness (Rich_B) were closely associated with β-glucosidase, acid phosphatase and ammonification and positively related to Val soils, whereas fungal catabolic potential (AWCD_FF) and taxonomic richness (Rich_F) were associated with urease, alkaline phosphatase (AlP) and soil respiration (Ccum), as well as dsDNA and ATP, and were strongly related to Vic soils.
All the samples at day 1 clustered together below the PC1 axis (empty symbols). It is worth noting also that Rom soils clustered along the negative values of the PC2 axis, regardless of the sampling time or the reinoculated soil (cluster 12). In contrast, Vic and Val soils were positively related to PC2 but contrastingly related to PC1. In fact, Val soils are mainly distributed along the negative PC1 values, whereas Vic soils are distributed along the positive PC1 values. Val* soils showed a relevant resilience over time, clustering progressively closer to inoculated Val soils 7 days (clusters 2) and 30 days (cluster 3) after sterilization. Val*+Val and Val*+Rom soils clustered together after 7 and 30 days, whereas Val*+Vic clustered separately (cluster 5). Both original Val and Vic soils grouped separately (clusters 6 and 7, respectively). Interestingly, inoculated Vic soils grouped according to their temporal changes rather than to the treatment. In fact, Vic*+Vic, Vic*+Rom and Vic*+Val clustered together after 7 days (cluster 8) and 30 days (cluster 9). Finally, sterilized Vic* soils after day 1 and day 7 grouped together (cluster 11) close to cluster 1. However, after 30 days, Vic* clustered close to the untreated Vic samples (cluster 10). In contrast, all the Rom soils were poorly affected by time and treatments, clustering together under the PC1 axis (cluster 12), showing the lowest biological and biochemical activity.

4. Discussion

4.1. Soil Respiration, N Ammonification, ATP and Microbial Biomass

In general, cumulative respiration was significantly higher in all the sterilized and inoculated soils than in non-inoculated soils (Figure 1). These results paralleled those reported by Powlson and Jenkinson [15] after soil biocidal treatments, a phenomenon generally ascribed to the increase of easily mineralizable organic substrates made available to microorganisms after soil autoclaving, including the microbial biomass C. As expected, Rom soils showed the lowest values, compared to Val and Vic. However, it cannot be excluded that the large CO2 flush after soil autoclaving could also result from a priming effect [44].
The sterilized soils, inoculated or not, showed higher ammonification rates than untreated soils (Figure 2). Though ammonification in soil generally releases only a small fraction of total soil N (in the order of 1%–1‰) and does not significantly alter the composition of total organic N, the released NH4+-N can be directly assimilated by the actively growing microorganisms or undergo nitrification and ammonia volatilization independently of the soil pH value [45,46]. Remarkably, the result showed that the CO2-C and NH4+-N flushes after autoclaving were relatively independent of the source of the inoculum and different in magnitude not in trends. We explain this finding assuming that the SOM mineralization during the early stages of soil recolonization was more likely influenced by the organic C quality and availability than by the composition and biomass of the microbial communities. These results support the ‘abiotic gate’ hypothesis of the predominance of abiotic over biotic factors in the control of SOM mineralization [47]. Interestingly, while the ammonification rates of the autoclaved non-reinoculated Rom* and Vic* soils remained similar to those of the control soils (Rom, Vic) throughout the incubation period, in the Val* soil it was significantly higher than in the untreated Val soil. This result can be related to the high urease activity already found after 7 days of incubation in the Val* soil, different from the Rom* and Vic* soils (Table 2). Urease activity is a rate-limiting step in N ammonification, and the studied Val soil displayed high urease potential activity, also, when inoculated in the neutral and alkaline soils (Table 2).
Results of soil ATP content showed that the Rom* and Vic* soils were recolonized by indigenous or exogenous microbial communities after 30 days of incubation, whereas in Val* soil the ATP and dsDNA content levelled off to ca. 30% of the initial value, regardless of the inoculation source (Figure 2c and Figure S1). The increasing amount of microbial biomass from Val to Rom and Vic sterilized and reinoculated soils, is likely due more to their pH values than organic C content. Accordingly, lower microbial proliferation in acidic as compared to neutral and alkaline soils has been previously reported [48], also after soil biocidal treatments [49].

4.2. Soil Enzymatic Activities

Overall, soil autoclaving reduced hydrolase activity to undetectable levels in sterilized non-inoculated soils, whereas the low enzyme activity levels detected in the sterilized inoculated soils at early stages reflected the enzyme activity of the inocula (Table 2). The increase of the soil enzymatic activities in all the sterilized (whether reinoculated or not) soils after 7 or 30 days of incubation showed, to varying extents, the recovering capacity of native or exogenous communities to synthesize new enzymes. Moreover, by comparing the hydrolase values, it was possible to discriminate the contribution of the recovering native microbial communities of each inoculated soil by the hydrolase activity of the sterilized soils, which was generally greater after 7 than 30 days of incubation for most of the soils. Studying the production and persistence of the acid and alkaline phosphomonoesterase activities in the same soils, Renella et al. [50] reported that under steady conditions acid phosphomonoesterase activity predominated in the Vallombosa acidic soil, whereas alkaline phosphomonoesterase activity predominated in the Romola neutral and Vicarello alkaline soils, but during the microbial growth induced by the incorporation of plant litter alkaline phosphomonoesterase was produced more in the Vallombrosa soil, whereas acid phosphomonoesterase was produced more in the Vicarello alkaline soil.
The peak of β-glucosidase activity observed during the most active microbial growth phase (day 7) could be due to the large N and P availability. A positive correlation between β-glucosidase and active soil microorganisms was reported by Knight and Dick [51], and stimulation of β-glucosidase activity by the availability of N and P has been previously reported [52,53]. Overall, the adopted experimental approach showed that microbial communities originating from soils with different physicochemical properties have the potential to produce hydrolitic activities at far higher levels than in the native soils under steady conditions. Remarkably, β-glucosidase activity dramatically increased in Val sterilized and inoculated soils compared to the untreated control. In contrast, in Rom sterilized and inoculated soils, β-glucosidase displayed similar values to the control, whereas it decreased in Vic sterilized and inoculated soils. This result contrasts with a study by Stark et al. [54], which highlighted that in nutrient-poor and acidic tundra, increased nutrient availability and pH reduced β-glucosidase activity, while it had no effects on the total bacterial or fungal biomass. The reasons for this are still uncertain but might reflect the altered stoichiometry of microbial nutrient demands and accessibility to soil C substrates after sterilization [55].
The results of microbial biomass (dsDNA) (Figure S1) and CLPP (Figure 2, Table 3 and Table 4) of the inoculated soils suggested that microorganisms originating from different soils can degrade the native organic matter during the recolonization process of soils having physicochemical properties highly different from the original soils, thus supporting the hypothesis that soil colonization can be due to members of native microbial communities surviving soil perturbation, but could also be due to allochthonous microorganisms entering the soil during the perturbation event [56]. In support of this, Pettersson and Bååth [57] went on to show that bacterial communities exert a better colonizing ability when dominant microbial members are removed by chloroform fumigation. The availability of low-molecular weight organic C along with the reduced microbial competition in the habitat are possibly factors that prevent the organic C limitation typical of soils under steady conditions, including C-rich forest soils [58]. Values of ATP content also showed that significantly higher biomass could be hosted by Romola sandy neutral and Vicarello clay alkaline soils inoculated with exogenous microbial communities as compared to the untreated soils, showing that the C-limiting conditions as well as the microbial interactions kept the soils at biomass levels below their maximum carrying capacity (Figure 3). This was not true for the Vallombrosa soil, in which the acidic pH value could likely represent a limiting factor on microbial proliferation. In fact, microbial communities adapt to soil pH through selection and synthesis of many osmotically active metabolites, membrane proteins and ionic transporters [59]. Moreover, bacterial communities are more sensitive to acidification than fungal communities as compared to neutral sub-alkaline pH values [60,61]. This has been confirmed, also, by our results obtained with the Biolog microplate approach. The lack of recovery of urease and protease activity to the original levels could be likely due to either high availability of N-rich metabolites in the sterilized soils or to the low synthetic capacity of the recolonizing microbial populations.
Overall, our results confirmed that enzymatic activities are strongly expressed during the community colonization of sterilized soils and they are likely key factors for the rapid adaptation shown by the microbial communities in soils, in agreement with Hoshino and Matsumoto [62], who reported that microbial activity is a more key feature than microbial diversity during the early stages of soil recolonization.

4.3. Soil Community-Level Physiological Profile

Despite the well-known limitations of the Biolog microplate approach [63], the CLPP assessment has been largely used for assessing microbial functional diversity and the combined use of ECO and FF microplates has been recently proposed as a functional biodiversity indicator of the soil microbial communities [64,65]. The microbial catabolic activity described in this paper is based on all carbon sources and on grouped sources defined as amines/amides, amino acids, carbohydrates, carboxylic acids, polymers and nucleotides or other substrates, as previously proposed by other authors [66,67], determining to make bacterial and fungal results comparable.
The highest values of bacterial catabolic potential were observed in Val soils, whereas sterilized and reinoculated soils displayed higher AWCD values than the untreated control (Figure 2). Our result indicates that the catabolic activity of the microbial communities increased under conditions of high nutrient availability, like those created by sterilization, in accordance with previous studies [23,68]. This result also highlights the importance of soil physicochemical attributes and local abiotic conditions on the shaping of functional traits of microbial communities. In fact, the overall catabolic activity of fungal communities of Val soils inoculated with more alkaline soils, such as Rom and Vic, showed higher values than the untreated control, suggesting an efficient response of the native fungal community to the exogenous input. In contrast, the bacterial catabolic activity detected on most of the substrate categories just after the inoculation (day 1) was higher in the untreated Val soils than in the others but, after 7 and 30 days, the catabolic activity of the inoculated soils was similar or even higher than Val. This result indicates the longer time required by bacteria to adapt their metabolism to the new environmental conditions in an acidic soil compared to fungi, as mentioned in the previous section. This indication seems to be also confirmed by the sterilized soils, where bacteria showed a low or no catabolic activity at day 1, which increased after 7 and 30 days, whereas fungal communities were constantly active since day 1, providing similar values up to day 30. Moreover, depending on the substrate category, different catabolic rates have been observed between Val*+Rom and Val*+Vic samples, especially for fungi (Table 3 and Table 4). For example, amines are mostly used by fungi at day 1 in Val*+Rom soils and their use decreases after 7 and 30 days. In contrast, Val*+Vic displayed increasing values from day 1 up to day 30 when the highest catabolic activity was observed. Similar catabolic activity was observed for amino acids, carbohydrates, carboxylic acids and polymers. These observations are apparently not in accordance with the results reported by other authors for a similar soil. For instance, a study carried out on a sandy soil with pH 5.2 reported that the soil fungal community mostly used carboxylic acids and amino acids for the first 90 days and carbohydrates as well as polymers after 270 days [69]. However, soil functional diversity is strongly connected with the need to adapt to the environment and several soil features other than pH might shape the use of carbon sources located in the FF microplates. For example, the catabolic activity of both bacterial and fungal communities is generally higher in neutral Rom soils inoculated with the alkaline Vic soil (Rom*+Vic) than in those inoculated with the acidic Val soil (Rom*+Val), regardless of its higher content of organic carbon, suggesting that pH is not the only driver shaping microbial functional diversity, confirming the findings of previous works [70,71].
Remarkably, the kinetics of the fungal catabolic activity highlighted by the s value are negatively correlated to the bacterial metabolic rate and catabolic versatility (Figure 5), thus confirming that, despite the clear importance of edaphic factors in controlling microbial communities, fungal/bacterial interactions play a major, although causally unclear, role in shaping the soil microbial communities of which they are a part, as previously reported [72]. On the other hand, the bacterial use of amino acids, carboxylic acids and polymers is positively related to β-glucosidase and acid phosphatase. Moreover, the use of amines and phenolic compounds by bacteria is positively related to glucosidase and alkaline phosphatase, respectively. These correlations are not significant for fungal communities, suggesting a dominant role of the bacterial communities in driving the main enzymatic reactions in the experimental conditions. These results are apparently in contrast with some previous findings. For example, β-glucosidase activity in soil was reported to be mainly promoted by fungi rather than bacteria [73]. However, this is not totally surprising, as different soil microbial groups in the community are responsible for specific functions. For instance, soil fungi mostly participate at the beginning of litter decomposition, while bacteria play the primary roles at later stages [74].

4.4. Bacterial and Fungal Community Structure

The analysis of the microbial community structure showed that each original soil hosted distinct dominant bacterial and fungal communities which developed differently when reinoculated with a different soil type (Figure 4 and Figure S2). This result is apparently not in accordance with the findings of Delmont et al., who reported that distinct communities evolved similarly when colonizing the same sterilized soil [20]. However, in that work the original soils had a similar community composition (richness) and thus developed similarly when colonizing the same habitat. Moreover, the authors incubated the soils for as long as 24 weeks. However, they also observed that the ‘new’ communities displayed some previously undetected species when colonizing the same sterilized soil, thus providing additional information on the importance of rare microbial species in soil. In fact, it has been widely reported that soil physicochemical properties are the main factors controlling the composition and diversity of soil bacterial communities and that the dominant microbial groups play an active role in the soil functions [75,76,77,78]. Genetic fingerprinting showed that bacterial communities evolve much faster than fungal communities during the colonization of soil, likely due to their faster reproduction cycles. A significant fraction of soil microbial biomass belongs to a relatively small number of predominant species, while the majority of microbial species is present in low numbers or in a reversible state of dormancy or reduced metabolic activity [79]. It has been reported that dormant microorganisms or rare species can be trigged into activity in the presence of appropriate substrates and growth conditions [80,81], and, overall, our results support the ‘dormant seed’ hypothesis for soil microbial communities [82]. The fact that the sterile cross-reinoculated soils generally displayed significantly higher enzymatic activities than non-reinoculated soils and self-reinoculated soils suggests that the exogenous soil microbial communities exploited their potential functionality given the wide availability of new organic substrates. The soil reinoculation approach confirmed the loose relationship between soil microbial diversity and enzymatic activity and that soil properties and substrate availability are the main factors inducing the release of microbial enzymes in soil. It also confirmed the key role of rare microbial species in promoting soil enzymatic activity [83]. Monitoring of the microbial communities over time confirmed that bacteria are more sensitive than fungi to soil properties [61,75], with soil pH playing a major role in shaping the microbial communities [48].

4.5. The Effect of Inocula and Substrates

Previous studies reported that soil properties rather than microbial inocula were more important in determining the microbial biomass, bacterial composition and enzymatic activity of sterilized and inoculated soils after 8 months of incubation [71]. Accordingly, our results showed that the major effect on enzyme activity, microbial catabolic profile and community structure seemed to be due to the original soils rather than to the inocula. In fact, the self- and cross-inoculations provided to each soil did not eliminate the effects of the native soil features, even though there were some differences among them. Moreover, the different inocula displayed increasing effects in shaping Rom, Vic and Val soils, respectively. This was likely due to the different physicochemical characteristics of the three soils, according to Meola et al. [84]. However, stronger community shifts and greater variations among the replicates were not observed after reinoculation of nutrient-rich soils, such as Vallombrosa, in contrast with some previous findings [22]. On the other hand, in a similar study, Kapagianni et al. [23] showed that the availability of C and N after sterilization of different type of soils may vary not only depending on the absolute amounts of organic C and N but also on the quality of the organic matter contained in the different soils.
We could speculate that at the beginning of incubation, in sterilized soils there was no limitation of nutrient availability and a lack of competition with more adapted microbes. Thus, the first colonization step might have been performed by fast growing taxa (r strategists). In fact, our results showed that β-glucosidase was positively correlated with the overall bacterial catabolic activity (AWCD), but not with fungal AWCD (Figure 6). This is not surprising, as fungi have always been considered the major decomposers of recalcitrant organic matter in soil environments, whereas bacteria have been reported to play a major role in the degradation of simple substrates. However, based on the ECO and FF microplate results of this work, both bacterial and fungal catabolic activity in all the sterilized soils increased after 7 and 30 days, thus indicating that they were both metabolically active since a very few days after the sterilization. This result is in accordance with previous studies revealing that the fungal contribution to the decomposition of easily degradable substrates may be high, especially in acidic soils, and at high substrate loading rates [85]. However, here the fungal catabolic rate ‘s’ was negatively correlated with alkaline phosphatase, suggesting that such activities are much more closely related to fungal metabolic activity. Thus, the presence of fungi with the ability to rapidly decompose easily degradable organic compounds must exert a selection pressure on bacteria to compete for these nutrients. Thus, the faster metabolic potential of bacterial communities likely succeeded in promoting alkaline phosphatase and β-glucosidase activity. The combined results highlighted that the interaction between bacteria and fungi is essential to drive metabolic processes in complex environments, such as soil.

5. Conclusions

The combination of self- and cross-inoculation of different heat-sterilized soils produced rapid and dynamic changes in enzymatic activity as well as in microbial structure and catabolic activity. Original soils had the major influence in shaping soil functional diversity, while the effect of reinoculation of sterilized soils was more related to incubation period and type of soil. For example, the enzymatic and catabolic activity of pH neutral soils (Rom) increased and decreased after reinoculation with alkaline and acidic soils, respectively. In contrast, acidic (Val) and alkaline (Vic) soils did not show such pH-related responses. In general, Val soil displayed the greatest functional changes after sterilization and reinoculation compared to original untreated soil.
Overall, alkaline phosphatase activity was more closely correlated to fungal catabolic potential, whereas β-glucosidase and acid phosphatase were mainly correlated with bacterial metabolism, thus suggesting that they might have been involved in the breakdown of the organic materials released after sterilization. In contrast, at the early stage of soil recolonization, both protease and urease activities were poorly related to microbial catabolic potential and not significantly affected by the different treatments.
The assembly of early-stage microbial communities in reinoculated soils provided a different structure compared to the pristine soils, showing faster and greater changes in the bacterial community structure than in fungal communities, especially in acidic soils. Interestingly, these ‘newly assembled’ microbial communities revealed the occurrence of taxa which were not detected in the original soils, suggesting the key role of rare species during the first colonization phase of a new environment. This result confirmed that rare microbial taxa rather than the dominant taxa may be the major drivers of soil functionality, confirming that rare taxa have a crucial role in biological processes and the sustainable provision of ecosystem functions in the future [20,86].
In conclusion, even though they have inherent limitations, reinoculation experiments have the potential to explore the main rules of microbial adaptation during the early phases of soil recolonization after a severe environmental disturbance as well as the potential to facilitate the discovery of novel rare microorganisms.

Supplementary Materials

The following are available online at https://www.mdpi.com/article/10.3390/agriculture12020268/s1, Figure S1: dsDNA content (ex-pressed as mg/kg) of Vallombrosa, Vicarello and Romola control and inoculated soils, Figure S2: DGGE profiles of 16S (A) and 18S (B) rRNA genes PCR products obtained from Vallombrosa, Vicarello and Romola control and inoculated soils, Table S1: Correlations.

Author Contributions

Conceptualization, G.R., A.G. and S.M.; methodology, G.R., A.G. and S.M.; formal analysis, G.R., A.G., S.M., L.G., R.P. and B.P.; data curation, S.M.; writing—original draft preparation, S.M., G.R., A.G. and R.P.; writing—review and editing, S.M., G.R. and A.G.; supervision, P.N. All authors have read and agreed to the published version of the manuscript.

Funding

This research received no external funding.

Institutional Review Board Statement

Not applicable.

Informed Consent Statement

Not applicable.

Data Availability Statement

The data presented in this study are available on request from the corresponding author.

Conflicts of Interest

The authors declare no conflict of interest.

References

  1. Seybold, C.A.; Herrick, J.E.; Brejda, J.J. Soil resilience: A fundamental component of soil quality. Soil Sci. 1999, 164, 224–234. [Google Scholar] [CrossRef]
  2. Strickland, M.S.; Lauber, C.; Fierer, N.; Bradford, M.A. Testing the functional significance of microbial community composition. Ecology 2009, 90, 441–451. [Google Scholar] [CrossRef] [PubMed] [Green Version]
  3. Mocali, S.; Benedetti, A. Exploring research frontiers in microbiology: The challenge of metagenomics in soil microbiology. Res. Microbiol. 2010, 161, 497–505. [Google Scholar] [CrossRef] [PubMed]
  4. Lehman, R.M.; Acosta-Martinez, V.; Buyer, J.S.; Cambardella, C.A.; Collins, H.P.; Ducey, T.F.; Halvorson, J.J.; Jin, V.L.; Johnson, J.M.F.; Kremer, R.J.; et al. Soil biology for resilient, healthy soil. J. Soil Water Conserv. 2015, 70, 12A–18A. [Google Scholar] [CrossRef]
  5. Baas-Becking, L.G.M. Geobiologie of Inleiding tot de Milieukunde; Van Stockkum & Zoon: Hague, The Netherlands, 1934. [Google Scholar]
  6. Rillig, M.C.; Antonovics, J.; Caruso, T.; Lehmann, A.; Powell, J.R.; Veresoglou, S.D.; Verbruggen, E. Interchange of entire communities: Microbial community coalescence. Trends Ecol. Evol. 2015, 30, 470–476. [Google Scholar] [CrossRef] [Green Version]
  7. Mony, C.; Vandenkoornhuyse, P.; Bohannan, B.J.; Peay, K.; Leibold, M.A. A Landscape of Opportunities for Microbial Ecology Research. Front. Microbiol. 2020, 11, 2964. [Google Scholar] [CrossRef]
  8. Meyer, A.F.; Lipson, D.A.; Martin, A.P.; Schadt, C.W.; Schmidt, S.K. Molecular and Metabolic Characterization of Cold-Tolerant Alpine Soil Pseudomonas Sensu Stricto. Appl. Environ. Microbiol. 2004, 70, 483–489. [Google Scholar] [CrossRef] [Green Version]
  9. Chaparro, J.M.; Sheflin, A.M.; Manter, D.K.; Vivanco, J.M. Manipulating the soil microbiome to increase soil health and plant fertility. Biol. Fertil. Soils 2012, 48, 489–499. [Google Scholar] [CrossRef]
  10. Fenchel, T.; Finlay, B.J. The Ubiquity of Small Species: Patterns of Local and Global Diversity. BioScience 2004, 54, 777–784. [Google Scholar] [CrossRef]
  11. Griffiths, B.S.; Philippot, L. Insights into the resistance and resilience of the soil microbial community. FEMS Microbiol. Rev. 2013, 37, 112–129. [Google Scholar] [CrossRef] [Green Version]
  12. Mocali, S.; Landi, S.; Curto, G.; Dallavalle, E.; Infantino, A.; Colzi, C.; D’Errico, G.; Roversi, P.F.; D’Avino, L.; Lazzeri, L. Resilience of soil microbial and nematode communities after biofumigant treatment with defatted seed meals. Ind. Crops Prod. 2015, 75, 79–90. [Google Scholar] [CrossRef]
  13. Begonia, M.F.; Kremer, R.J. Chemotaxis of deleterious rhizobacteria to birdsfoot trefoil. Appl. Soil Ecol. 1999, 11, 35–42. [Google Scholar] [CrossRef]
  14. Postma, J.J.; Hok-A-Hin, C.H.; Voshaar, J.H.O. Influence of the inoculum density on the growth and survival of Rhizobium leguminosarumbiovartrifoliiintroduced into sterile and non-sterile loamy sand and silt loam. FEMS Microbiol. Lett. 1990, 73, 49–57. [Google Scholar] [CrossRef]
  15. Powlson, D.; Jenkinson, D. The effects of biocidal treatments on metabolism in soil—II. Gamma irradiation, autoclaving, air-drying and fumigation. Soil Biol. Biochem. 1976, 8, 179–188. [Google Scholar] [CrossRef]
  16. Salonius, P.O.; Robinson, J.B.; Chase, F.E. A comparison of autoclaved and gamma-irradiated soils as media for microbial colonization experiments. Plant Soil 1967, 27, 239–248. [Google Scholar] [CrossRef]
  17. Al-Achi, B.J.; Platsouka, E.; Levy, S.B. Competitive colonization between Pseudomonas species in sterile soils. Curr. Microbiol. 1991, 23, 97–104. [Google Scholar] [CrossRef]
  18. Wertz, S.; Czarnes, S.; Bartoli, F.; Renault, P.; Commeaux, C.; Guillaumaud, N.; Clays-Josserand, A. Early-stage bacterial colonization between a sterilized remoulded soil clod and natural soil aggregates of the same soil. Soil Biol. Biochem. 2007, 39, 3127–3137. [Google Scholar] [CrossRef]
  19. Latour, X.; Philippot, L.; Corberand, T.; Lemanceau, P. The establishment of an introduced community of fluorescent pseudomonads in the soil and in the rhizosphere is affected by the soil type. FEMS Microbiol. Ecol. 1999, 30, 163–170. [Google Scholar] [CrossRef] [PubMed]
  20. Delmont, T.O.; Francioli, D.; Jacquesson, S.; Laoudi, S.; Mathieu, A.; Nesme, J.; Ceccherini, M.T.; Nannipieri, P.; Simonet, P.; Vogel, T.M. Microbial community development and unseen diversity recovery in inoculated sterile soil. Biol. Fertil. Soils 2014, 50, 1069–1076. [Google Scholar] [CrossRef]
  21. Don, A.; Böhme, I.H.; Dohrmann, A.B.; Poeplau, C.; Tebbe, C.C. Microbial community composition affects soil organic carbon turnover in mineral soils. Biol. Fertil. Soils 2017, 53, 445–456. [Google Scholar] [CrossRef]
  22. Francioli, D.; Schulz, E.; Purahong, W.; Buscot, F.; Reitz, T. Reinoculation elucidates mechanisms of bacterial community assembly in soil and reveals undetected microbes. Biol. Fertil. Soils 2016, 52, 1073–1083. [Google Scholar] [CrossRef]
  23. Kapagianni, P.D.; Papadopoulos, D.; Menkissoglu-Spiroudi, U.; Stamou, G.P.; Papatheodorou, E.M. Soil functionality produced by soil mixing: The role of inoculum and substrate. Ecol. Res. 2019, 34, 600–611. [Google Scholar] [CrossRef]
  24. Burns, R.G.; DeForest, J.L.; Marxsen, J.; Sinsabaugh, R.L.; Stromberger, M.E.; Wallenstein, M.D.; Weintraub, M.N.; Zoppini, A. Soil enzymes in a changing environment: Current knowledge and future directions. Soil Biol. Biochem. 2013, 58, 216–234. [Google Scholar] [CrossRef]
  25. Wolf, D.C.; Skipper, H.D. Soil Sterilization. In Methods of Soil Analysis, Part 2: Microbiological and Biochemical Properties; John Wiley & Sons: Hoboken, NJ, USA, 2018; pp. 41–51. [Google Scholar] [CrossRef]
  26. Brown, K.A. Biochemical activities in peat sterilized by gamma-irradiation. Soil Biol. Biochem. 1981, 13, 469–474. [Google Scholar] [CrossRef]
  27. Klose, S.; Tabatabai, M. Urease activity of microbial biomass in soils. Soil Biol. Biochem. 1999, 31, 205–211. [Google Scholar] [CrossRef]
  28. Renella, G.; Landi, L.; Nannipieri, P. Hydrolase activities during and after the chloroform fumigation of soil as affected by protease activity. Soil Biol. Biochem. 2002, 34, 51–60. [Google Scholar] [CrossRef]
  29. Krauße, T.; Schütze, E.; Phieler, R.; Fürst, D.; Merten, D.; Büchel, G.; Kothe, E. Changes in element availability induced by sterilization in heavy metal contaminated substrates: A comprehensive study. J. Hazard. Mater. 2019, 370, 70–79. [Google Scholar] [CrossRef]
  30. Wei, G.; Li, M.; Shi, W.; Tian, R.; Chang, C.; Wang, Z.; Wang, N.; Zhao, G.; Gao, Z. Similar drivers but different effects lead to distinct ecological patterns of soil bacterial and archaeal communities. Soil Biol. Biochem. 2020, 144, 107759. [Google Scholar] [CrossRef]
  31. Blackmer, A.M.; Bremner, J.M. Gas Chromatographic Analysis of Soil Atmospheres. Soil Sci. Soc. Am. J. 1977, 41, 908–912. [Google Scholar] [CrossRef]
  32. Ciardi, C.; Nannipieri, P. A comparison of methods for measuring ATP in soil. Soil Biol. Biochem. 1990, 22, 725–727. [Google Scholar] [CrossRef]
  33. Dick, R.P.; Breakwell, D.P.; Turco, R.F. Soil Enzyme Activities and Biodiversity Measurements as Integrative Microbiological Indicators. Methods Assess. Soil Qual. 1997, 49, 247–271. [Google Scholar]
  34. Garland, J.L.; Mills, A.L. Classification and Characterization of Heterotrophic Microbial Communities on the Basis of Patterns of Community-Level Sole-Carbon-Source Utilization. Appl. Environ. Microbiol. 1991, 57, 2351–2359. [Google Scholar] [CrossRef] [PubMed] [Green Version]
  35. Guckert, J.B.; Carr, G.J.; Johnson, T.D.; Hamm, B.G.; Davidson, D.H.; Kumagai, Y. Community analysis by Biolog: Curve integration for statistical analysis of activated sludge microbial habitats. J. Microbiol. Methods 1996, 27, 183–197. [Google Scholar] [CrossRef]
  36. Burkhardt, C.; Insam, H.; Hutchinson, T.C.; Reber, H.H. Impact of heavy metals on the degradative capabilities of soil bacterial communities. Biol. Fertil. Soils 1993, 16, 154–156. [Google Scholar] [CrossRef]
  37. Lindstrom, J.E.; Barry, R.P.; Braddock, J.F. Microbial community analysis: A kinetic approach to constructing potential C source utilization patterns. Soil Biol. Biochem. 1998, 30, 231–239. [Google Scholar] [CrossRef]
  38. Marstorp, H.; Witter, E. Extractable dsDNA and product formation as measures of microbial growth in soil upon substrate addition. Soil Biol. Biochem. 1999, 31, 1443–1453. [Google Scholar] [CrossRef]
  39. Heuer, H.; Krsek, M.; Baker, P.; Smalla, K.; Wellington, E.M. Analysis of actinomycete communities by specific amplification of genes encoding 16S rRNA and gel-electrophoretic separation in denaturing gradients. Appl. Environ. Microbiol. 1997, 63, 3233–3241. [Google Scholar] [CrossRef] [Green Version]
  40. Vainio, E.J.; Hantula, J. Direct analysis of wood-inhabiting fungi using denaturing gradient gel electrophoresis of amplified ribosomal DNA. Mycol. Res. 2000, 104, 927–936. [Google Scholar] [CrossRef]
  41. Hammer, Ø.; Ryan, P.D.; Hammer, Ø.; Harper, D.A.T. Past: Paleontological statistics software package for education and data analysis. Palaeontol. Electron. 2001, 4, 1–9. [Google Scholar]
  42. Insam, H. A new set of substrates proposed for community characterization in environmental samples. In Microbial Communities: Functional Versus Structural Approaches; Insam, H., Rangger, A., Eds.; Springer: Berlin/Heidelberg, Germany, 1997; pp. 259–260. [Google Scholar]
  43. Pastorelli, R.; Landi, S.; Trabelsi, D.; Piccolo, R.; Mengoni, A.; Bazzicalupo, M.; Pagliai, M. Effects of soil management on structure and activity of denitrifying bacterial communities. Appl. Soil Ecol. 2011, 49, 46–58. [Google Scholar] [CrossRef]
  44. De Nobili, M.; Contin, M.; Mondini, C.; Brookes, P. Soil microbial biomass is triggered into activity by trace amounts of substrate. Soil Biol. Biochem. 2001, 33, 1163–1170. [Google Scholar] [CrossRef]
  45. Blasco, M.L.; Cornfield, A.H. Volatilization of Nitrogen as Ammonia from Acid Soils. Nature 1966, 212, 1279–1280. [Google Scholar] [CrossRef]
  46. Antisari, L.; Ciavatta, C.; Sequi, P. Volatilization of ammonia during the chloroform fumigation of soil for measuring microbial biomass N. Soil Biol. Biochem. 1990, 22, 225–228. [Google Scholar] [CrossRef]
  47. Kemmitt, S.J.; Lanyon, C.V.; Waite, I.S.; Wen, Q.; Addiscott, T.M.; Bird, N.R.; O’Donnell, A.G.; Brookes, P.C. Mineralization of native soil organic matter is not regulated by the size, activity or composition of the soil microbial biomass—A new perspective. Soil Biol. Biochem. 2008, 40, 61–73. [Google Scholar] [CrossRef]
  48. Bååth, E. Adaptation of soil bacterial communities to prevailing pH in different soils. FEMS Microbiol. Ecol. 1996, 19, 227–237. [Google Scholar] [CrossRef]
  49. Jenkinson, D.; Powlson, D. The effects of biocidal treatments on metabolism in soil—V: A method for measuring soil biomass. Soil Biol. Biochem. 1976, 8, 209–213. [Google Scholar] [CrossRef]
  50. Renella, G.; Landi, L.; Ascher, J.; Ceccherini, M.T.; Pietramellara, G.; Nannipieri, P. Phosphomonoesterase production and persistence and composition of bacterial communities during plant material decomposition in soils with different pH values. Soil Biol. Biochem. 2006, 38, 795–802. [Google Scholar] [CrossRef]
  51. Knight, T.R.; Dick, R.P. Differentiating microbial and stabilized β-glucosidase activity relative to soil quality. Soil Biol. Biochem. 2004, 36, 2089–2096. [Google Scholar] [CrossRef]
  52. Allison, S.D.; Vitousek, P.M. Responses of extracellular enzymes to simple and complex nutrient inputs. Soil Biol. Biochem. 2005, 37, 937–944. [Google Scholar] [CrossRef]
  53. Renella, G.; Szukics, U.; Landi, L.; Nannipieri, P. Quantitative assessment of hydrolase production and persistence in soil. Biol. Fertil. Soils 2007, 44, 321–329. [Google Scholar] [CrossRef]
  54. Stark, S.; Männistö, M.K.; Eskelinen, A. Nutrient availability and pH jointly constrain microbial extracellular enzyme activities in nutrient-poor tundra soils. Plant Soil 2014, 383, 373–385. [Google Scholar] [CrossRef]
  55. Sinsabaugh, R.L.; Lauber, C.L.; Weintraub, M.N.; Ahmed, B.; Allison, S.D.; Crenshaw, C.; Contosta, A.R.; Frey, S.; Gallo, M.E.; Gartner, T.B.; et al. Stoichiometry of soil enzyme activity at global scale. Ecol. Lett. 2008, 11, 1252–1264. [Google Scholar] [CrossRef] [PubMed]
  56. Jenneman, G.E.; McInerney, M.J.; Crocker, M.E.; Knapp, R.M. Effect of Sterilization by Dry Heat or Autoclaving on Bacterial Penetration through Berea Sandstone. Appl. Environ. Microbiol. 1986, 51, 39–43. [Google Scholar] [CrossRef] [PubMed] [Green Version]
  57. Pettersson, M.; Bååth, E. Effects of the properties of the bacterial community on pH adaptation during recolonisation of a humus soil. Soil Biol. Biochem. 2004, 36, 1383–1388. [Google Scholar] [CrossRef]
  58. Demoling, F.; Figueroa, D.; Bååth, E. Comparison of factors limiting bacterial growth in different soils. Soil Biol. Biochem. 2007, 39, 2485–2495. [Google Scholar] [CrossRef]
  59. Crowley, D.E.; Alvey, S.A. Regulation of Microbial Processes by Soil pH. In Handbook of Plant Growth pH as the Master Variable; CRC Press: Boca Raton, FL, USA, 2002; pp. 343–370. [Google Scholar] [CrossRef]
  60. Rousk, J.; Brookes, P.C.; Bååth, E. Contrasting Soil pH Effects on Fungal and Bacterial Growth Suggest Functional Redundancy in Carbon Mineralization. Appl. Environ. Microbiol. 2009, 75, 1589–1596. [Google Scholar] [CrossRef] [Green Version]
  61. Rousk, J.; Bååth, E.; Brookes, P.C.; Lauber, C.L.; Lozupone, C.; Caporaso, J.G.; Knight, R.; Fierer, N. Soil bacterial and fungal communities across a pH gradient in an arable soil. ISME J. 2010, 4, 1340–1351. [Google Scholar] [CrossRef] [PubMed]
  62. Hoshino, Y.T.; Matsumoto, N. DNA- versus RNA-based denaturing gradient gel electrophoresis profiles of a bacterial community during replenishment after soil fumigation. Soil Biol. Biochem. 2007, 39, 434–444. [Google Scholar] [CrossRef]
  63. Preston-Mafham, J.; Boddy, L.; Randerson, P.F. Analysis of microbial community functional diversity using sole-carbon-source utilisation profiles a critique. FEMS Microbiol. Ecol. 2002, 42, 1–14. [Google Scholar] [CrossRef] [PubMed]
  64. Pinzari, F.; Ceci, A.; Abu-Samra, N.; Canfora, L.; Maggi, O.; Persiani, A. Phenotype MicroArray™ system in the study of fungal functional diversity and catabolic versatility. Res. Microbiol. 2016, 167, 710–722. [Google Scholar] [CrossRef]
  65. Oszust, K.; Frąc, M. First report on the microbial communities of the wild and planted raspberry rhizosphere A statement on the taxa, processes and a new indicator of functional diversity. Ecol. Indic. 2020, 121, 107117. [Google Scholar] [CrossRef]
  66. Zak, J.; Willig, M.; Moorhead, D.; Wildman, H. Functional diversity of microbial communities: A quantitative approach. Soil Biol. Biochem. 1994, 26, 1101–1108. [Google Scholar] [CrossRef]
  67. Dobranic, J.K.; Zak, J.C. A microtiter plate procedure for evaluating fungal functional diversity. Mycologia 1999, 91, 756–765. [Google Scholar] [CrossRef]
  68. Nunan, N.; Leloup, J.; Ruamps, L.S.; Pouteau, V.; Chenu, C. Effects of habitat constraints on soil microbial community function. Sci. Rep. 2017, 7, 1–10. [Google Scholar] [CrossRef] [PubMed]
  69. Borowik, A.; Wyszkowska, J.; Oszust, K. Functional Diversity of Fungal Communities in Soil Contaminated with Diesel Oil. Front. Microbiol. 2017, 8, 1862. [Google Scholar] [CrossRef]
  70. Frąc, M.; Oszust, K.; Lipiec, J.; Jezierska-Tys, S.; Nwaichi, E.O. Soil Microbial Functional and Fungal Diversity as Influenced by Municipal Sewage Sludge Accumulation. Int. J. Environ. Res. Public Heal. 2014, 11, 8891–8908. [Google Scholar] [CrossRef]
  71. Xun, F.; Xie, B.; Liu, S.; Guo, C. Effect of plant growth-promoting bacteria (PGPR) and arbuscular mycorrhizal fungi (AMF) inoculation on oats in saline-alkali soil contaminated by petroleum to enhance phytoremediation. Environ. Sci. Pollut. Res. 2014, 22, 598–608. [Google Scholar] [CrossRef]
  72. Siciliano, S.D.; Palmer, A.S.; Winsley, T.; Lamb, E.; Bissett, A.; Brown, M.V.; van Dorst, J.; Ji, M.; Ferrari, B.C.; Grogan, P.; et al. Soil fertility is associated with fungal and bacterial richness, whereas pH is associated with community composition in polar soil microbial communities. Soil Biol. Biochem. 2014, 78, 10–20. [Google Scholar] [CrossRef]
  73. Hayano, K.; Tubaki, K. Origin and properties of β-glucosidase activity of tomato-field soil. Soil Biol. Biochem. 1985, 17, 553–557. [Google Scholar] [CrossRef]
  74. Hu, Z.; Xu, C.; McDowell, N.G.; Johnson, D.; Wang, M.; Luo, Y.; Zhou, X.; Huang, Z. Linking microbial community composition to C loss rates during wood decomposition. Soil Biol. Biochem. 2017, 104, 108–116. [Google Scholar] [CrossRef] [Green Version]
  75. Fierer, N.; Jackson, R.B. The diversity and biogeography of soil bacterial communities. Proc. Natl. Acad. Sci. USA 2006, 103, 626–631. [Google Scholar] [CrossRef] [Green Version]
  76. Gelsomino, A.; Azzellino, A. Multivariate analysis of soils: Microbial biomass, metabolic activity, and bacterial-community structure and their relationships with soil depth and type. J. Plant Nutr. Soil. Sc. 2011, 174, 381–394. [Google Scholar] [CrossRef]
  77. Gelsomino, A.; Petrovičová, B.; Vecchio, G.; Laudicina, V.A.; Badalucco, L. Chemical, biochemical and microbial diversity through a Pachic Humudept profile in a temperate upland grassland. Agrochimica 2013, 57, 214–232. [Google Scholar]
  78. Felske, A.; Rheims, H.; Wolterink, A.; Stackebrandt, E.; Akkermans, A.D.L. Ribosome analysis reveals prominent activity of an uncultured member of the class Actinobacteria in grassland soils. Microbiology 1997, 143, 2983–2989. [Google Scholar] [CrossRef] [PubMed] [Green Version]
  79. Elshahed, M.S.; Youssef, N.H.; Spain, A.M.; Sheik, C.; Najar, F.Z.; Sukharnikov, L.O.; Roe, B.A.; Davis, J.P.; Schloss, P.D.; Bailey, V.L.; et al. Novelty and Uniqueness Patterns of Rare Members of the Soil Biosphere. Appl. Environ. Microbiol. 2008, 74, 5422–5428. [Google Scholar] [CrossRef] [PubMed] [Green Version]
  80. Epstein, S.S. Microbial awakenings. Nature 2009, 457, 1083. [Google Scholar] [CrossRef]
  81. Lazzaro, L.; Giuliani, C.; Fabiani, A.; Agnelli, A.E.; Pastorelli, R.; Lagomarsino, A.; Benesperi, R.; Calamassi, R.; Foggi, B. Soil and plant changing after invasion: The case of Acacia dealbata in a Mediterranean ecosystem. Sci. Total Environ. 2014, 497–498, 491–498. [Google Scholar] [CrossRef] [PubMed]
  82. Shade, A.; Hogan, C.S.; Klimowicz, A.K.; Linske, M.; McManus, P.S.; Handelsman, J. Culturing captures members of the soil rare biosphere. Environ. Microbiol. 2012, 14, 2247–2252. [Google Scholar] [CrossRef] [PubMed]
  83. Liu, S.; Zhang, X.; Dungait, J.A.J.; Quine, T.A.; Razavi, B.S. Rare microbial taxa rather than phoD gene abundance determine hotspots of alkaline phosphomonoesterase activity in the karst rhizosphere soil. Biol. Fertil. Soils 2020, 57, 257–268. [Google Scholar] [CrossRef]
  84. Meola, M.; Lazzaro, A.; Zeyer, J. Diversity, resistance and resilience of the bacterial communities at two alpine glacier forefields after a reciprocal soil transplantation. Environ. Microbiol. 2014, 16, 1918–1934. [Google Scholar] [CrossRef]
  85. de Boer, W.; Folman, L.B.; Summerbell, R.C.; Boddy, L. Living in a fungal world: Impact of fungi on soil bacterial niche development. FEMS Microbiol. Rev. 2005, 29, 795–811. [Google Scholar] [CrossRef] [PubMed] [Green Version]
  86. Chen, Q.-L.; Ding, J.; Zhu, D.; Hu, H.-W.; Delgado-Baquerizo, M.; Ma, Y.-B.; He, J.-Z.; Zhu, Y.-G. Rare microbial taxa as the major drivers of ecosystem multifunctionality in long-term fertilized soils. Soil Biol. Biochem. 2019, 141, 107686. [Google Scholar] [CrossRef]
Figure 1. (A) Cumulative soil respiration in reinoculated soils during a 30 d incubation experiment. (B) Ammonification in self- or cross-reinoculated soils during a 30 d incubation experiment. At each sampling time, different letters indicate a significant (p < 0.05) difference among means (n = 3). (C) ATP content in reinoculated soils during a 30 d incubation experiment. Heat-sterlized and non-inoculated soils (Val*, Rom*, Vic*) together with non-heat-sterilized and non-reinoculated soils (Val, Rom, Vic) were taken as control treatments. At each sampling time, different letters indicate a significant (p < 0.05) difference among means (n = 3).
Agriculture 12 00268 g001
Figure 2. Biolog average well color development (AWCD) values for bacteria (EcoPlates) and fungi (FF microplates) from self- or cross-reinoculated heat-sterilized Romola, Vallombrosa and Vicarello soils after 1 day (star), 7 days (triangle) and 30 days of incubation (circle).
Agriculture 12 00268 g002
Figure 3. NMDS of the CLPP data obtained from the Biolog Ecoplates (bacteria) and FF plates (fungi) from Romola (square), Vallombrosa (triangle) and Vicarello (triangle) soils and sterilized soils (star) as well as self- or cross-reinoculated with Romola (filled square), Vallombrosa (filled triangle) and Vicarello (filled inverted triangle) soils after 1 day (green), 7 days (blue) and 30 days of incubation (red).
Agriculture 12 00268 g003
Figure 4. NMDS ordination plots of 16S (A) and 18S (B) rRNA gene DGGE profiles obtained from Vallombrosa (empty triangle), Vicarello (empty inverted triangle) and Romola (empty square) control soils and from sterilized soils reinoculated with Vallombrosa (filled triangle), Vicarello (filled inverted triangle) and Romola (filled square) soils, incubated for 1 (green), 7 (blue) and 30 days (red).
Agriculture 12 00268 g004
Figure 5. Pairwise Pearson’s correlation analysis. The two specular triangles display the Pearson’s correlation coefficient (r) between each of the two soil characteristics. Blue and red colors indicate positive and negative correlations, respectively. The color density and the square size reflect the scale of the correlation. Color density and circle size demonstrate the significance level, and p-values above 0.05 were regarded as insignificant and labeled in white color. Variables indicated with B or FF are referred to bacteria or fungi, respectively. Abbreviations: Alk-P (alkaline phosphatase), Acid-P (acid phosphatase), Beta-Glu (beta-glucosidase), dsDNA (double-strand DNA), Ccum (cumulative respiration), s_(catabolic kinetics), Area (area of the CLPP curve), CV (catabolic versatility), Ammonif (ammonification), AA (amino acids), CHO (carbohydrates), COOH (carboxylic acids), Phenol (phenolic compounds), Nucleot (nucleotides).
Agriculture 12 00268 g005
Figure 6. Principal component analysis (PCA) score plots based on the relative distribution of the original soils Val (red), Rom (blue) and Vic (black) together with sterilized and non-inoculated soils, Val*, Rom* and Vic*, as well as the sterilized and self- or cross-reinoculated soils after 1 day (empty squares), 7 days (circles) and 30 days (full square) of incubation. Different clusters have been numbered as follows: 1 (Val*, day1), 2 (Val*, day 7), 3 (Val*, day30), 4 (Val*+Val, Val*+Rom), 5 (Val*+Vic), 6 (Val), 7 (Vic), 8 (Vic*+Val, Vic*+Vic, Vic*+Rom, day 7), 9 (Vic*+Val, Vic*+Vic, Vic*+Rom, day 30), 10 (Vic*, day30), 11 (Vic*, day 1 and 7), 12 (Rom, Rom*, Rom*+Rom, Rom*+Val, Rom*+Vic). Percentages correspond to the variance explained in each axis (PC1 = 26.9%, PC2 = 25.7%).
Agriculture 12 00268 g006
Table 1. Main physical and chemical properties of Vallombrosa (Val; acidic loamy forest), Romola (Rom; sandy arable) and Vicarello (Vic; clay calcareous forest) soils. Values are means ± SD (n = 3).
SoilSandSiltClaypHTOCTNCECTCaACaNH4+-NNO3-NTOPOlsen-P
% g kg−1cmolc kg−1g kg−1mg kg−1
Val48.933.018.15.0 ± 0.236.6 ± 1.52.2 ± 0.326.6 ± 0.80029.8 ± 3.625.7 ± 5.134.1 ± 2.87.4 ± 2.9
Rom90.73.65.76.7 ± 0.110.5 ± 0.30.98 ± 0.216.9 ± 0.50013.0 ± 2.522.3 ± 1.420.9 ± 1.98.7 ± 3.3
Vic20.537.342.28.0 ± 0.122.9 ± 0.32.2 ± 0.225.3 ± 0.7128 ± 583 ± 321.7 ± 1.614.7 ± 2.022.0 ± 1.86.2 ± 0.3
Soil variables are: pH; TOC, total organic C; TN, total N; CEC, cation-exchange capacity; TCa, total soil carbonate; ACa, active soil carbonate; NH4+-N, ammonium-N; NO3-N, nitrate-N; TOP, total organic P; Olsen-P, Olsen-extractable P.
Table 2. Enzymatic activities in self- or cross-reinoculated heat-sterilized soils during a 30 d incubation experiment. Heat-sterilized and non-inoculated soils (Val*, Rom*, Vic*) together with non-heat-sterilized and non-reinoculated soils (Val, Rom, Vic) were taken as control treatments. At each sampling time, different letters indicate a significant (p < 0.05) difference among means (n = 3).
Enzymatic ActivityTime (days)Soil Treatments
VallombrosaRomolaVicarello
ValVal*Val*+
Val
Val*+
Rom
Val*+
Vic
RomRom*Rom*+
Rom
Rom*+
Val
Rom*+
Vic
VicVic*Vic*+
Vic
Vic*+
Val
Vic*+
Rom
Alkaline phosphomonoesterase
(mg p-NP a kg−1 h−1)
13849 aBDL668 bBDL541 b7031 aBDL89 b1110 c334 d17,501 aBDL2323 bBDLBDL
73963 aBDL1845 b1570 b10,589 c6704 a2113 b7248 a2921 b15,169 c18,019 aBDL17,199 a14,625 a17,082 a
303977 a9228 b8790 b6803 c11,597 d6304 a6645 a7624 a8811 a11,059 b17,452 a10,050 b11,201 b14,945 c6127 d
Acid phosphomonoesterase
(mg p-NP a kg−1 h−1)
122,732 aBDL2093 bBDLBDL2092 aBDL90 b763 c700 c5396 aBDL1016 b1848 cBDL
722,274 a9282 b37,036 c42,979 c35,455 c2351 aBDL678 b2396 a 2251 a5277 aBDL2174 b2260 b2446 b
3021,833 a21,930 a25,507 b23,080 ab18,315 c2238 a774 b844 b1774 a1720 a5287 ab3314 c4915 a6494 b2979 c
β-Glucosidase
(mg p-NP a kg−1 h−1)
12492 aBDLBDLBDLBDL1641 aBDL15 b247 c1004 d5853 aBDL1116 bBDLBDL
72588 a4054 a19,568 b17,899 b8133 c1583 a1574 a1330 a991 b1768 a6448 a2805 b4136 c4246 c4123 c
302845 a17,584 b18,044 b23,453 c11,293 d1531 a1583 a1090 b878 b1697 a4946 a776 b960 b441 b355 c
Protease
(mg NH4+-N kg−1 h−1)
1124.2 aBDL19.0 b30.1 c14.6 b117.0 aBDL19.6 b29.5 c10.6 d106.4 aBDLBDLBDLBDL
7101.5 aBDL16.9 b17.7 b25.5 c121.8 aBDL23.6 b21.0 b 26.6 b100.9 aBDLBDLBDLBDL
30108.8 a26.5 b16.3 c12.2 c17.0 d110.7 a3.7 b18.9 c 26.0 d 10.2 e91.1 a22.5 b44.1 c28.4 b40.5 c
Urease
(mg NH4+-N kg−1 h−1)
182.9 aBDL11.7 b7.7 b10.8 b101.0 aBDL14.7 b3.6 c12.9 b7.4 aBDLBDLBDLBDL
778.4 a6.3 b22.8 c5.9 b34.8 d96.0 aBDL14.7 b2.0 c12.8 b7.4 aBDL13.3 a124.4 b64.7 c
3069.4 a14.7 b24.3 c19.7 bc38.9 d87.9 a3.2 b13.9 c4.3 b14.7 c7.5 a43.2 b8.2 a137.8 c49.2 b
a p-NP, p-nitrophenol; BDL, below detection limit.
Table 3. Bacterial catabolic activity of self- or cross-inoculated soils during a 30 d incubation experiment. Heat-sterilized and non-inoculated soils (Val*, Rom*, Vic*) together with non-sterilized and non-reinoculated soils (Val, Rom, Vic) were taken as control treatments. At each sampling time, different letters indicate a significant (p < 0.05) difference among means (n = 3).
Substrate CategoryTime (days)Soil Treatments
VallombrosaRomolaVicarello
ValVal*Val*+ValVal*+RomVal*+VicRomRom*Rom*+RomRom*+ValRom*+VicVicVic*Vic*+VicVic*+ValVic*+Rom
Amines11.790 a0.000 b1.613 a1.720 a 1.148 ab1.116 a0.018 b 1.217 a1.167 a1.510 a0.926 a0.000 b0.942 a0.860 a0.902 a
71.215 a1.521 a2.028 b 1.601 a1.585 a1.233 a1.675 b1.560 b1.492 b1.564 b1.438 a1.347 a1.662 a1.756 a1.317 a
301.600 a2.056 b1.757 a1.915 ab1.559 a1.277 a1.092 a1.376 a1.195 a1.648 b1.527 a1.626 a1.365 a1.789 a1.560 a
Amino acids12.030 a0.000 b1.835 a1.872 a1.499 a1.819 a0.055 b1.614 a1.716 a1.847 a1.362 a0.024 b1.168 a1.382 a1.421 a
71.297 a2.035 ab2.019 ab2.226 b1.815 ab1.601 a1.743 a1.931 a1.572 a1.909 a1.847 a1.546 a2.189 a1.850 a1.670 a
301.553 a1.963 ab2.146 b2.147 b2.006 ab1.616 a1.483 a1.530 a1.542 a1.684 a1.790 a1.638 a1.745 a1.751 a1.748 a
Carbohydrates11.630 a0.005 b1.566 a1.690 a1.266 a1.445 a0.044 b1.203 a1.324 a1.546 a1.016 a0.008 b0.883 a1.007 a1.071 a
71.519 a1.950 a1.827 a1.923 a1.396 a1.357 a1.619 a1.837 b1.727 ab1.675 a1.313 a1.325 a1.986 a1.644 a1.354 a
301.330 a1.830 b1.534 b1.801 b1.726 b1.346 a1.215 a1.542 a1.438 a1.671 b1.463 a1.559 a1.526 a1.641 a1.782 a
Carboxylic acids11.441 a0.000 b1.512 a1.513 a1.079 a1.469 a0.037 b1.146 a1.308 a1.413 a 0.757 a0.018 b0.748 a0.992 a0.913 a
70.945 a1.852 b1.876 b2.003 b1.510 a1.331 a1.620 a1.665 a1.728 a1.687 a1.254 a1.093 a1.880 b1.577 a1.325 a
301.124 a1.844 b1.344 a1.904 b1.377 a1.138 a0.702 a1.276 a1.275 a1.557 b1.337 a1.268 a1.335 a1.588 a1.585 a
Phenolic compounds10.896 a0.006 b0.847 a0.901 a0.678 a0.957 a0.000 b0.637 a0.797 a0.757 a0.820 a0.063 b1.173 a0.510 a0.888 a
70.313 a1.142 b0.995 b1.077 b1.864 c0.658 a1.676 b1.421 b1.576 b1.917 b0.952 a0.593 a0.881 a1.470 a1.451 a
300.886 a1.605 b1.057 a2.184 c1.836 b0.922 a0.761 a0.966 a0.881 a1.683 b1.432 a0.799 b1.408 a1.171 a0.985 a
Polymers12.182 a0.015 b1.929 a1.878 a1.621 c1.653 a0.016 b1.632 a1.643 a1.845 a1.385 a0.040 b1.378 a1.516 a1.394 a
71.522 a 2.267 b2.206 b2.240 b1.848 ab1.295 a1.848 ab1.868 ab1.451 a2.002 b1.806 a1.595 a2.243 b1.985 a1.818 a
301.550 a2.005 b2.042 b2.133 b2.227 b1.310 a1.107 a 1.348 a1.322 a1.933 b2.033 a1.880 a2.086 a 1.908 a2.069 a
Table 4. Fungal catabolic activity of self- or cross-inoculated soils during a 30-d incubation experiment. Heat-sterilized and non-inoculated soils (Val*, Rom*, Vic*) together with non-sterilized and non-reinoculated soils (Val, Rom, Vic) were taken as control treatments. At each sampling time, different letters indicate a significant (p < 0.05) difference among means (n = 3).
Substrate CategoryTime (days)Soil Treatments
VallombrosaRomolaVicarello
ValVal*Val*+ValVal*+RomVal*+VicRomRom*Rom*+RomRom*+ValRom*+VicVicVic*Vic*+VicVic*+ValVic*+Rom
Amines11.104 a0.025 b1.493 a1.806 c1.064 a1.116 a0.340 b1.388 a0.563 ab1.614 c1.314 a0.001 b1.074 a1.410 a1.132 a
71.841 a1.301 a1.409 a1.347 a1.352 a1.111 a2.013 b 1.591 a1.323 a1.197 a1.632 a1.396 a1.286 a1.381 a1.323 a
300.486 a0.869 a0.593 a1.201 b1.592 c1.466 a0.177 b1.243 a0.769 a0.670 a1.366 a1.683 a1.374 a1.677 a1.762 a
Amino acids10.894 a0.006 b1.018 a1.329 c1.154 a1.081 a0.322 b1.001 a 1.064 a1.200 a1.233 a0.000 b0.995 a0.885 a1.025 a
70.987 a0.994 a1.146 a1.332 a1.187 a1.230 a1.293 a1.361 a1.135 a1.393 a1.198 a1.138 a0.974 a1.214 a1.181 a
300.657 a1.058 a0.996 a1.164 a1.257 b1.035 a0.294 b1.157 a0.729 a1.236 a0.911 a1.364 a1.263 a1.306 a1.307 a
Carbohydrates10.900 a0.032 a0.902 a1.181 a0.971 a0.819 a0.235 a0.931 a0.869 a1.172 a1.105 a0.002 b0.927 a0.797 a0.892 a
70.853 a0.974 a0.986 a1.327 b1.167 a1.243 a1.417 a1.317 a1.222 a1.371 a1.158 a1.175 a1.155 a1.177 a1.180 a
300.515 a0.993 ab0.796 a1.075 ab1.174 b0.930 a0.165 b1.204 a1.069 a1.273 a0.750 a1.249 a1.168 a1.061 a1.077 a
Carboxylic acids11.220 a0.027 b1.200 a1.357 a1.061 a0.851 a0.353 b1.190 a1.083 a1.362 b1.183 a0.000 b1.100 a1.000 a0.996 a
71.011 a1.051 a1.132 a1.390 a1.283 a1.284 a1.503 a1.378 a1.336 a1.376 a1.255 a1.131 a1.138 a1.180 a1.214 a
300.797 a1.001 a1.049 a1.136 ab1.232 b1.086 a0.251 b1.327 a1.258 a1.532 b1.092 a1.364 a1.260 a1.382 a1.366 a
Nucleotides11.246 a0.024 b1.231 a1.580 c1.080 a1.242 a0.425 b1.045 a1.165 a1.178 a0.824 a0.000 b1.129 a0.992 a1.178 a
70.761 a0.751 a0.851 a0.995 a1.041 a1.468 a1.577 a1.448 a1.408 a1.446 a1.428 a0.977 a1.215 a1.182 a1.160 a
300.802 a0.927 a1.000 a0.933 a0.949 a1.081 a0.586 a1.468 a0.596 a0.812 a0.900 a1.389 a1.308 a1.542 a1.561 a
Polymers10.900 a0.007 b0.765 a1.233 c0.681 a0.558 a0.119 a0.734 a0.452 a1.076 a0.778 a0.000 b0.563 a0.599 a0.724 a
70.652 a0.708 a0.740 a1.357 b1.061 a1.005 a1.313 a1.208 a1.042 a1.424 a0.920 a 1.065 a1.131 a1.105 a1.166 a
300.178 a0.678 a0.459 a0.992 a1.133 b0.714 a0.137 b1.050 a0.835 a1.271 a0.488 a0.831 a0.863 a0.917 a0.923 a
Publisher’s Note: MDPI stays neutral with regard to jurisdictional claims in published maps and institutional affiliations.

