Article

The Potential of Using Radarsat-2 Satellite Image for Modeling and Mapping Wheat Yield in a Semiarid Environment

1
Laboratoire Sciences et Techniques Agronomiques (LR16 INRAT 05), INRAT, University of Carthage, Tunis 1004, Tunisia
2
Centre Eau Terre Environnement, Institut National de la Recherche Scientifique, Quebec, QC G1K 9A9, Canada
3
Department of COSIM Lab, Higher School of Communications of Tunis, University of Carthage, Tunis 1004, Tunisia
4
Department of ITI, IMT-Atlantique Bretagne-Pays de la Loire, CEDEX 03, 29238 Brest, France
5
National Agronomic Institute of Tunisia (INAT), University of Carthage, Tunis 1004, Tunisia
*
Author to whom correspondence should be addressed.
Agriculture 2022, 12(3), 315; https://doi.org/10.3390/agriculture12030315
Submission received: 23 December 2021 / Revised: 11 February 2022 / Accepted: 21 February 2022 / Published: 22 February 2022
(This article belongs to the Section Digital Agriculture)

Abstract

:
The monitoring of cereal productions, mainly through yield estimations, has played an important role in providing reliable information to decision makers in order to ensure the proper management of agricultural markets. In this context, remote sensing, which allows the coverage of large areas, is an important source of information that complements those obtained by other methods. In this study, we aim to estimate the wheat yield at an early growth stage (spring season) using only one Radarsat-2 (RS-2) polarimetric image. We propose an empirical statistical relationship between the yield measured in situ and polarimetric parameters extracted from the RS-2 image. The RS-2 image was acquired at the flowering stage as it is proved to be the most appropriate moment for yield prediction. We selected the region of Boussalem in the northwest of Tunisia as the study area. For experimental validation, the yield was determined in situ at the end of the wheat season. Results showed that the polarization ratios are more correlated than the polarimetric parameters with the grain yield with a significant correlation of the HH/VV ratio (r = 0.76) and the HV/VV ratio (r = −0.75), while the most correlated polarimetric parameter was Alpha (r = −0.51). Finally, the multiple regression has led to the development of a three-variable model (HH/VV, HV/HH, and alpha) as the best predictor of the wheat grain yields. Validation results revealed a great potential with a determination coefficient (R2) of 0.58 and root mean squared error (RMSE) of 0.89 t/ha.

1. Introduction

In Tunisia, wheat is a strategic crop and is among the most important staple foods in this semiarid country [1]. Its production deficit penalizes the country’s trade balance, as it has to be covered by annual imports of varying quantities up to 50% of national demand [2]. Yield predictions for crop cereals are important when making decisions regarding food security, especially in semiarid regions. In fact, the weather conditions of these regions are characterized by large variations in temperature and precipitation, which directly affect cereal production [3].
Over time, crop yield predictions have become an essential instrument for short-term policymaking. It is very important in the development of the annual cereal program of import and storage for a country. For this, over several years, different economic and geopolitical issues associated to agricultural yield predictions have made agricultural monitoring a priority in many research programs [4]. To predict cereal yield, many agrometeorological models are available, with different levels of complexity and empiricism [5,6]. The agrometeorological models face problems associated with the distribution of weather stations and often the scarcity of climate data. Remote sensing data can be very useful in these circumstances, due to their synoptic coverage, repetitiveness, and costeffectiveness. Remote sensing can offer a viable method of agroclimatic zoning [7] and obtaining well-distributed spatial and temporal multiscale information on critical crop parameters such as a real statistics, grain weight, leaf area index (LAI), crop nitrogen uptake and biomass [8,9,10]. Optical remote sensing imagery is commonly used to control agricultural fields [11,12,13,14,15]. However, the quality of optical data can be affected by climatic conditions such as cloudy weather, preventing their effective use in the vegetation monitoring.
Many theoretical and experimental studies in active remote sensing have shown the sensitivity of the radar backscatter coefficient to vegetation [16,17,18,19,20,21]. Thus, Synthetic Aperture Radar images are efficient to overcome some of the limitations of optical data [22]. Indeed, the existence of clouds does not influence radar acquisitions. Furthermore, SAR imagery is sensitive to the moisture content and dry matter of the crops [16,23]. In fact, the backscatter from agricultural targets is composed of surface scattering caused by the soil, volume scattering caused by vegetation and the interaction of signals bouncing from vegetation and soil. The relative contribution of each component depends on the system’s parameters and target [23]. In C-band, the echoes are generally formed of a combination of these components; in the beginning of the growing season, surface scattering is the most intense, while during the period of maximum growth, volume scattering of vegetation is the most intense. At the end of the season, there is a combination of echoes and the most intense component comes from soil vegetation [23]. For this reason, classification algorithms can be used, such as those derived from the H/A/α algorithm Cloude and Pottier [24], to identify the scattering mechanism and to facilitate the interpretation of the backscattered signal [25].
Several studies have used the relationship between polarimetric parameters and vegetation, and applied polarimetric radar imagery to map the productivity of the wheat crop. Wiseman et al. [16] investigated the polarimetric SAR response to monitor agricultural production. Jiao et al. [25] used polarimetric SAR data to detect leaf area index. Liu et al. [26] monitored the crop using the polarimetric RADARSAT-2 (RS-2) data.
In radar remote sensing, three different categories of approaches were implemented to estimate yields and parameters of vegetation cover. The first one contains theoretical approaches based on radiative transfer models [27,28,29]. Generally, they are used in order to estimate the backscattering coefficient using field data. This will help to understand scattering mechanisms. The second category deals with semiempirical models such as the “Water Cloud Model”, developed by Attema and Ulaby [30]. These models use other parameters, notably, leaf area index, height, biomass, and water vegetation content [21,29,31]. This type of model allows the estimation of surface moisture, and/or vegetation variables, but their use involves the loss of architectural information regarding the vegetation cover needed to detect the phenological stages of crops. The third category is fully empirical and based on the relationships between explained variables and explanatory satellite data. Their advantage lies in the fact that they can estimate spatial and geographical phenomena with a high degree of accuracy, provided that a variety of explanatory variables sensitive to the phenomenon under study is found. They are also inexpensive and easy to apply and integrate into large-scale agricultural management tools.
In the last decade, space-based remote sensing empirical models have become an essential tool for crop mapping and yield prediction, often based on multitemporal radar and/or optical images or UAV hyperspectral imagery. For example, Jamil, et al. [32] have shown the usefulness of UAV-based RGB imagery combined with the structure from motion (SfM) method for estimating the individual plants height of barley, and wheat. In addition, remote sensing data can be combined with meteorological data to predict cereal yields using machine-learning algorithms [33]. Fieuzal and Baup [34] have assessed the capabilities of forecasting the yield of wheat using an artificial neural network combined with multitemporal satellites, namely, the spectral reflectance (Formosat-2, and Spot 4–5 in the green, red, and near-infrared wavelength) and multiconfiguration backscattering coefficients (TerraSAR-X and RS-2 in the X- and C-bands, at co- (HH and VV) and cross-polarization bands (HV and VH)). Their results highlighted the effectiveness of using the multitemporal SAR C-band (VV and VH) data instead of optical ones to early forecast the yield before the harvest of wheat. However, few studies have explored single-date SAR images to predict crop yield at an early date of the agricultural season. The idea behind the use of one image instead of multitemporal data is that single-date image is easier to process and gives an earlier crop yield prediction before harvesting.
In this context, the aim of this paper is to suggest a cost-effective model for wheat yield estimation in the most important cereal production area in Tunisia, in the spring season. Our approach is based on the development of an empirical relationship considering a one RS-2 polarimetric SAR image at an earlier stage of the agricultural season for yield prediction and using field measurements. The novelty of this work lies in the fact that it is the first attempt to compare C-band RS-2 polarimetric data with wheat yields in an extensive agricultural system. Then we are dealing in this attempt to find the simplest and accurate model that can be easily applied by the users as well as to understand the contribution of the C-band polarimetric variables of the RS-2 satellite before moving on in future work to more complex modeling process that can combine other types of data such as meteorological data and/or optical satellite images with RS-2 C-band polarimetric data.

2. Materials and Methods

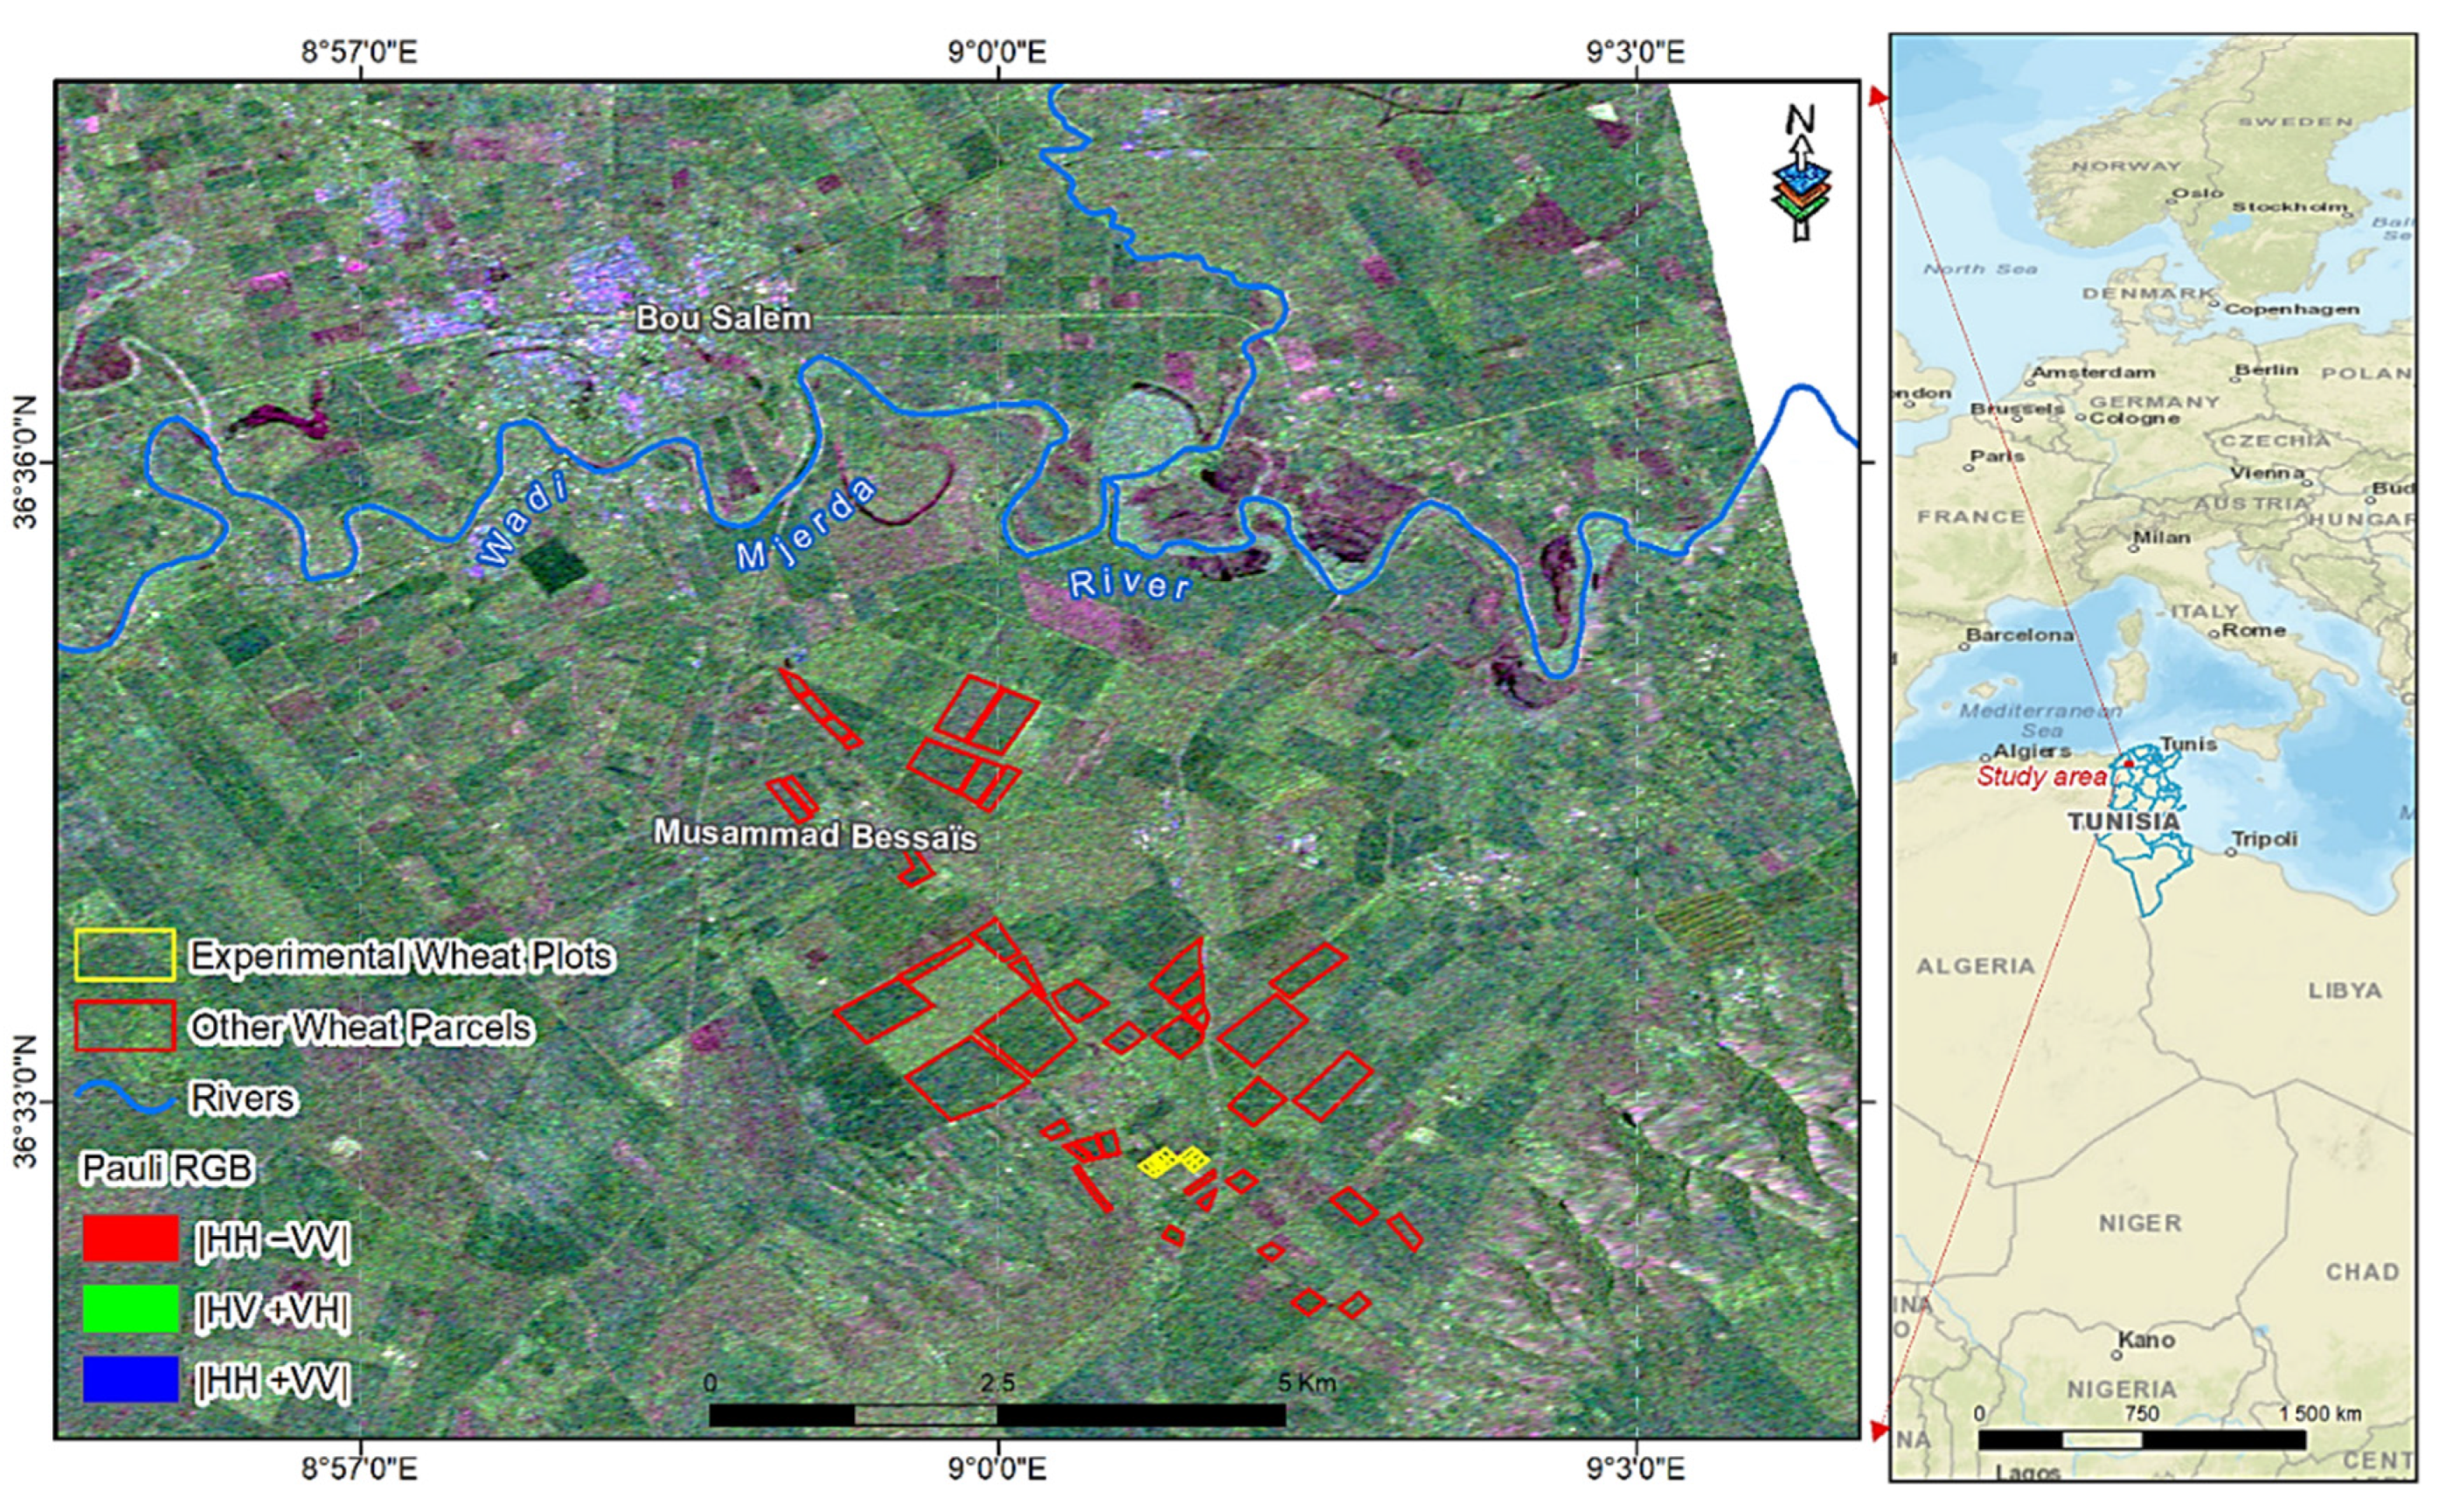
2.1. Description of the Study Area

The study area is located at the region of Boussalem in the northwest of Tunisia (36°32′51.81″ N 9°78.00′57.91″ E) (Figure 1). This region is considered to be a large cereal zone and it belongs to the semiarid upper bioclimatic zone, which is characterized by an average annual rainfall of approximately 424 mm/year. Average winter temperatures are between 5 °C and 10 °C and summer temperatures are between 25 °C and 30 °C. The landscape in this region is mainly flat and land use is dominated by cereal agriculture.

2.2. Field Data Measurement

The field values of wheat grain yield used in this study were measured at the time of harvest (June 2015). Field data was collected from 15 agricultural plots, the latitude and longitude of which were collected with a Global Positioning System (GPS). For each test plot, five replicates using the five-point sampling method was considered [35]. The yield was calculated based on the ‘density squares’ objective method, which is a popular method used in the Mediterranean region. This method is well described by Mehdaoui and Anane [36]. The yields were calculated in g/m2 and converted to t/ha. In addition, the number of stalks, the weight of the grain, and the weight of the straw were observed.

2.3. Synthetic Aperture Radar Data

The RS-2 image used for this work was acquired at the flowering stage (14 April 2015), as a single-look complex image, in Fine Quad Pol mode (HH, HV, VH, VV), with a spatial resolution of 8 m (Table 1). The Fine Quad Polarization Beam mode provides full polarimetric imaging with the same spatial resolution as the Fine Resolution Beam modes. Fine Quad Polarization Beam mode products with swath widths of approximately 25 km can be obtained over any area within the region from an incidence angle of 18 degrees to at least 49 degrees.
The flowering stage corresponds to the stage of maximum growth of the plant, when it develops three quarters of its total dry matter. The state of the plants at this stage closely depends on mineral nutrition and perspiration, which influence the final number of grains per spike. The incidence angle of the acquired image is 20°. Generally, when the angle of incidence is low, the radar is more sensitive to soil characteristics and its sensitivity to vegetation decreases. Nevertheless, at flowering stage, the vegetation is very developed and the soil component is almost absent. Moreover, according to Moran et al. [31], the radar signal is not much influenced by variations of the incidence angle after the heading stage.
Before using the RS-2 image, it was processed and prepared for the derivation of polarimetric variables. First, it was radiometrically calibrated to get the linear radar backscattering coefficients (60). In order to reduce speckle noise, a 3 × 3 BoxCar filter was used. Filtered images were formed into a scattering matrix (S2), and later converted to a 3 × 3 covariance matrix (C3), which averages the cross-polarization backscatter to a single cross-polarization value. The ASTER digital elevation model [37] was used to orthorectify the image. The image was then geocoded into a Universal Transverse Mercator (UTM) map projection.

2.4. Selection of Radar Polarimetric Parameters

The vegetation landscape produces a volume scattering. This volume is formed by the scatters of ears, leaves and stems. In order to give a precise description of vegetation, it is required to integrate the information of all the scatters. Actually, the dimensions of the scatters, their form, their orientation, their position and their dielectric properties determine the backscattering provided by a volume of scatters. Therefore, multipolarized radar measurements give a better explanation of the vegetated scene than the single-polarized measurements. Several polarimetric parameters can be found in the literature [38]. It is therefore required to evaluate their sensitivity to vegetation within a given test site. A bibliographic review of the polarimetric parameters allowed us to select nine polarimetric parameters based on their potential to be sensitive to crop biomass as mentioned in Table 2.
The results of the polarimetric decomposition RGB images of Freeman–Druden are shown in Figure 2 as blue = surface scattering, red = double bounce scattering and green = volume scattering. The green pixels represent crops with very high leaf mass, arboriculture and forest due to their high-volume backscatter, while the blue pixels represent flat surfaces, bare soil and crops with low leaf mass. The cereal plots studied represent a mixture of surface and volume backscatter.
In addition, we took into account the other parameters generated by linear and quadratic combinations of different polarizations (HH, HV, and VV). Thus, the following combinations were also included: HH*VV, HH/VV, HH+VV, HH-VV and HV/HH. Indeed, HH/VV, HV/HH and HH*VV better highlight structural differences and reduce environmental contingencies due to variations in humidity and roughness [44,45,46] HH-VV and HH+VV can discriminate scattering [47] and better characterize vegetation [48].
In total, 20 parameters were extracted from the Radarsat-2 SLC image. The correlation between the values extracted from the various polarimetric parameters and field measurements of grain yield is performed using regression tools.

2.5. Developpement of Wheat Yield Estimation Model

In the case where the number of observations is low (between 10 and 20), we must check the normality hypothesis by a quantile–quantile (Q-Q) to have a robust model. In the case where the data do not follow a normal distribution, a data transformation (e.g., log) will be necessary.
The Q-Q plot was used to check if the measured yield was normally distributed. Let Z be the number of random variables, the jth quantile is a number q(j) such that:
P   [ Z q ( j ) ] = ( j 1 2 ) n ,
if Z is standard normal, the quantiles are found by solving Equation (2):
q ( i ) 1 2 π e 1 2 Z 2 dZ = ( j 1 2 ) n .
The Pearson’s r correlation coefficient was computed to analyze the relationship between the grain yield and the polarimetric parameters and to understand the contribution of the RS-2 C-band polarimetric variables in wheat yields estimation.
Several kinds of modeling techniques can be used depending on the complexity of the phenomenon to be estimated and the available observation data and the nature and quantity of the available explanatory data; for example, deep learning models require a very large amount of training data. Other complex machine learning methods such as Partial least squares regression require a lot of predictor variables, which is not always feasible; also, some complex regression models require a particular control of the autocorrelation between the predictor variables and between these variables and other environmental variables other than crop yields, such as, in our case, plant and soil moisture content. The stepwise multiple linear regression has the advantage to be able to fine-tune the model to choose the best predictor variables from the available variable in addition to be faster. It is also able to manage both small and large amounts of predictor variables.
Then, stepwise multiple linear regression analysis was used to develop a wheat yield estimation model by exploiting the maximum information extracted from the RS-2 polarimetric parameters. The coefficient of determination (R2), relative root mean square error (RMSE), Bias, and Nash criterion (Nash) between measured grain yield and estimated grain yield were computed to assess the performance of the model.

3. Results and Discussion

3.1. Field Data Analysis

The obtained grain yield is illustrated in Table 3. The variability of grain yield is due to agricultural treatment applied for each plot (irrigation, fertilization, weed management).
For the field measurement, we first verified the normality of the measured variable.
Figure 3 shows the results of the normality test as a histogram of grain yields distribution and a normal Q-Q plot.
In conjunction with the histogram and Q-Q plot, a Shapiro–Wilk test was used to determine whether the underlying distribution was normal. Results show that the p-value = 0.785, so the null hypothesis is retained at the 0.05 level of significance. Therefore, normality can be assumed for this dataset. Additionally, the Q-Q plot shows that the grain yield data follow a normal distribution. The quantiles xi are associated with the Gaussian model.

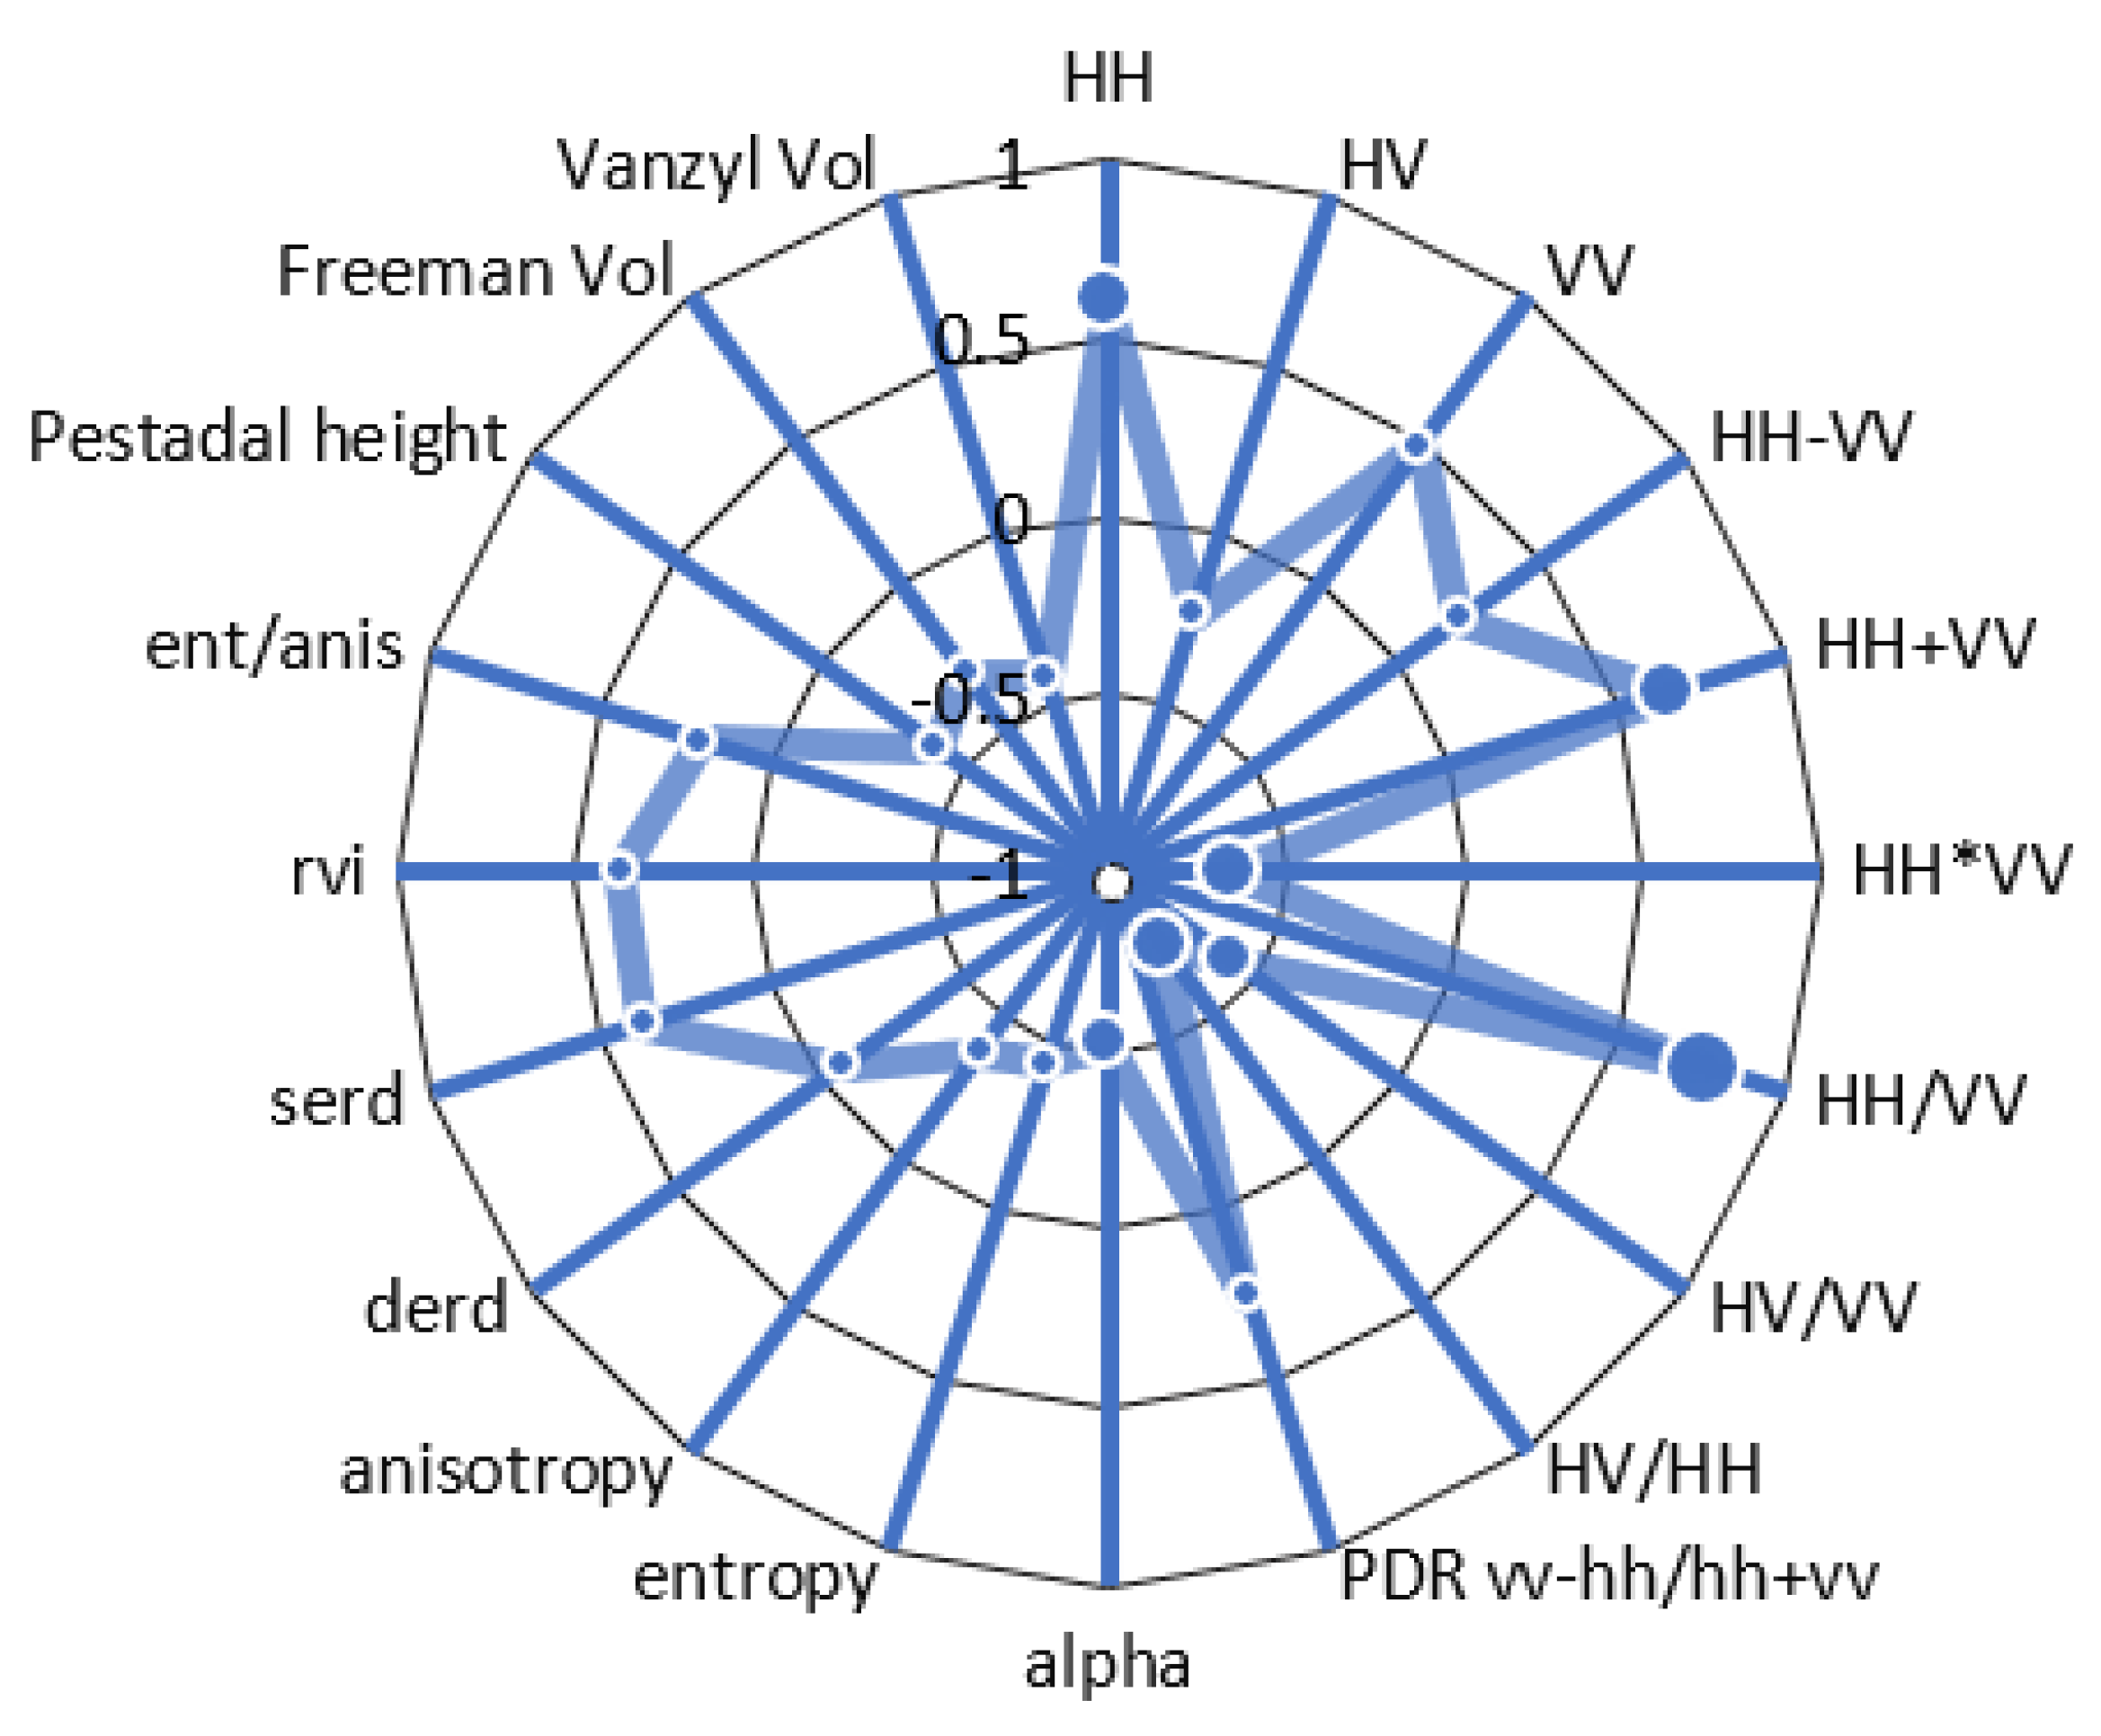
3.2. Correlation between Polarimetric Parameters and Grain Yield

Before calibrating the estimation model, we first tried to test the correlation between grain yield and polarimetric parameters. Figure 4 shows the Pearson correlation coefficient between the polarimetric parameters extracted from the image and grain yield. The results show HH, HH+VV, HH*VV, HH/VV, HV/VV, HV/HH and alpha were significantly correlated with grain yield. All correlations were significant with p < 0.05 except HV, HH-VV, RVI, DERD, Freeman Vol, PDR, entropy/anisotropy. The best correlation was observed for the HH/VV ratio (r = 0.76) and for the HV/HH ratio (r = −0.75). These results corroborate well with the work of Canisius et al. [49], who found a strong correlation of HH/VV with wheat height and wheat LAI with an R2 of 0.59 and 0.69, respectively. In their research, several polarimetric parameters (e.g., the Entropy, the Alpha angle, HH/VV and VH/VV) are strongly correlated with wheat height and LAI.
The sensitivity of the signal to the grain yield is attributed to the presence of the ear at this stage. In addition, fields with the highest grain yields had the highest number of ears per plant and the highest number of grains per ears. These two elements combined to a larger leaf area leads to increased backscattering. Furthermore, at this stage, the ear structure changes, which influence the SAR backscattering signal. According to McNairn and Brisco [17] and Patel et al. [50], the structure of vegetation influences the penetration of the wave into the canopy. The penetration proportionally increases with the wavelength and may be dependent on polarization if the canopy has components with specific orientations such as vertical needles, leaves or stalks.

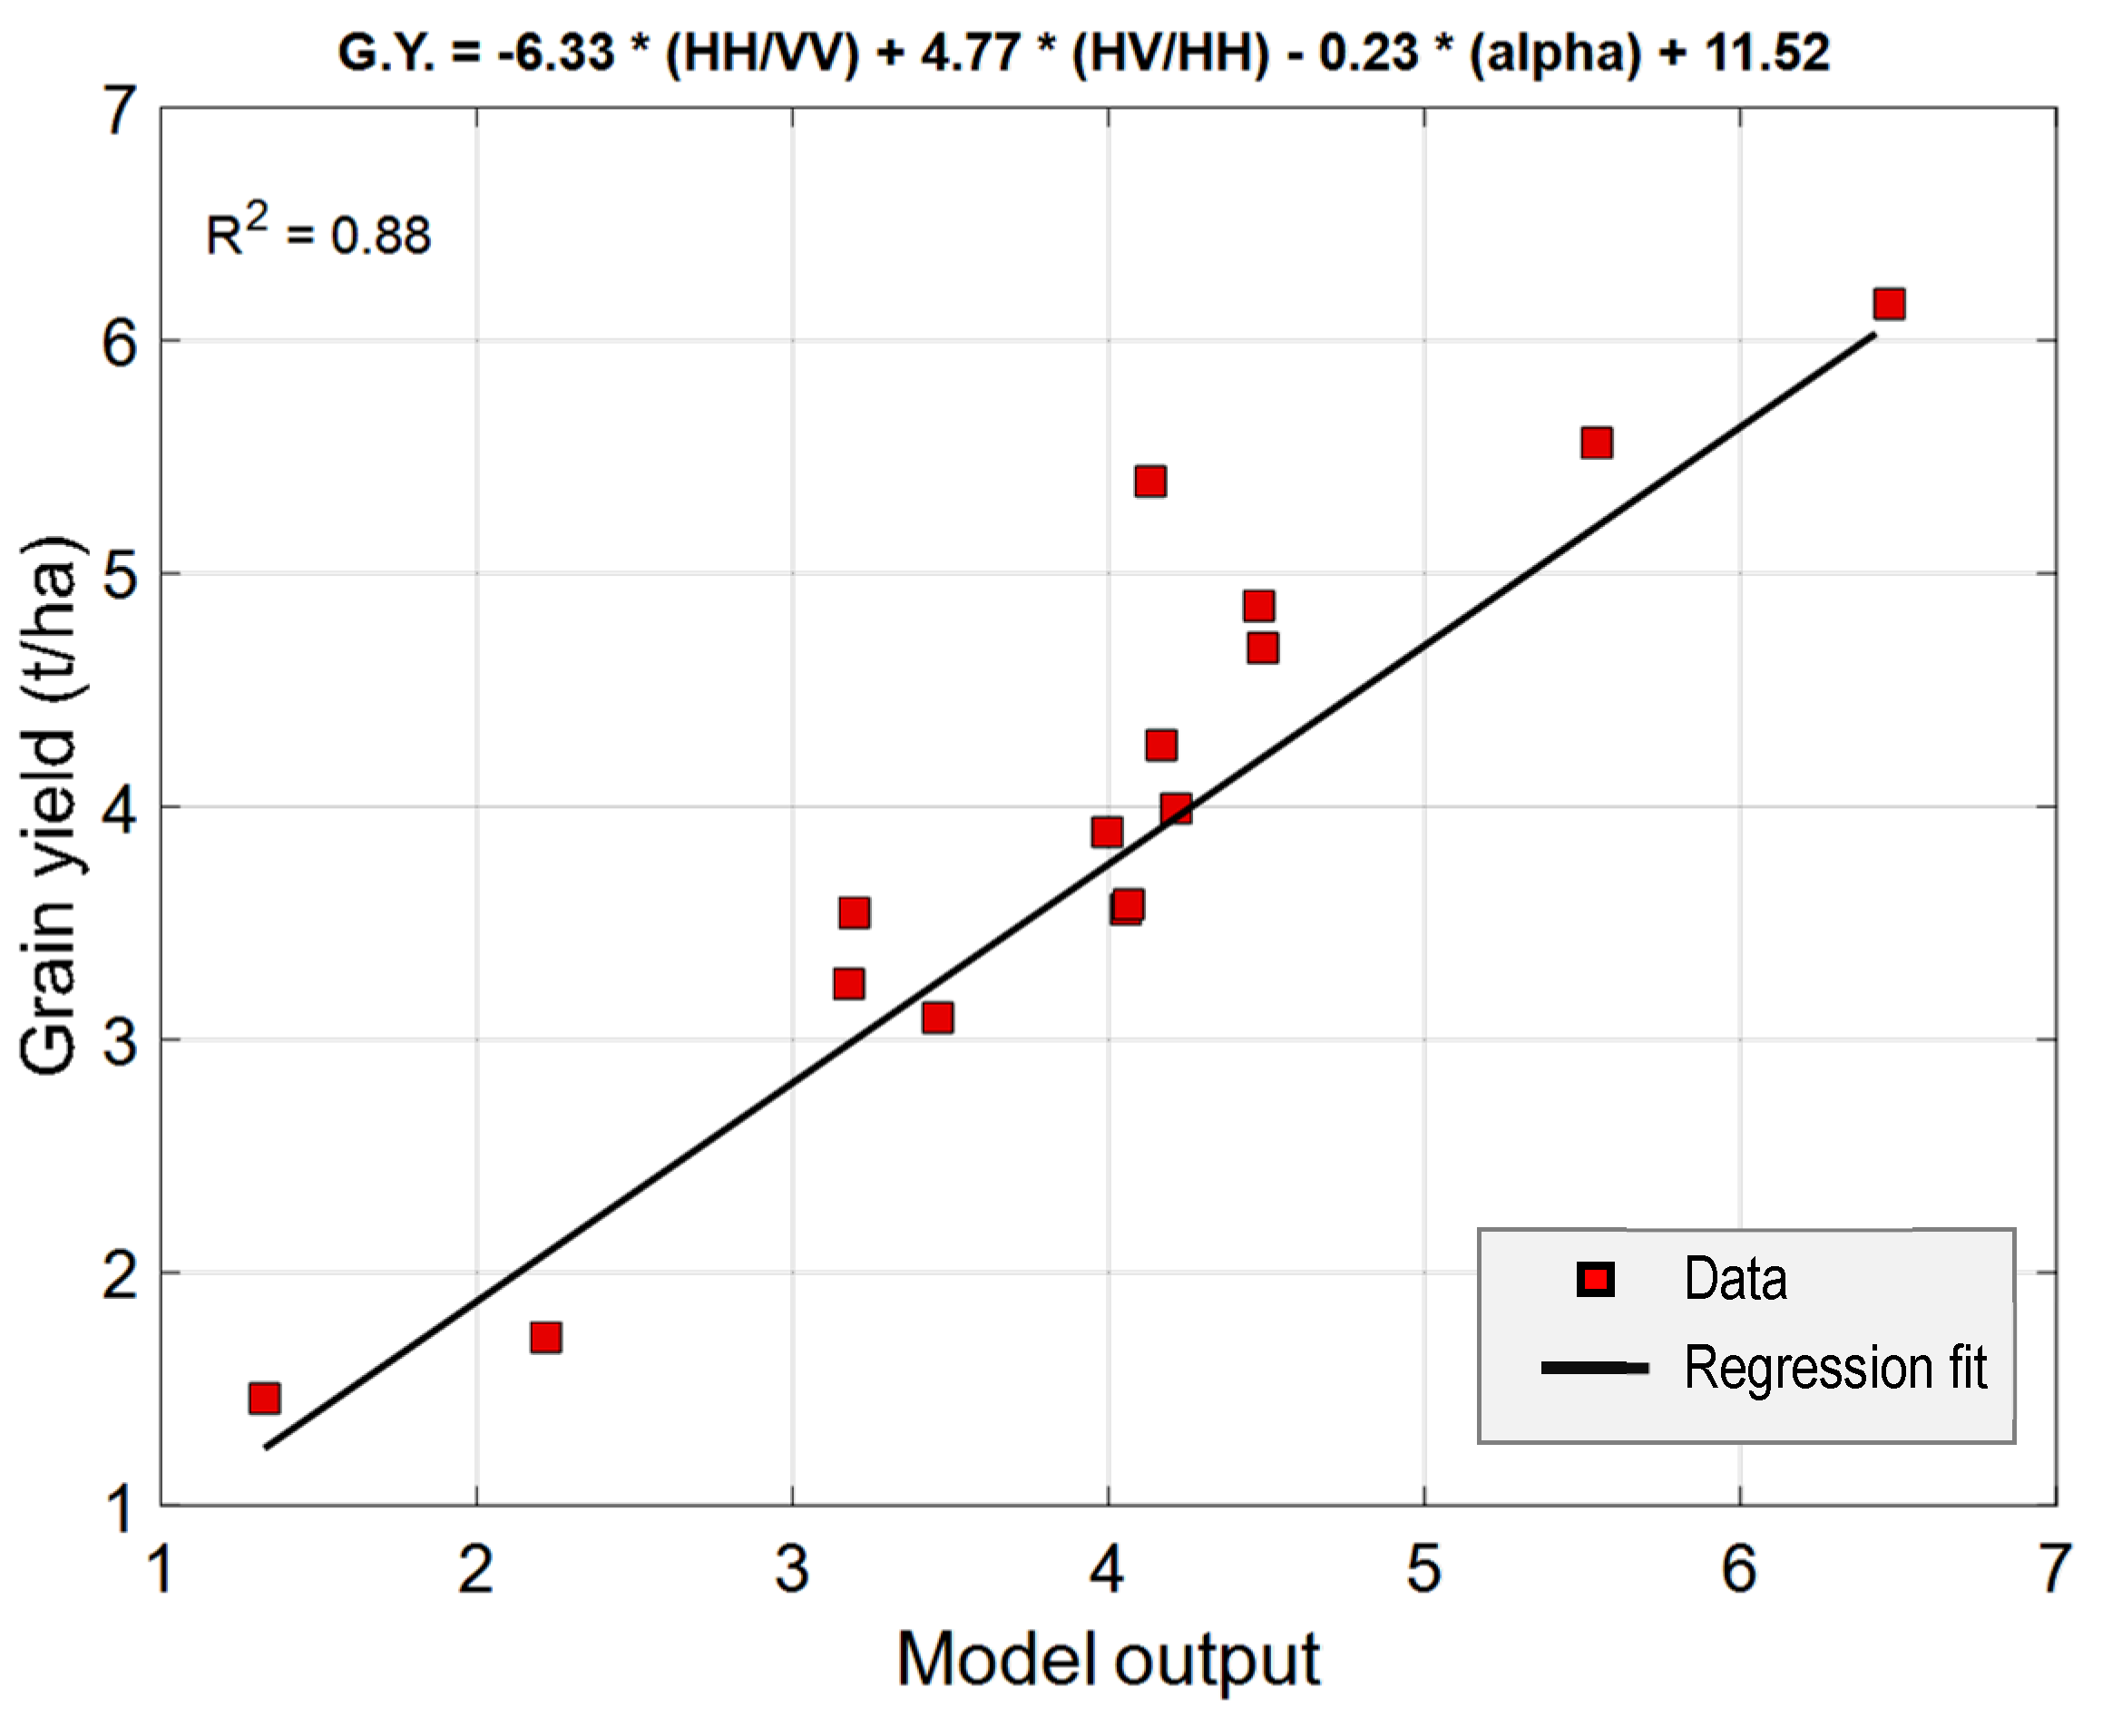
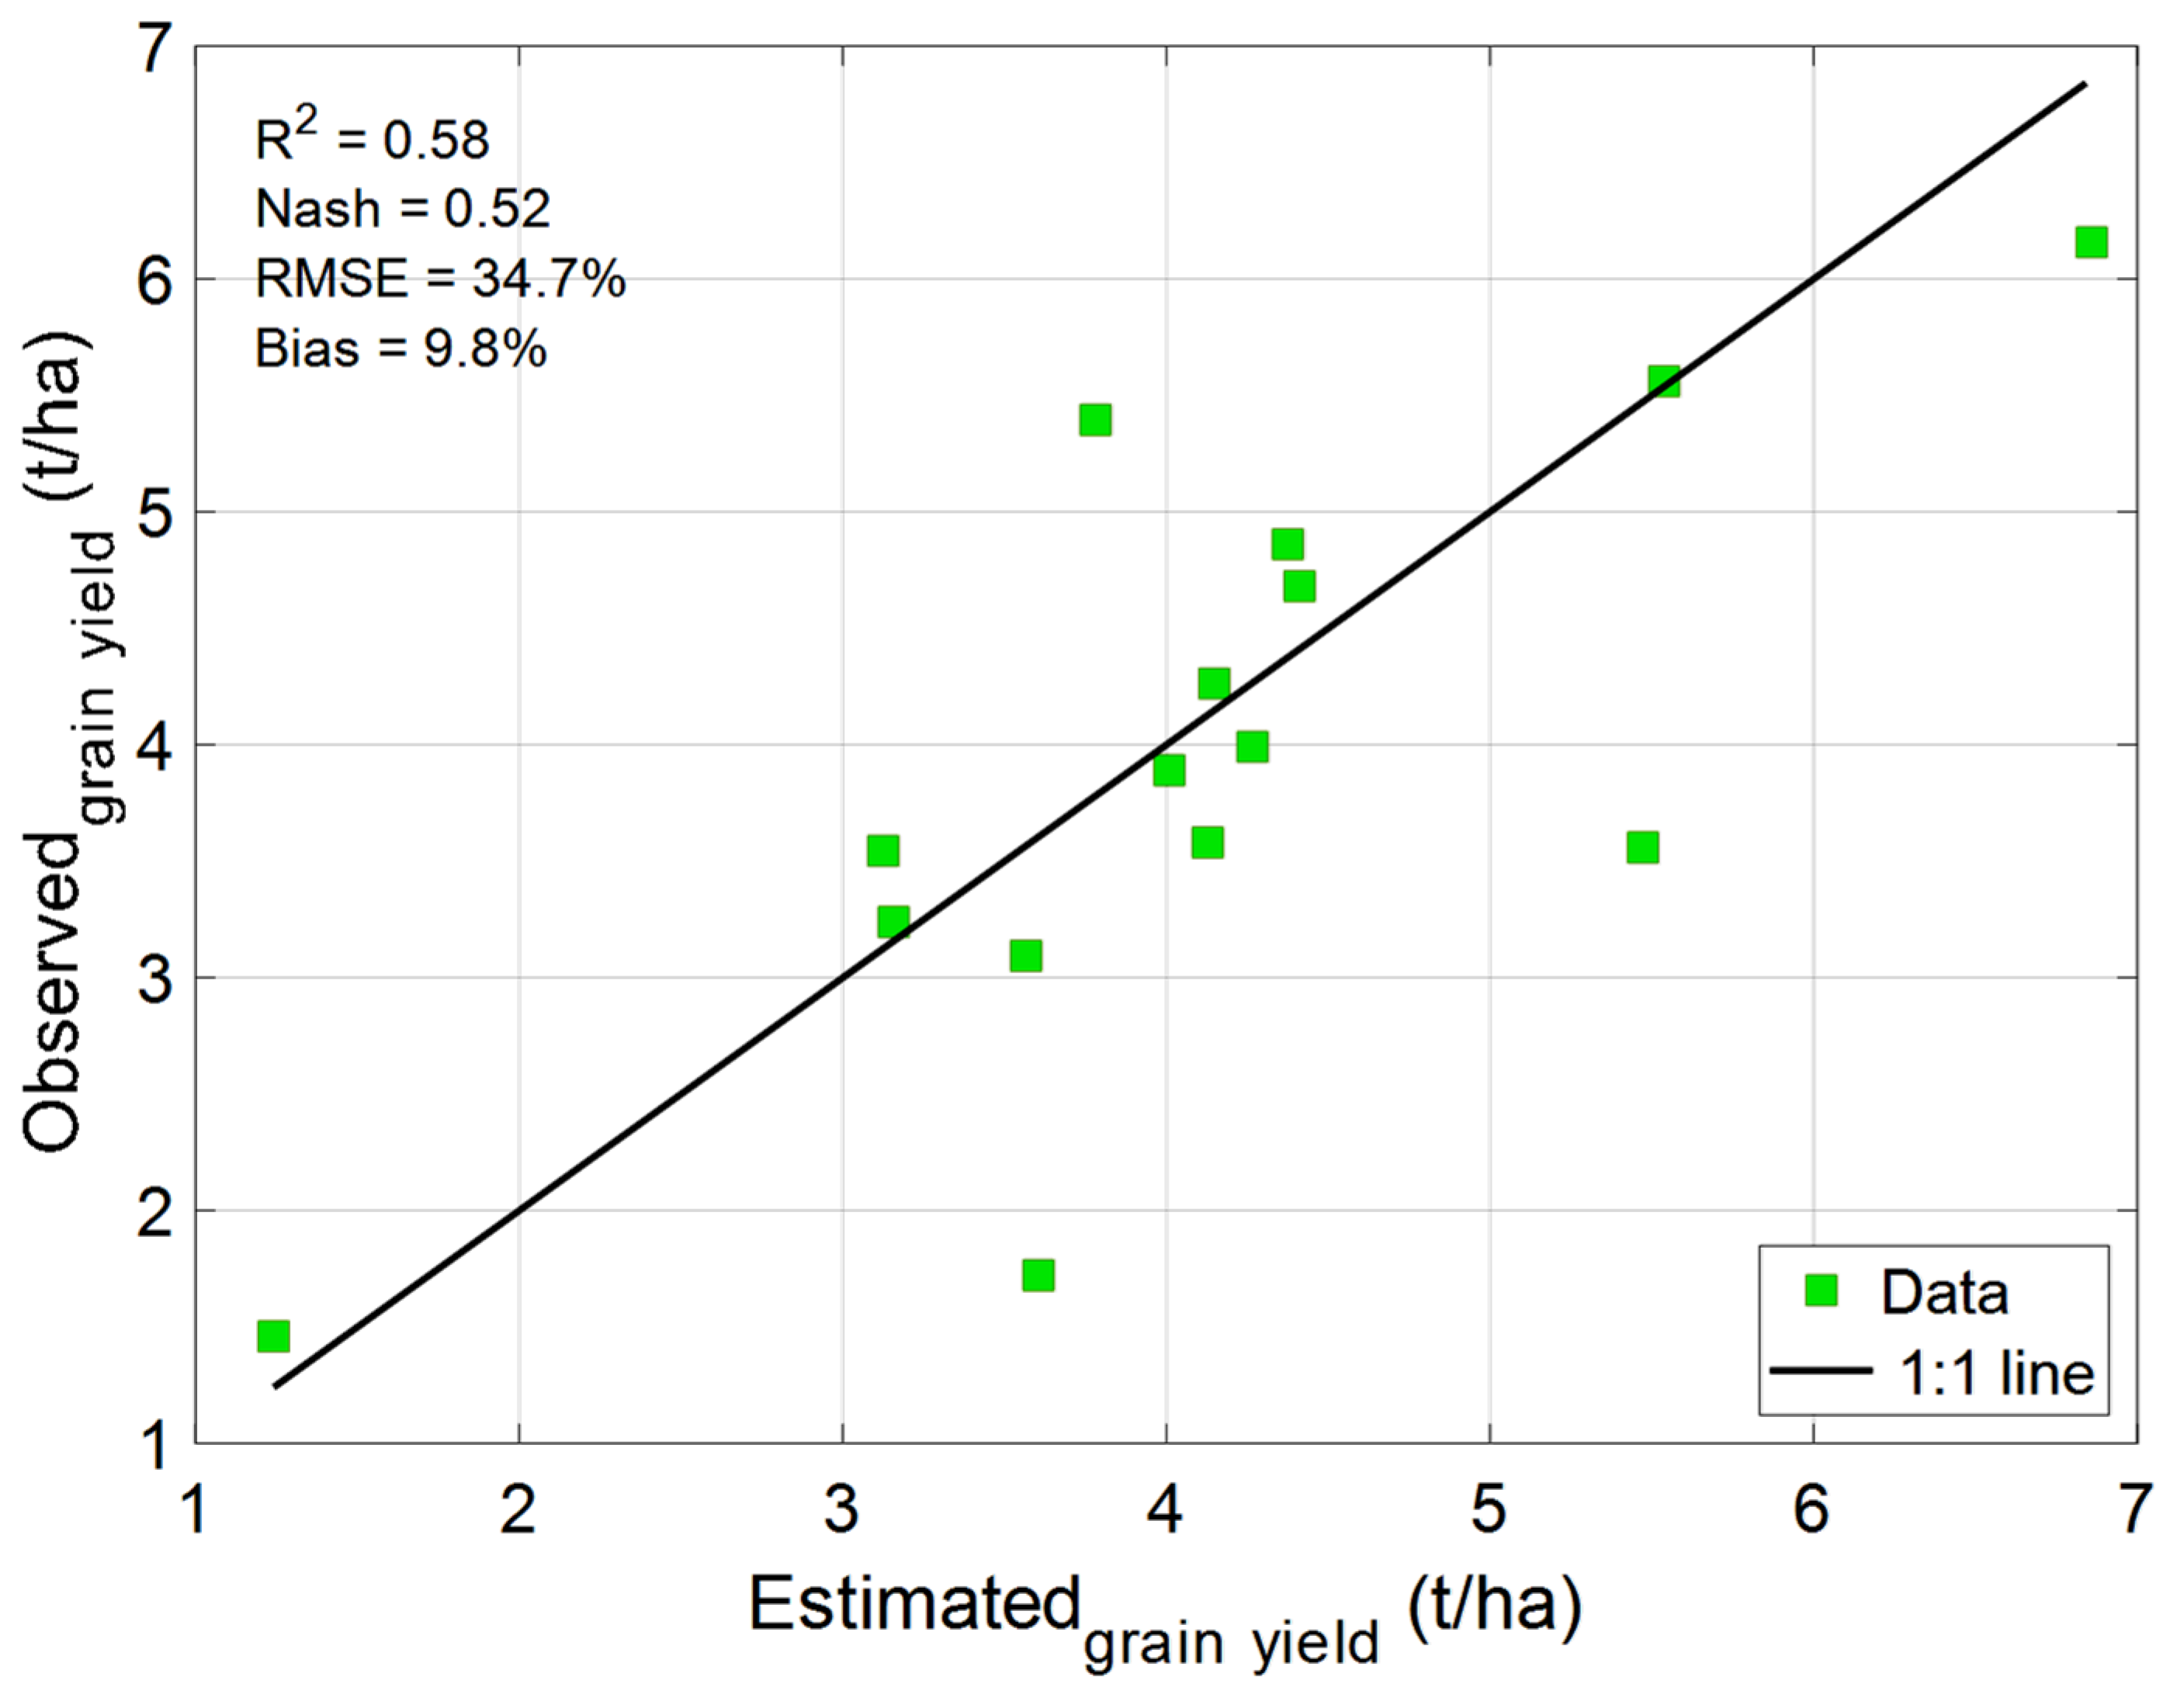
3.3. Wheat Yields Modeling

The simple regression between the grain yield and polarimetric parameters highlighted a weak relationship, the best univariate model implies HH/VV with an R2 of 0.58. Therefore, we used the multiple stepwise regression method to improve the results by exploiting the complementary information that may arise from several variables. The stepwise function allows us to calculate the correlation between the grain yield and all explicative variables (polarimetric parameters) at the same time. The variables are added to the equation one by one, using the statistical criterion to optimize the R2 of the included variables. Indeed, this step allowed us to calibrate the equation of the wheat yields estimation model using the least intracorrelated variables contributing to the most correlated regression with the yield data Figure 5 shows the results of the model calibration.
The best model implies three variables, namely HH/VV, HV/HH and alpha, as explanatory variables with a determination coefficient of 0.88. Thus, among the 20 polarimetric parameters, 3 of them explained the grain yield well at the flowering stage for the test site of Boussalem. In the case of wheat crops, grain yield is determined by several parameters, particularly at the flowering stage. In fact, flowering is a distinctive phenological event in wheat production that marks the start of grain growth in ears. Ear biomass per unit area increases over time through the increase in the number of flowering plants. Growing ears significantly affect radar backscatter signals, as their presence and increasing biomass at the top of the canopy modify crop geometry and crop moisture distribution [50,51,52]. Hence, SAR backscatter can be considered as a composite of its interaction with ears, leaves and stems, along with the moisture content of the underlying soil. At the same time, the distribution of the volume and moisture of each component of the wheat plant determines the depth of penetration of a signal into a wheat crop [21]. This justifies the explanatory variables selected by the stepwise regression. Our results are in agreement with the results of Canisius, et al. [49], when they have performed a linear regression between 25 polarimetric parameters and the 2 wheat parameters, the plant height and LAI. Only Alpha, HH/VV, VH/VV and Entropy have shown a significant correlation with both canopy parameters, while the other polarimetric parameters do not, including Anisotropy, Pedestal height, Freeman_vol, and HV/HH. By contrast, HV/HH showed a good correlation in our case with wheat grain yield, which may be due to the differences between both studies in terms of Radarsat-2 data time acquisition, soil and crop conditions. In fact, some polarimetric parameters, such as HH, VV and the surface scattering component, are influenced by the incidence angle, soil and crop conditions [49].
The alpha parameter could explain the yield because it presents the dominant mechanism and, in this case, volume backscatter is the dominant. Thus, it can be used as a good predictor for crop height and yield estimation in the late growing stages, when the backscattering are less influenced by soil and surface conditions [53], and also at the flowering stage as revealed by our study. The HH/VV ratio explained the yield well thanks to its relationship with the leaf area and biomass. According McNairn and Brisco [17], the C-band polarization ratio HH/VV at a 23° incident angle is highly related to wheat biomass during the growing season and can be used as an indicator of wheat biomass. This could be explained by the inferior sensitivity of the polarization ratio to soil moisture [17,54]. According to Balenzano, et al. [55], HH/VV and HV/HH can be used for discriminating bare soil and different vegetation heights. The results of Lin, et al. [56] showed the good estimation of sugarcane LAI using the HV/HH polarization ratio using ASAR C-band data. Using such a ratio reduces the effect of factors that may influence the absolute backscatter on the relationship with the grain yield unless these factors affect HH and HV with the same magnitude.
Figure 6 shows the validation of the model using a one-leave-out cross-validation method. Results showed a satisfactory performance of the model in grain yields estimation with an R2 of 0.58 and Nash equal to 0.52 and polarimetric parameters (R2 = 0.8). The relative RMSE is a value of 34.7%, showing that the model should be further improved in the future for operational applications in wheat program management in the study area.
In Figure 6, we noticed a slight overestimation of the model especially for two plots P3 and P7. This can be due to the variability between measured grain yield and corresponding measured biomass and stalks according to the agricultural treatment applied for each plot (irrigation, fertilization, weed management). For example, P3 and P7 showed biomass (g)/stalks measurements of 660 g/63 and 1104 g/70, respectively, which is relatively low compared to measured grain yield of 1.73 t/ha and 3.85 t/ha, respectively. This can influence the model calibration step and lead to an overestimation in the model output. Thus, we plan to design an experimental protocol in future work, to perform uncertainty analysis of the model by further controlling factors related to agricultural practice and by increasing the number of plots for calibration and for independent model validation. Our results are close to other studies used SAR data to predict wheat yield. In fact, Fieuzal and Baup [34] used C-band SAR data to forecast of wheat yield and found a R2 of 0.76. Canisius et al. [49] used Radarsat2 data and polarimetric parameters to predict wheat yield and found R2 = 0.88. Moreover, the results of our modeling are very satisfactory compared to the results of other studies in the same geographical context and using optical data, such as Mehdaoui and Anane [36]. They have used Sentinel-2 to predict yield and found a coefficient of determination R2 between 0.55 and 0.73. In addition, Chahbi et al. [15] have used Spot/HRV images to predict yield and found R2 = 0.66.

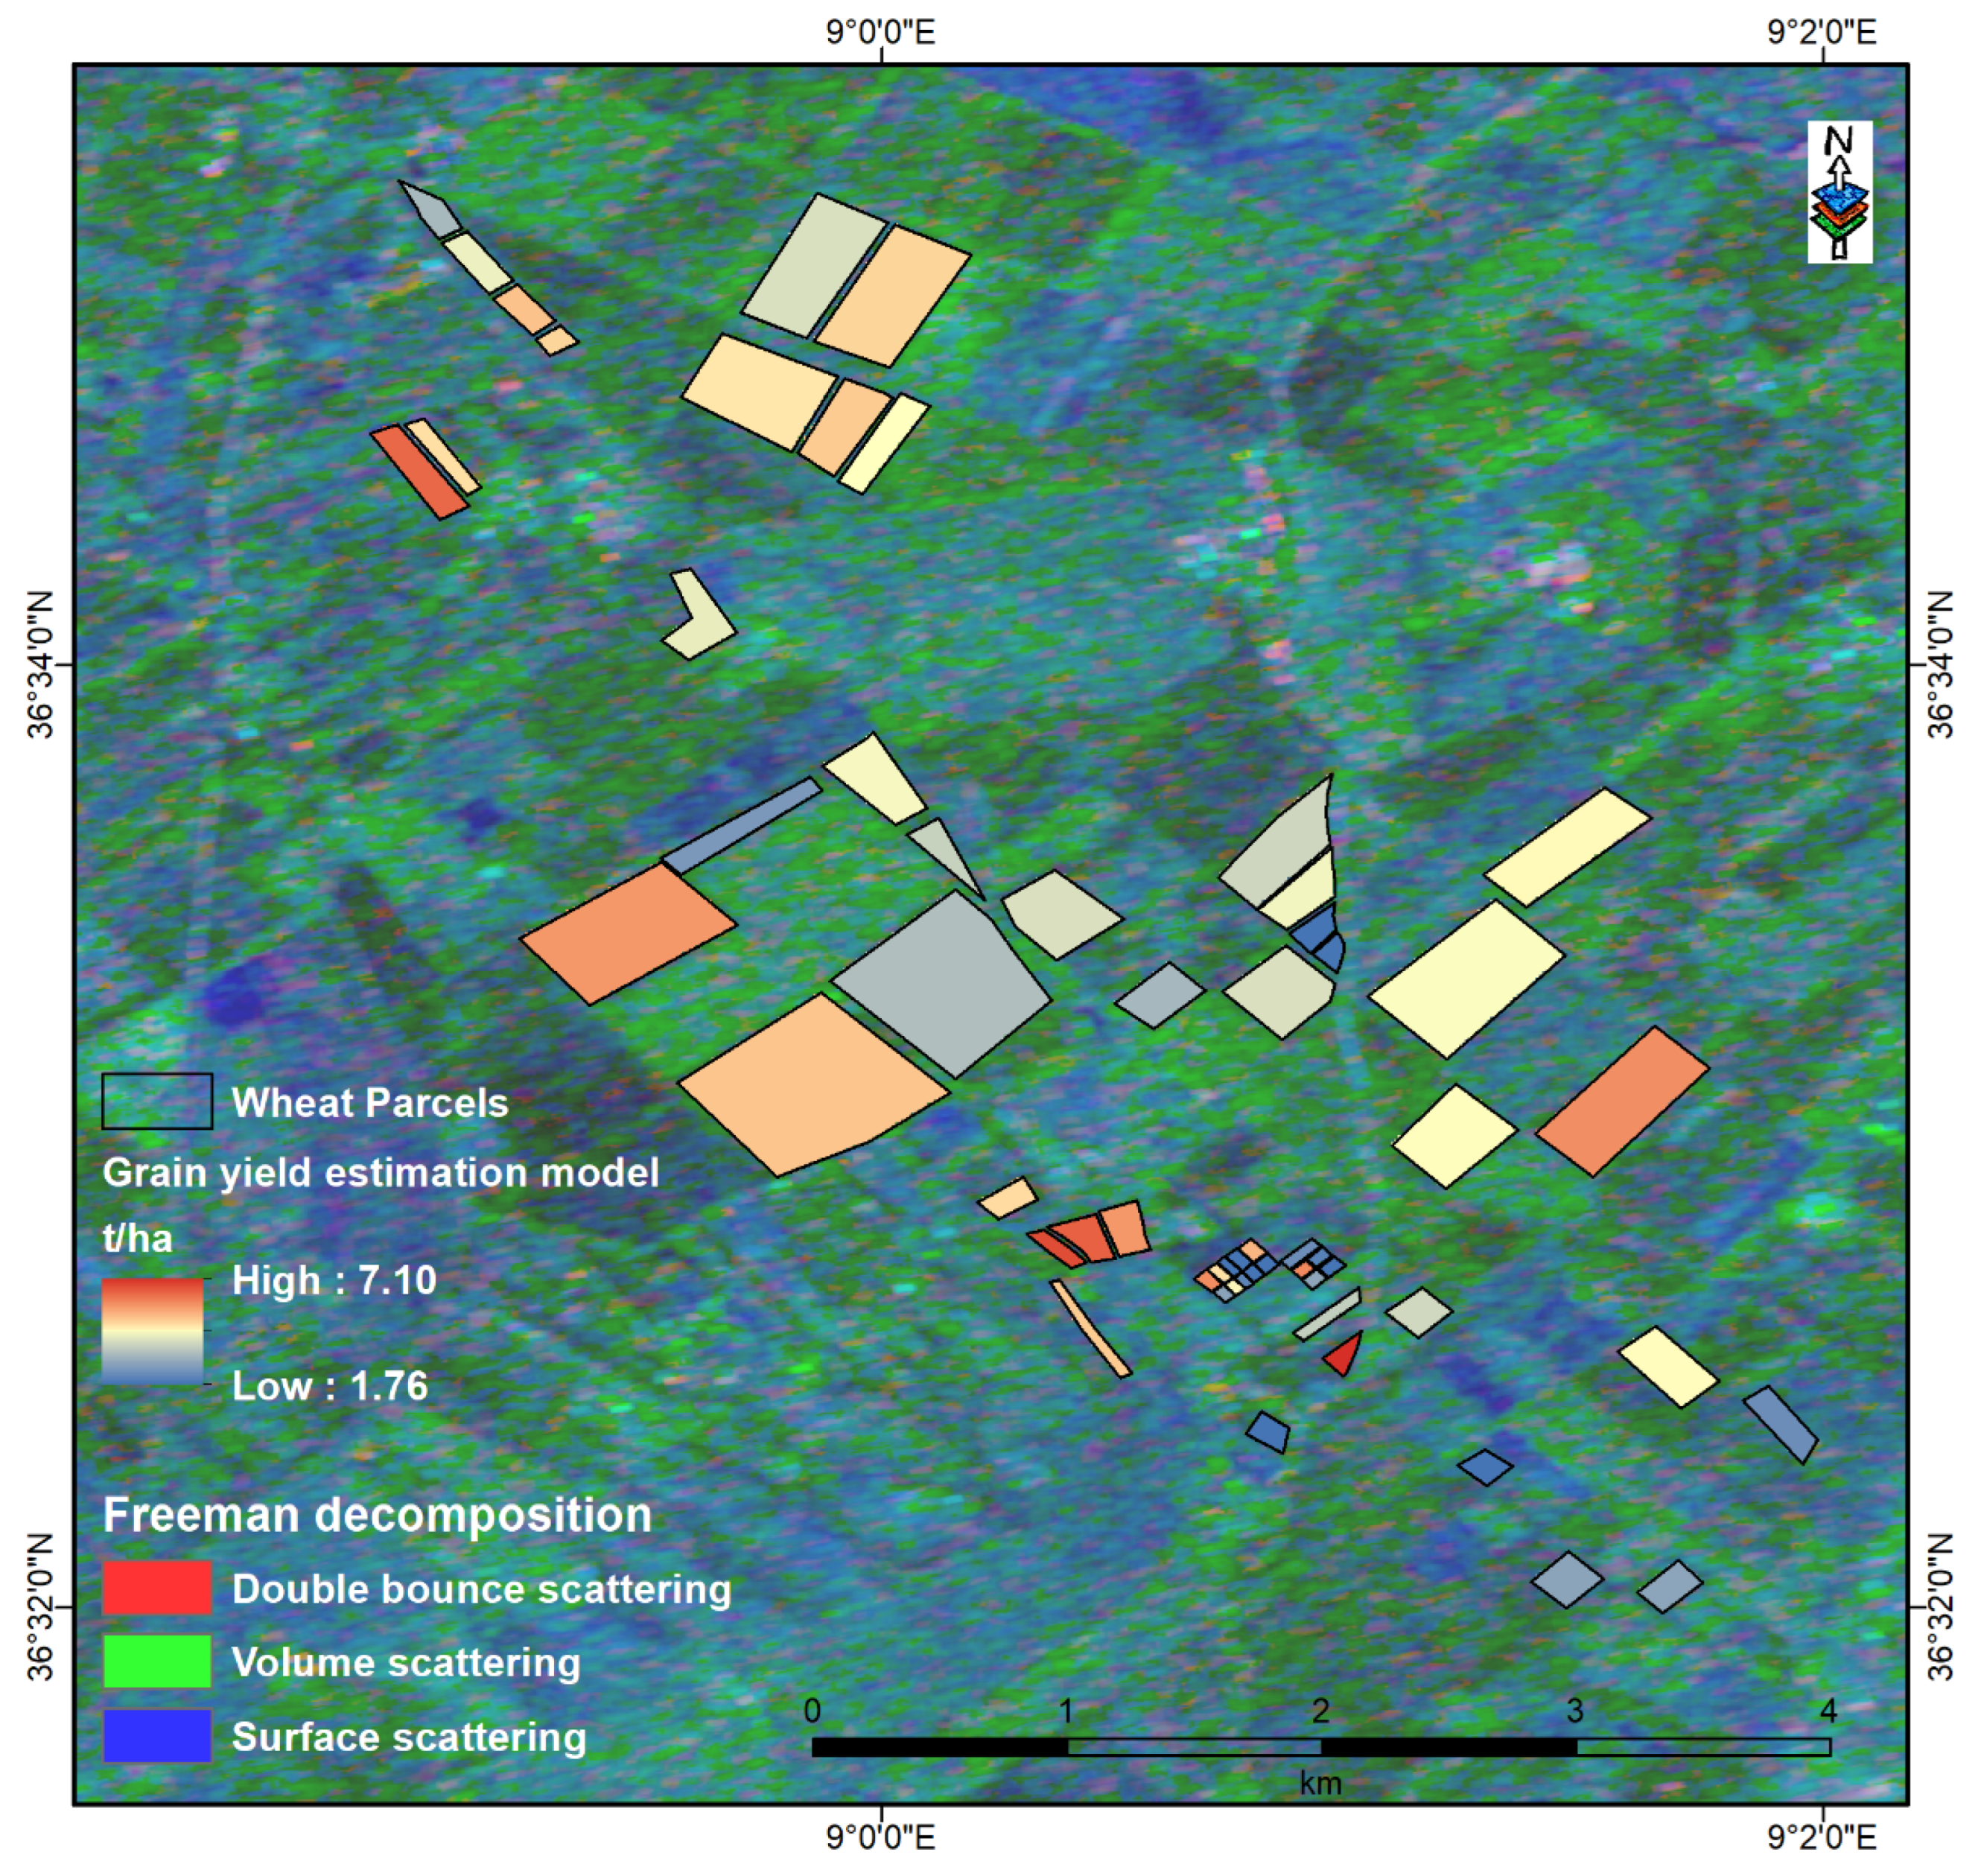
3.4. Model Application for Wheat Yields Mapping

In the last step, we applied the model to other wheat plots for which we had no yield data. We used the same Radarsat-2 images acquired in April 2015 and showing the extent of the wheat crops. Figure 7 shows the extract of the wheat yield map obtained in the Boussalem area. The wheat plots are of different soil types and agricultural practices. However, the yield map gives us an idea of the spatial distribution of the yield and the general average of the region. The yield map shows a maximum of 7.1 t/ha, a minimum of 1.76 and an average of 3.7 t/ha over 59 plots including the 15 plots used in the model calibration. The average yield of wheat obtained by our model on 59 plots is relatively in agreement with the official statistics of the governorate of Jendouba of which the region Boussalem is part of, the average yield was 2.08 t/ha in 2015 and 2.79 t/ha and 2.89 t/ha in 2014 and 2016 respectively, on all plots of the governorate.
In this study, it was shown that the use of C-band polarimetric parameters is a promising method in the development of an operational system for monitoring wheat yield in Tunisia. In addition, stepwise regression analysis using multiple polarizations appears to be a more robust approach than a simple linear regression analysis. We can therefore conclude that multipolarized radar measurements provide more information than single-polarized measurements, and that there is a high interest for polarimetry in agricultural studies. In addition, our research confirms that the flowering stage is an appropriate stage to estimate wheat grain yield in the Tunisian agricultural landscape.
The radar signal from a vegetation crop canopy depends on biomass and plant water content, plant element structure, canopy structure and underlying soil contribution [54]. All those factors are responsible for a particular polarimetric behavior, which usually changes along the growing season. Hence, multiple crop variables are required to fully explain variations in backscatter, as explained by Kim et al. [51] and Patel et al. [50]. Furthermore, a large number of wheat plots with different geographical profiles (region, farming practices and soil type) can be explored for developing a robust and regional estimation model.

4. Conclusions

The prediction of wheat yields plays an important role in providing reliable information to decisionmakers in order to ensure the proper management of the gap between annual production and consumption in Mediterranean semiarid countries, where wheat is a strategic crop and one of the most important staple foods for the population.
The aim of this study was to develop a costeffective estimation approach of the wheat yield in the flowering stage through a possible relationship between C-band RS-2 polarimetric data and grain yield. The studied SAR parameters included copolarization, cross-polarization ratios, and polarimetric variables including pedestal height, RVI, Cloude–Pottier parameters, Vanzyl and Freeman–Durden decomposition parameters. A correlation analysis between polarimetric parameters and grain yield was conducted and the Pearson’s r was computed. Results showed an interaction between the quad-polarization RS-2 data and grain yield. A correlation was observed between grain yield and several polarimetric parameters, which allowed us to investigate the sensitivity of the radar backscattering to grain yield. The highest correlation was observed for the HH/VV ratio (r = 0.76), which can be explained by the sensitivity of this parameter to the crop height and biomass. In addition to HH/VV, the results show that among the co-polarization and cross-polarization ratios, HV/HH, HH*VV, HH+VV, HH, HH/VV, and HV/VV were significantly correlated with grain yield in descending order. Concerning the polarimetric parameters, only alpha showed a strong correlation with grain yield. Furthermore, we used a stepwise regression approach to calibrate a grain yield estimation model as a function of the RS-2 polarimetric data. The result of the model calibration reveals that HH/VV, HV/HH, and alpha give the best explanatory variables combination with a coefficient of determination (R2 = 0.8). The validation of the yield estimation model with in-situ measurements by one-leave-out cross-validation shows that the result is satisfactory with a lower RMSE error (34.7%, equivalent to 0.89 t/ha), but still needs to be improved.
This study provides a new in-season tool for wheat crop yields estimation with SAR data in Boussalem region, which further improves wheat crop monitoring capability. Furthermore, the output of such kind of model can be complementary to the agrometerological forecasting models for the better crop management of Tunisian agricultural production.

Author Contributions

Conceptualization, M.B., R.A. and K.C.; methodology, M.B., H.C.M. and R.L.; software, M.B., R.L. and A.E.A.; validation, M.B., R.L. and A.E.A.; formal analysis, M.B. and R.L.; writing—original draft preparation, M.B. and R.L writing—review and editing, M.A, H.B., N.B.A., H.C.M. and R.A.; visualization, R.L.; supervision, R.A., M.A., H.B., K.C. and N.B.A.; ressources, K.C., R.A., N.B.A., M.A., H.B. and H.C.M. All authors have read and agreed to the published version of the manuscript.

Funding

This research received no external funding.

Institutional Review Board Statement

Not applicable.

Informed Consent Statement

Not applicable.

Data Availability Statement

The authors confirm that the data supporting the findings of this study are available within the article.

Acknowledgments

The authors wish to thank the national institute of cereal of Tunisia (INGC) for collaboration and support during the ground truth measurement. Thanks to the SOAR program for the Radarsat-2 image and to the Soil sciences laboratory of the Agronomic National Institute of Tunisia (INAT) for help and support.

Conflicts of Interest

The authors declare no conflict of interest.

References

  1. Sadok, W.; Schoppach, R.; Ghanem, M.E.; Zucca, C.; Sinclair, T.R. Wheat drought-tolerance to enhance food security in Tunisia, birthplace of the Arab Spring. Eur. J. Agron. 2019, 107, 1–9. [Google Scholar] [CrossRef]
  2. Khaldi, R.; Saaidia, B. Analyse de la Filière Céréalière en Tunisie et Identification des Principaux Points de Dysfonctionnement à L’origine des Pertes. Rapport de Projet FAO (GCP/RNE/004/ITA). Available online: http://www.onagri.nat.tn/uploads/Etudes/RapportIVF.pdf (accessed on 1 February 2022).
  3. Bahri, H.; Annabi, M.; Cheikh M’Hamed, H.; Frija, A. Assessing the long-term impact of conservation agriculture on wheat-based systems in Tunisia using APSIM simulations under a climate change context. Sci. Total Environ. 2019, 692, 1223–1233. [Google Scholar] [CrossRef] [PubMed]
  4. Kouadio, A.L. Prévisions des Rendements du blé d Hiver à Échelle Régionale par Modélisation de la Courbe de Chute de Œ Indice Foliaire. Ph.D. Dissertation, Université de Liège, Liège, Belgique, 2012. [Google Scholar]
  5. Esfandiary, F.; Aghaie, G.; Mehr, A.D. Wheat Yield Prediction through Agro Meteorological Indices for Ardebil District. Int. J. Agric. Biosyst. Eng. 2009, 49, 32–35. [Google Scholar]
  6. Hoogenboom, G. Contribution of agrometeorology to the simulation of crop production and its applications. Agric. For. Meteorol. 2000, 103, 137–157. [Google Scholar] [CrossRef]
  7. Zamani, A.; Sharifi, A.; Felegari, S.; Tariq, A.; Zhao, N. Agro Climatic Zoning of Saffron Culture in Miyaneh City by Using WLC Method and Remote Sensing Data. Agriculture 2022, 12, 118. [Google Scholar] [CrossRef]
  8. Fontanelli, G.; Paloscia, S.; Zribi, M.; Chahbi, A. Sensitivity analysis of X-band SAR to wheat and barley leaf area index in the Merguellil Basin. Remote Sens. Lett. 2013, 4, 1107–1116. [Google Scholar] [CrossRef] [Green Version]
  9. Mutanga, O.; Dube, T.; Galal, O. Remote sensing of crop health for food security in Africa: Potentials and constraints. Remote Sens. Appl. Soc. Environ. 2017, 8, 231–239. [Google Scholar] [CrossRef]
  10. Sharifi, A. Using Sentinel-2 Data to Predict Nitrogen Uptake in Maize Crop. IEEE J. Sel. Top. Appl. Earth Obs. Remote Sens. 2020, 13, 2656–2662. [Google Scholar] [CrossRef]
  11. Labus, M.P.; Nielsen, G.A.; Lawrence, R.L.; Engel, R.; Long, D.S. Wheat yield estimates using multi-temporal NDVI satellite imagery. Int. J. Remote Sens. 2002, 23, 4169–4180. [Google Scholar] [CrossRef]
  12. Barnes, E.M.; Pinter, P.J.; Kimball, B.A.; Wall, G.W.; LaMorte, R.L.; Hunsaker, D.J.; Adamsen, F.; Leavitt, S.; Thompson, T.; Mathius, J. Modification of CERES-Wheat to accept leaf area index as an input variable. Pap.-Am. Soc. Agric. Eng. 1997, 1. [Google Scholar]
  13. El Hachimi, J.; El Harti, A.; Ouzemou, J.-E.; Lhissou, R.; Chakouri, M.; Jellouli, A. Assessment of the benefit of a single sentinel-2 satellite image to small crop parcels mapping. Geocarto Int. 2021, 1–17. [Google Scholar] [CrossRef]
  14. Ouzemou, J.-E.; El Harti, A.; Lhissou, R.; El Moujahid, A.; Bouch, N.; El Ouazzani, R.; Bachaoui, E.M.; El Ghmari, A. Crop type mapping from pansharpened Landsat 8 NDVI data: A case of a highly fragmented and intensive agricultural system. Remote Sens. Appl. Soc. Environ. 2018, 11, 94–103. [Google Scholar] [CrossRef]
  15. Chahbi, A.; Zribi, M.; Lili-Chabaane, Z.; Duchemin, B.; Shabou, M.; Mougenot, B.; Boulet, G. Estimation of the dynamics and yields of cereals in a semi-arid area using remote sensing and the SAFY growth model. Int. J. Remote Sens. 2014, 35, 1004–1028. [Google Scholar] [CrossRef] [Green Version]
  16. Wiseman, G.; McNairn, H.; Homayouni, S.; Shang, J. RADARSAT-2 Polarimetric SAR Response to Crop Biomass for Agricultural Production Monitoring. IEEE J. Sel. Top. Appl. Earth Obs. Remote Sens. 2014, 7, 4461–4471. [Google Scholar] [CrossRef]
  17. McNairn, H.; Brisco, B. The application of C-band polarimetric SAR for agriculture: A review. Can. J. Remote Sens. 2004, 30, 525–542. [Google Scholar] [CrossRef]
  18. Mattia, F.; Toan, T.L.; Picard, G.; Posa, F.I.; Alessio, A.D.; Notarnicola, C.; Gatti, A.M.; Rinaldi, M.; Satalino, G.; Pasquariello, G. Multitemporal C-band radar measurements on wheat fields. IEEE Trans. Geosci. Remote Sens. 2003, 41, 1551–1560. [Google Scholar] [CrossRef]
  19. Cable, J.W.; Kovacs, J.M.; Jiao, X.; Shang, J. Agricultural Monitoring in Northeastern Ontario, Canada, Using Multi-Temporal Polarimetric RADARSAT-2 Data. Remote Sens. 2014, 6, 2343–2371. [Google Scholar] [CrossRef] [Green Version]
  20. Doraiswamy, P.C.; Moulin, S.; Cook, P.W.; Stern, A.J. Crop Yield Assessment from Remote Sensing. Photogramm. Eng. Remote Sens. 2003, 69, 665–674. [Google Scholar] [CrossRef]
  21. Fieuzal, R.; Baup, F.; Marais-Sicre, C. Monitoring Wheat and Rapeseed by Using Synchronous Optical and Radar Satellite Data—From Temporal Signatures to Crop Parameters Estimation. 2013. Adv. Remote Sens. 2021, 2, 162–180. [Google Scholar] [CrossRef] [Green Version]
  22. Gumma, M.K.; Thenkabail, P.S.; Muralikrishna, I.V.; Velpuri, M.N.; Gangadhararao, P.T.; Dheeravath, V.; Biradar, C.M.; Acharya Nalan, S.; Gaur, A. Changes in agricultural cropland areas between a water-surplus year and a water-deficit year impacting food security, determined using MODIS 250 m time-series data and spectral matching techniques, in the Krishna River basin (India). Int. J. Remote Sens. 2011, 32, 3495–3520. [Google Scholar] [CrossRef]
  23. Ulaby, F.T.; Allen, C.T.; Eger, G.; Kanemasu, E. Relating the microwave backscattering coefficient to leaf area index. Remote Sens. Environ. 1984, 14, 113–133. [Google Scholar] [CrossRef]
  24. Cloude, S.R.; Pottier, E. An entropy based classification scheme for land applications of polarimetric SAR. IEEE Trans. Geosci. Remote Sens. 1997, 35, 68–78. [Google Scholar] [CrossRef]
  25. Jiao, X.; McNairn, H.; Shang, J.; Pattey, E.; Liu, J.; Champagne, C. The sensitivity of RADARSAT-2 polarimetric SAR data to corn and soybean leaf area index. Can. J. Remote Sens. 2011, 37, 69–81. [Google Scholar] [CrossRef]
  26. Liu, C.; Shang, J.; Vachon, P.W.; McNairn, H. Multiyear Crop Monitoring Using Polarimetric RADARSAT-2 Data. IEEE Trans. Geosci. Remote Sens. 2013, 51, 2227–2240. [Google Scholar] [CrossRef]
  27. Picard, G.; Toan, T.L.; Mattia, F. Understanding C-band radar backscatter from wheat canopy using a multiple-scattering coherent model. IEEE Trans. Geosci. Remote Sens. 2003, 41, 1583–1591. [Google Scholar] [CrossRef]
  28. Dabrowska-Zielinska, K.; Inoue, Y.; Kowalik, W.; Gruszczynska, M. Inferring the effect of plant and soil variables on C- and L-band SAR backscatter over agricultural fields, based on model analysis. Adv. Space Res. 2007, 39, 139–148. [Google Scholar] [CrossRef]
  29. Joseph, A.T.; van der Velde, R.; O’Neill, P.E.; Lang, R.; Gish, T. Effects of corn on C- and L-band radar backscatter: A correction method for soil moisture retrieval. Remote Sens. Environ. 2010, 114, 2417–2430. [Google Scholar] [CrossRef]
  30. Attema, E.P.W.; Ulaby, F.T. Vegetation modeled as a water cloud. Radio Sci. 1978, 13, 357–364. [Google Scholar] [CrossRef]
  31. Moran, M.S.; Vidal, A.; Troufleau, D.; Inoue, Y.; Mitchell, T.A. Ku- and C-band SAR for discriminating agricultural crop and soil conditions. IEEE Trans. Geosci. Remote Sens. 1998, 36, 265–272. [Google Scholar] [CrossRef]
  32. Jamil, N.; Kootstra, G.; Kooistra, L. Evaluation of Individual Plant Growth Estimation in an Intercropping Field with UAV Imagery. Agriculture 2022, 12, 102. [Google Scholar] [CrossRef]
  33. Sharifi, A. Yield prediction with machine learning algorithms and satellite images. J. Sci. Food Agric. 2021, 101, 891–896. [Google Scholar] [CrossRef] [PubMed]
  34. Fieuzal, R.; Baup, F. Forecast of wheat yield throughout the agricultural season using optical and radar satellite images. Int. J. Appl. Earth Obs. Geoinf. 2017, 59, 147–156. [Google Scholar] [CrossRef]
  35. Jin, X.; Yang, G.; Xu, X.; Yang, H.; Feng, H.; Li, Z.; Shen, J.; Lan, Y.; Zhao, C. Combined Multi-Temporal Optical and Radar Parameters for Estimating LAI and Biomass in Winter Wheat Using HJ and RADARSAR-2 Data. Remote Sens. 2015, 7, 13251–13272. [Google Scholar] [CrossRef] [Green Version]
  36. Mehdaoui, R.; Anane, M. Exploitation of the red-edge bands of Sentinel 2 to improve the estimation of durum wheat yield in Grombalia region (Northeastern Tunisia). Int. J. Remote Sens. 2020, 41, 8986–9008. [Google Scholar] [CrossRef]
  37. Mangiarotti, S.; Mazzega, P.; Jarlan, L.; Mougin, E.; Baup, F.; Demarty, J. Evolutionary bi-objective optimization of a semi-arid vegetation dynamics model with NDVI and σ0 satellite data. Remote Sens. Environ. 2008, 112, 1365–1380. [Google Scholar] [CrossRef]
  38. Touzi, R.; Boerner, W.M.; Lee, J.S.; Lueneburg, E. A review of polarimetry in the context of synthetic aperture radar: Concepts and information extraction. Can. J. Remote Sens. 2004, 30, 380–407. [Google Scholar] [CrossRef]
  39. Kim, Y.; Zyl, J.V. On the relationship between polarimetric parameters. In Proceedings of the IGARSS 2000. IEEE 2000 International Geoscience and Remote Sensing Symposium. Taking the Pulse of the Planet: The Role of Remote Sensing in Managing the Environment. Proceedings (Cat. No.00CH37120), Honolulu, HI, USA, 24–28 July 2000; Volume 1293, pp. 1298–1300. [Google Scholar]
  40. Freeman, A.; Durden, S.L. A three-component scattering model for polarimetric SAR data. IEEE Trans. Geosci. Remote Sens. 1998, 36, 963–973. [Google Scholar] [CrossRef] [Green Version]
  41. Zyl, J.J.v. Unsupervised classification of scattering behavior using radar polarimetry data. IEEE Trans. Geosci. Remote Sens. 1989, 27, 36–45. [Google Scholar] [CrossRef]
  42. Zyl, J.J.v.; Zebker, H.A.; Elachi, C. Imaging radar polarization signatures: Theory and observation. Radio Sci. 1987, 22, 529–543. [Google Scholar] [CrossRef]
  43. Allain, S.; Lopez-Martinez, C.; Ferro-Famil, L.; Pottier, E. New eigenvalue-based parameters for natural media characterization. In Proceedings of the 2005 IEEE International Geoscience and Remote Sensing Symposium, 2005. IGARSS’05, Seoul, Korea, 29 July 2005; p. 4. [Google Scholar]
  44. Chen, J.; Lin, H.; Huang, C.; Fang, C. The relationship between the leaf area index (LAI) of rice and the C-band SAR vertical/horizontal (VV/HH) polarization ratio. Int. J. Remote Sens. 2009, 30, 2149–2154. [Google Scholar] [CrossRef]
  45. Gosselin, G. L’utilisation de la Polarimétrie Radar et de la Décomposition de Touzi pour la Caractérisation et la Classification des Physionomies Végétales des Milieux Humides: Le cas du lac Saint-Pierre; Universite de Montreal: Montreal, QC, Canada, 2013. [Google Scholar]
  46. Ullmann, T.; Schmitt, A.; Jagdhuber, T. Two component decomposition of dual polarimetric HH/VV SAR data: Case study for the tundra environment of the Mackenzie Delta region, Canada. Remote Sens. 2016, 8, 1027. [Google Scholar] [CrossRef] [Green Version]
  47. Ji, K.; Wu, Y. Scattering mechanism extraction by a modified cloude-pottier decomposition for dual polarization SAR. Remote Sens. 2015, 7, 7447–7470. [Google Scholar] [CrossRef] [Green Version]
  48. Kasischke, E.S.; Smith, K.B.; Bourgeau-Chavez, L.L.; Romanowicz, E.A.; Brunzell, S.; Richardson, C.J. Effects of seasonal hydrologic patterns in south Florida wetlands on radar backscatter measured from ERS-2 SAR imagery. Remote Sens. Environ. 2003, 88, 423–441. [Google Scholar] [CrossRef]
  49. Canisius, F.; Shang, J.; Liu, J.; Huang, X.; Ma, B.; Jiao, X.; Geng, X.; Kovacs, J.M.; Walters, D. Tracking crop phenological development using multi-temporal polarimetric Radarsat-2 data. Remote Sens. Environ. 2018, 210, 508–518. [Google Scholar] [CrossRef]
  50. Patel, P.; Srivastava, H.S.; Panigrahy, S.; Parihar, J.S. Comparative evaluation of the sensitivity of multi-polarized multi-frequency SAR backscatter to plant density. Int. J. Remote Sens. 2006, 27, 293–305. [Google Scholar] [CrossRef]
  51. Kim, Y.; Jackson, T.; Bindlish, R.; Lee, H.; Hong, S. Radar Vegetation Index for Estimating the Vegetation Water Content of Rice and Soybean. IEEE Geosci. Remote Sens. Lett. 2012, 9, 564–568. [Google Scholar] [CrossRef]
  52. Forkuor, G.; Conrad, C.; Thiel, M.; Ullmann, T.; Zoungrana, E. Integration of Optical and Synthetic Aperture Radar Imagery for Improving Crop Mapping in Northwestern Benin, West Africa. Remote Sens. 2014, 6, 6472–6499. [Google Scholar] [CrossRef] [Green Version]
  53. Xiaodong, H.; Jinfei, W.; Jiali, S. Simplified adaptive volume scattering model and scattering analysis of crops over agricultural fields using the RADARSAT-2 polarimetric synthetic aperture radar imagery. J. Appl. Remote Sens. 2015, 9, 096026. [Google Scholar] [CrossRef]
  54. Oh, Y. Quantitative retrieval of soil moisture content and surface roughness from multipolarized radar observations of bare soil surfaces. IEEE Trans. Geosci. Remote Sens. 2004, 42, 596–601. [Google Scholar] [CrossRef]
  55. Balenzano, A.; Mattia, F.; Satalino, G.; Davidson, M.W.J. Dense Temporal Series of C- and L-band SAR Data for Soil Moisture Retrieval Over Agricultural Crops. IEEE J. Sel. Top. Appl. Earth Obs. Remote Sens. 2011, 4, 439–450. [Google Scholar] [CrossRef]
  56. Lin, H.; Chen, J.; Pei, Z.; Zhang, S.; Hu, X. Monitoring Sugarcane Growth Using ENVISAT ASAR Data. IEEE Trans. Geosci. Remote Sens. 2009, 47, 2572–2580. [Google Scholar] [CrossRef]
Figure 1. Location of the study area; background image RGB = (HH-VV, HV+HV, HH+VV) derived from SAR image acquired on 14 April 2015 over Boussalem Region.
Agriculture 12 00315 g001
Figure 2. Polarimetric decomposition of Freeman–Druden over the study site (Boussalem); background image RGB = (Freeman_Dbl, Freeman_vol, Freeman_surf) derived from the SAR image acquired on 14 April 2015.
Agriculture 12 00315 g002
Figure 3. Histogram of the grain yields distribution and Q-Q plot.
Agriculture 12 00315 g003
Figure 4. Pearson’s coefficient of correlation between grain yield and polarimetric parameters studied.
Agriculture 12 00315 g004
Figure 5. The model calibration.
Agriculture 12 00315 g005
Figure 6. Assessment of the model performance using the cross-validation.
Agriculture 12 00315 g006
Figure 7. Wheat yield map obtained from the model; background image RGB = (Freeman_Dbl, Freeman_vol, Freeman_surf) derived from SAR image acquired on 14 April 2015 over Boussalem Region.
Agriculture 12 00315 g007
Table 1. Detailed information of the RADARSAT-2 satellite image used in the study.
Acquisition DateSpatial ResolutionPolarizationIncidence AngleModePassProduct
14 April 20158 mHH-HV-VV-VH20.9°FQ3ASLC
Table 2. Description of the polarimetric parameters selected.
Polarimetric ParametersDescriptionReference
Entropy (H)Represents the random behavior of the global scattering.[24]
Anisotropy (A)Shows the distribution of the two smallest eigen values, in other words, the importance of secondary scattering mechanisms.[24]
Alpha (α)Represents the average dominant scattering mechanism. It is calculated from values and eigenvectors of the coherency matrix.[24]
Radar vegetation index (RVI)RVI is a useful parameter to separate vegetated and none vegetated areas. RVI values for agricultural regions range from 0.3 to 0.6. It is important to mention that wheat shows the highest RVI of around 0.6 within the crop classes.[39]
Freeman-Durden VolA statistical model-based decomposition that has better stability in convergence and preserves the dominant scattering mechanism of each class. In this decomposition, the image pixels are divided into three categories: surface (s), volume (v) and double bounce (d) scattering. The volume scattering component is used in this study.[40]
Van Zyl VolVanzyl has proposed this decomposition method of the covariance matrix (C) as odd-bounce (surface, even-bounce (double bounce) or diffuse (volume) scatters). The volume scattering component is used in this study.[41]
Pedestal heightPedestal height is an indicator of the presence of an unpolarized scattering component, and thus the degree of polarization of a scattered wave. Signatures with significant pedestals heights are described by targets that are dominated with volume scattering or multiple-surface scattering.[42]
DERDDerived from the eigenvalues of the coherence matrix and used to describe the relative relationship between two types of scatters.[43]
SERDDerived from the eigenvalues of the coherence matrix based on the reflection symmetry hypothesis and used to describe a single type of scatters.[43]
Table 3. Summary of the plots feature.
PlotField SizeBiomass (g)Number of StalksGrain Yield (t/ha)MinMaxCV *SD *
P140 m × 30 m1184873.2383.053.420.051.62
P240 m × 30 m1136773.5443.113.950.082.88
P340 m × 30 m660631.7221.621.920.110.86
P450 m × 50 m800421.4591.031.940.203.05
P550 m × 70 m1128923.8903.544.440.062.41
P620 m × 50 m1368844.8614.395.270.062.96
P730 m × 60 m1104703.5803.294.650.062.37
P840 m × 30 m1200784.6813.784.220.031.24
P940 m × 60 m1208873.9903.724.720.083.53
P1040 m × 70 m1188934.2623.984.570.052.21
P1150 m × 40 m11081005.3944.975.780.052.88
P1250 m × 30 m1320903.0932.683.490.072.2
P1340 m × 30 m1396903.5583.263.910.052.09
P1440 m × 30 m15801296.1575.716.830.074.41
P1550 m × 30 m19281025.5605.225.940.053
* SD = standard deviation; * CV = coefficient of variation.
Publisher’s Note: MDPI stays neutral with regard to jurisdictional claims in published maps and institutional affiliations.

