Article

The Design and Experimentation of EVPIVS-PID Harvesters’ Header Height Control System Based on Sensor Ground Profiling Monitoring

1
College of Mechanical and Electrical Engineering, Hainan University, Haikou 570228, China
2
College of Mechanical and Electrical Engineering, Qingdao Agricultural University, Qingdao 266109, China
*
Author to whom correspondence should be addressed.
These authors contributed equally to this work.
Agriculture 2022, 12(2), 282; https://doi.org/10.3390/agriculture12020282
Submission received: 22 January 2022 / Revised: 11 February 2022 / Accepted: 14 February 2022 / Published: 16 February 2022
(This article belongs to the Section Agricultural Technology)

Abstract

:
In this paper, an adaptive header height control system is designed. Through the influence of the natural frequency, ω n , and damping ratio, ζ , on the system’s dynamic index, the optimal hydraulic cylinder parameters are determined comprehensively. The ground profiling monitoring mechanism and the header height feedback mechanism based on the angle sensor are designed. An integrated electromagnetic proportional valve was installed to replace the original header-controlled, electronically-controlled reversing valve, and a PWM (pulse width modulation) control-simulated counterweight test was performed. The limitation of traditional PID facing the integral saturation state is analysed, and a new EVPIVS-PID algorithm is proposed and simulated. Through the analysis of multiple groups of sample data in the field test, the accuracy of the control system in the header height control and output PWM value is demonstrated. The effectiveness of the EVPIVS-PID control algorithm to change the corresponding PID parameters based on the monitoring operation speed is analysed and demonstrated. Experiments show that the adaptive control system of header height based on ground profiling has a stable control effect. The height error of cutting stubble is not more than 2 cm, which can meet the requirements of a 5–11 km/h harvesting speed in plain areas.

1. Introduction

In grain harvesting operations, 75% of the harvest losses are caused by improper height adjustment of the cutting table [1,2,3]. If the harvester header is too high, the stubble height will increase, which will aggravate the loss of harvesting links [4,5], and even affect the subsequent seeding quality. If the header is too low, it will easily cause the header to scratch the ground and damage the machine. With the increasing speed of grain combine harvesting operations, the way drivers manually adjust harvester parameters has been unable to meet the current harvester needs [6]. The adaptive control function of the header has been regarded as an effective method to reduce the harvest loss, reduce the driver’s work intensity, and avoid the damage of the header equipment [7].
In the 1970s, many foreign combine harvester companies began to develop automatic header control systems [8]. The Canadian company Syfogg used the magnetic suction sensing mechanism, relying on the control principle of the swing of the fan-shaped iron plate to attract the corresponding contacts, and to pull in the circuit to generate the action. This technology was first deployed in the MF-860 combine harvester model [9]. In terms of theoretical research, Andrew G. [10,11] established a combine harvester header height control system model and used frequency domain analysis tools to demonstrate that the mechanical configuration and electro-hydraulic drive of the header affects the open-loop transfer function of the system. In terms of a control algorithm, Xie Y. [12] introduced a two-degree-of-freedom (DOF) controller for combine harvester header height control (HHC). To ensure a closed-loop stability and robust performance, the feedback loop is also enhanced with a feedforward control structure, based on global positioning system (GPS) information; but this technique requires a high-controller hardware configuration [13,14]. In terms of structural design, Chen J [15] of Jiangsu University in China estimated the height of the header through the position of the hydraulic cylinder and used the discrete PID control method for automatic control, and the control accuracy was within the range of ±25 mm. Wei Liguo [16] from the China Academy of Agricultural Mechanization Science obtained the height information of the header through the angle sensor and the displacement sensor that detects the expansion and contraction of the oil cylinder of the header. The PID control algorithm was used to realise the micro-topography profiling, and the control error of the header height was not greater than 25 mm. Zhang C [17] from Southeast University in China used ultrasonic arrays and binocular visual detection to monitor the height of crop headers, but cutting stubble and weeds interfered with the ultrasonic signals to a certain extent, and this was only tested on flat roads.
In this paper, a header height adaptive control system based on ground profiling monitoring is developed based on the existing vehicle models. The rest of the paper is organised as follows: The first part of the second chapter summarises the hardware structure of the control system, and the second part explains the working principle of the system. The third and fourth parts discuss the hydraulic part; the fifth part proposes an EVPIVS-PID control algorithm; the sixth part carries out the simulation analysis; and the seventh and eighth chapters design the verification test. The third chapter is the analysis and discussion of all the experimental results.

2. Materials and Methods

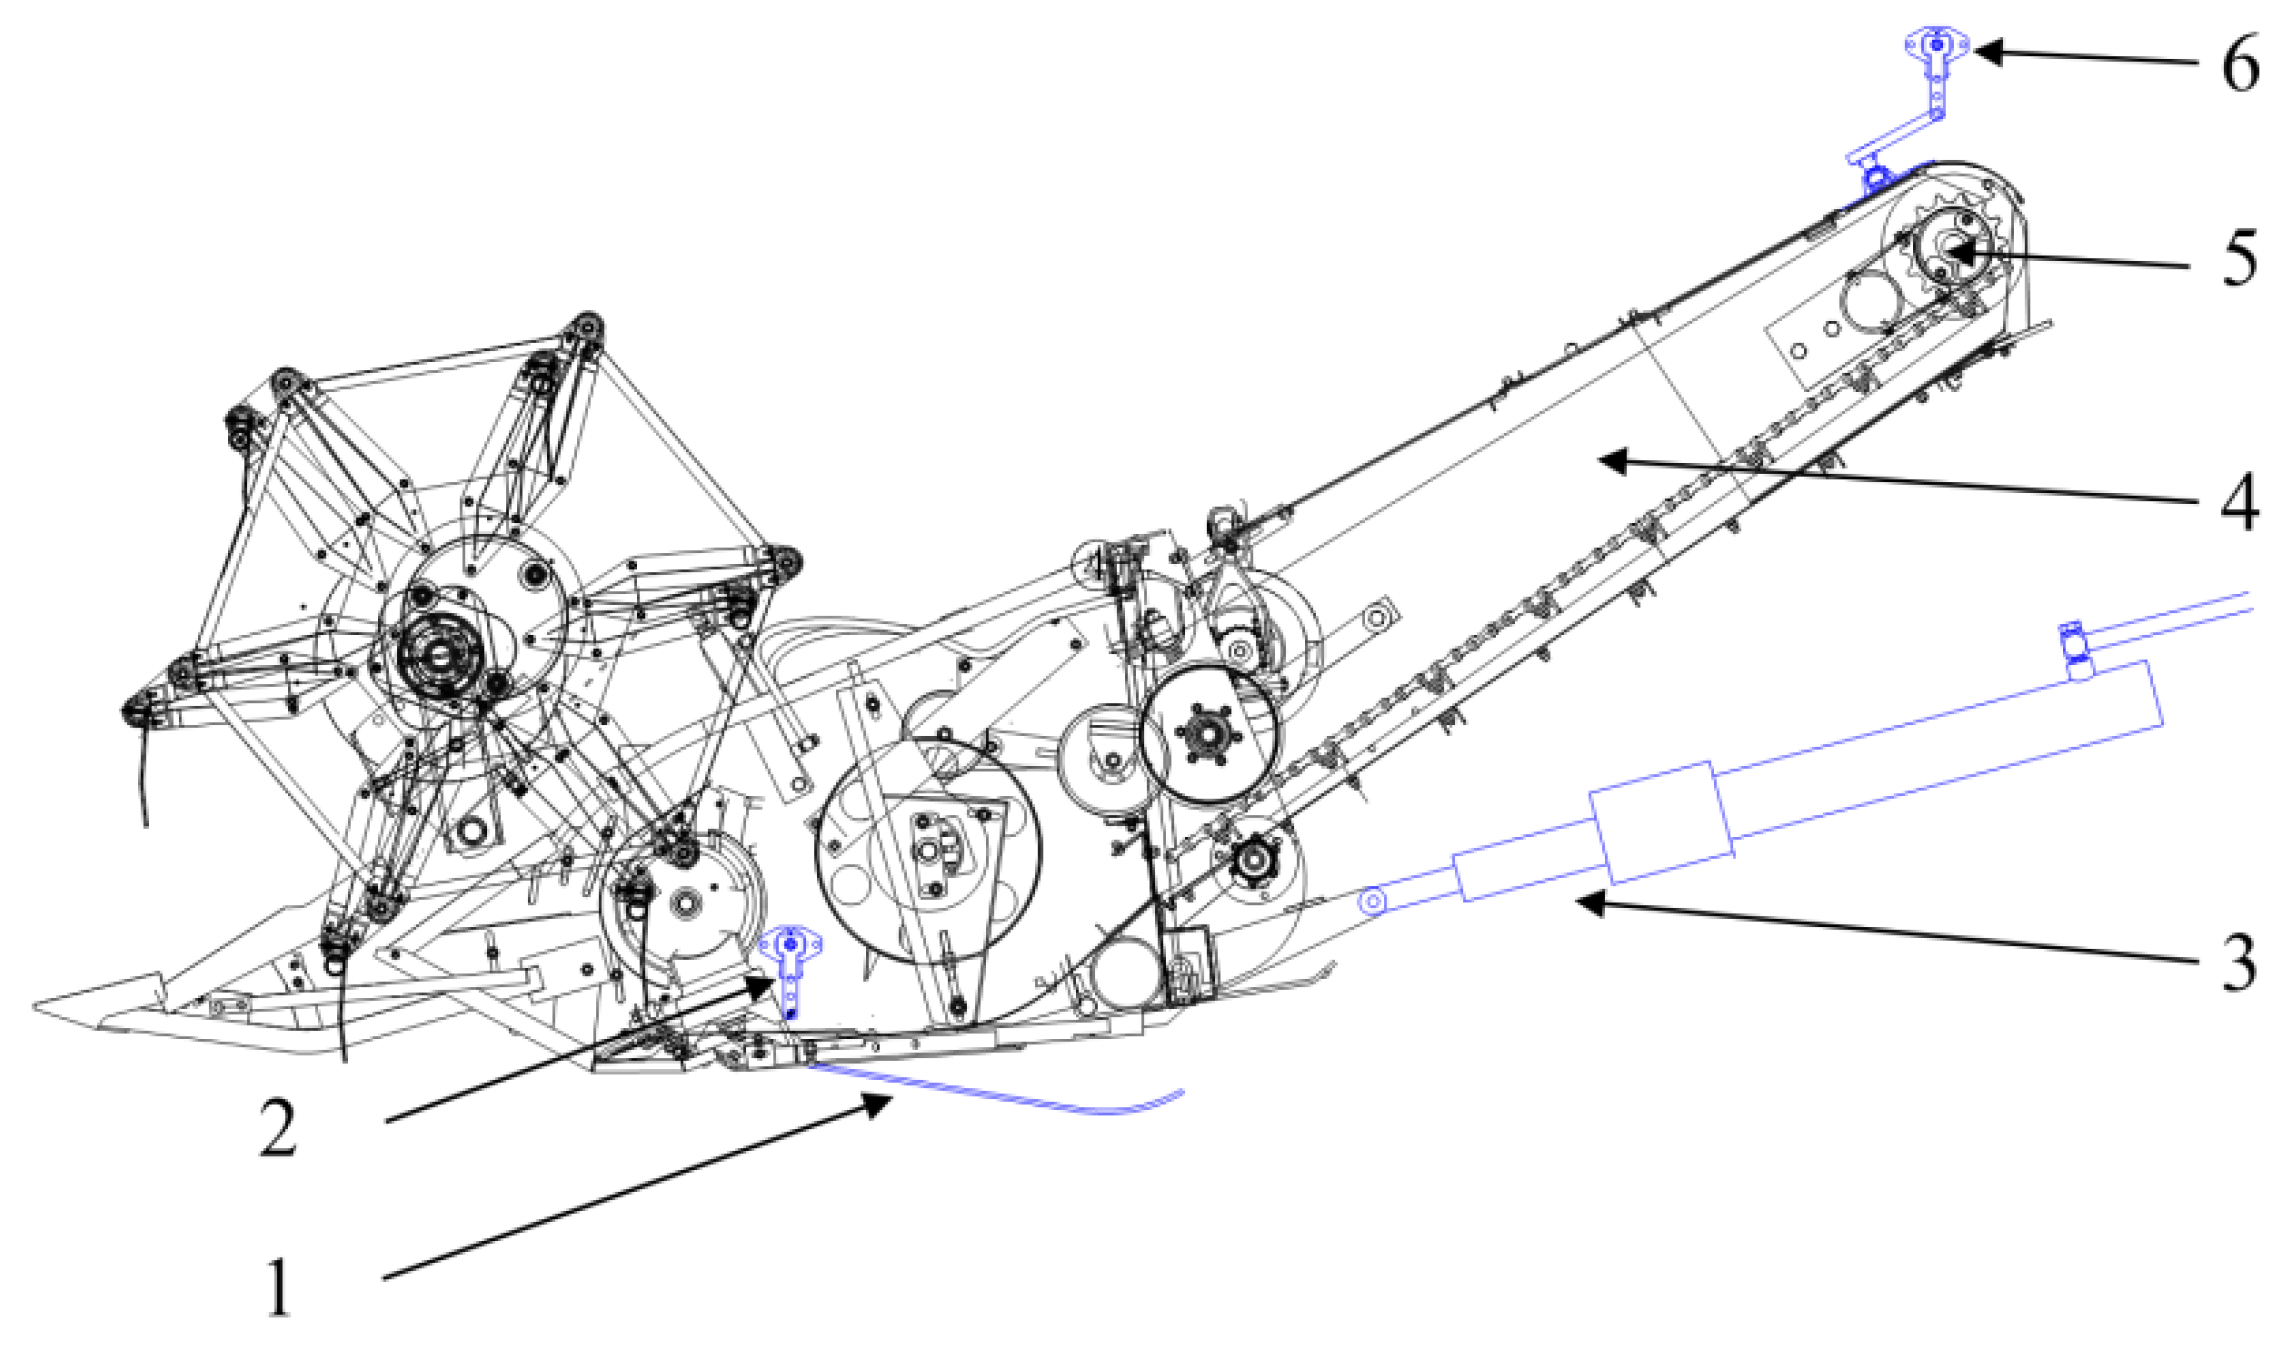
2.1. Structural Design

The header modification of the header height control system based on ground profiling monitoring is shown in Figure 1. The cutting device in the harvester cutting table module adopts the type II cutter structure in the national standard of the People’s Republic of China (GB/T 1209.2-2009). The blue content in the figure is the modified part of the research based on the traditional header. A profiling roll and an angle sensor were installed at the bottom of the header to monitor the fluctuations of the ground and serve as a signal input device for the electro-hydraulic control system. A hinge link was installed at the end of the header to be hinged with the angle sensor, to realise the input of the feedback signal after the height of the header is adjusted. In order to ensure the system’s response sensitivity when the harvester header height is fine-tuned, the single-acting oil cylinder that meets the system requirements was re-selected as the header height actuator.

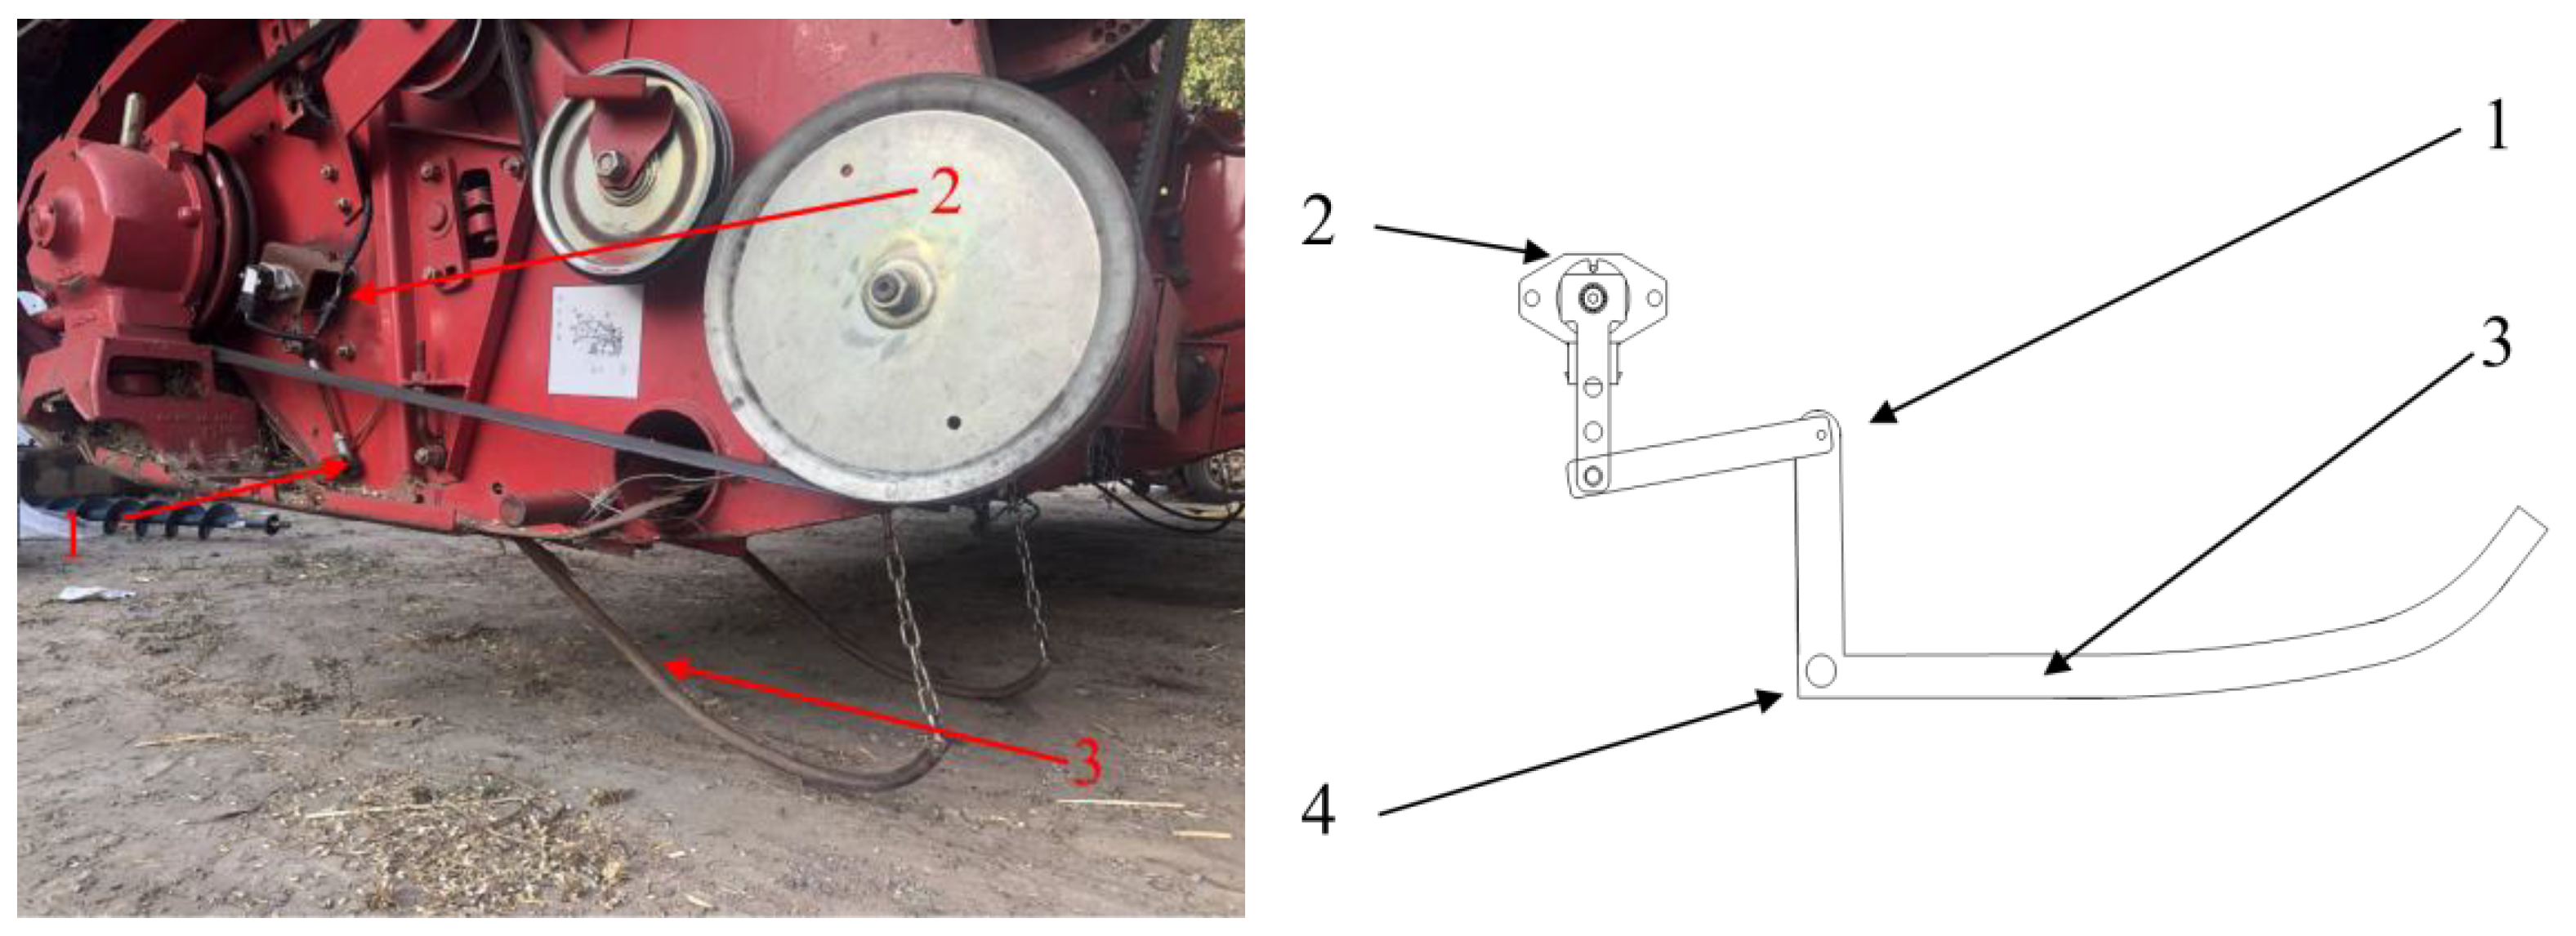
2.1.1. Design of the Ground Profiling Monitoring Mechanism Based on the Angle Sensor

In order to track and identify the undulating state of the ground, a contact-type ground profiling mechanism was designed, and the structure is shown in Figure 2. The profiling mechanism consists of a profiling roller, an angle sensor, and an articulated link. During the operation, the profiling roller contacts the ground, rotates around the fixed rotation point, and drives the angle sensor to rotate through the hinged link mechanism. Therefore, the profiling roller converts the height signal between the header and the ground into a corresponding voltage signal (0~5 V) through the angle sensor and transmits it to the vehicle controller [18].

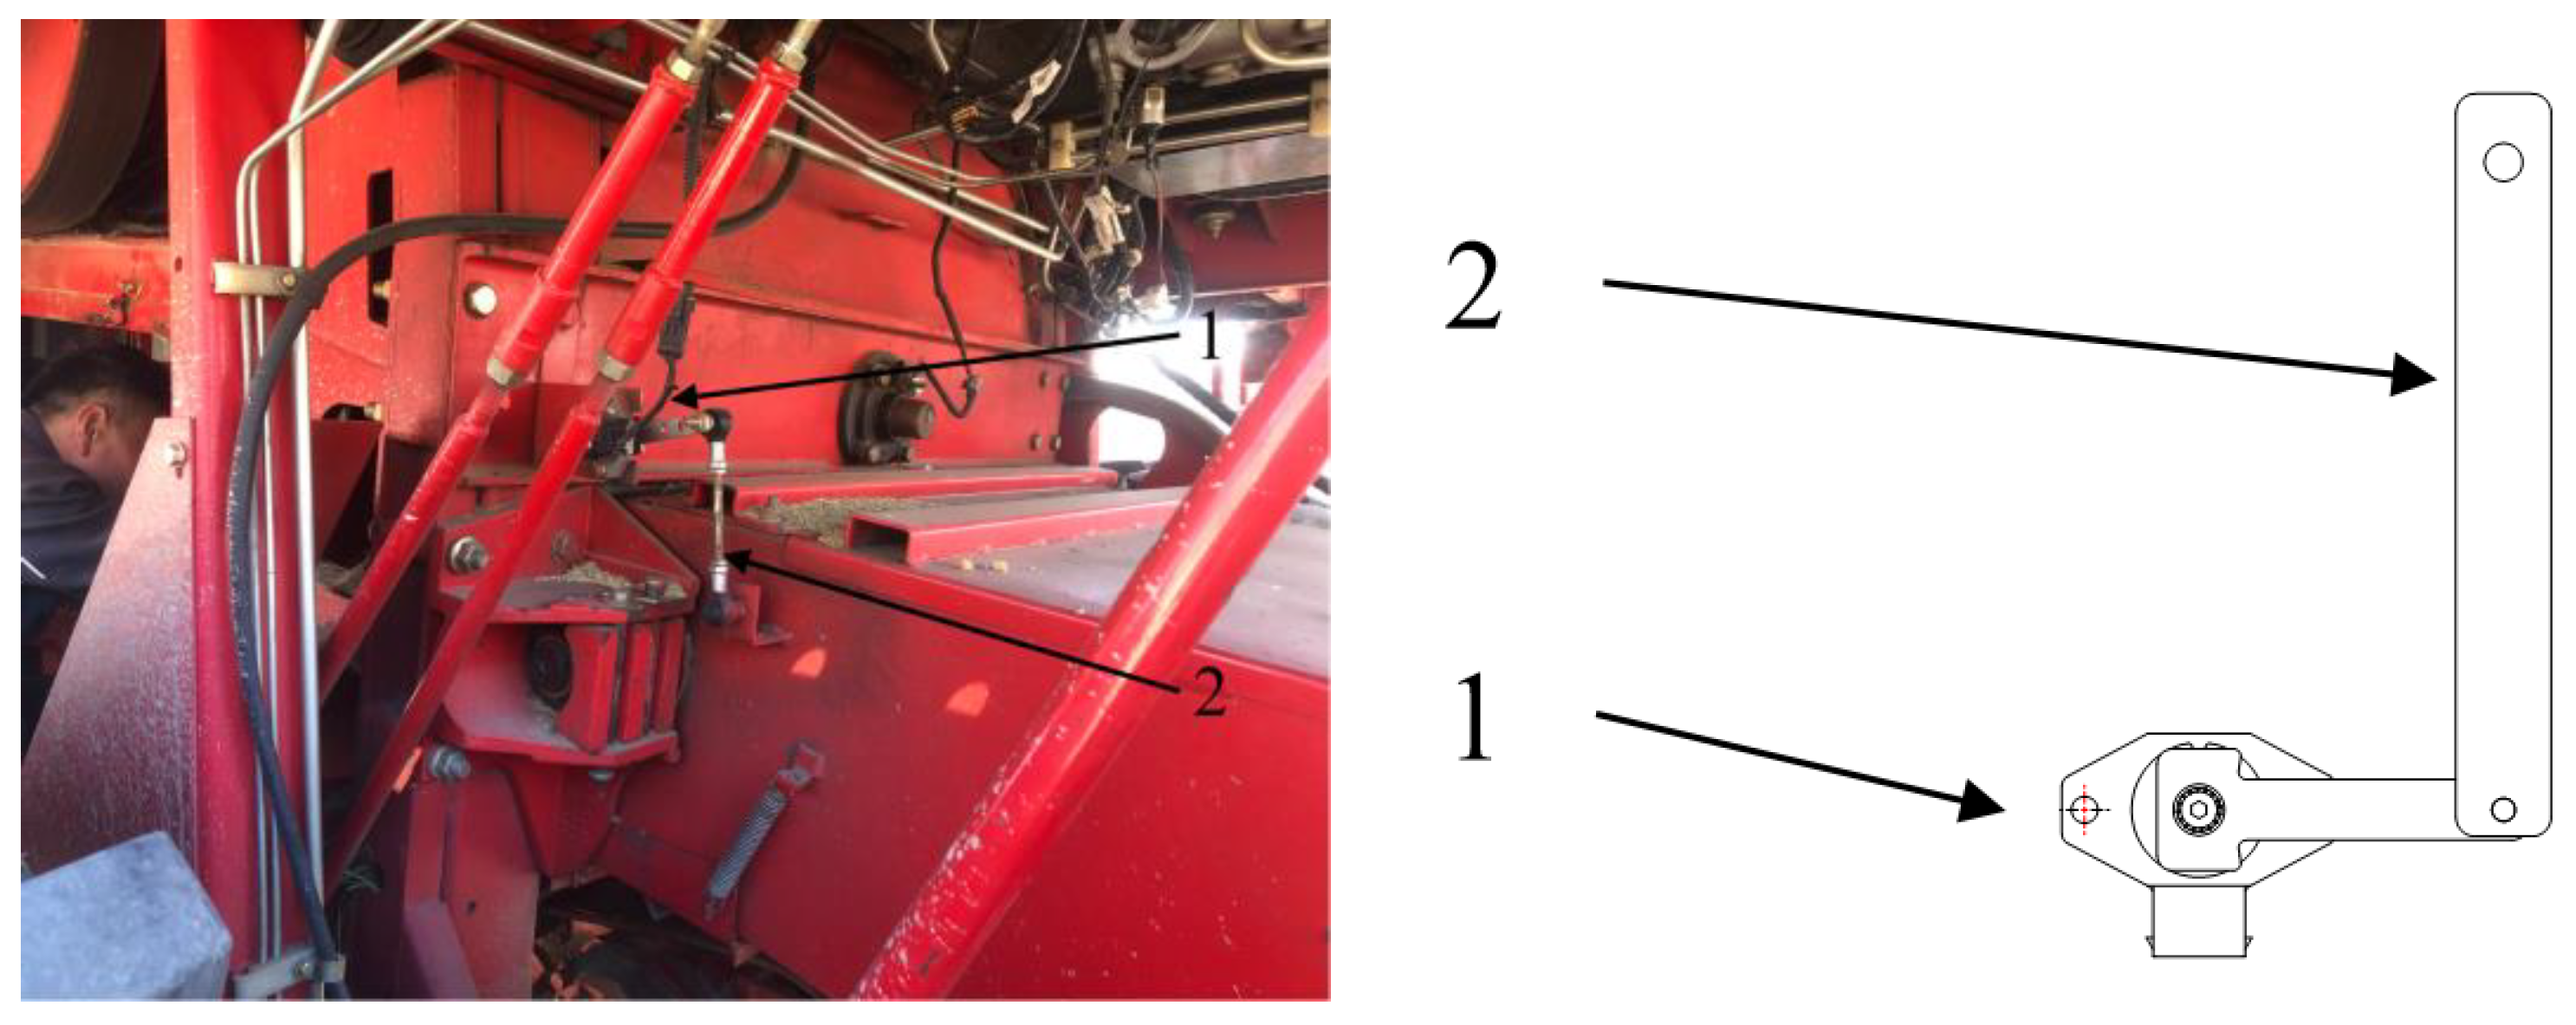
2.1.2. Design of Height Feedback Mechanism of the Header Based on Angle Sensor

The closed-loop link of the header control system needs to monitor the real-time height of the header after each electro-hydraulic adjustment action is completed and perform the difference calculation between the actual feedback signal and the target-setting signal to obtain the numerical calculation for the next programme cycle. The feedback monitoring of the actual height of the header also uses an angle sensor and a hinge link mechanism; the structure is shown in Figure 3. The lifting and lowering of the header cause the position of the hinge link to change, which drives the angle sensor of the header height feedback monitoring to rotate. At this time, the real-time height signal fed back by the header is converted into a voltage signal (0~5 V) through the angle sensor and enters the feedback link to participate in the control algorithm operation.

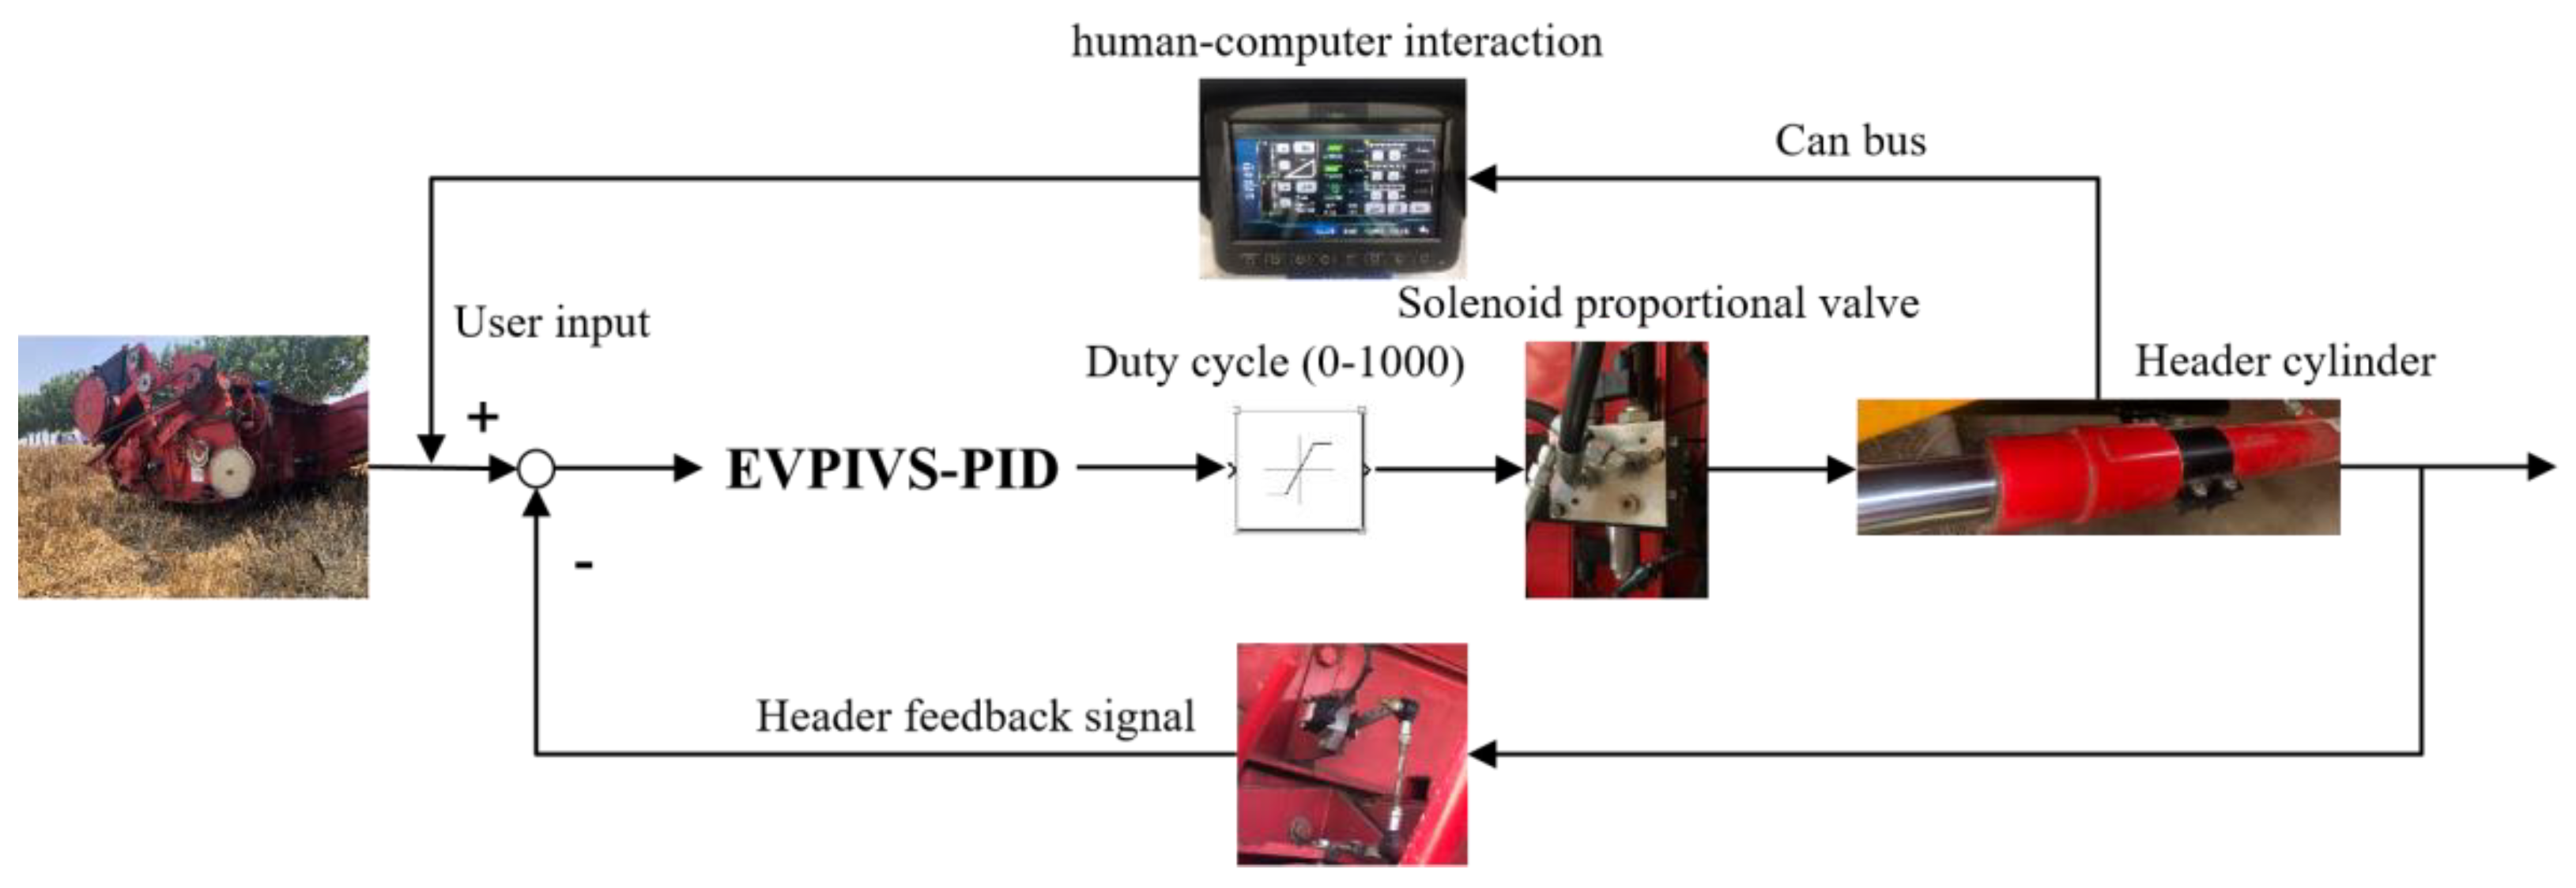
2.2. Operation Principle

Figure 4 shows the structure of the adaptive header control system. When the combine harvester starts to work, the driver sets the stubble height in the adaptive control mode of the header through the human interaction interface in the front of the cab, and the harvester starts to enter the profiling mode of the header. The profiling roller on the bottom side of the header contacts the ground and drives the profiling sensor to rotate and output the corresponding voltage signal to the vehicle controller as the ground fluctuates. The controller calculates through the voltage-height-fitting curve equation, obtains the height of the header collected in the current programme cycle, and obtains the system error through the difference calculation with the user set value e ( k ) . The on-board speed sensor monitors the current vehicle speed and determines the corresponding proportional, integral, and differential parameters, and through the EVPIVS-PID control strategy newly proposed in this study, it calculates the data and outputs the corresponding PWM duty cycle (0–1000). The controller converts the PWM into the corresponding PWMi current and acts on the solenoid coil of the solenoid proportional valve. The electromagnetic coil generates a corresponding magnetic field to control the opening and closing of the spool for a certain distance, and controls the flow direction of the hydraulic oil in the hydraulic circuit so that the oil cylinder of the header produces corresponding actions under the action of hydraulic oil. The header height feedback device transmits the actual height of the header back to the on-board controller and continues to perform the difference calculation with the user set value. In order to improve the stability of the header near the target value, if the difference is less than 15 mm, the default header adjustment is completed in this cycle. If it is greater than 15 mm, it will continue to enter the next programme control cycle.

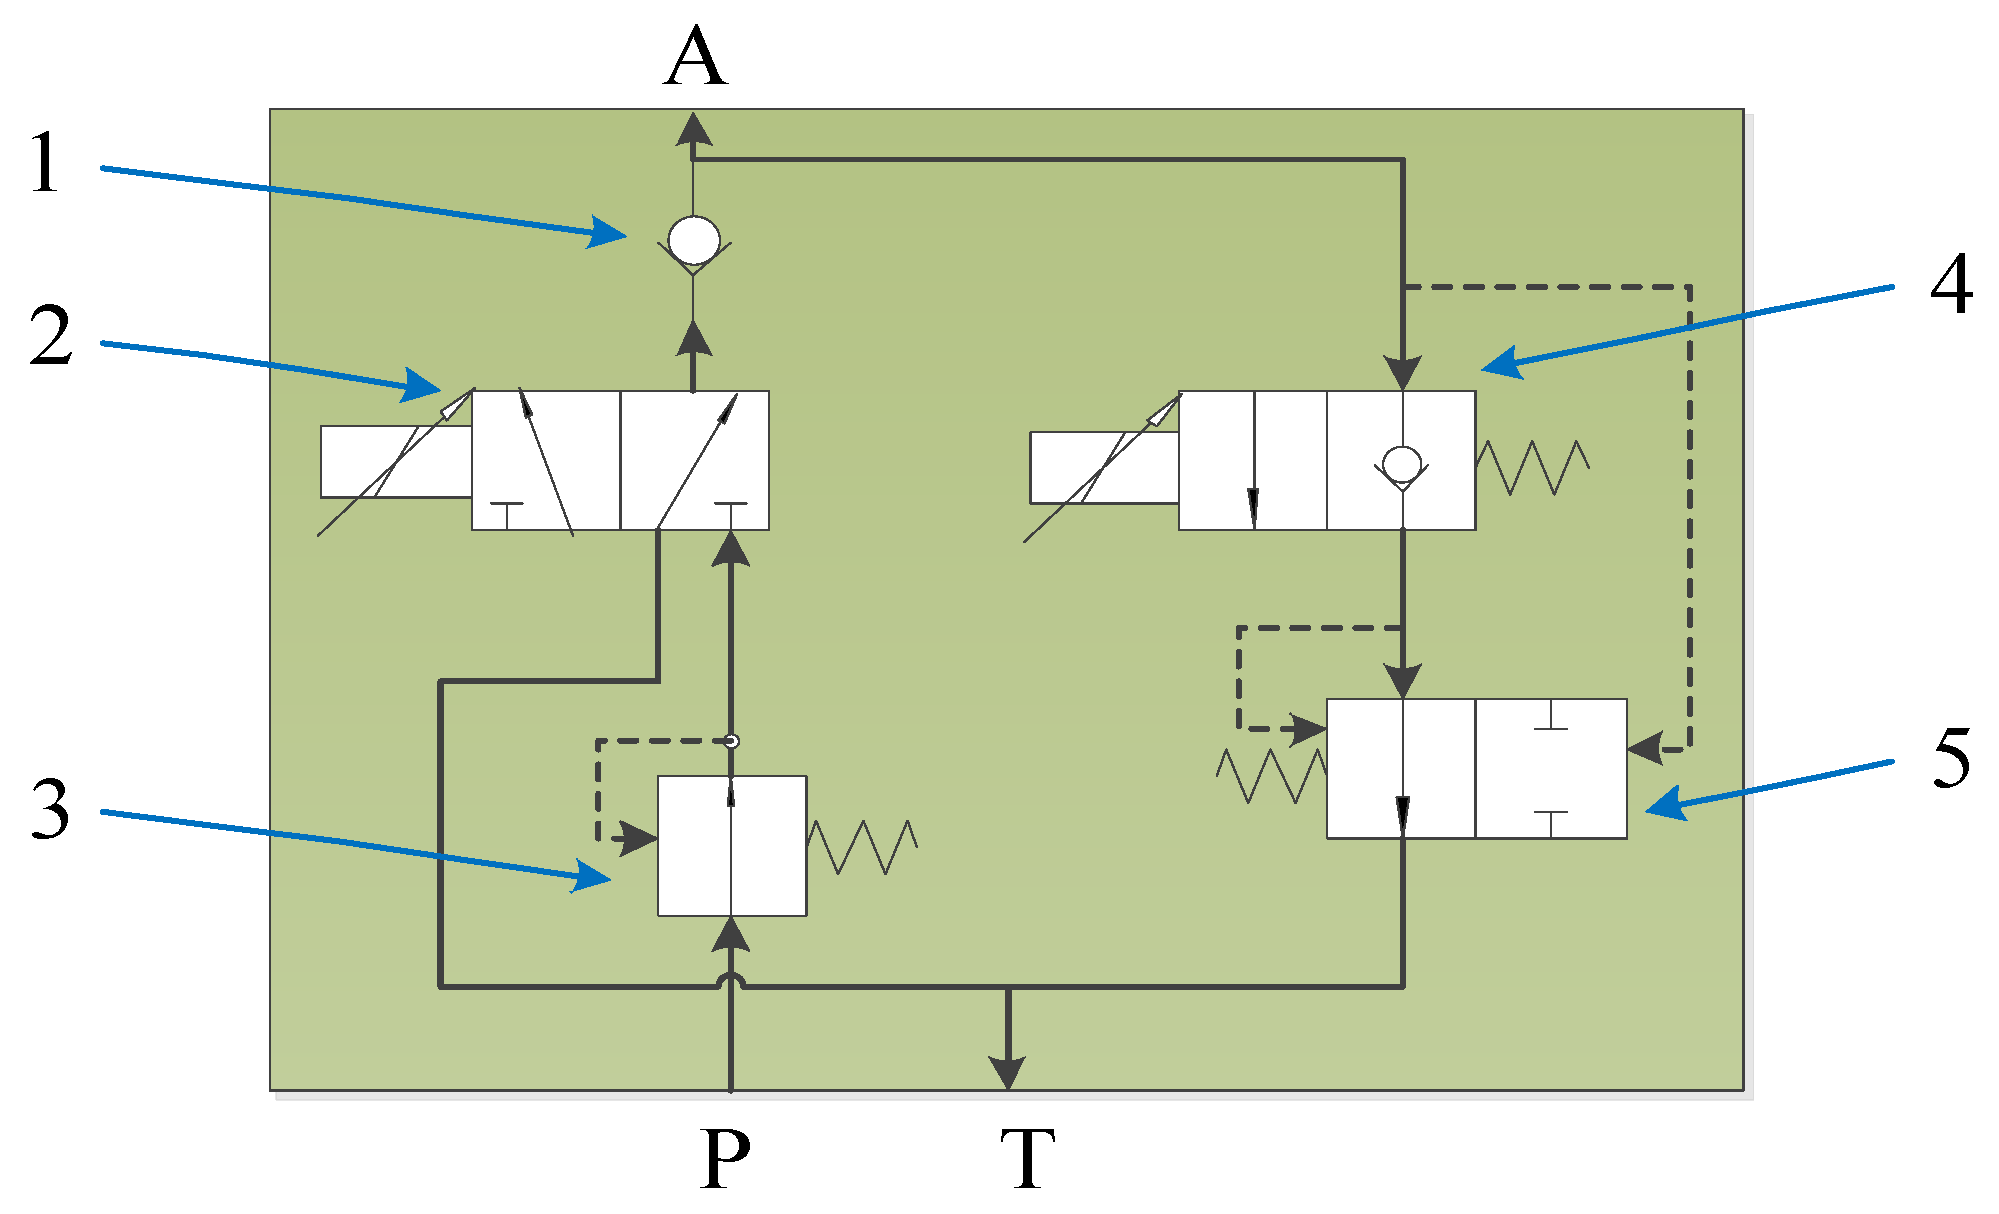
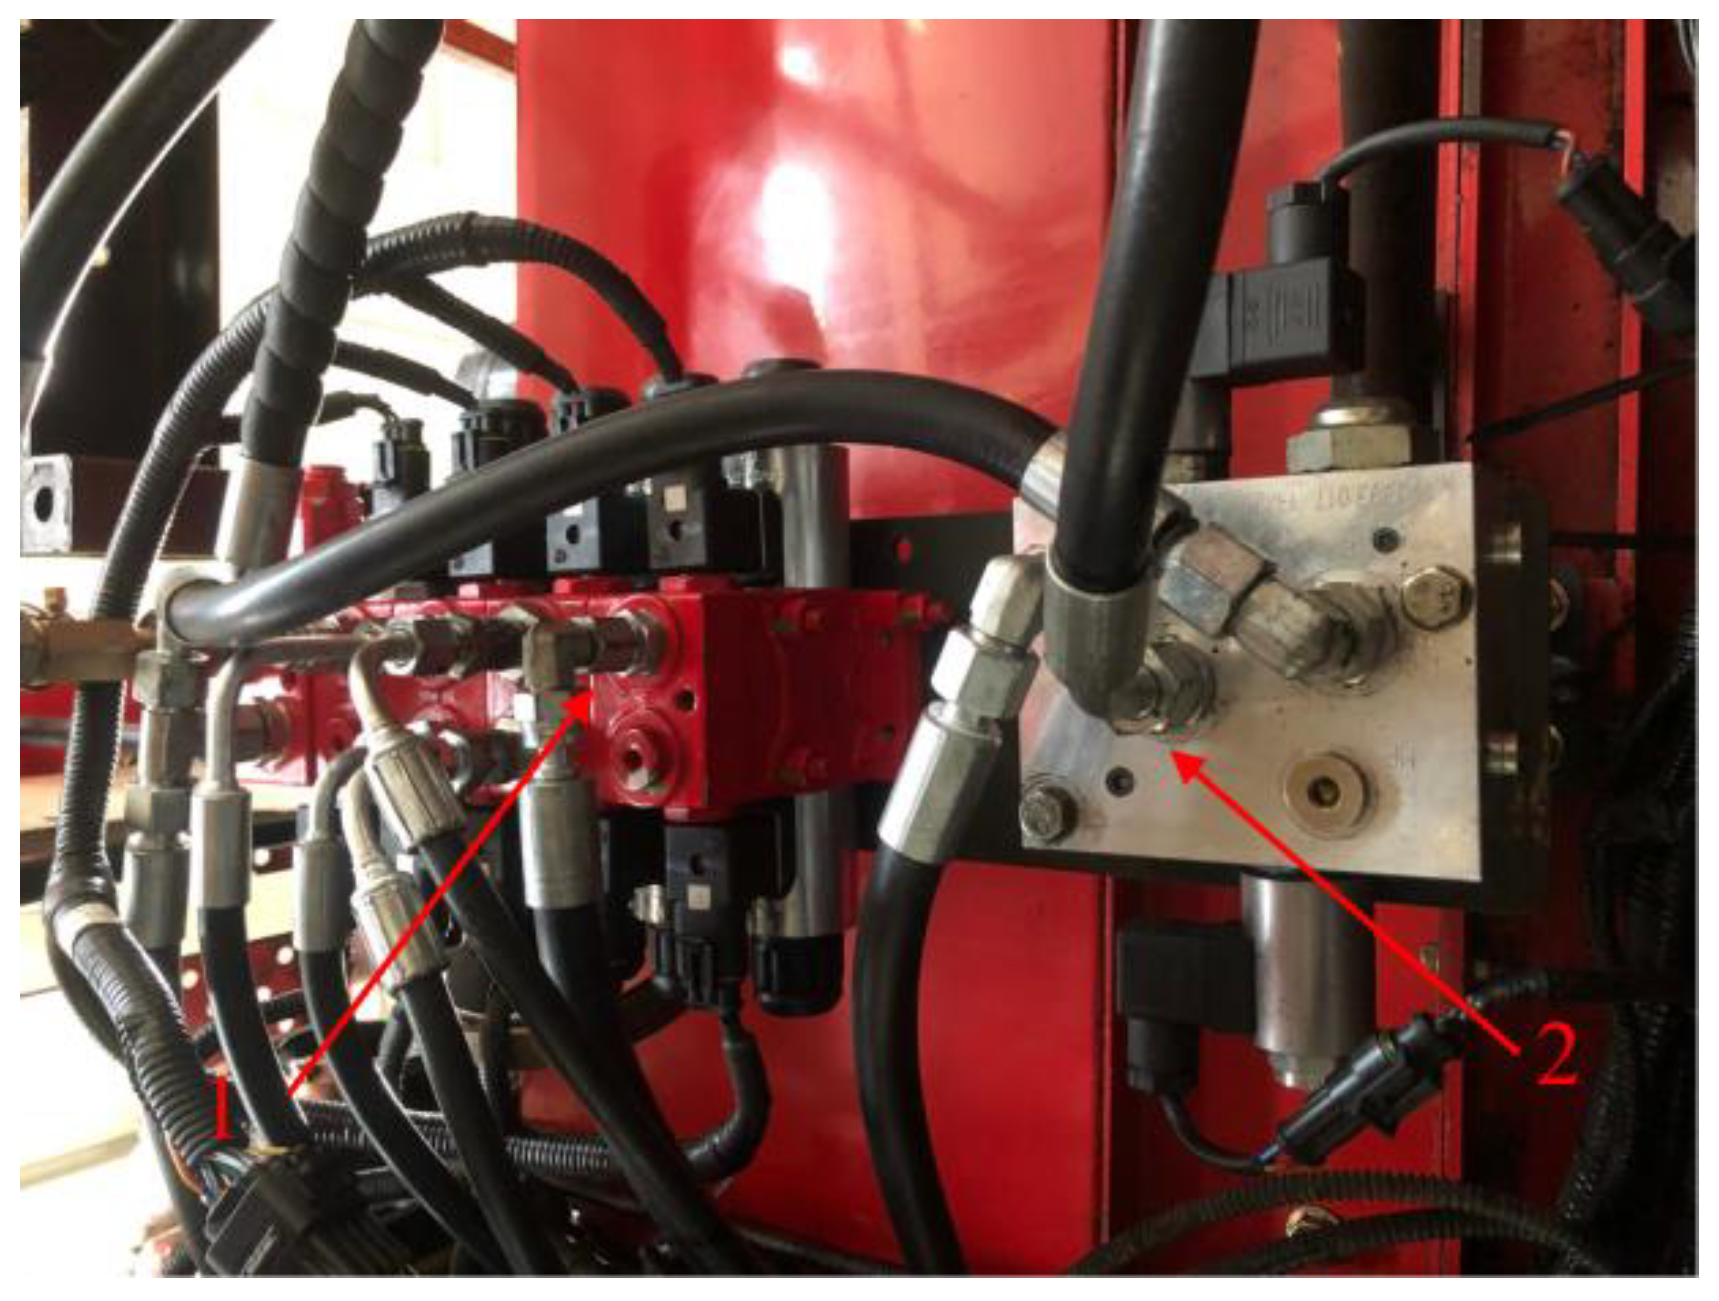
2.3. Structural Principle of Integrated Electromagnetic Proportional Valve in a Hydraulic Control System

In the traditional header action adjustment system, the hydraulic control mechanism generally selects an electronically controlled reversing valve to control the hydraulic oil circuit [19]. The control principle of this way is to generate the corresponding magnetic field by energizing different solenoid coils of the electric control directional valve. Therefore, the magnetic field changes the flow direction of hydraulic oil in the hydraulic system and realizes the lifting of the hydraulic cylinder by controlling the movement of the internal slide valve of the electric control directional valve. However, this control strategy is only suitable for manual adjustment at low harvesting speed, and it is not easy to fine-tune the height of the header. The self-adaptive header ground profiling control system requires high precision for the action of the header and needs to realise the fine-tuning of the header lift based on the change of the ground height signal during high-speed harvesting operations. Therefore, in this study, the integrated electromagnetic proportional valve is used to realise the control of the hydraulic system. Figure 5 and Figure 6 show the installation method and internal structure principle.
Figure 7 shows the working principle of the integrated solenoid proportional valve. When the header needs to rise, the on-board controller sends out the corresponding PWM signal and converts it into the corresponding current (130 mA–400 mA), which acts on the 2/3-way solenoid proportional valve coil (the left side is energised and the right side solenoid valve is de-energised). The coil generates a magnetic field to push the spool to move a certain distance, and the hydraulic oil enters the integrated electromagnetic proportional valve from the P port. After the pressure is reduced by the hydraulic control outlet-pressure-reducing valve, it flows through the 2/3-way solenoid proportional valve and flows out from the A port into the header cylinder to push the header to rise. When the pressure of the outlet-pressure-reducing valve is higher than the pressure set by the spring, it will push the pressure-reducing valve spool to move to the right, reducing the flow of oil in the P port, and thereby achieving the purpose of stabilising and protecting the 2/3-way solenoid proportional valve.
When the header is lowered, the PWM signal is converted into a corresponding current (130 mA–320 mA) and acts on the right two-position, two-way electromagnetic proportional valve (the left electromagnetic valve loses power). The oil in the hydraulic cylinder enters the electromagnetic proportional valve through the A port and flows through the hydraulic control’s straight-through, single-valve inlet and outlet T ports to complete the descending action of the header. When the oil pressure at the oil inlet of the solenoid proportional valve is greater than the pressure value set by the valve body spring, the spool will be pushed to the left to stop the hydraulic oil from going to the T port. This function ensures that the header will not drop rapidly to the ground and cause damage to the car body.

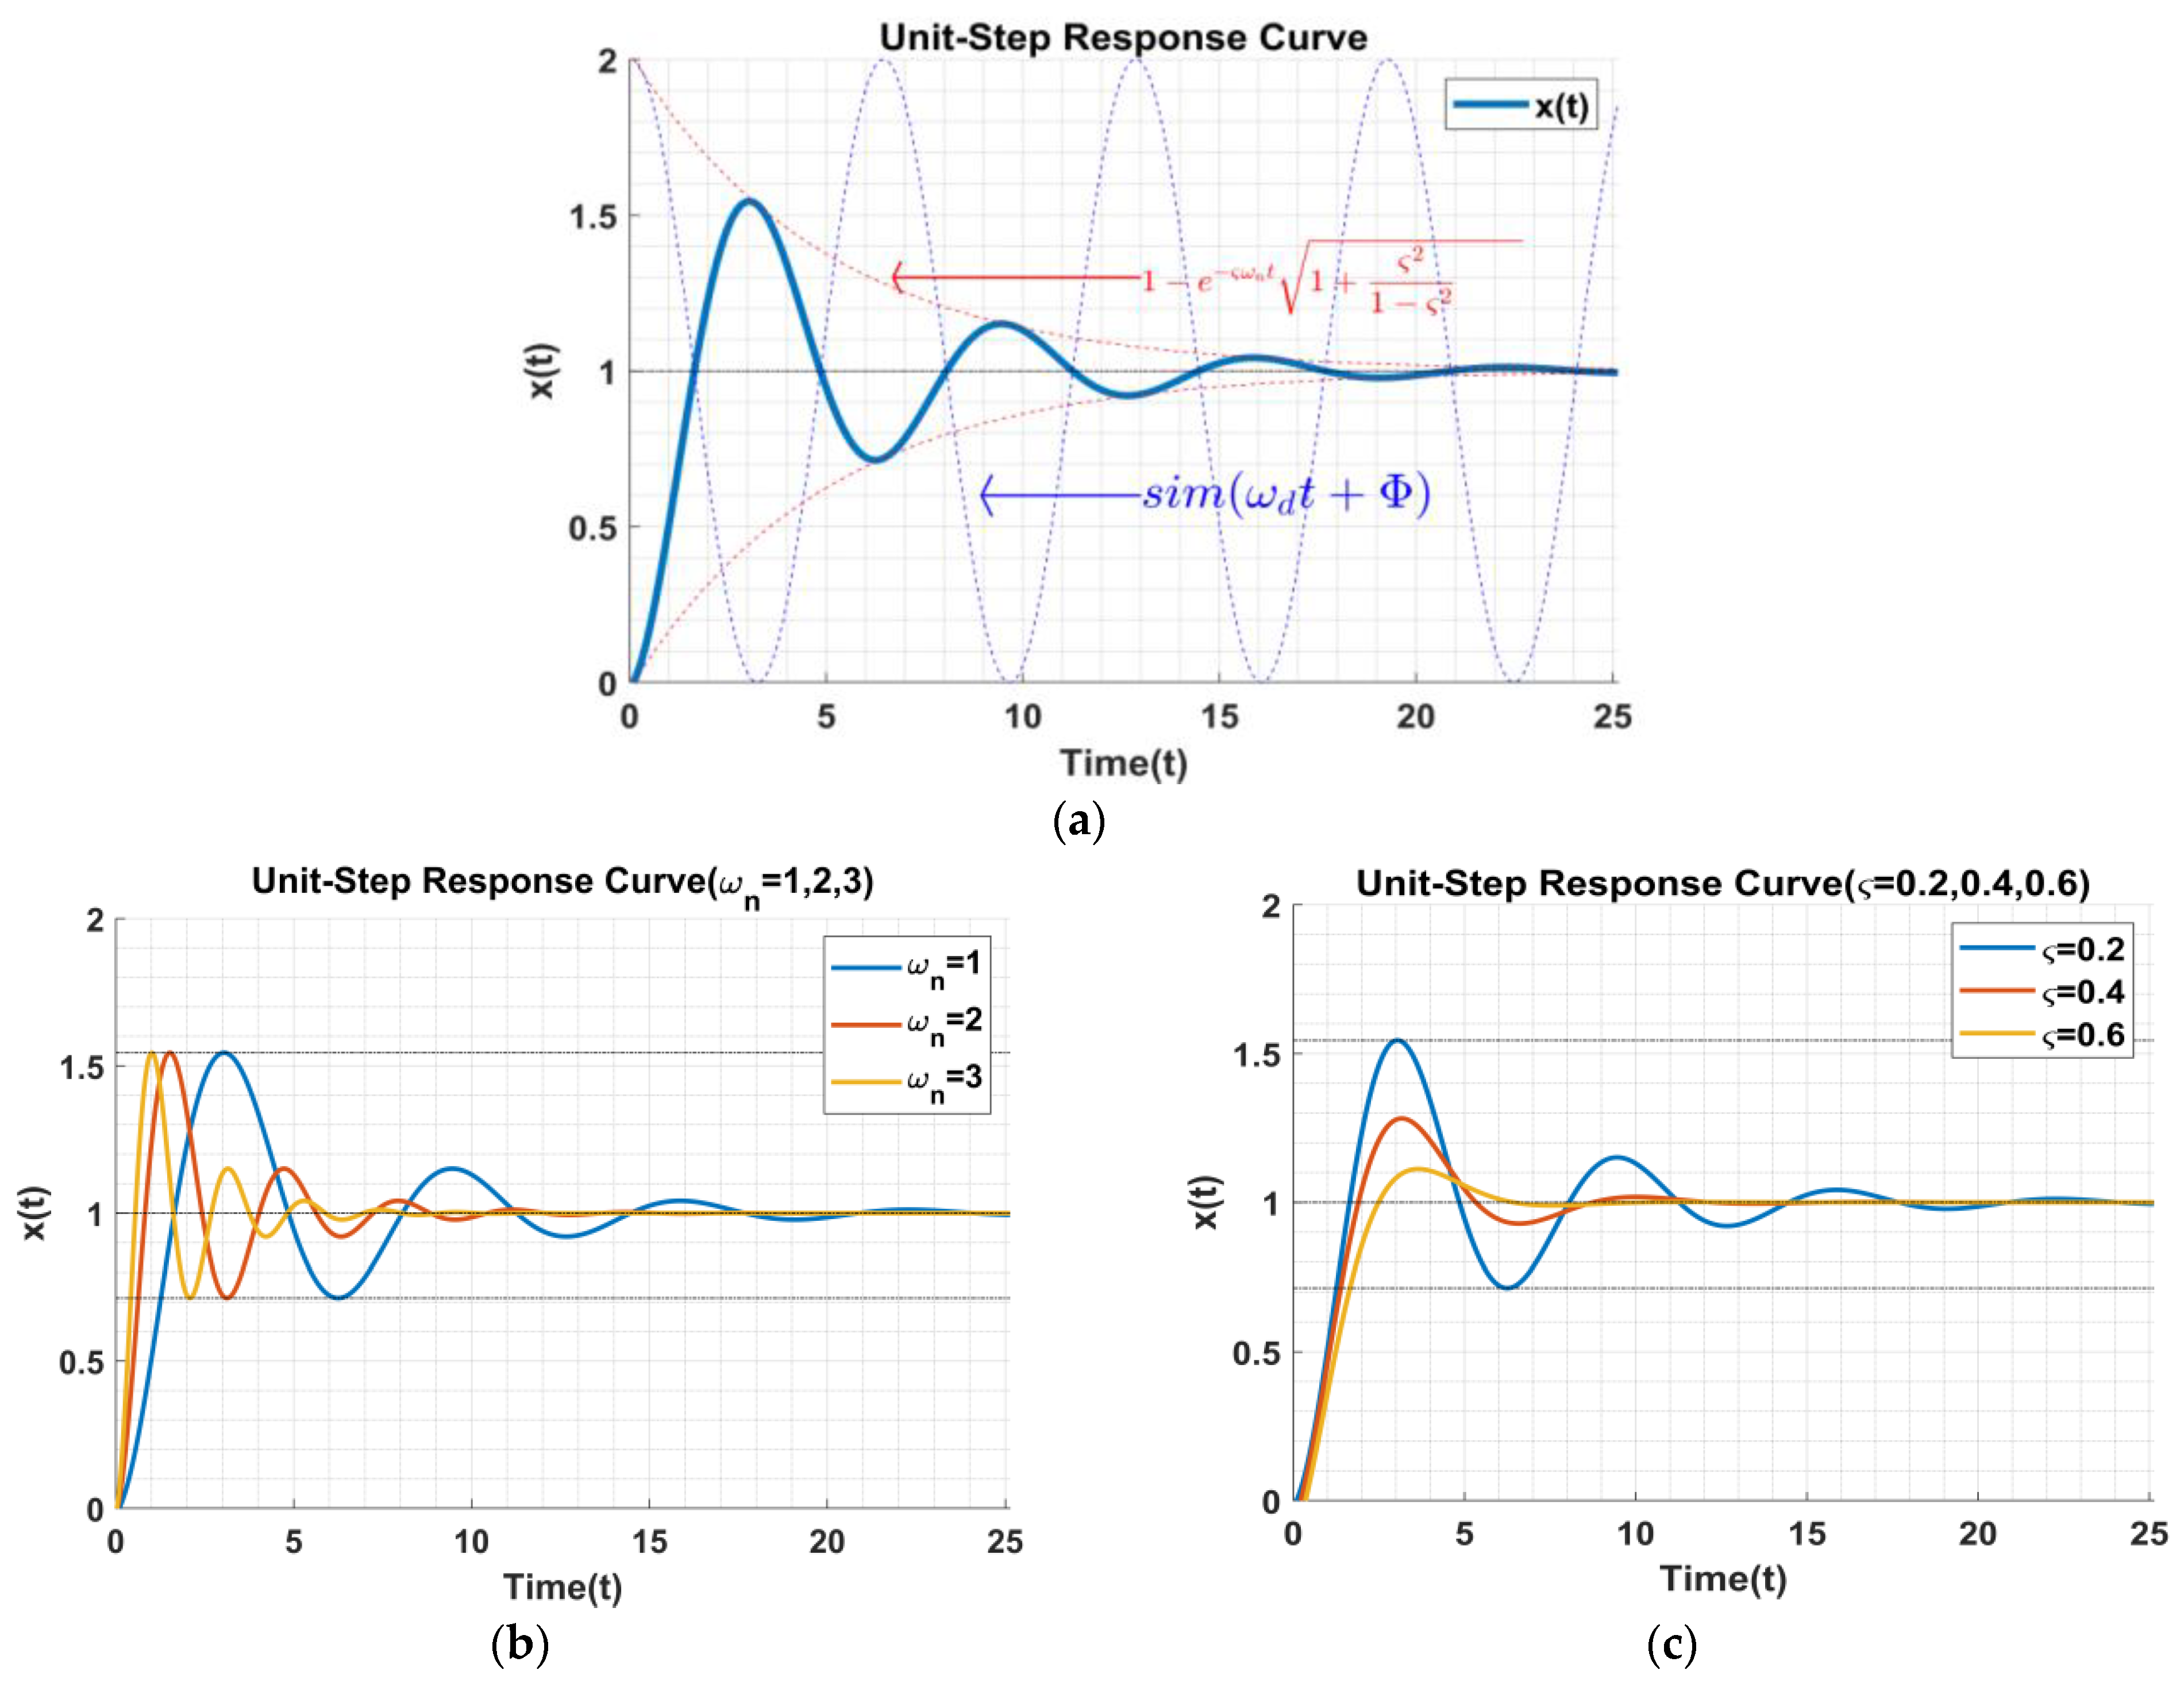
2.4. Selection of a Single-Acting Cylinder Based on Unit Step Response Analysis

2.4.1. Establishment of Transfer Function at the Single-Acting Hydraulic Cylinder

The hydraulic cylinder actuator under the electro-hydraulic hybrid control is a key component in the header profiling system, and its dynamic characteristics determine the parameter performance of the entire system. It is also the basis for analysing and designing the entire hydraulic and control systems [20]. The hydraulic regulating valve realises the expansion and contraction of the single-acting cylinder by controlling the flow direction and flow rate of the hydraulic oil, and completes the corresponding lifting action of the header. The movement process can be regarded as a spring-damping system. The simplified mechanical model is:
  • m is the load mass acting on the oil cylinder;
  • x is the movement distance of the load;
  • F is the force acting on the load;
  • B is the damping coefficient of the system;
  • K is the elastic coefficient of the system.
Figure 8. Header elastic damping simplified model.
Agriculture 12 00282 g008
According to the force analysis, the differential equation of motion of the system over time t can be obtained:
m d 2 x d t = F K x B d x d t ( t 0 )
simplifies to:
d 2 x d t + 2 ζ ω n d x d t + ω n 2 x = F
When the system is at 0 initial conditions, the Laplace transform of the above formula can be obtained:
H ( s ) = x ( s ) u ( s ) = ω n 2 s 2 + 2 ζ ω n s + ω n 2
The hydraulic cylinder and the load, together, constitute a hydraulic spring-load mass system; and the natural frequency of the hydraulic pressure can represent the response speed of the power execution of the hydraulic components. According to engineering experience, the hydraulic natural frequency is also the lowest frequency in the entire header profiling control system, which limits the response speed of the system. Its natural frequency ω n is:
ω n = K h m t = β e A p 2 V t m t
The above formula can further prove that when calculating the natural frequency of the single-acting hydraulic cylinder, the piston should be at the maximum position as far as possible, V t . At this time, ω n is the lowest and the system stability is the worst.
The formula for calculating the hydraulic damping ratio ζ n is:
ζ n = K c e A p β e m t V t + B p A p V t β e m t
In the above formula, K c e is the total flow-pressure coefficient in the hydraulic system. It can be ignored when the value of B p is small.

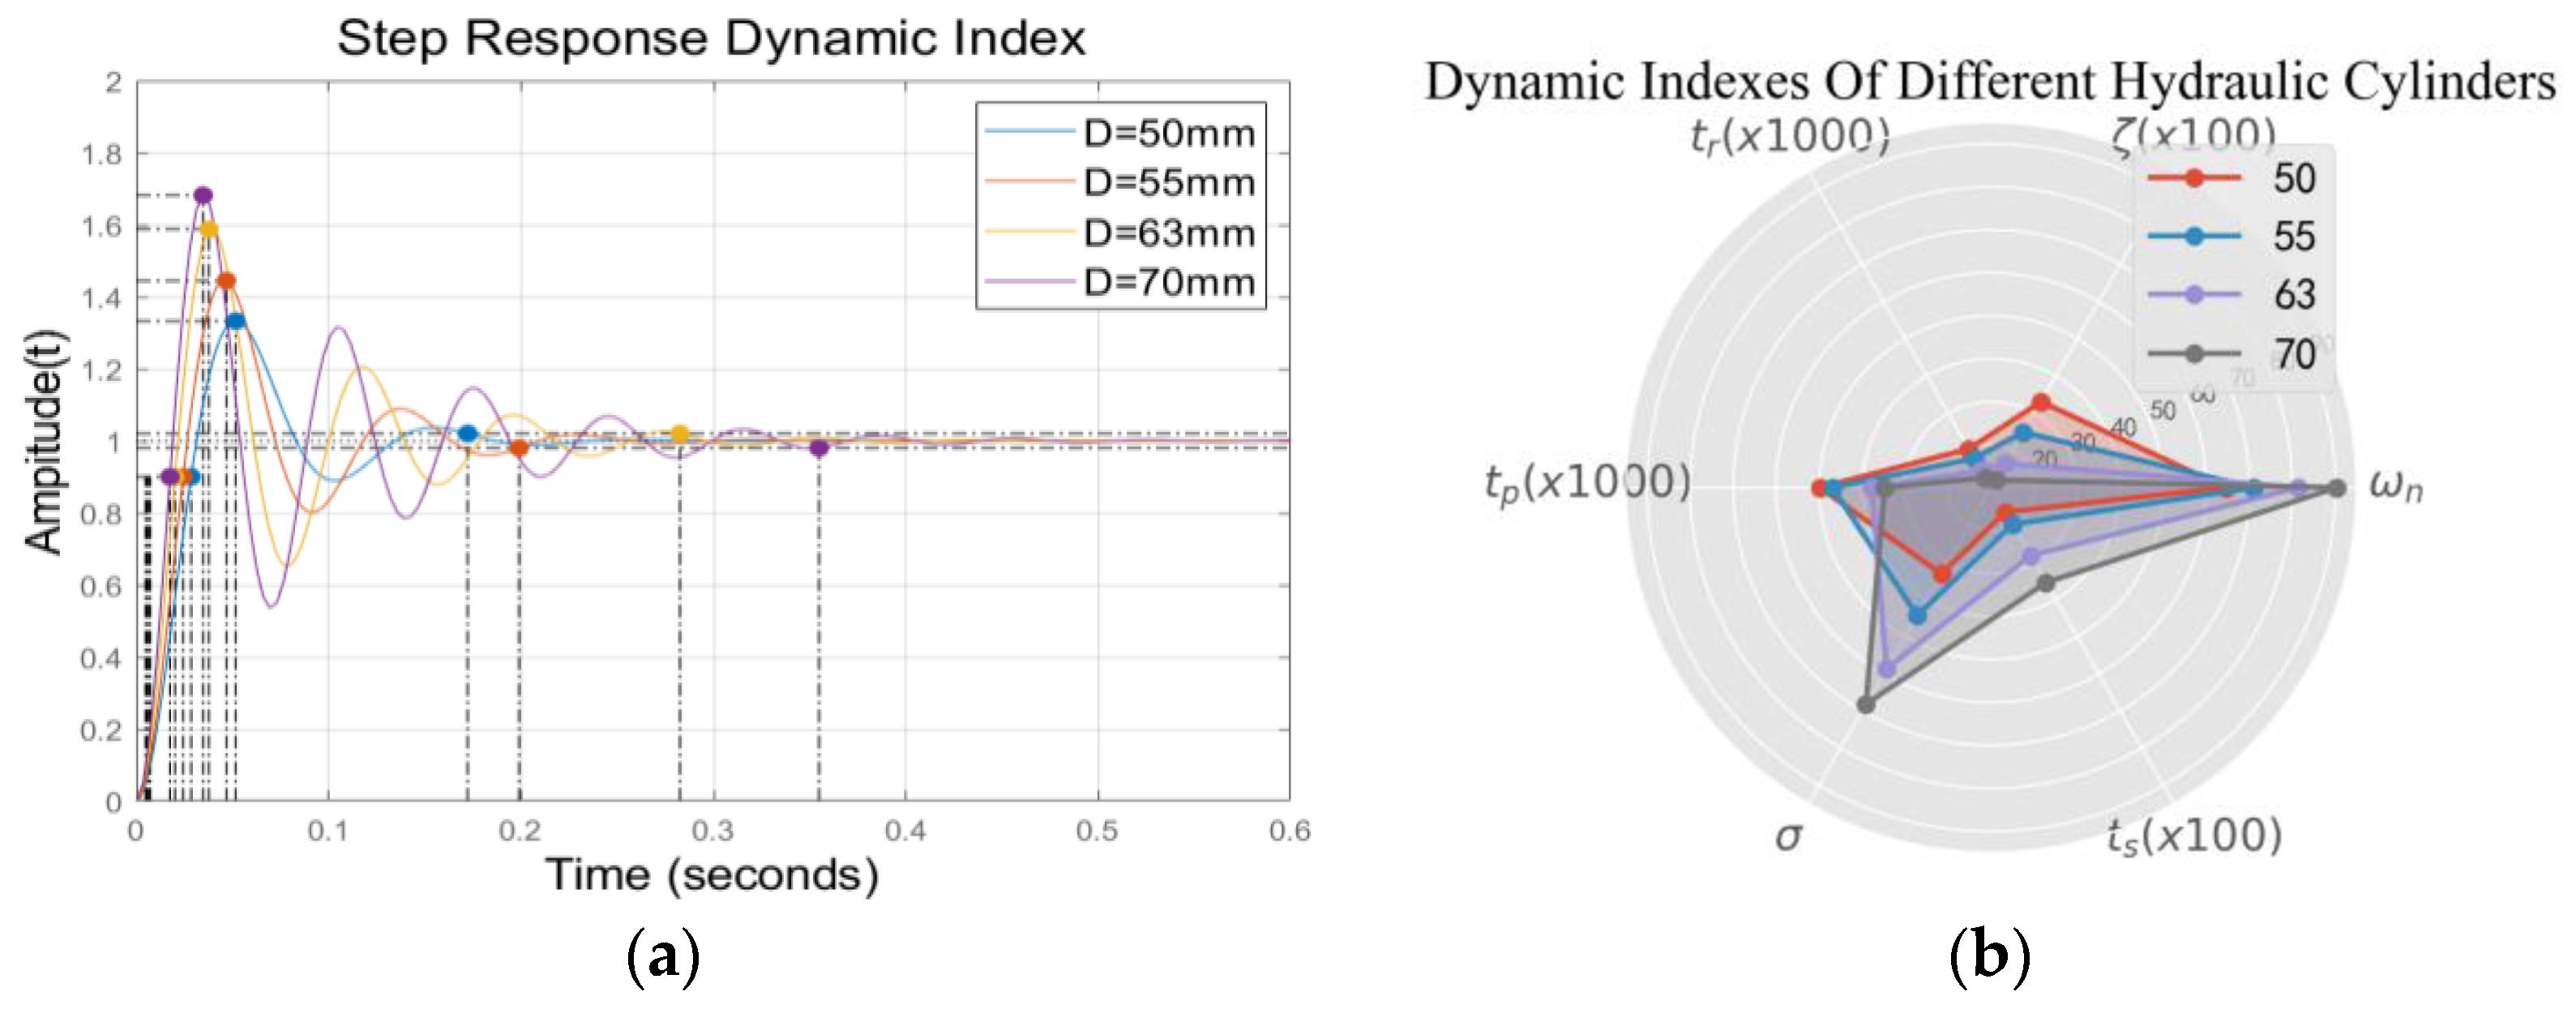
2.4.2. Parameter Selection of Hydraulic Cylinder Based on System Stability Analysis

Generally speaking, the step input is the most severe working state for the system [21]. If the dynamic performance of the system can meet the requirements under the step function, the system can also meet the requirements under other action functions, such as pulse input and sinusoidal input. Thus, this study adopts the unit step function test method to test the dynamic performance of the system.
The system input function of the unit step response is set as:
u ( t ) { 0 ( t = 0 ) 1 ( t > 0 )
and because of X ( s ) = U ( s ) H ( s ) , we can get:
X ( s ) = 1 s ω n 2 s 2 + 2 ζ ω n s + ω n 2
Since the valve–cylinder control part can be regarded as a second-order, underdamped system, ζ is between [0, 1]. After Laplace change and Euler’s formula, we can get:
X ( t ) = 1 e ζ ω n t [ cos ω d t + ζ 1 ζ 2 sin ω d t ] = 1 e ζ ω n t 1 + ζ 2 1 ζ 2 [ sin ( ω d t + ϕ ) ] ϕ = arctan ( 1 ζ 2 / ζ ) ω d = ω n 1 ζ 2
From this, a second-order, underdamped system step response curve can be drawn.
It can be seen from Figure 9 that the response of the second-order, underdamped system to a unit step is an oscillation decay process. The oscillation process can be regarded as the superposition of the sinusoidal oscillation and the decay function of the envelope. In Figure 3a, the damping oscillation link is mainly completed by the sin ( ω d t + ϕ ) term in the above formula, where ω d determines the size of the system oscillation frequency. The system attenuation link is mainly realised by
1 ± e ζ ω n t 1 + ζ 1 ζ 2
which determines the attenuation speed of the envelope. From Figure 3b,c, and combined with formula (8), we can see that when the damping ratio, ζ , is determined, the natural frequency is proportional to the response speed of the system and inversely proportional to the oscillation period of the system. When the natural frequency, ω n , is determined, the damping ratio, ζ , is proportional to the rise time of the system and inversely proportional to the overshoot of the system.
In order to ensure that the header height control system has a faster response speed and a shorter adjustment time, each index of the system adopts the approximate calculation method of the natural frequency, ω n , and the damping ratio, ζ , and the calculation method of the dynamic index is shown in Table 1.
In order to simplify the model calculation, the mass, m t , of the harvester header in the harvesting operation is considered to be approximately constant, and the load mass affecting the top of the oil cylinder is approximately constant. The total flow of hydraulic oil in the hydraulic control system—the pressure coefficient, K c e , and the elastic modulus, β e , of the oil—are determined by the hydraulic oil material itself. After consulting the data [22], we take β e = 7 × 10 8 P a , K c e = 1.65 × 10 11 . From this, we can conclude that the natural frequency, ω n , and damping ratio, ζ , in the hydraulic system design can be adjusted by adjusting the effective area, A p , of the hydraulic cylinder of the hydraulic system and the volume, V , of the oil inlet cavity of the hydraulic cylinder. The relationship between the two is V = A p L , where is the cylinder stroke.
Due to the overall structural parameters of the harvester and the actual height control requirements of the header, the hydraulic cylinder needs to meet the telescopic stroke of 275 mm. Therefore, the design of the hydraulic system based on dynamic indicators can be mainly determined by the effective area of the hydraulic cylinder.
After searching the related research [23], the hydraulic cylinder that meets the lifting and adjustment requirements of the header of this model, and has a telescopic stroke of 275 mm, has several piston diameters of 50 mm, 55 mm, 63 mm, and 70 mm, and the 65 mm diameter hydraulic cylinders are generally not used for heavy vehicle equipment.
Combine the data in the Table 2 to draw the corresponding dynamic indicator response graph.
By analysing the relevant information in Figure 10, and comprehensively considering factors such as system adjustment time and overshoot ratio, this paper adopts a single-acting hydraulic cylinder with a piston diameter of 55 mm as the hydraulic actuator for this study.

2.4.3. Performance Testing of Hydraulic Actuators

In order to test whether the single-acting hydraulic cylinder with a 55 mm piston diameter can meet the actual needs of the lifting and lowering of the header under the PWM control of the integrated electromagnetic proportional valve, a weight is added at the bridge of the harvester for on-site inspection. By sampling the lifting time of the header under different PWM duty ratios for many times, it is confirmed that the electromagnetic proportional valve fully meets the work needs of the header-adaptive ground profiling. Figure 11 shows the relevant test data.
Figure 11 shows that the header lifting time is inversely proportional to the PWM value, and the duty cycle of 45% can meet the requirements of the oil cylinder to end the stroke in 3 s. Because the internal proportion of the solenoid valve is different. When the header of the harvester is lowered, the PWM value output by the control system is greater than the PWM value output by the system when it is raised.

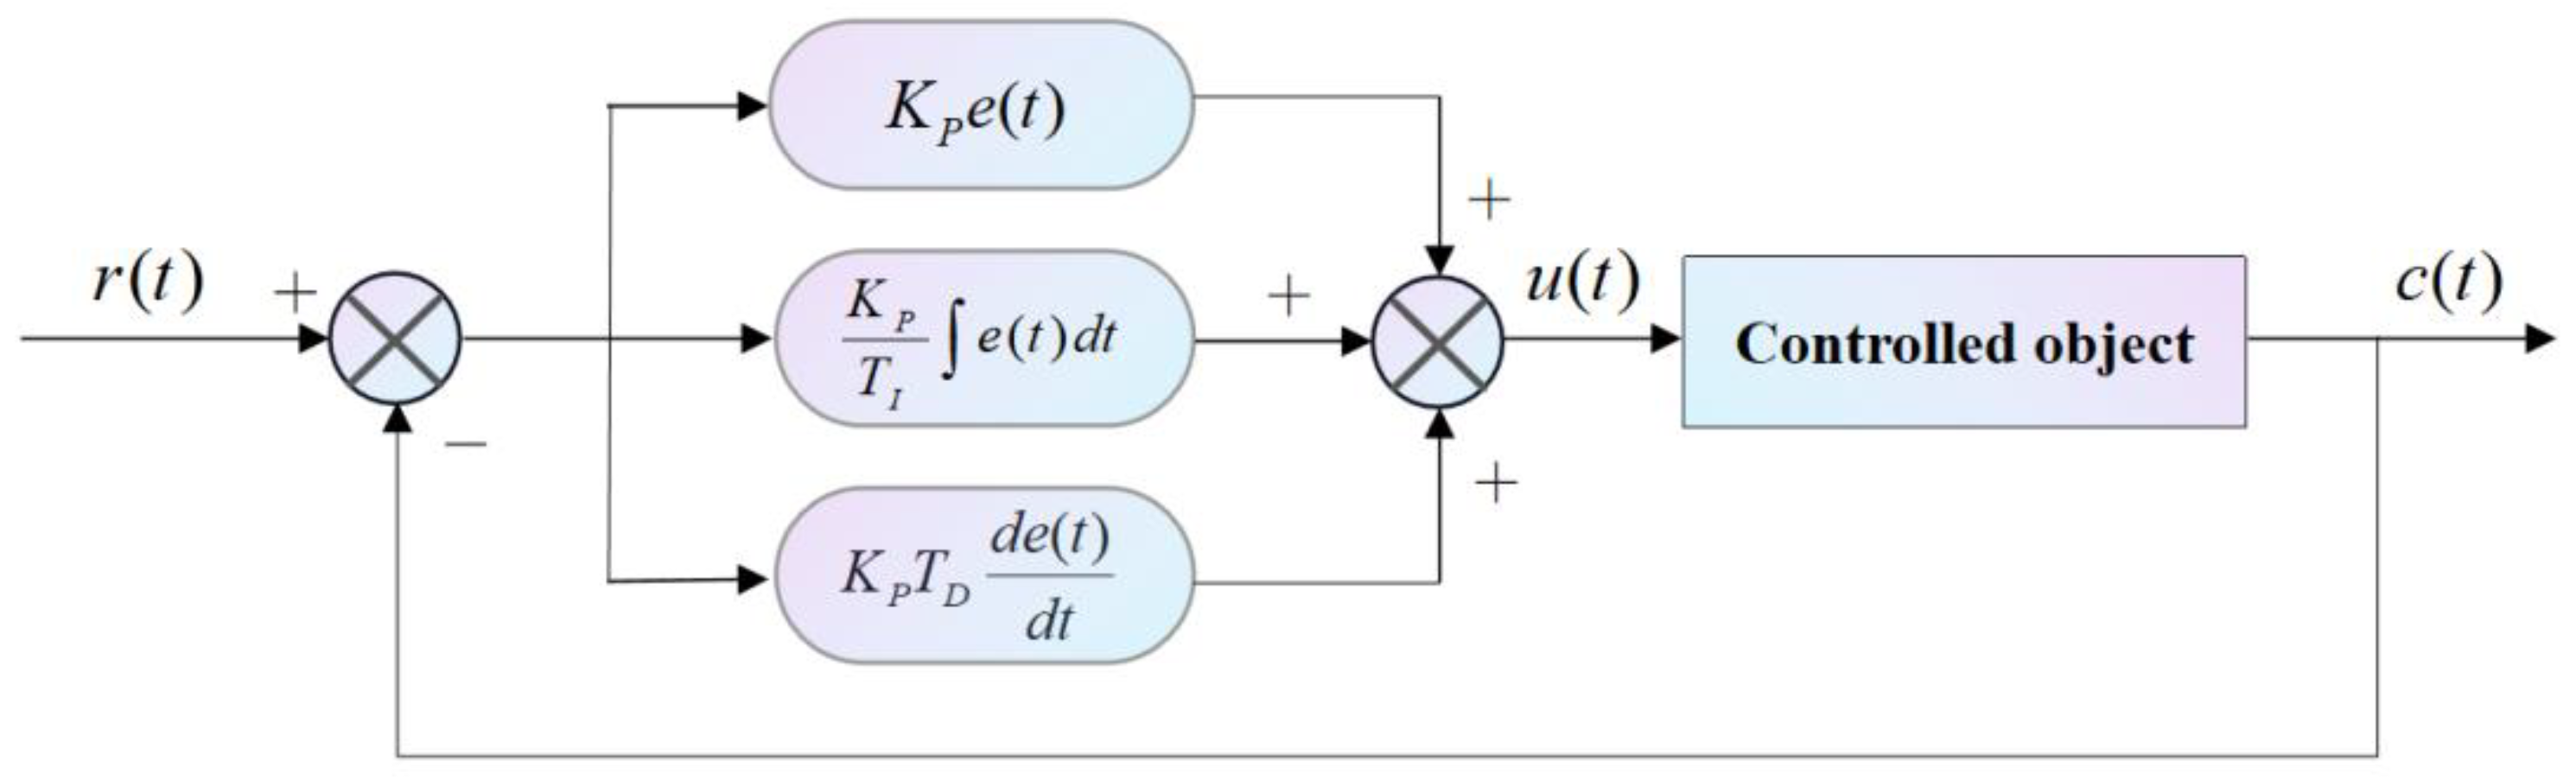
2.5. Design of EVPIVS-PID Control Strategy

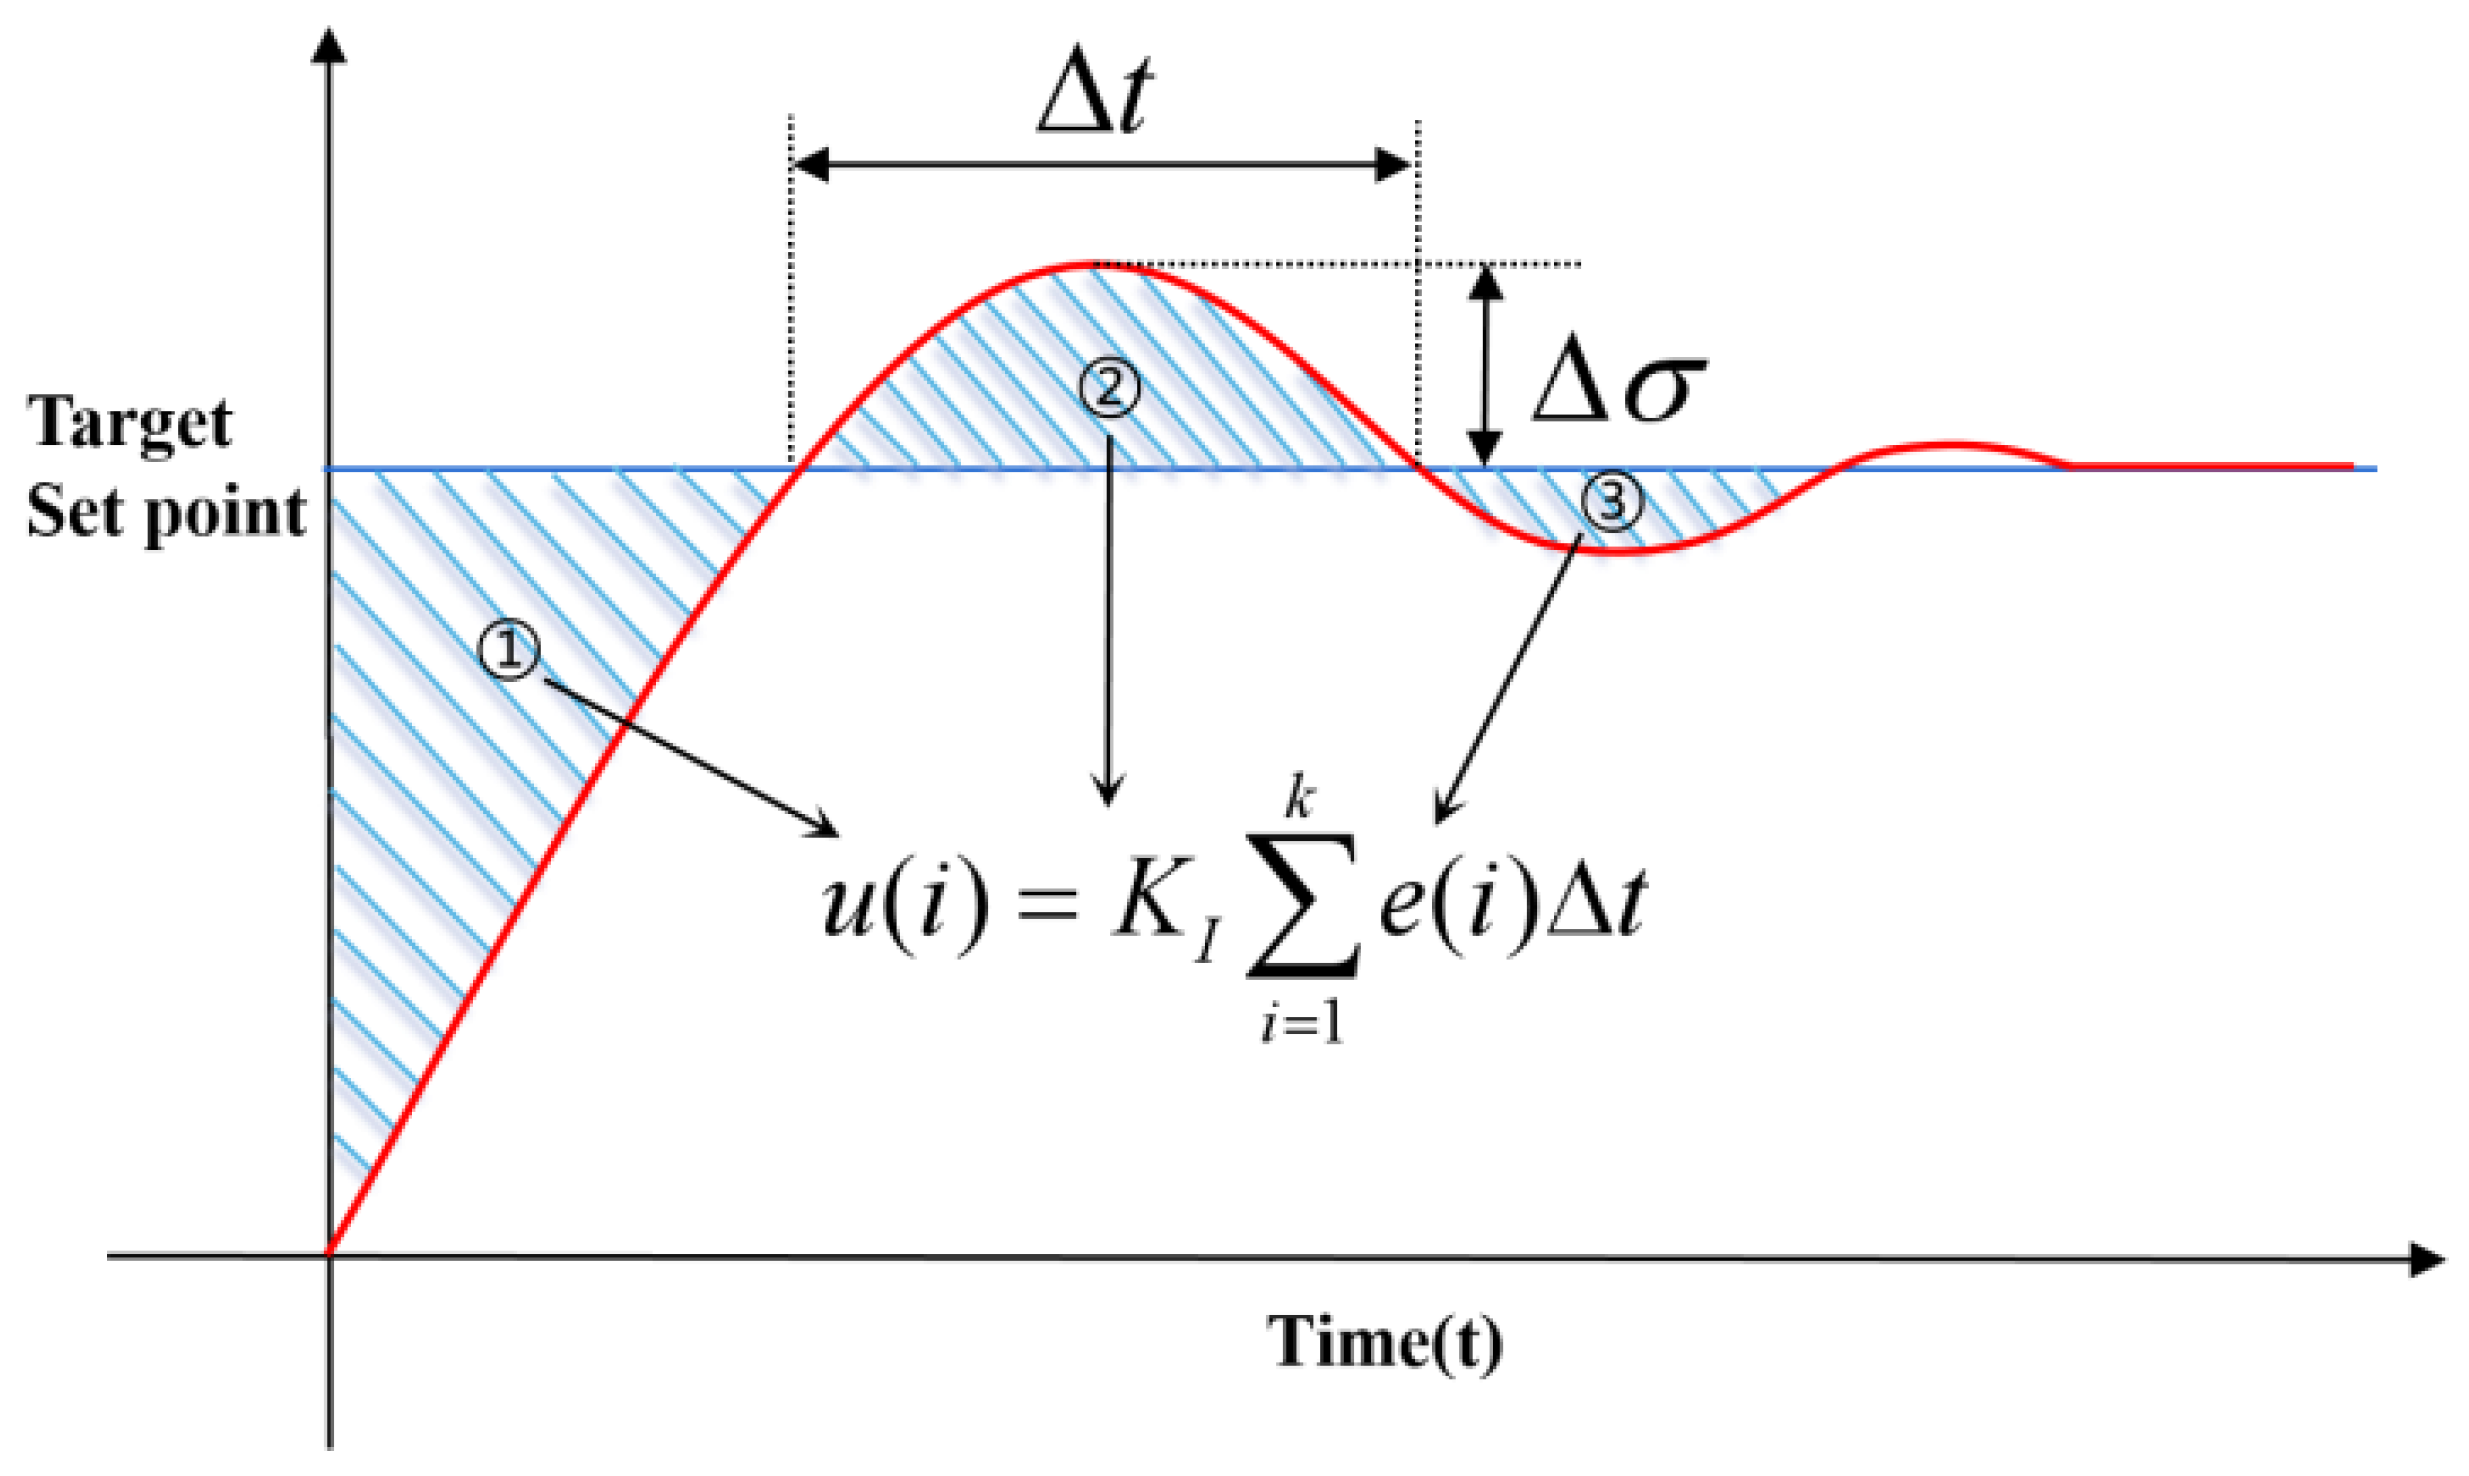
2.5.1. The Limitation of Traditional PID to Deal with Integral Saturation

The current mainstream, closed-loop automatic control technology is mainly based on the concept of feedback to reduce the uncertainty of the system [24]. Feedback theory mainly includes: measurement, comparison, and implementation. The purpose of measurement is to collect the actual value of the controlled object and compare it with the expected value. Its deviation is used to correct the response of the system and perform regulatory control. The most widely used adjustment strategy in practical engineering is proportional, integral, and differential control, referred to as PID adjustment. Figure 12 shows the PID control principle.
A PID controller is a linear controller for which the control principle is based on the difference between a given value, r ( t ) , and an actual value, c ( t ) .
e ( t ) = r ( t ) c ( t )
The proportional term, (P), the integral term, (I), and the differential term, (D), of the deviation are linearly combined to form a control variable to control the controlled object and become PID control. Its control law is:
e ( t ) = K p ( e ( t ) + 1 T I e ( t ) d t + T D d e ( t ) d t ) + M
where K P is the proportional coefficient and T I and T D are the integral time constants and the differential time constant, respectively.
In practical engineering, computer control is a kind of sampling control, which only calculates the control amount according to the deviation value at the sampling time. Thus, the continuous PID control algorithm cannot be used, and the control algorithm needs to be discretised. The PID control in this study uses a discrete digital PID controller.
According to the discrete PID control algorithm, the continuous time is represented by the sampling time point; the integral is approximately replaced by the rectangular method value; and the approximate differential is replaced by the first-order backward difference, namely:
{ t = k T ( k = 0 , 1 , 2 , ) 0 t e ( t ) d t T j = 0 k e ( j T ) = T j = 0 K e ( j ) d e ( t ) d t e ( k T ) e [ ( k 1 ) T ] T = e ( k ) e ( k 1 ) T
From this, the discrete PID expression can be obtained as:
u ( k ) = k p { e ( k ) + T T I j = 0 k e ( j ) + T D T [ ( e ( k ) e ( k 1 ) ] } = k p e ( t ) + k i j = 0 k e ( j ) T + k d e ( k ) e ( k 1 ) T
In the formula, k i = k p / T I , k d = k p T D , T is the sampling period; k is the sampling number, k = 1 , 2 , , e ( k 1 ) , and e ( k ) are the deviation signals obtained at the ( k 1 ) and k times, respectively.
The purpose of PID introducing the integral link is mainly to eliminate static error and improve control precision. However, when the process starts, ends, or greatly increases or decreases the setting, the system will have a large deviation output in a short time, resulting in the accumulation of the PID operation integral term. It causes the control amount to exceed the limit action amount of the maximum action range that the actuator may allow, causing large system overshoot and even system oscillation.
The large increase in the error of the integral link has a large cumulative amount, because the integrator satisfies the following formula:
K I 0 t e ( t ) d t
Its discretised form is expressed as:
K I i = 1 k e ( i ) Δ t
From the above formula, it can be concluded that with the increase of time, a large error, e ( i ) , is accumulated each time, which makes it easy to cause the integral saturation and produce a large overshoot. When the error begins to become negative, although the integral link starts to accumulate negative numbers, and because the previous integrator accumulation link value is too large, the PID will still maintain a large output for a period of time, causing a large system to pass the adjustment. Finally, the situation shown in Figure 13 is produced.
According to Figure 13, the role of the integral link mainly exists in the three-stage process. In the rising stage, there will be a large error change, so the integrator accumulates a large value. The area of the shaded part in ①, in the Figure 13 represents the accumulated value of the integrator. When entering the ② overshoot link, due to the existence of the previous integral link, the system will continue to accumulate for a period of time, and the system overshoot state will occur at this stage. When the integral leaves the saturation and enters the ③ oscillation stage, the integral link begins to have a positive effect on the system adjustment, eliminating the steady-state error and promoting the system output to reach the set value.
It can be concluded that when the integrator is eliminating the steady-state error, if the integral saturation phenomenon occurs, it will cause a large overshoot of the system; the change speed of the reverse adjustment will become slower, and the system’s Δ t and Δ σ in the figure will become larger. Therefore, in order to prevent the PID controller from generating integral saturation, it is necessary to improve the PID control algorithm to meet the requirements of the header control system.

2.5.2. Improved Design Based on Internal Integral Term

In the common PID control algorithm, since the integral coefficient, K I , is constant, the integral increment in the control link remains unchanged. In the ground profiling control system that often requires fine-tuning of the header under high-speed harvesting operations, the requirement for the integral term is that the effect of the integral term should be weakened or even absent when the system deviation is too large and should be strengthened when the deviation is small. Therefore, how to change the integral speed, according to the system deviation, is a crucial part of the header control system.
The design idea of the control algorithm in this study is to change the cumulative speed of the integral term in the PID to make it change synchronously with the deviation. The larger the deviation, the slower the integration, and vice versa. A coefficient, ( e ( k ) ) , is set for this, which is a function of e ( k ) . When | e ( k ) | increases, ( e ( k ) ) decreases, and vice versa. Therefore, the expression of its PID integral term is:
u i ( k ) = k I { i = 0 k 1 e ( i ) + [ e ( k ) ] e ( k ) } T
The relationship between ( e ( k ) ) and | e ( k ) | is set as:
[ e ( k ) ] = { 1 , ( | e ( k ) | B ) A | e ( k ) | + B A , ( B < | e ( k ) | A + B ) 0 , ( | e ( k ) | > A + B )
The value of ( e ( k ) ) changes in the interval [0, 1]. When | e ( k ) | is greater than the given separation interval, A + B, ( e ( k ) ) = 0 stops the accumulation of the current value e ( k ) . When the deviation value, | e ( k ) | , is less than B, the integral term is the same as the general PID integral term, u i ( k ) = k I i = 0 k e ( i ) T . When | e ( k ) | is between B and A + B, the current value is accumulated, and its value changes according to the size between 0 and | e ( k ) | , and its integral speed is between k I i = 0 k 1 e ( i ) T and k I i = 0 k e ( i ) T .
Therefore, the new PID algorithm with the improved integral term is:
u ( k ) = k P e ( k ) + k I { 0 k 1 e ( i ) + [ e ( k ) ] e ( k ) } T + k D [ e ( k ) e ( k 1 ) ]
After discretising the same transfer function, the unit step response comparison between the improved PID and the ordinary PID is shown in Figure 14. From the figure, we can see from the left coordinate axis that the improved PID rise adjustment time is significantly lower than the ordinary traditional PID control. According to the Y-axis display on the right, the coefficient of the improved PID integral term is 0 when the difference, e ( k ) , between the target value and the actual value is the largest, and increases as e ( k ) decreases, while the traditional PID integral term coefficient remains unchanged.

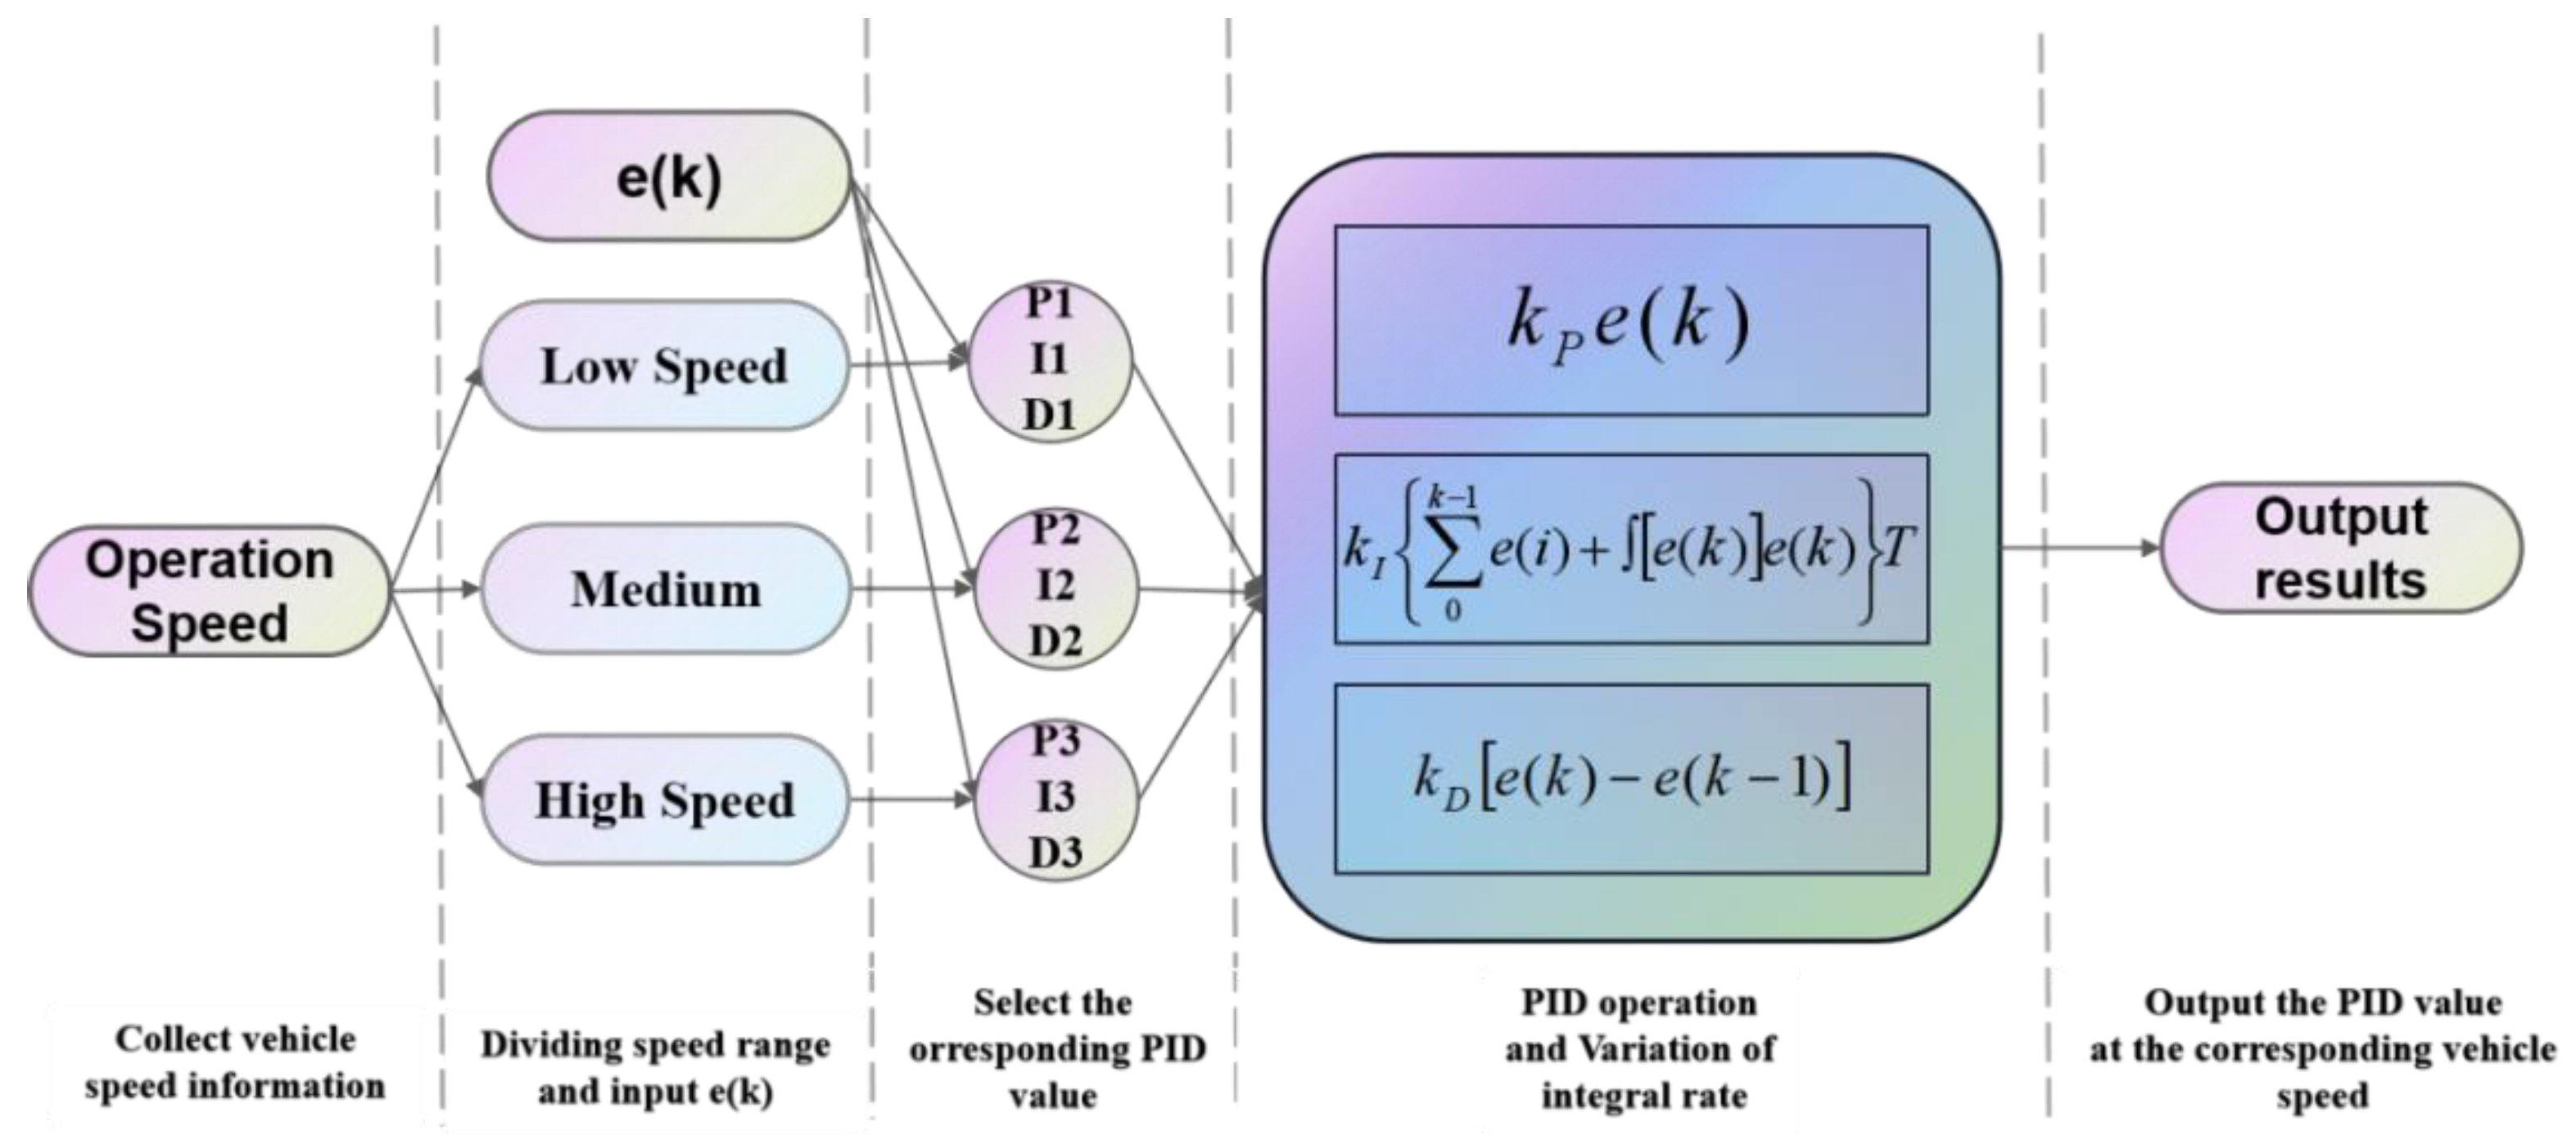
2.5.3. Design of EVPIVS-PID Based on Vehicle Speed and Error Detection

In the actual harvesting operation of the harvester, the harvesting speed is generally 5–11 km/h, according to different tasks [25]. Different harvesting speeds have different requirements on the response time of the header adjustment. Under high-speed operation, the header is required to have a fast adjustment response, but under low-speed operation, the excessively high response sensitivity of the header will damage the mechanical mechanism at the connection of the header. Therefore, in the actual receiving operation, it is necessary to divide the high, medium, and low operating speed areas according to the different vehicle speeds, and set different proportional, integral, and differential parameters for each area.
This external monitoring operation speed change corresponds to the PID parameters, and the improved PID method that internally changes the integral term coefficient, ( e ( k ) ) , based on the difference, e ( k ) , between the target value and the actual value is called EVPIVS-PID (external variable parameter internal variable speed). Its control algorithm structure principle is shown in the Figure 15.
When the height difference between header height and target height is very small, the control system will still have signal output. In order to ensure the stability of the control system when the header height is near the target height and avoid the vibration of the header height near the target value. Therefore, a new control strategy is added to evpivs-pid control system. When the difference between header height and target height is less than 15 mm, the system completes the adjustment by default and the adjustment will not continue. Otherwise, the adjustment of the next programme cycle will be performed. Equation (18) is an expression of this control strategy.
{ E V P I V S P I D O u t p u t = 0 ( e ( k ) 15   m m ) E V P I V S P I D O u t p u t = u ( k ) ( e ( k ) > 15   m m )

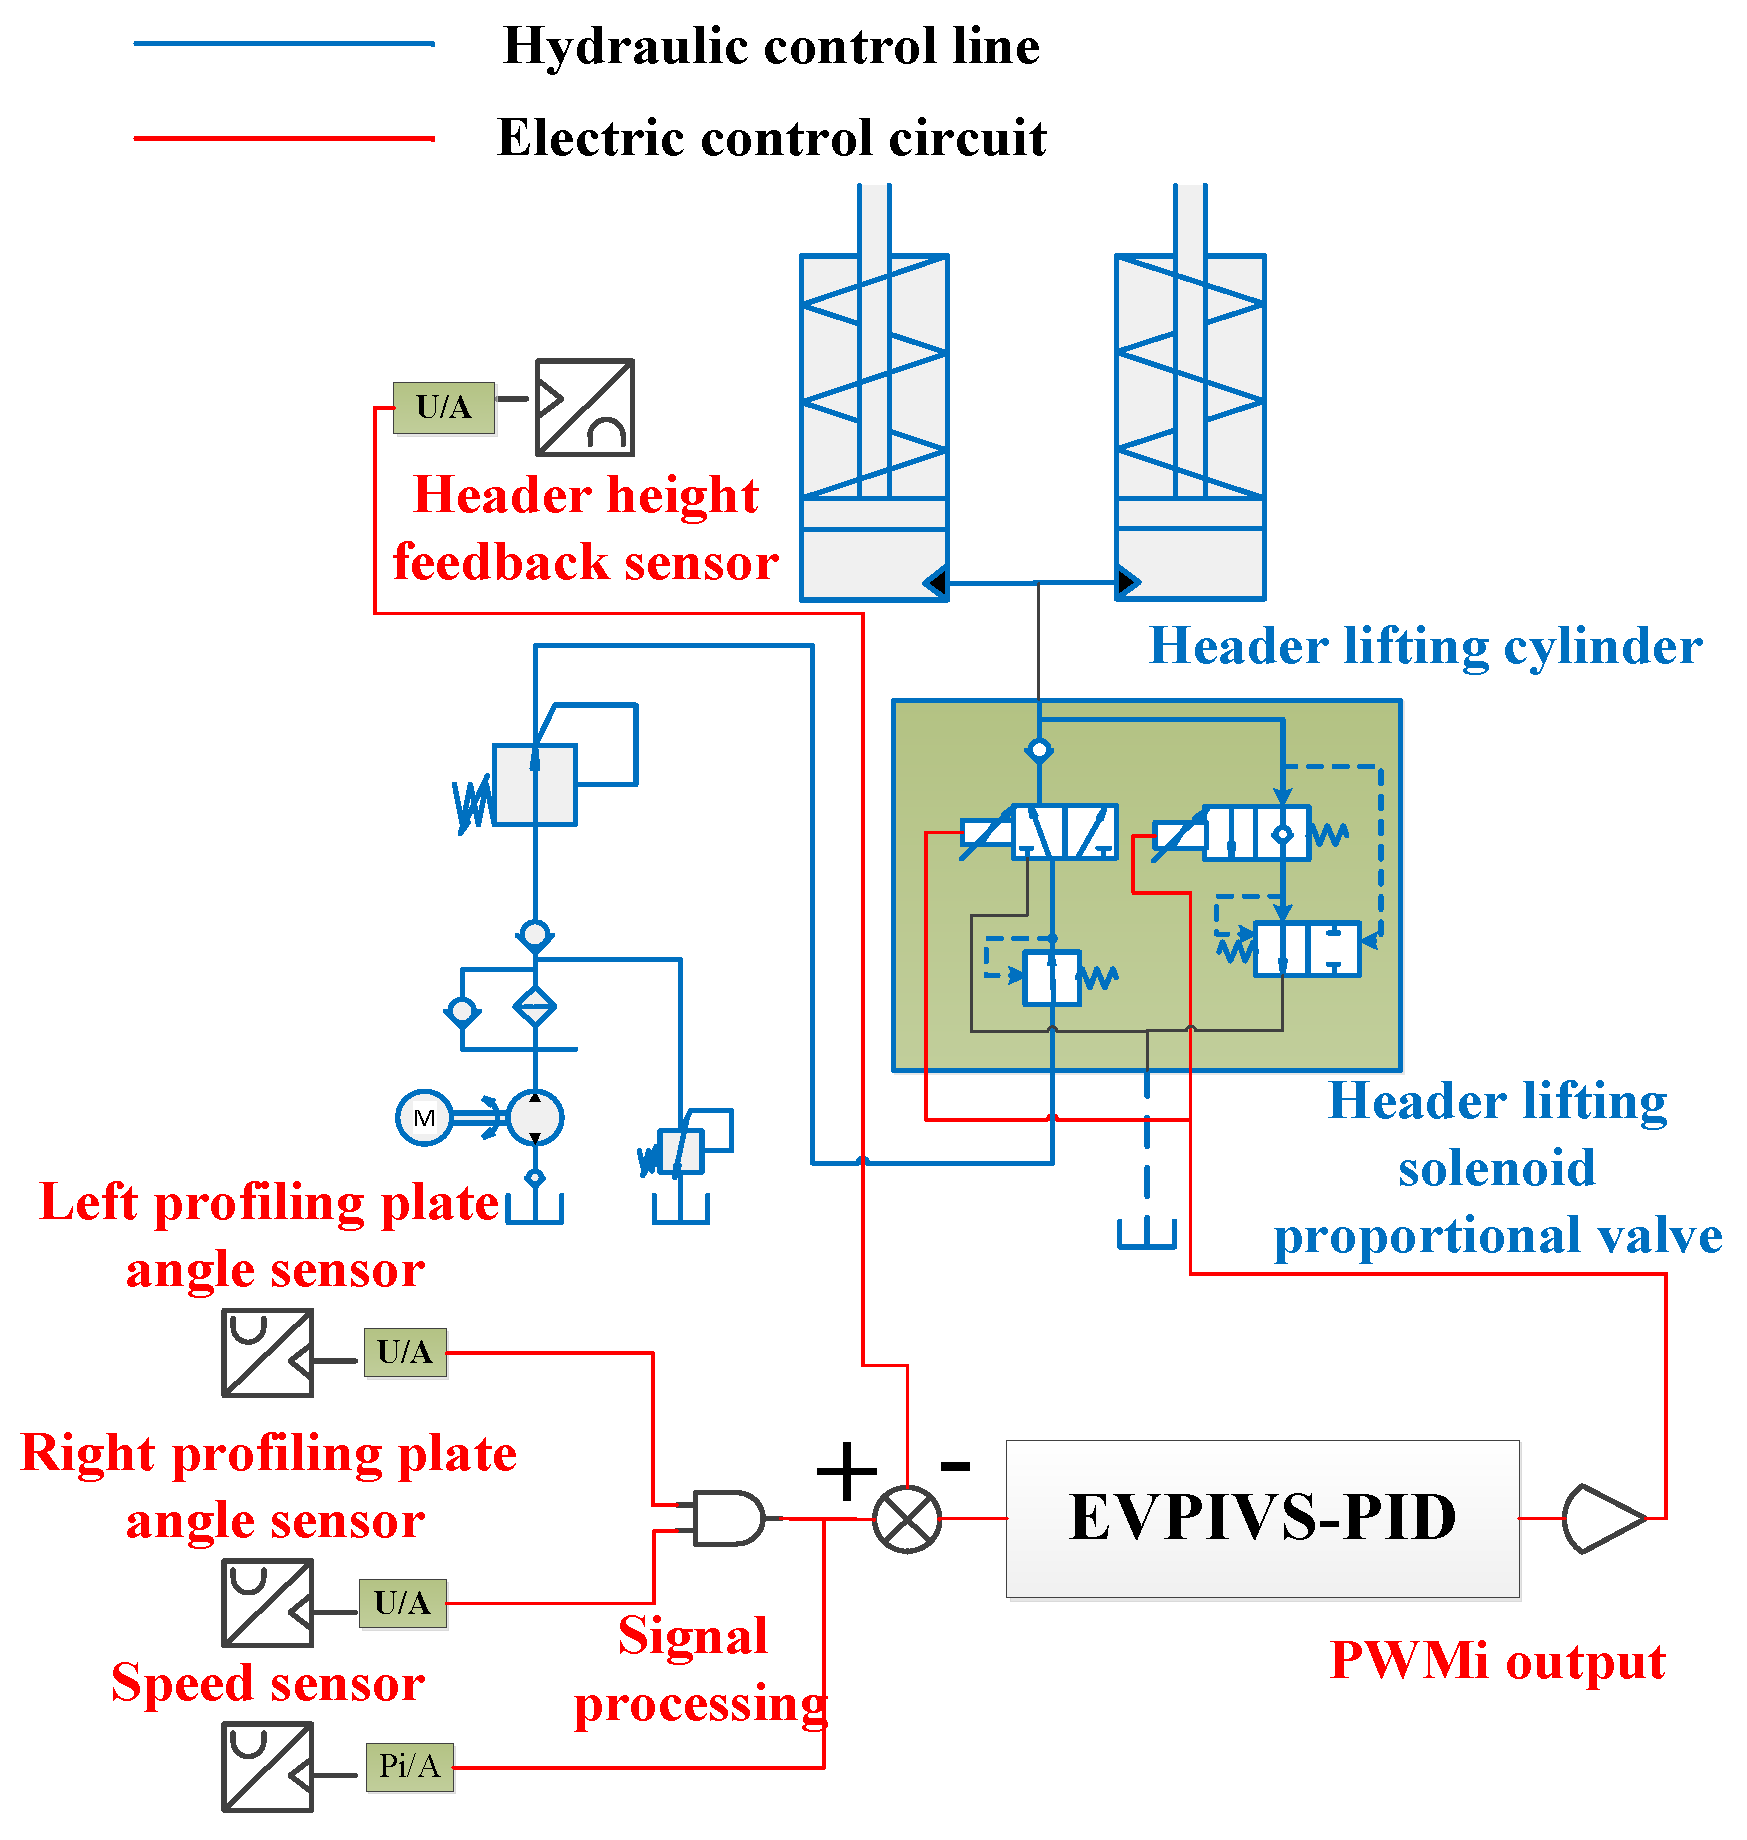
2.6. Principle of Electro-Hydraulic Hybrid Control

Based on the above analysis, the structure principle of the EVPIVS-PID header height control system based on sensor ground profiling monitoring was designed. The system is an electro-hydraulic hybrid control system. Its control principle is shown in Figure 16.
The blue area in the Figure 17 is the hydraulic system part, and the red area is the electronic control system part. The on-board diesel engine drives the hydraulic pump to supply oil to the hydraulic circuit at a speed of 2100 rad/min. Under the action of the relief valve (30 bar), the system oil pressure is stabilised within a certain range. The profiling roller at the bottom of the header swings up and down with the fluctuation of the ground, driving the angle sensor to rotate and output a certain voltage signal. The on-board controller calculates the height between the bottom of the header and the ground according to the input signal, and calculates the current feedback height of the header. At the same time, calculate the difference between the actual height of the current header and the target set height. According to formula (20), when the difference is greater than 15 mm, the on-board controller will divide the vehicle speed into different intervals by accepting the current vehicle speed signal and using the principles discussed in Section 2.5.3 and Figure 13, and then assigning the corresponding proportional P, integral I, and differential D coefficients externally to perform data operations. The internal calculation method of PID adopts the description in Section 2.5.2 and uses the method of variable limit of integral term to improve the operation. The output PWM value is converted into a PWMi current in the inner loop of the controller, and acts on the integrated solenoid proportional valve. The integrated electromagnetic proportional valve adjusts the hydraulic system in accordance with the discussion in Section 2.3 and pushes the header to adjust the lifting and lowering. The height feedback sensor of the header feeds back the actual height of the header in real time.

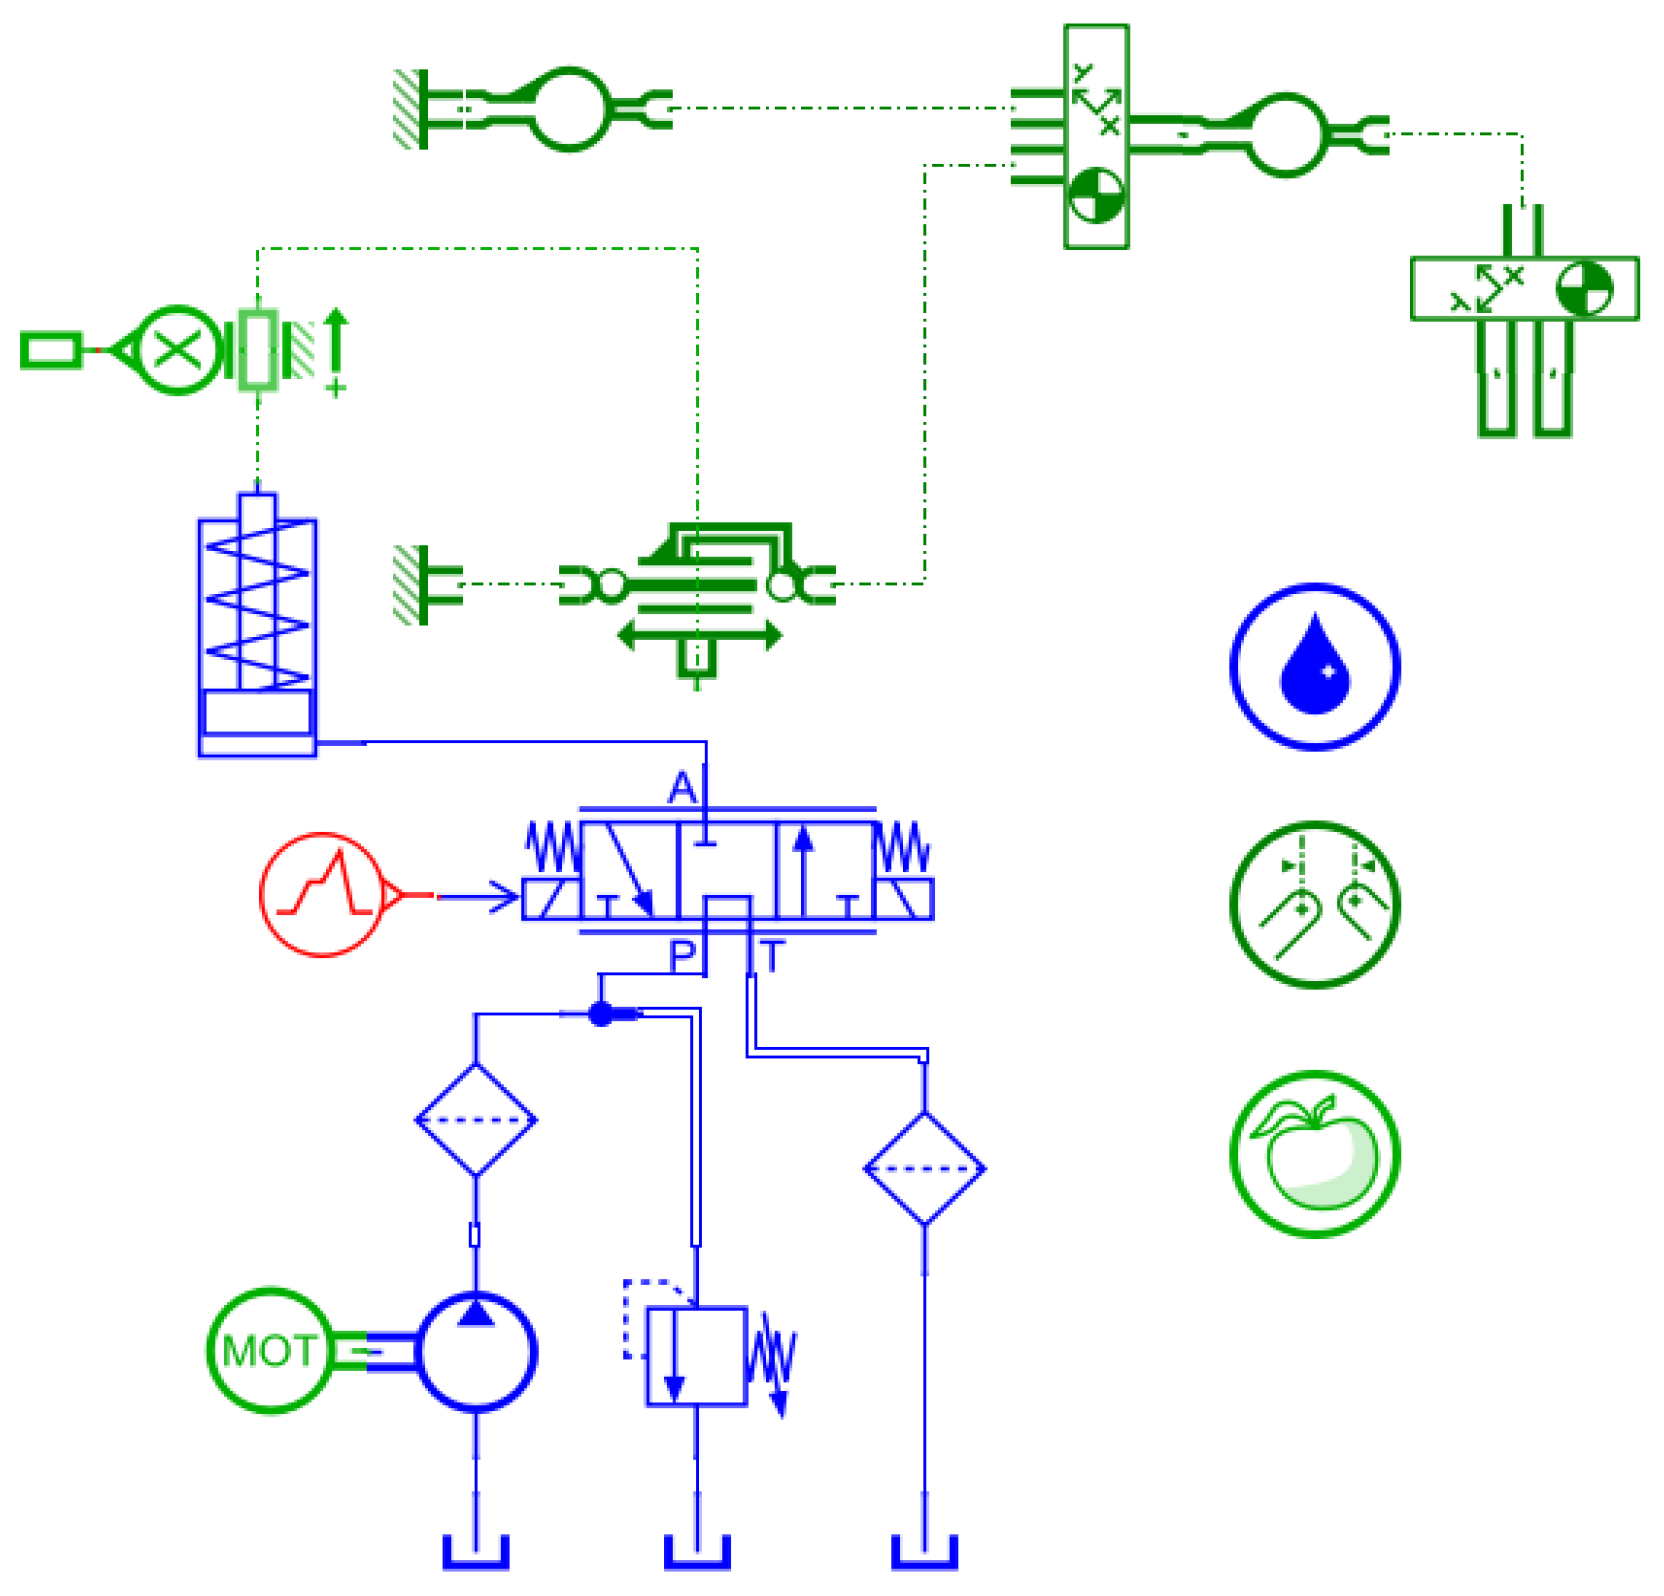
2.7. Methods of Amesim Simulation Tests

In order to further demonstrate whether the selected hydraulic cylinder specifications can meet the system adjustment function, the hydraulic system engineering modelling is built by using the hydraulic simulation software, Amesim [26]. System-related parameter settings are shown in Table 3.
The hydraulic system modelling is shown in Figure 18.
In the figure, the green part is the header suspension structure built with the components in the software “1D Mechanical” library; the blue part is the hydraulic system built by the modules in the “Hydreulic” library; and the red part is the input current signal. In order to better verify the execution function of the hydraulic system, the input signal adopts the cycle mode of “oil supply for 3 s—pressure holding for 2 s—oil return for 3 s—pressure holding for 2 s” to adjust the hydraulic system. The simulation time is 20 s, and the simulation results are in Figure 19.
When the hydraulic valve spool moves to the left, the hydraulic oil enters the A port from the P port, and the header cylinder pushes the header up under the action of 100–130 bar pressure. The hydraulic flow rate of port P is kept at 15 L/min. (Figure 18a). After 2.38 s, the oil cylinder of the header ends the action stroke (Figure 18b). At this time, the hydraulic flow rate of port P is 0, and the oil pressure of the header cylinder is 300 bar. When the spool of the hydraulic valve moves to the right, the hydraulic oil flows from port P to port A, and the hydraulic cylinder completes the descending action of the header under the conditions of 100–130 bar and flow rate of 15 L/min.
It can be concluded from this that when the system oil supply is stabilised at 300 bar, the hydraulic cylinder with a 55 mm spool diameter is under the condition of a load of 1200 kg (single cylinder 600 kg). The time for the spool stroke to reach 275 mm is 2.38 s. In the simulation test of oil supply-pressure-holding-oil return, the step response of oil pressure and flow can meet the working requirements of the system.

2.8. Header Control Accuracy Test

The accuracy of cutting height is the main reference factor to judge the accuracy of the control system [27]. This study uses two test methods to demonstrate the accuracy of header height control. In order to test the accuracy of the header under different setting height conditions, this experiment adopts the cutting stubble under the harvesting environment with the vehicle speed of 5 km/h, and the stubble profiling height is set to 15, 16, and 17 cm, respectively. Among them, the 20 groups of data were randomly measured in each test for a comparative test. In order to verify the control effect of the header control system under different operating speeds, the stubble height is set to 16 cm, and 20 sets of data are randomly measured for the stubble height at three different operating speeds of 5, 8, and 11 km/h. The collection method is shown in Figure 19.
For the above experimental data, the sample variance is used to represent the accuracy of the height control of the header, and the calculation formula is:
σ 2 = i = 1 20 ( x i μ ) 2 20
In the formula, x i is the stubble height measured at the i-th time, μ represents the set value of the stubble height, and σ 2 is the sample variance.

2.9. Correlation Test between PWM and Header Height

In order to further demonstrate the accuracy of the corresponding output PWM value of the control system in the face of ground changes, we collected the profiling height of the header and the PWM values corresponding to the rise and fall of the header under three different operating speeds of 5 km/h, 8 km/h, and 11 km/h. The Pearson correlation coefficient was used to calculate the correlation between the PWM value output by the system and the height of the header under different vehicle speed conditions [28]. This proves the effective degree of the height control of the header. The relevant data is collected based on CAN communication data. Its formula is as follows:
r = i = 1 n ( X i X ¯ ) ( Y i Y ¯ ) i = 1 n ( X i X ¯ ) 2 i = 1 n ( Y i Y ¯ ) 2
In the formula, X i and Y i are the data of the two groups of samples, respectively, and X ¯ and Y ¯ are the mean values of the two groups of samples, respectively.

3. Results and Discussion

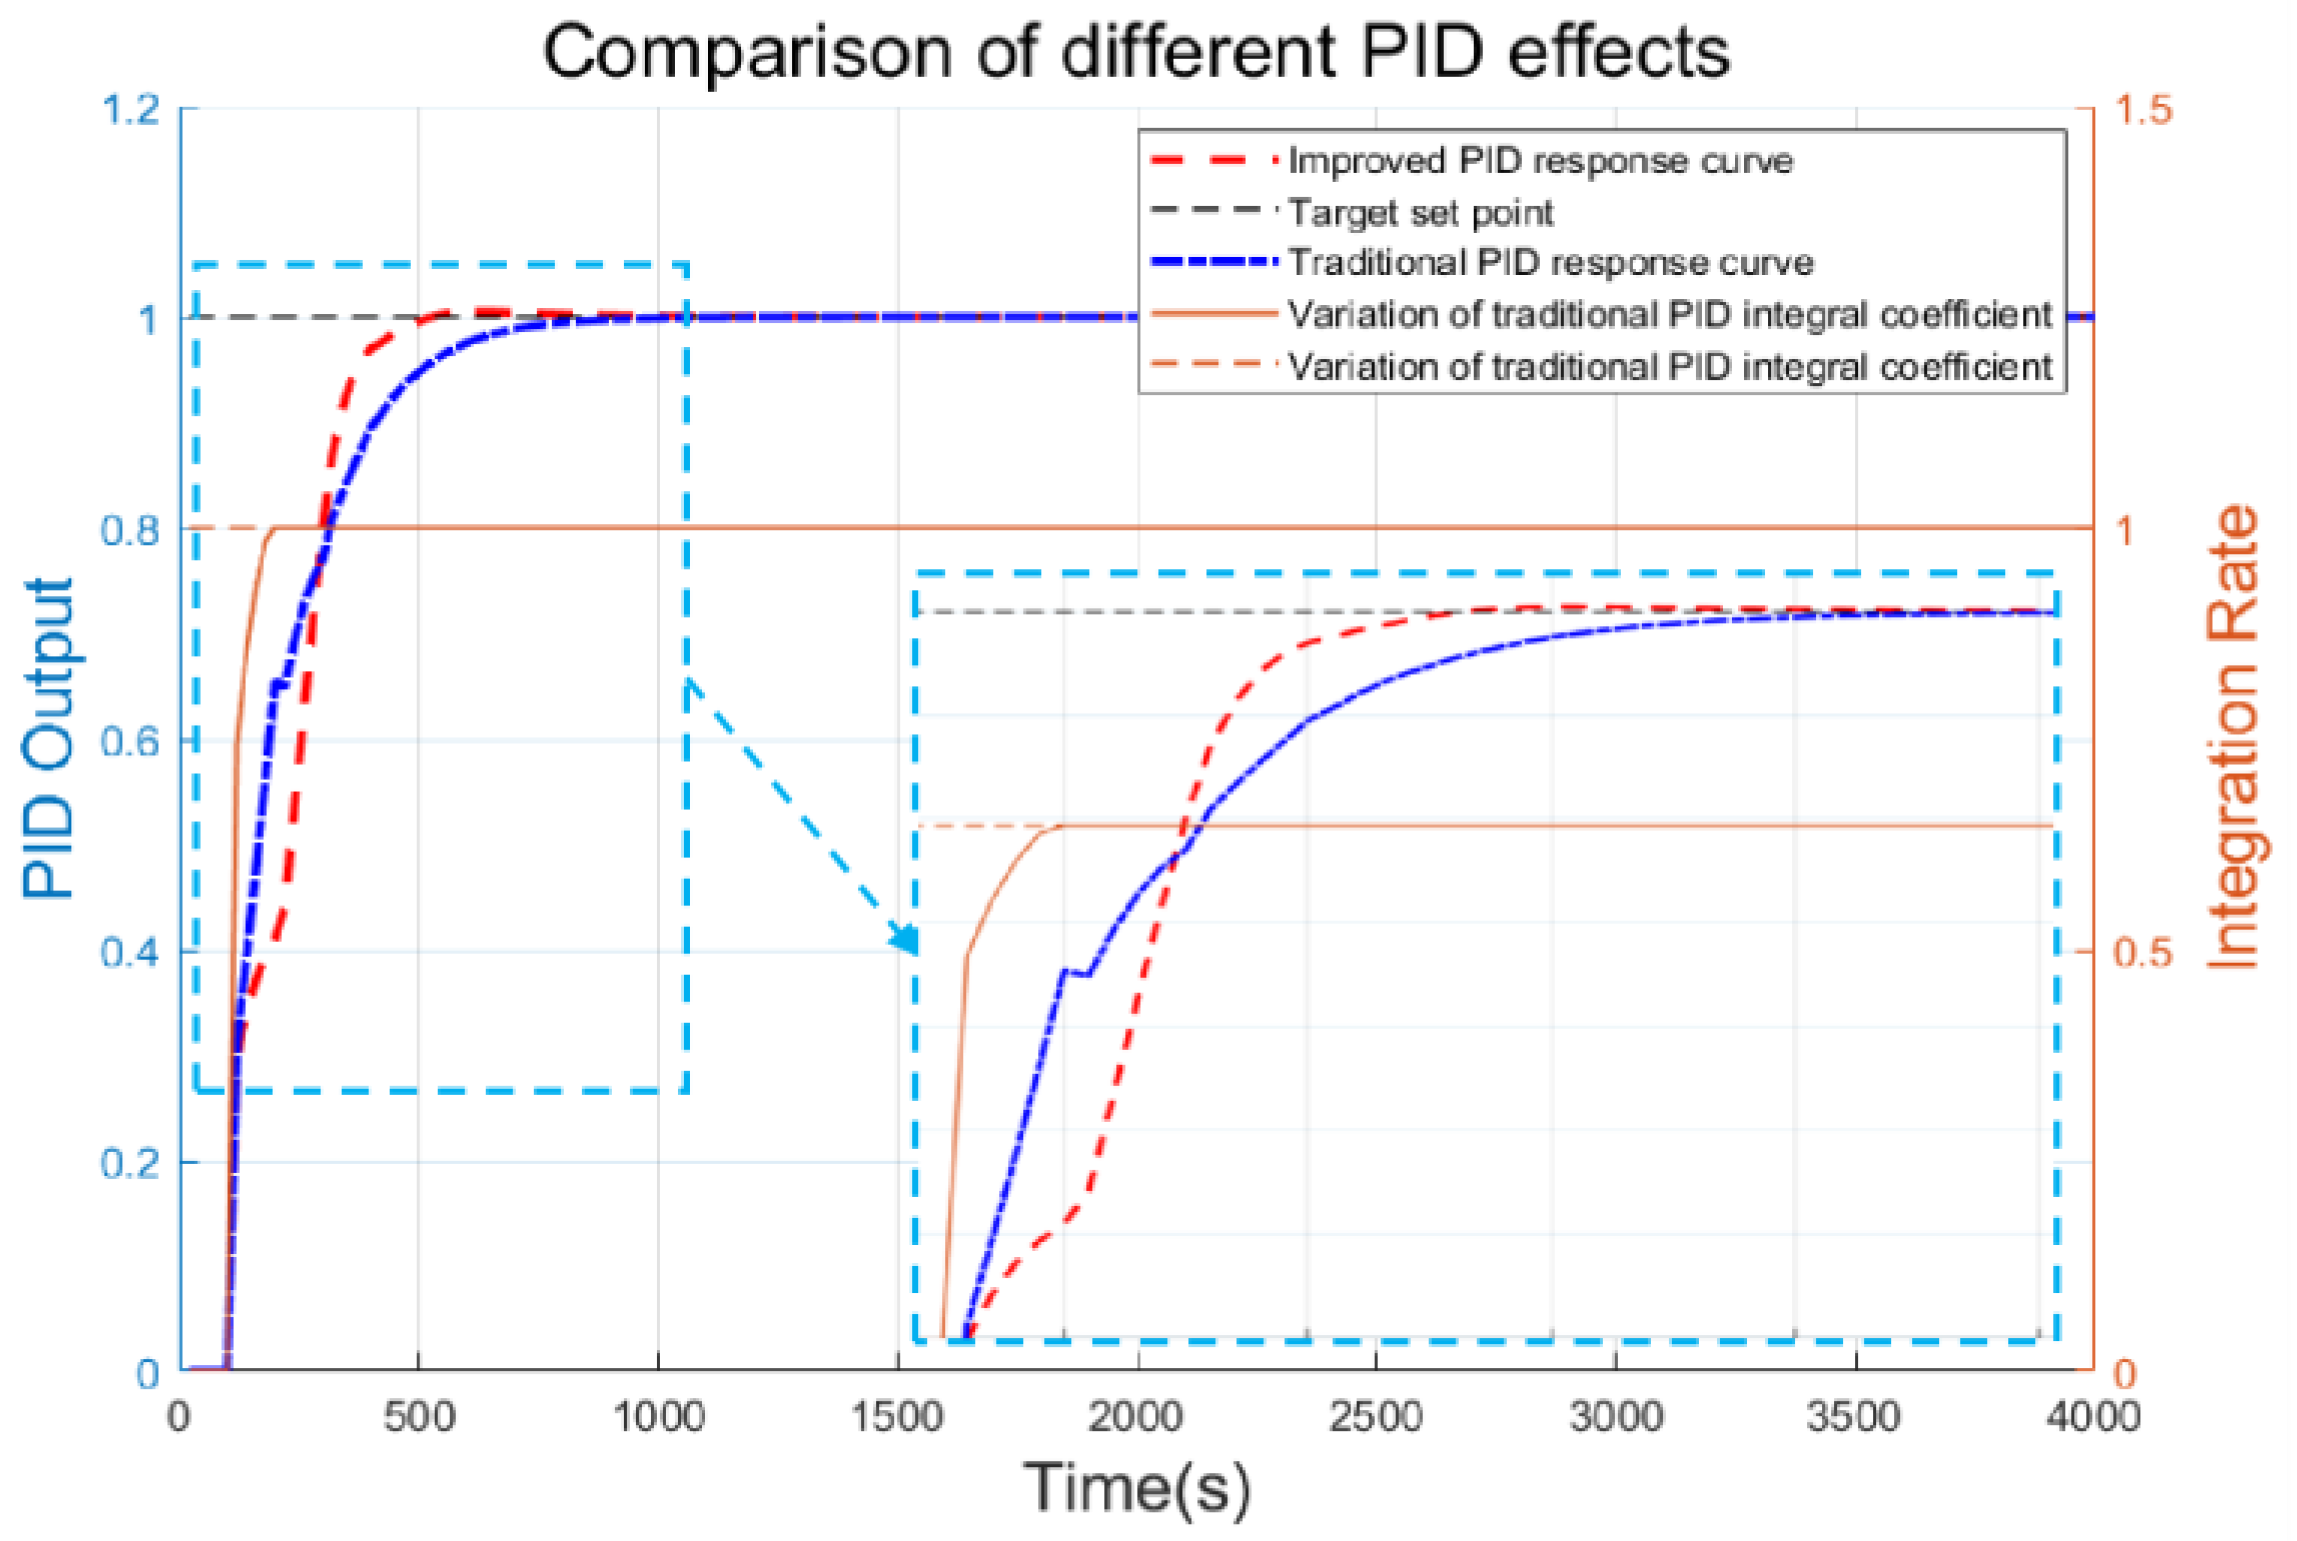
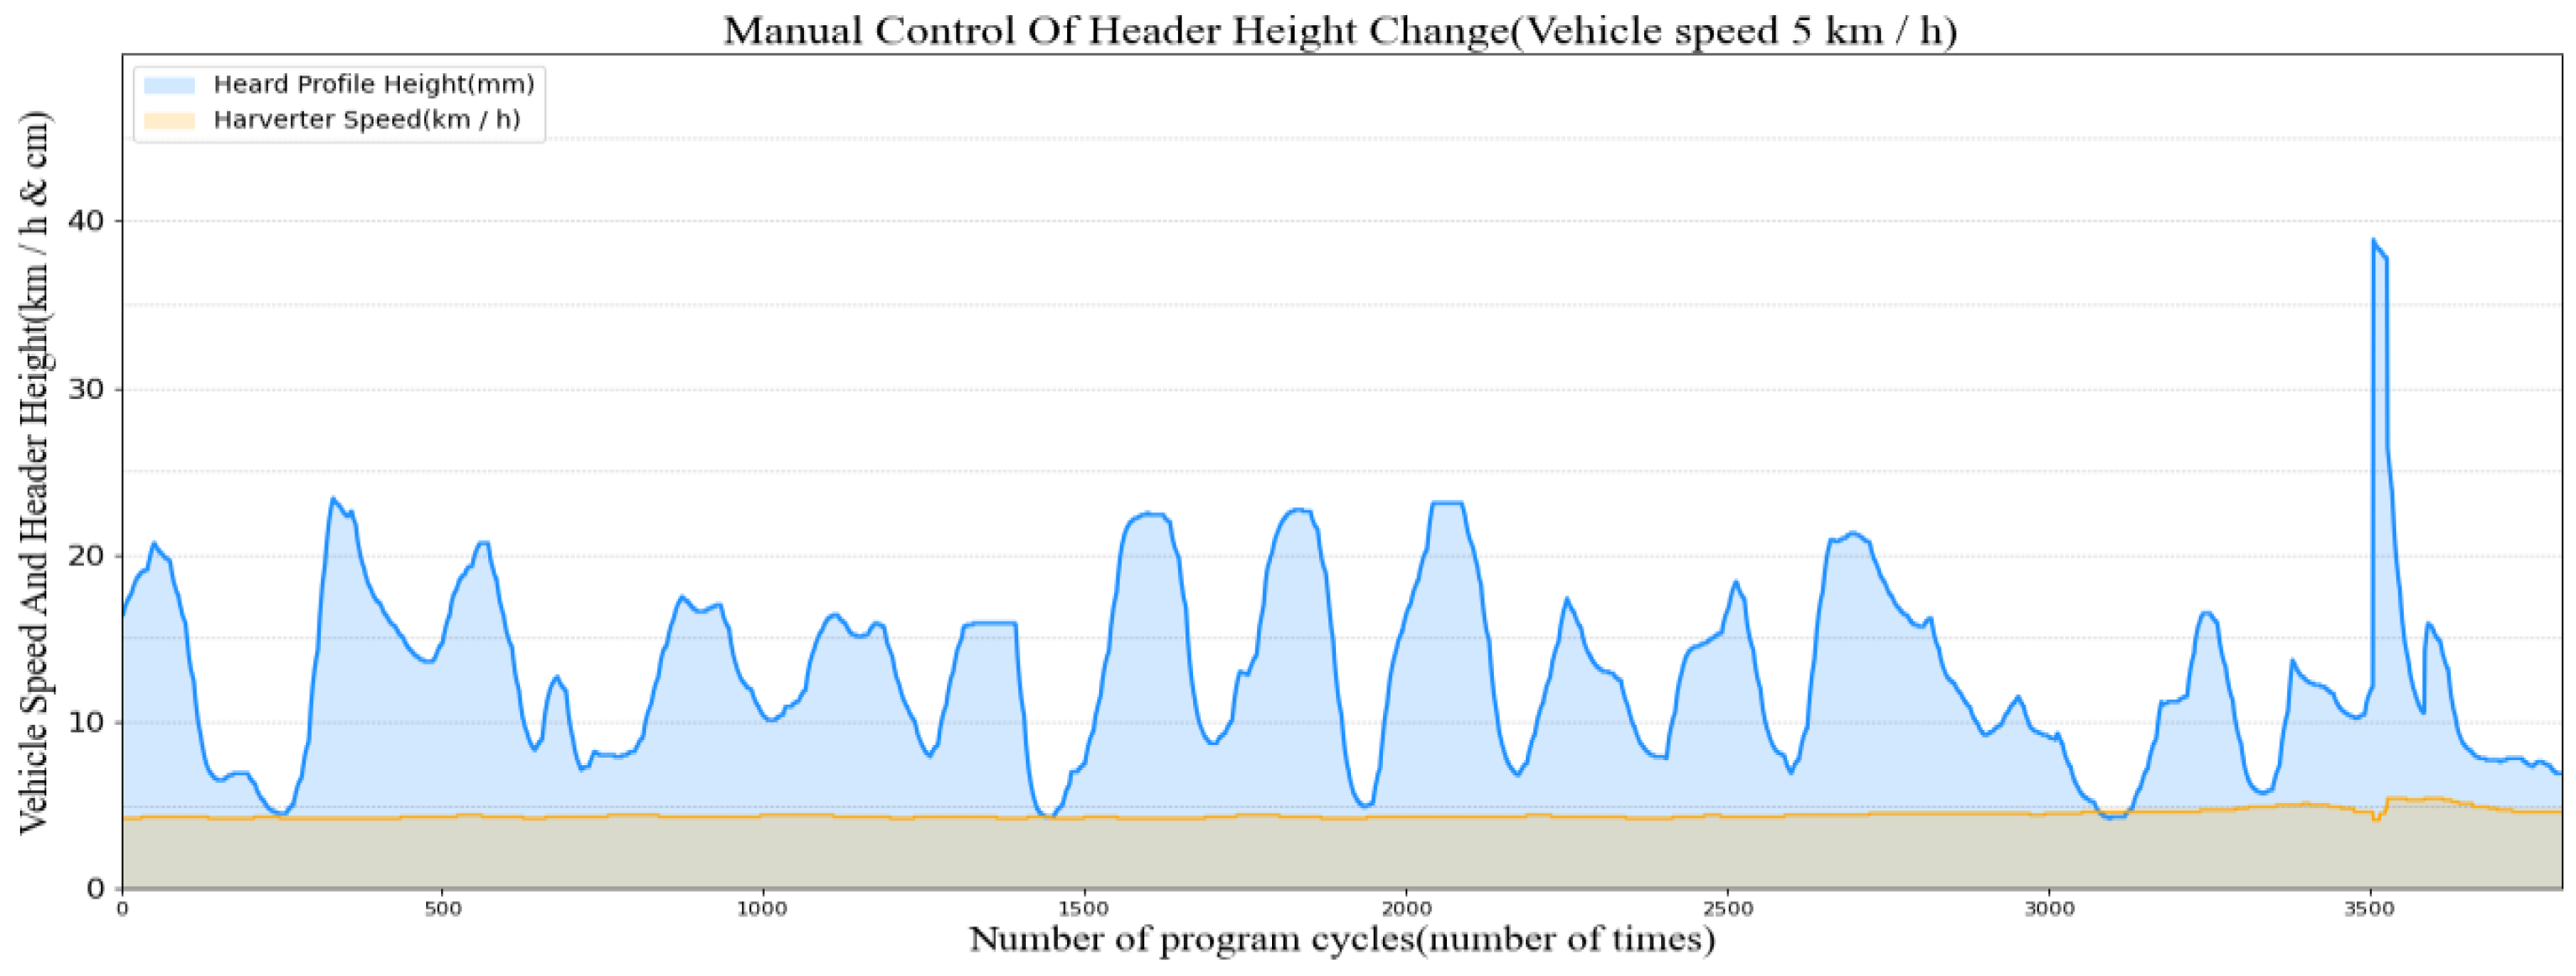
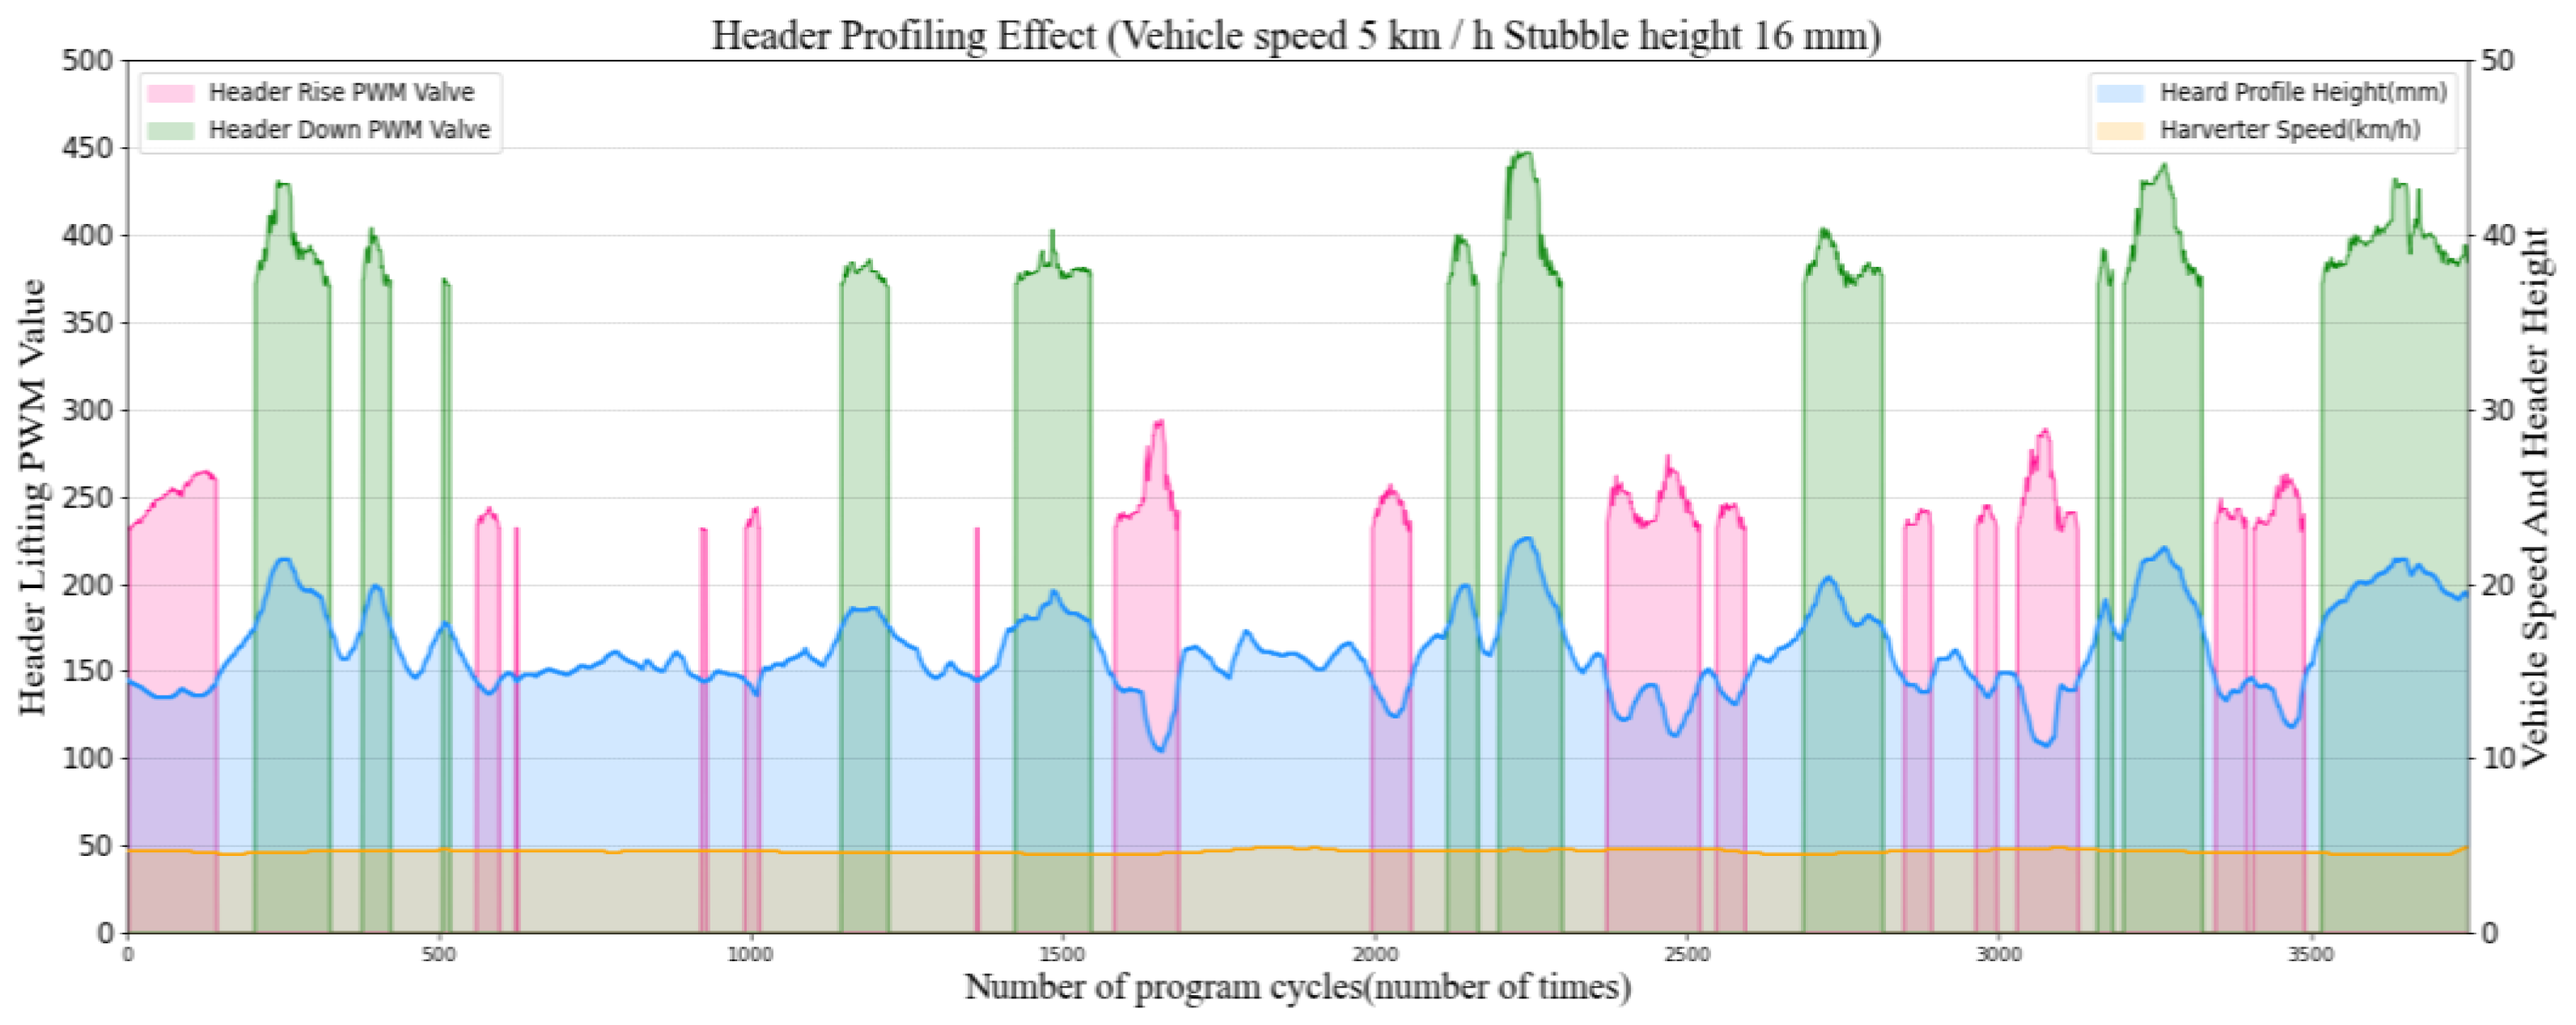
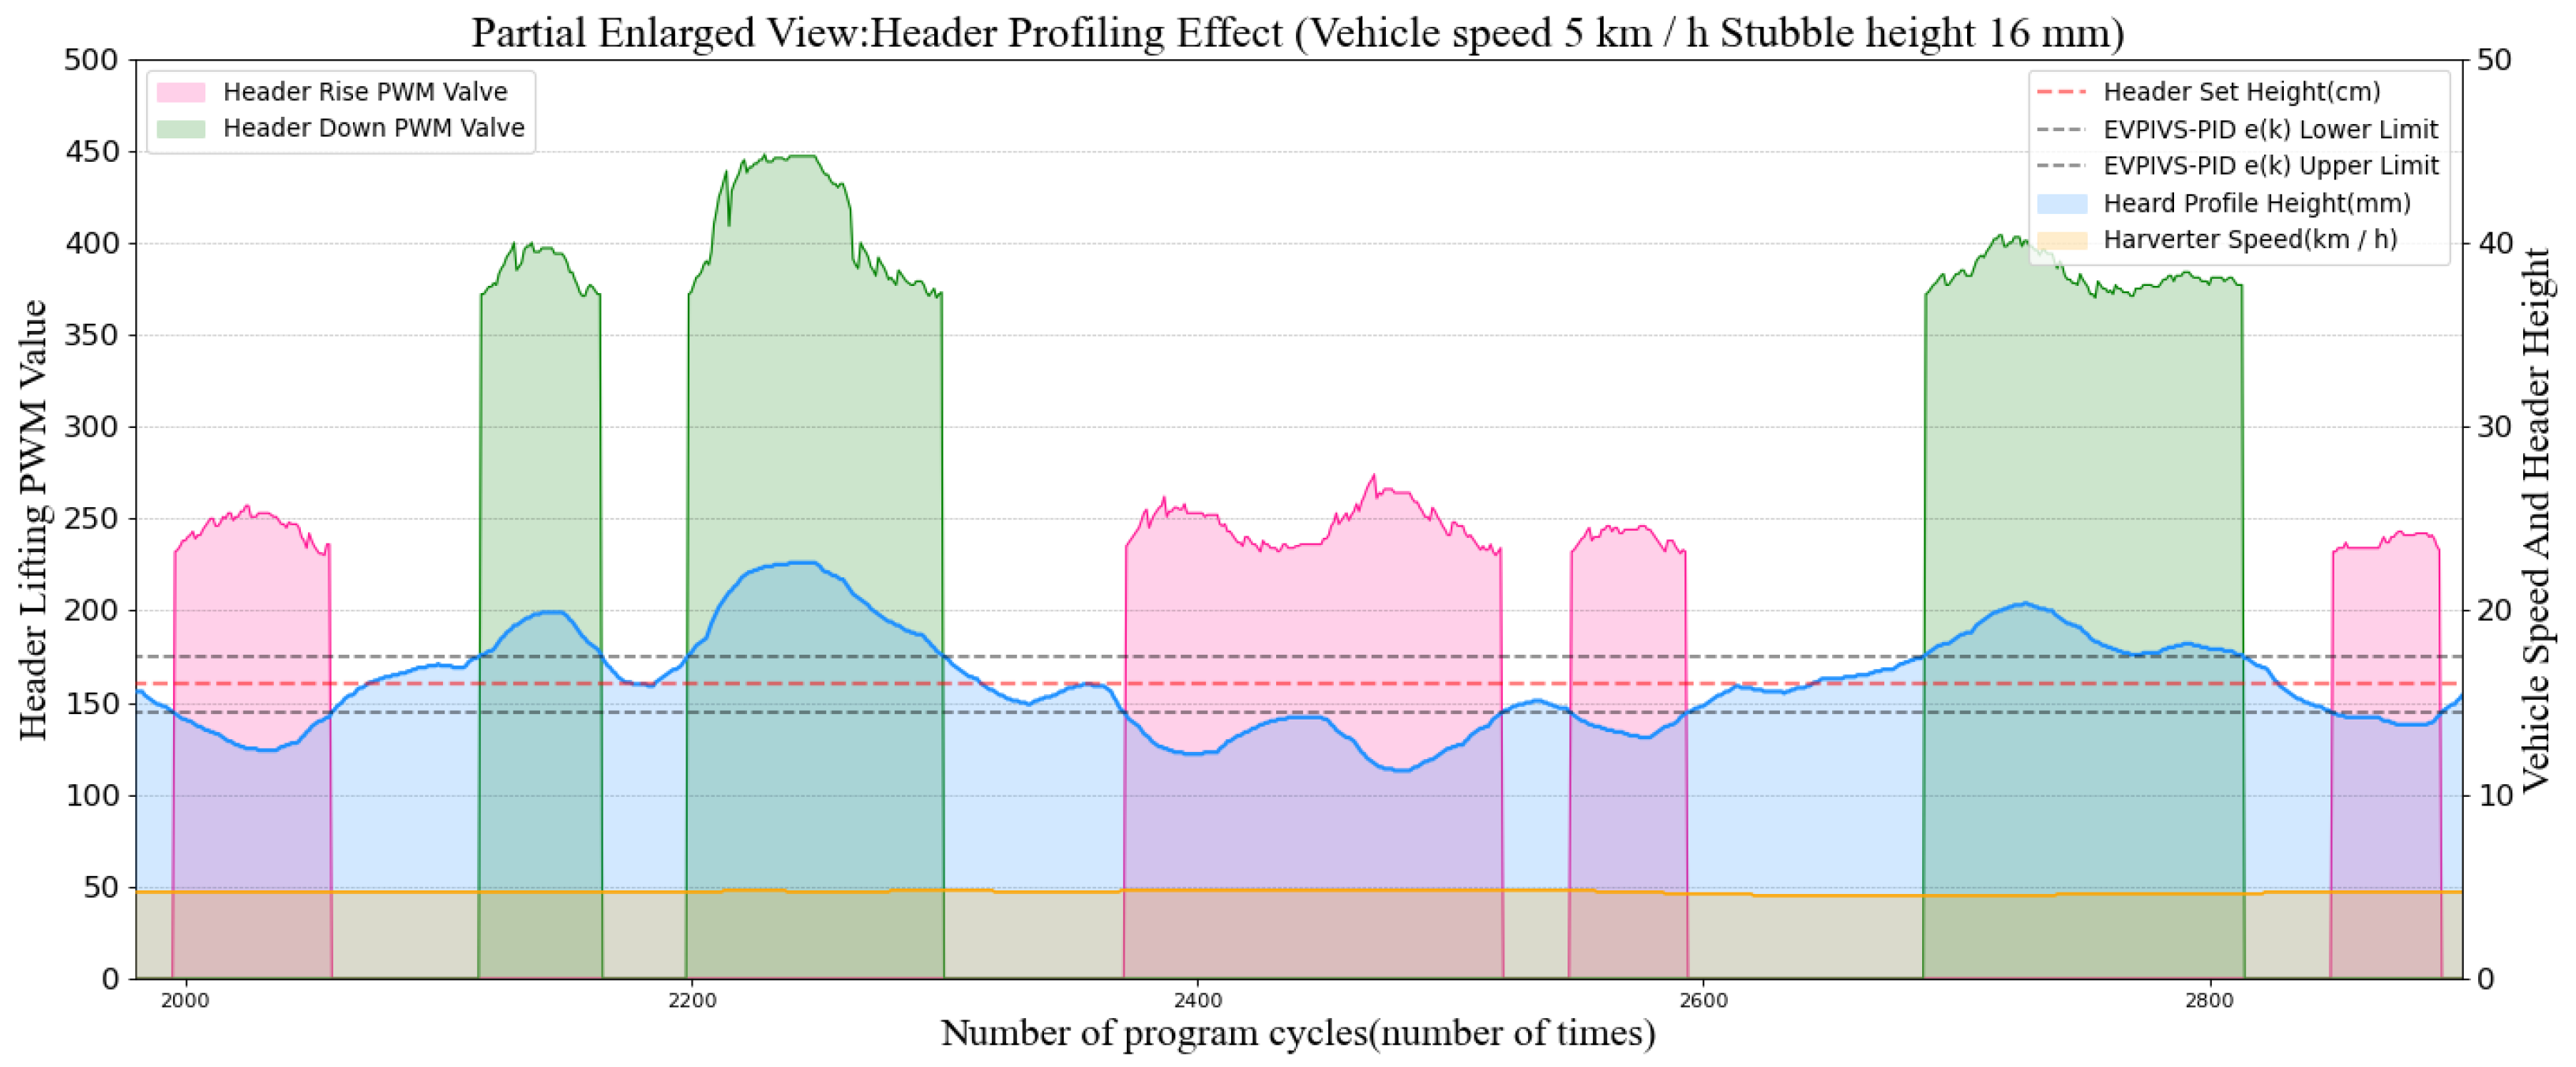
3.1. Comparison of Header Height Control Effect

In order to test the comparative effect of the EVPIVS-PID header control system in this study and the traditional manual control header, the control effects of these two control methods were tested at a harvesting speed of 5 km/h and a stubble height of 16 cm. The comparison effect is shown in Figure 20 and Figure 21:
Compare the relevant information of Figure 20 and Figure 21. The traditional manual control header height mode has a large header height fluctuation, and the header vibration amplitude is about 15 cm, up to 30 cm. The header height data of the two control modes are brought into the sample variance formula (19) for calculation. In the traditional manual adjustment mode, the sample variance value, σ 2 , of the header height is 53.4853, while the sample variance value of the header height of the EVPIVS-PID control system is 24.4757. According to the characteristics of sample variance, it can be concluded that the vibration dispersion degree of this height under traditional manual adjustment is higher than that of the EVPIVS-PID control system, and the EVPIVS-PID control system is more stable for header height control.
In order to demonstrate the effectiveness of Section 2.4.3, the 2000–3000 programme cycle in Figure 22 is now partially enlarged, and three auxiliary lines of 14.5 cm, 16 cm, and 17.5 cm are added. Its partial enlarged view is shown in the Figure 22:
In Figure 22, we can see that when the stubble height is set to 16 cm and the header height is lower than 14.5 cm (e(k) > 15 mm), the system will output the header rise PWM value. In Figure 23, similarly, only when the header height is higher than 17.5 cm (e(k) > 15 mm) will the system output the header-lowering PWM value. If the header height returns to e(k) < 15 mm, the system output PWM is 0. This demonstrates the accuracy of Equation (18) in Section 2.5.3.

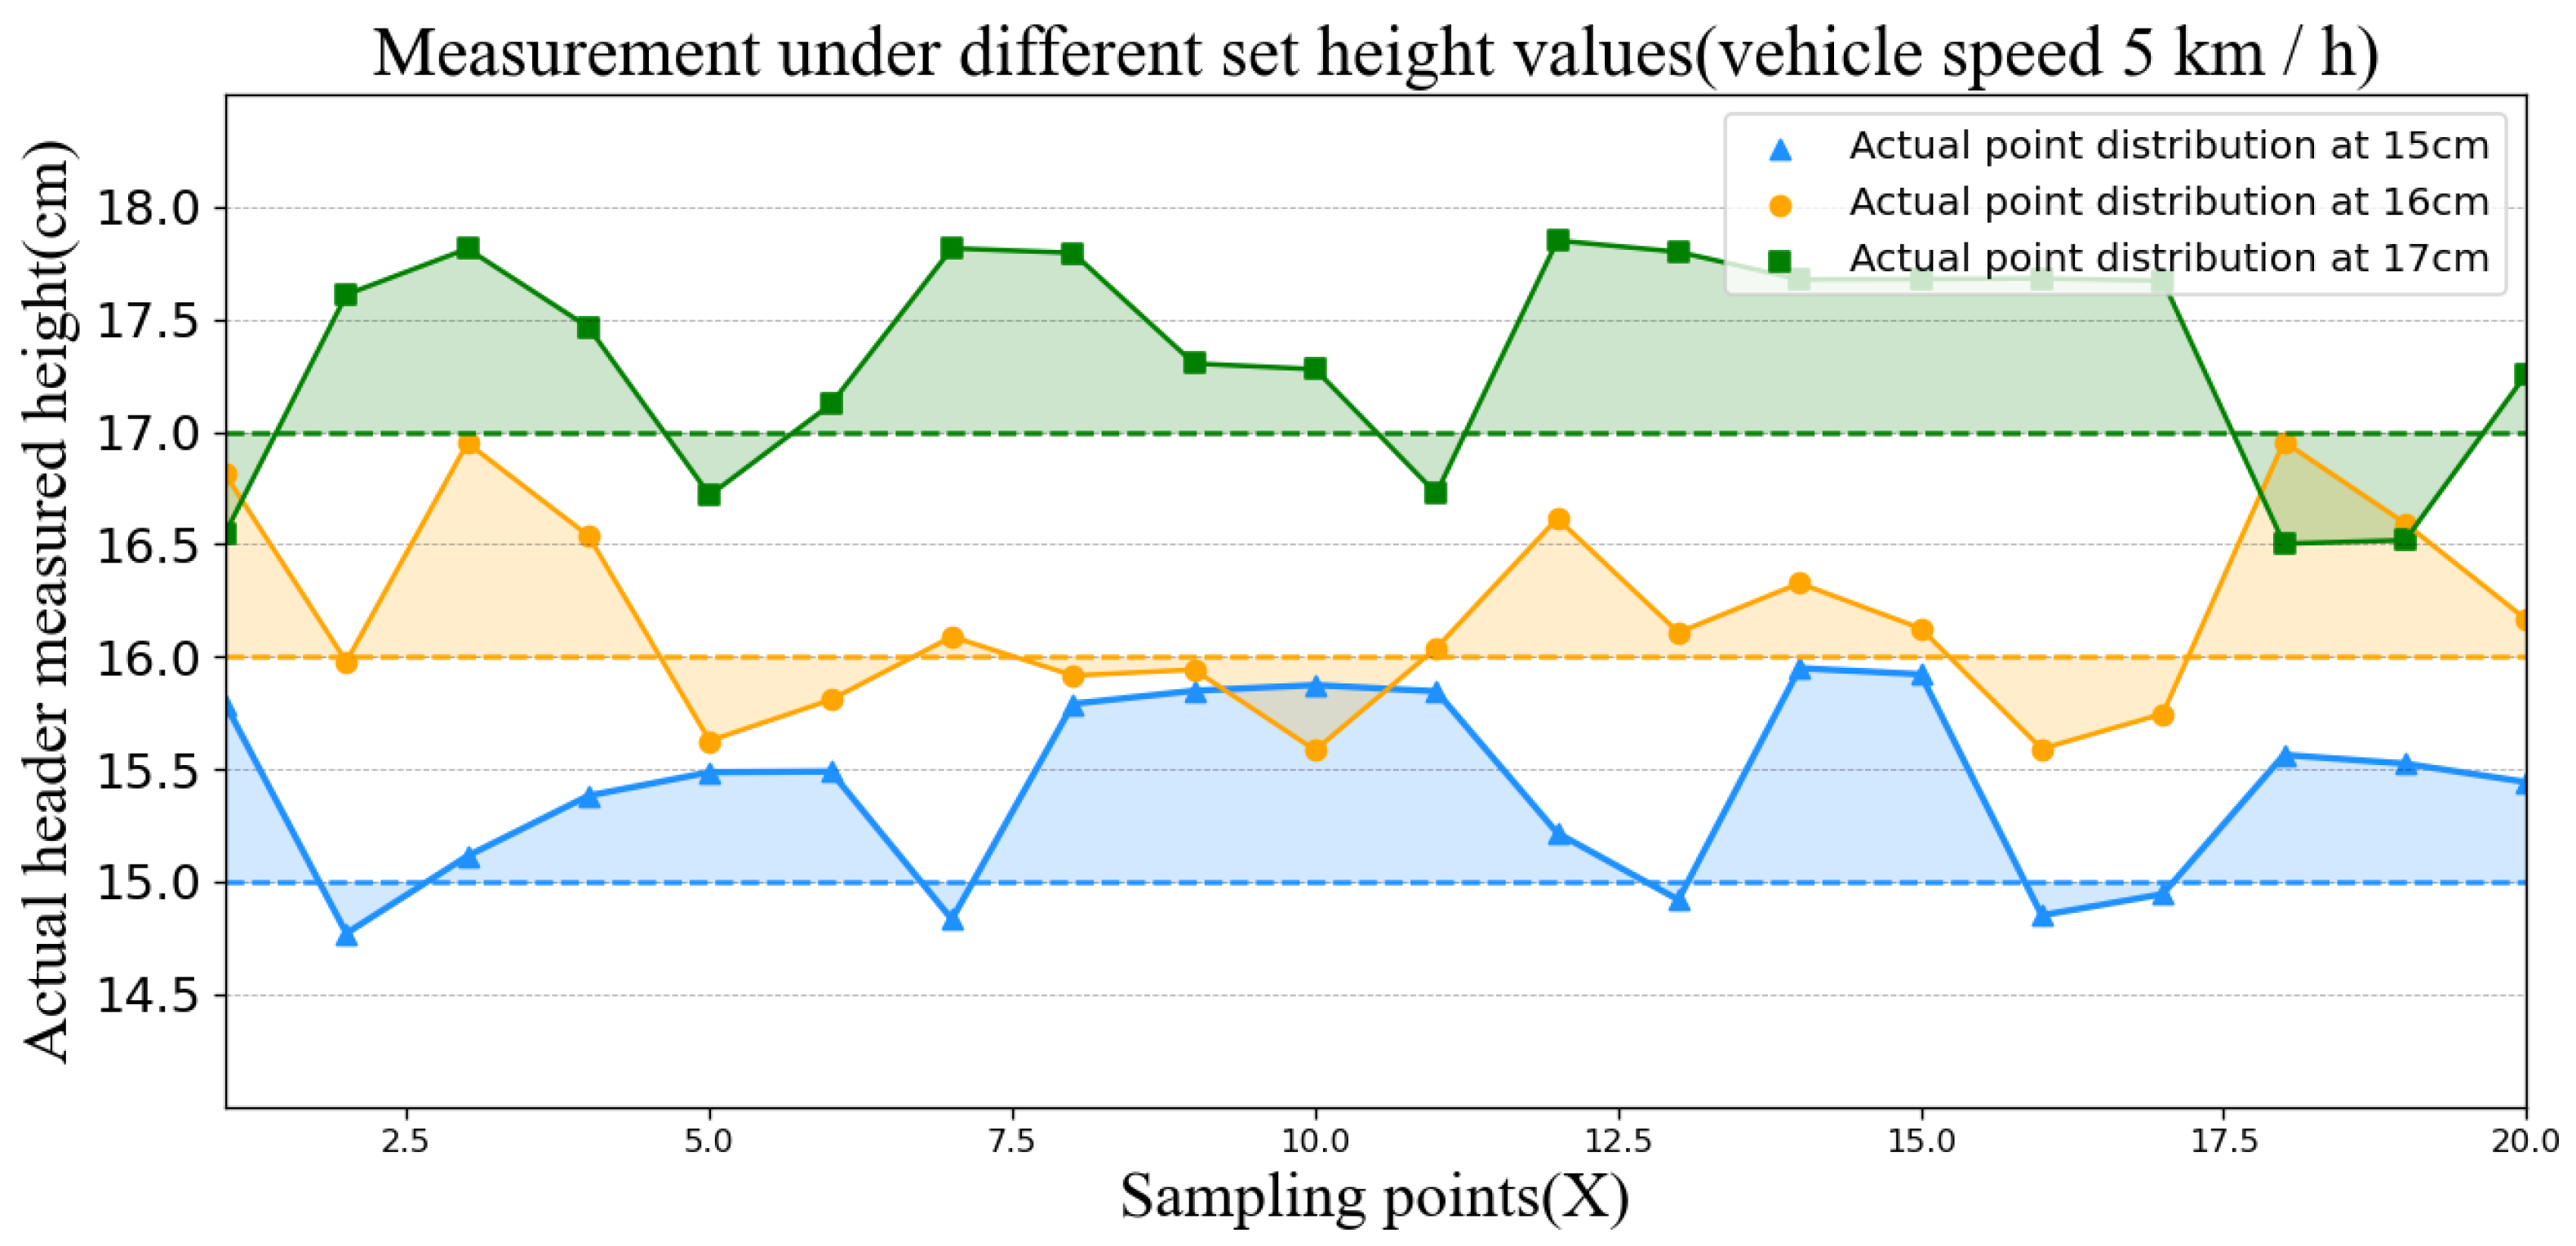
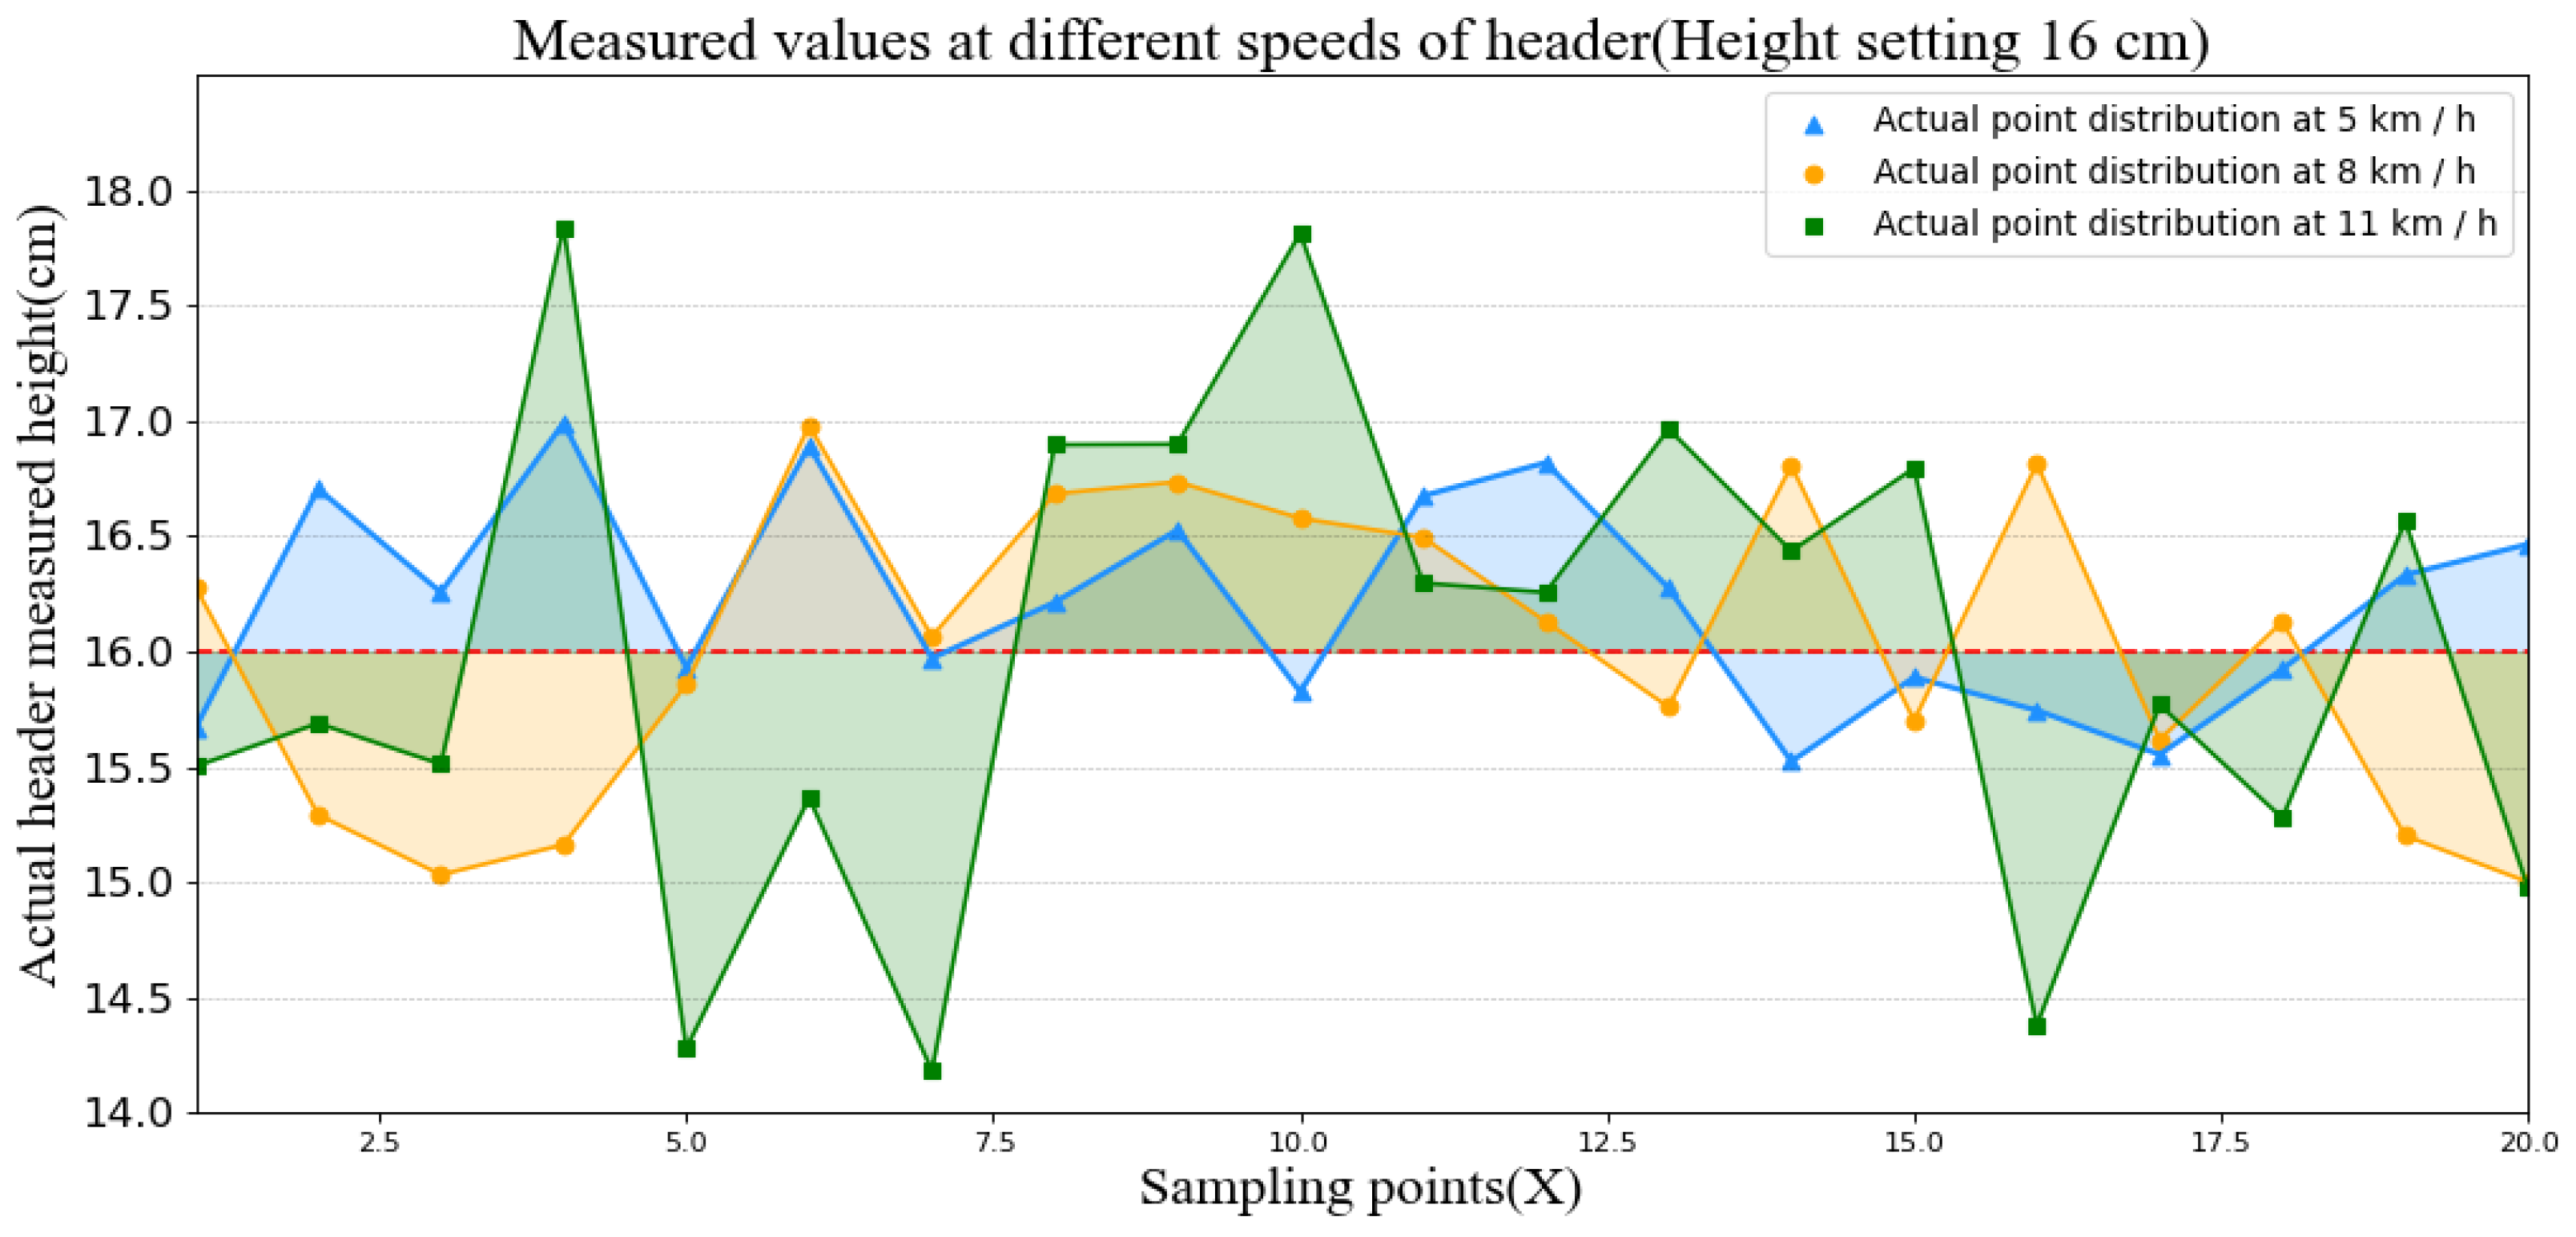
3.2. Test Results and Analysis of Header Control Accuracy

According to the experimental design in Section 2.7, the stubble profiling heights were set to 15, 16, and 17 cm under the 5 km/h harvesting environment, respectively. In addition, the test of 20 sets of stubble height data for three operating speeds of 5, 8, and 11 km/h took place under the condition that the stubble height was set to 16 cm. The results are shown in Table 4.
According to the data in the table, we drew the distribution law diagram of the two groups of data of σ 2 , and the results are shown in Figure 23 and Figure 24:
In Figure 24 it is seen that when the operation speed is 5 km/h, the stubble height is set to 15 cm, 16 cm, and 17 cm, respectively, and their corresponding sample variance values, σ 2 , are 6.79, 4.26, and 6.82. In all the sampling data, we did not find that the height error was more than 2cm, and the error was basically kept at about 1 cm. These data demonstrate the accuracy of the control system in header height control.
In Figure 25, it can be concluded that when the stubble height is set to 16 cm, the σ 2 value increases with the increase of the harvesting speed. When the harvesting speed becomes 11 km/h, there are five groups of data samples with the stubble cutting error exceeding 1 cm in 20 groups of sample data. This is due to the increase in operating speed, which also increases the sensitivity requirements for system control. Header control sensitivity at 11 km/h of operating speed is slightly lower than 5 km/h of operating speed. Despite this, the 20-time sampling data at 11 km/h did not show that the stubble cutting error was greater than 2 cm. It is demonstrated that the control sensitivity of the control system in the operating speed range of 5–11 km/h fully meets the requirements of harvesting operations at this stage.

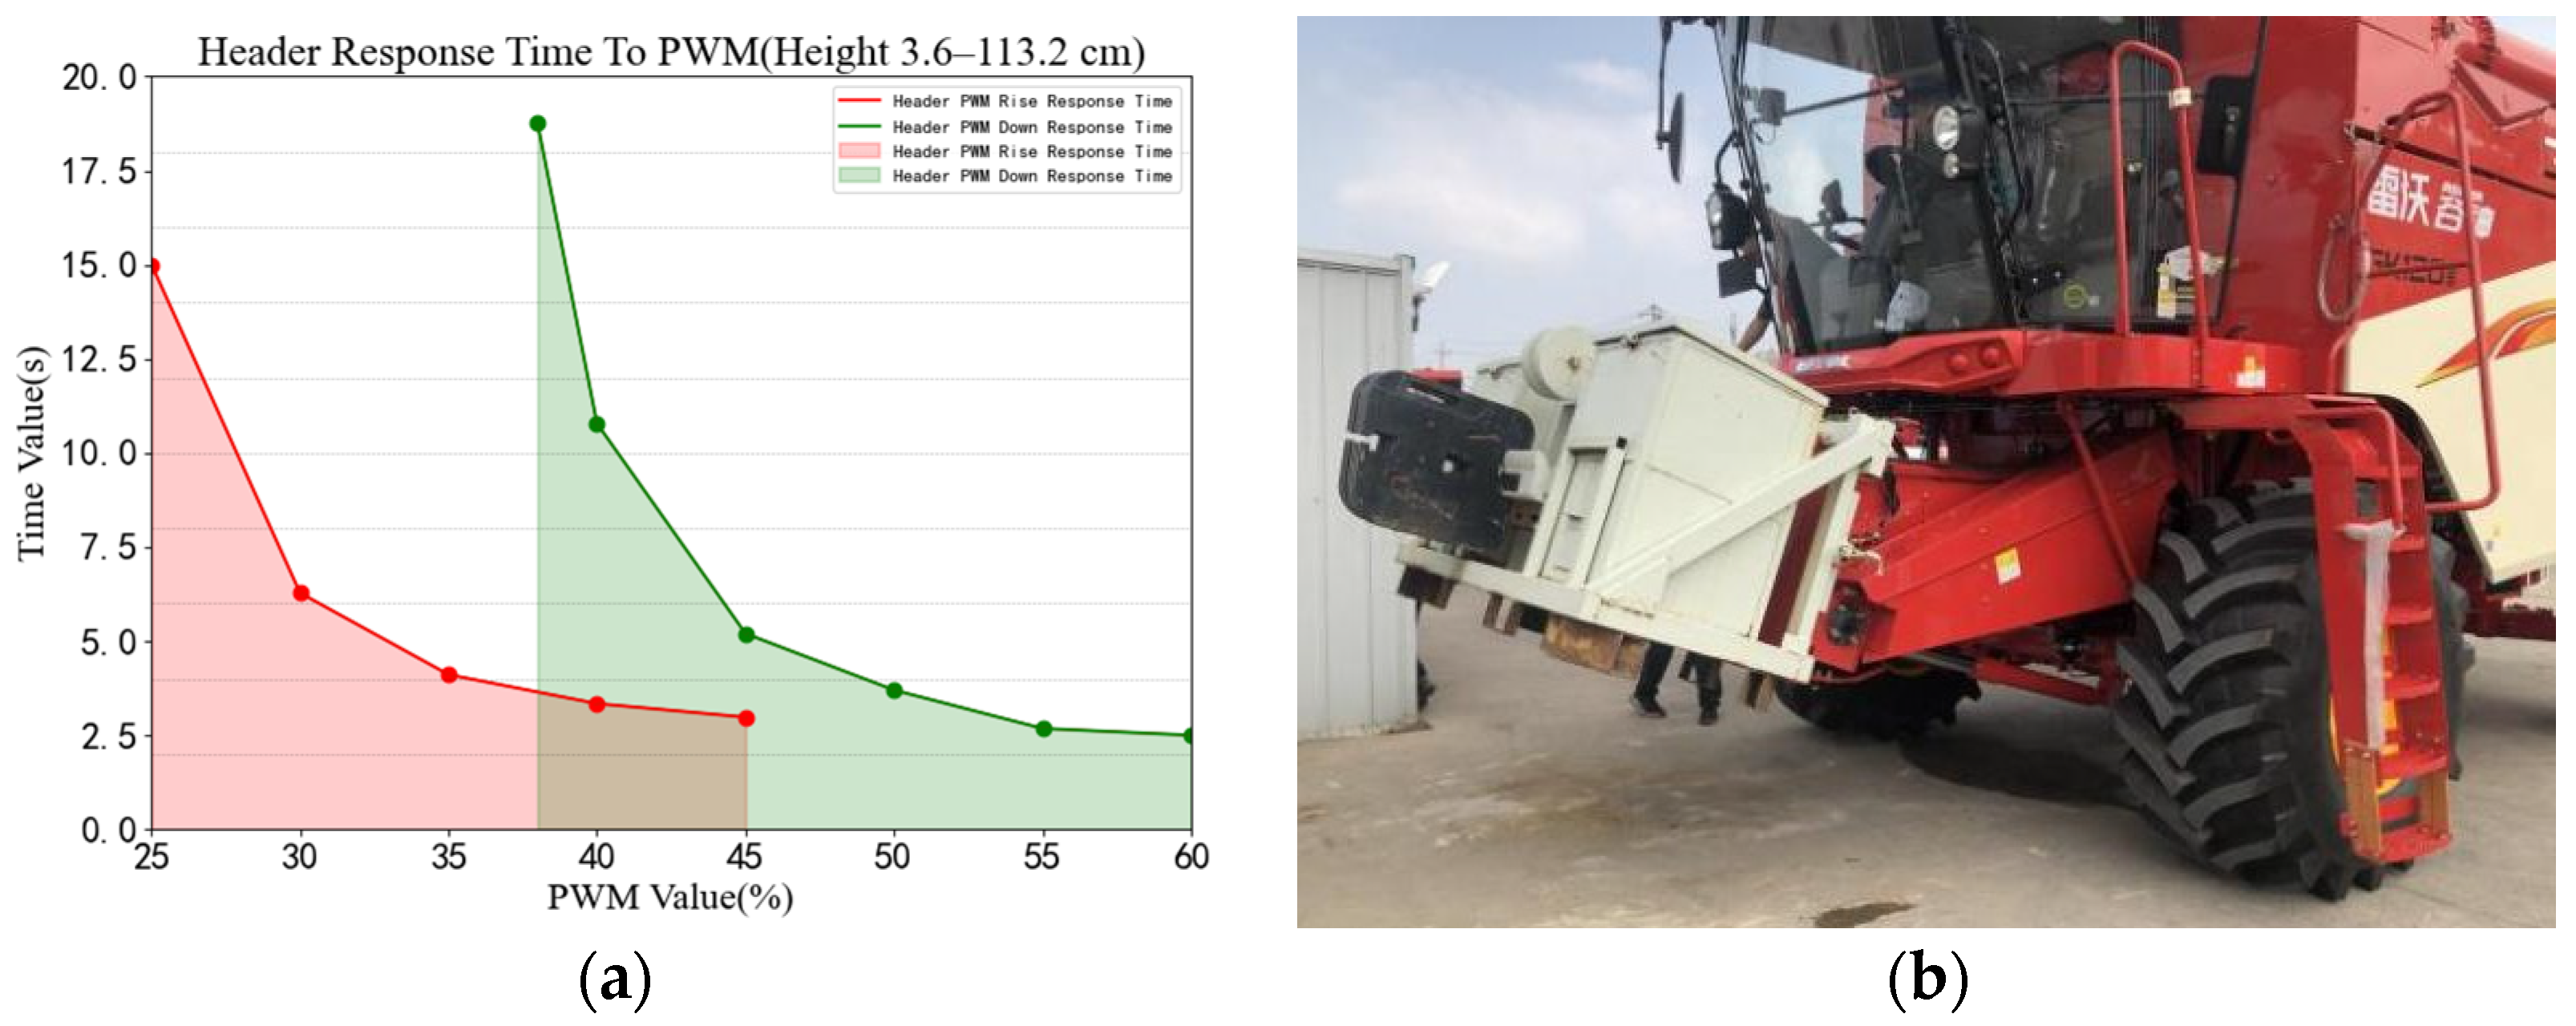
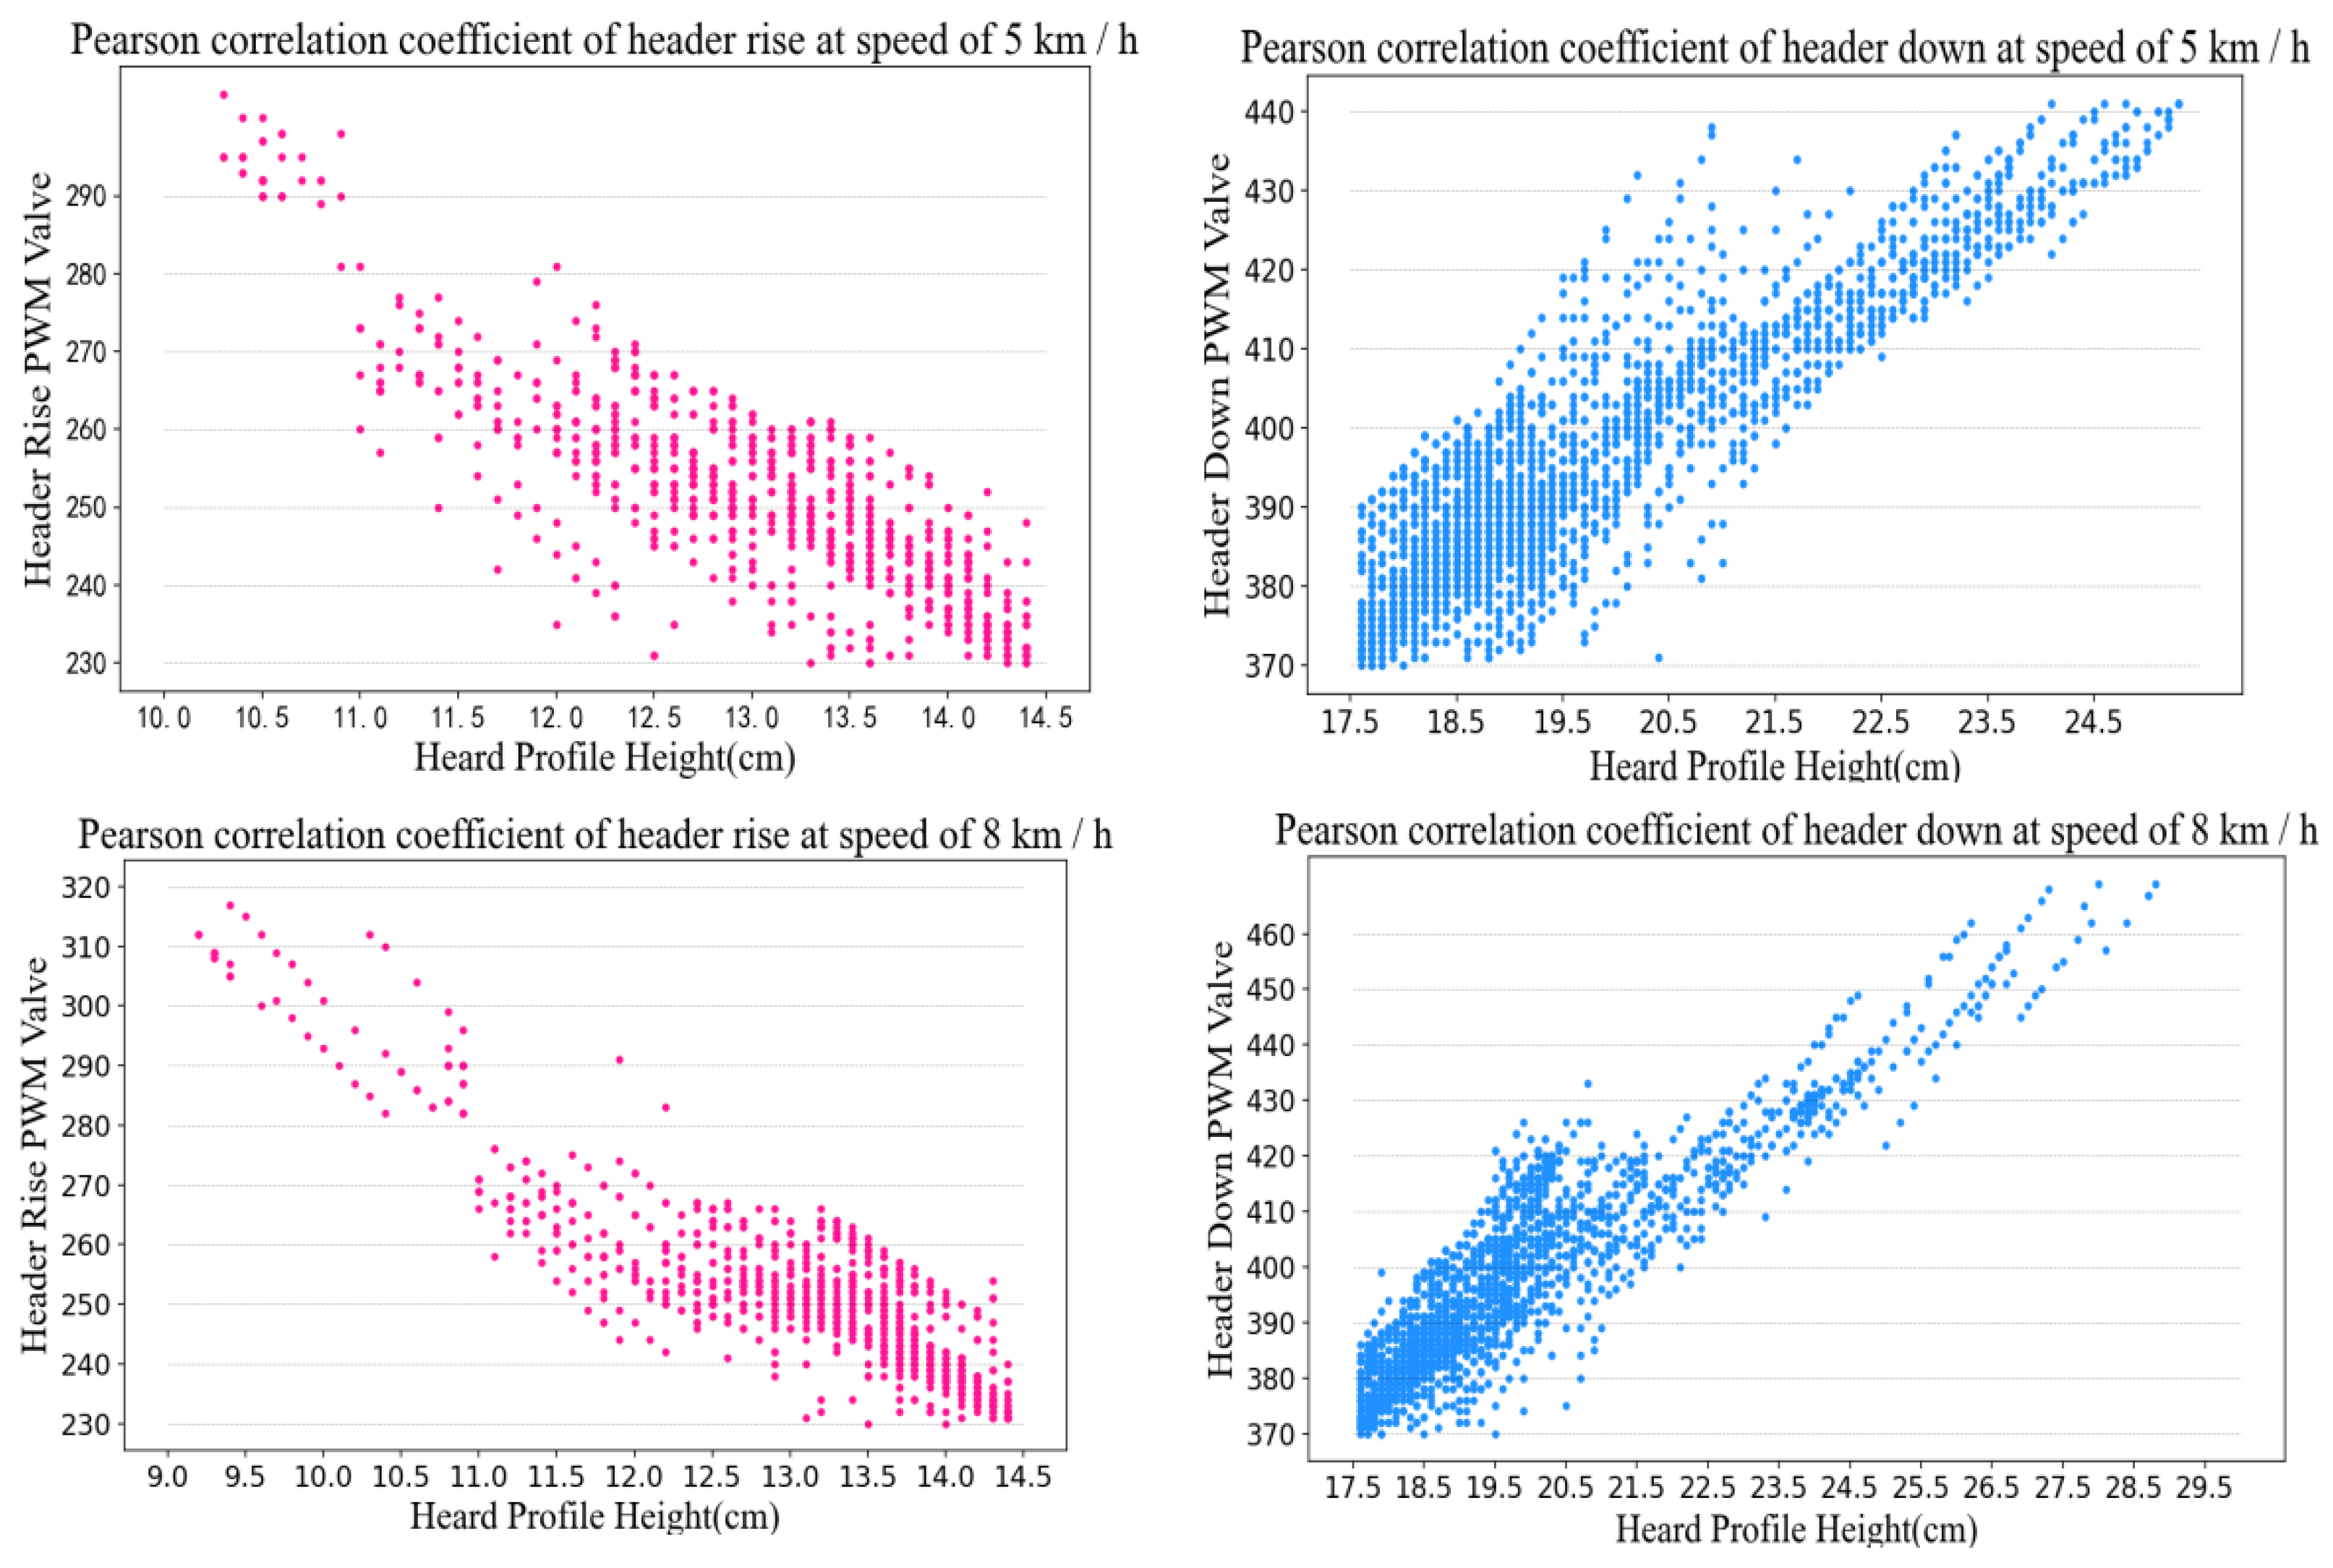
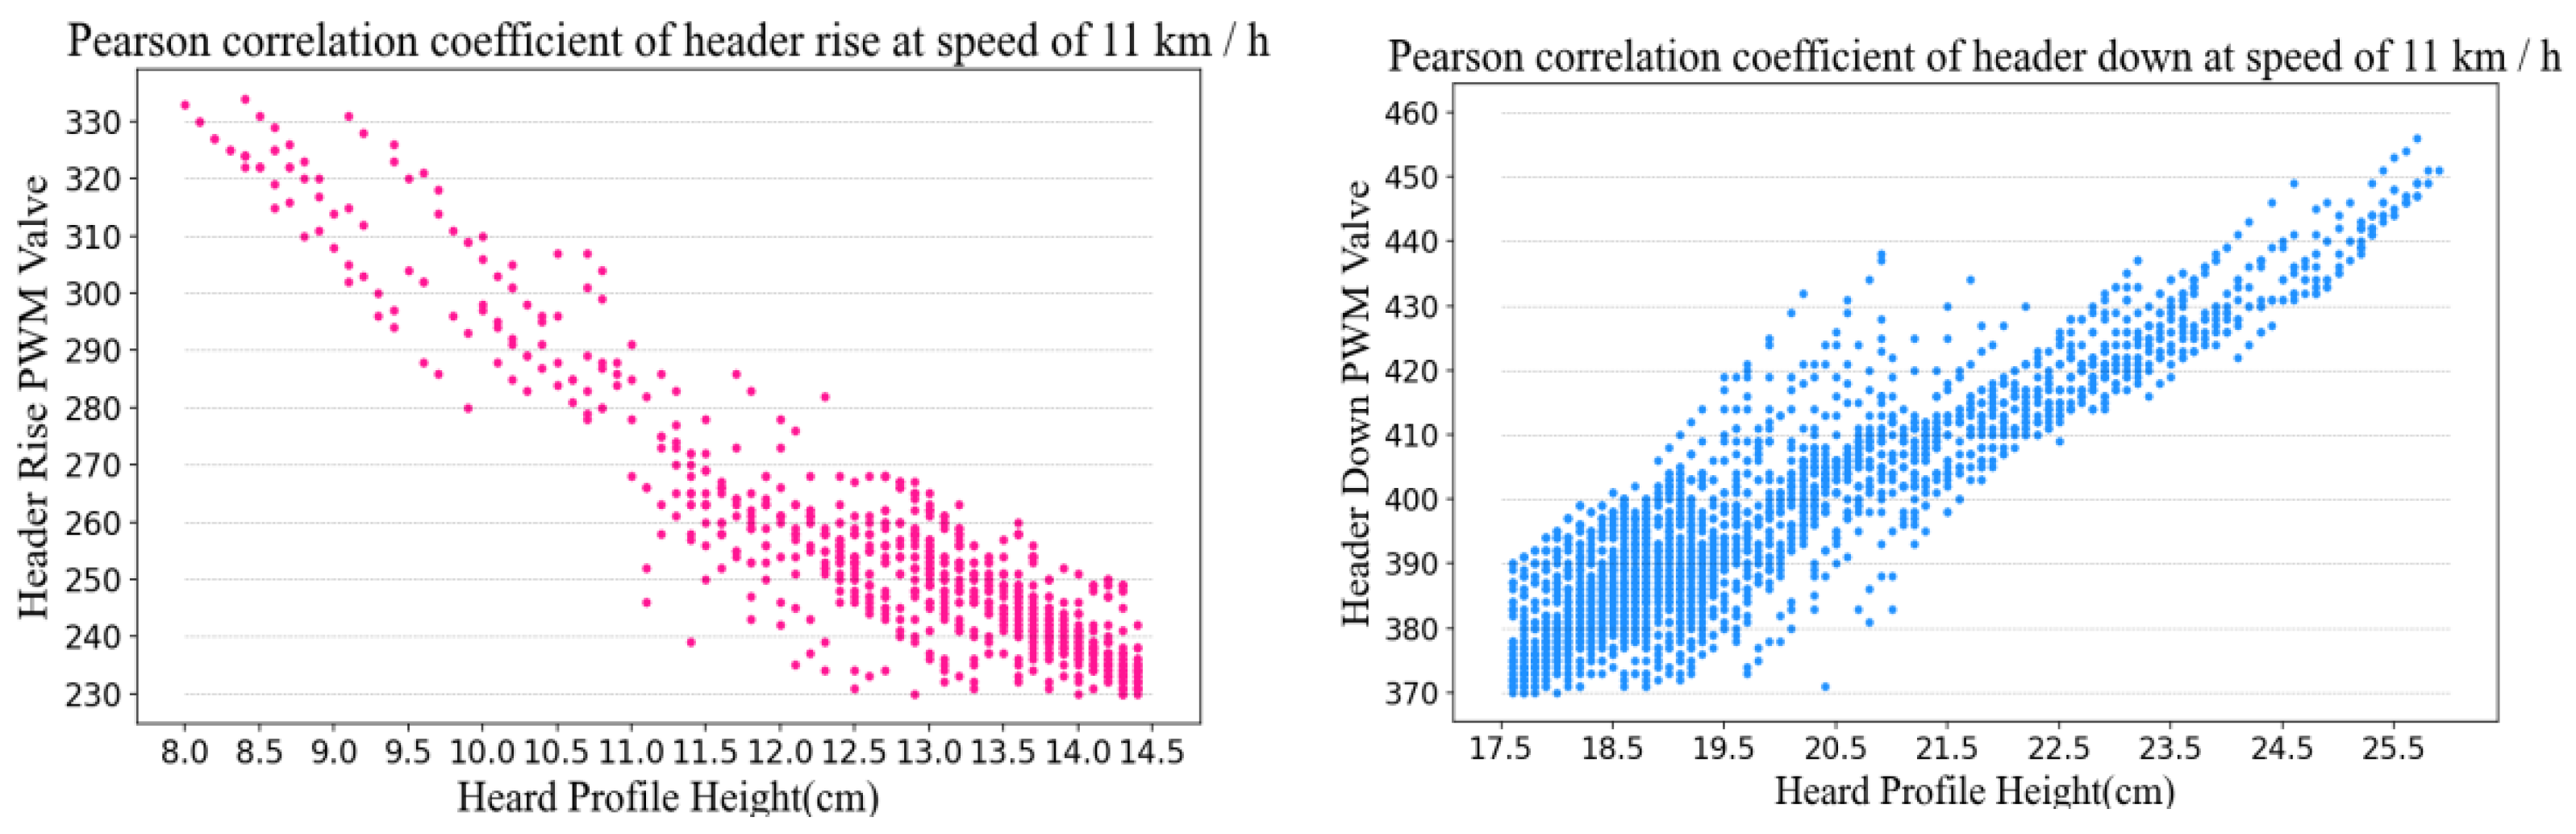
3.3. Test Results and Analysis of Correlation Test between PWM and Header Height

According to the experimental design in Section 2.8, when the stubble height of 16 cm is set, the control system data at the operating speeds of 5 km/h, 8 km/h, and 11 km/h are collected, respectively. In this study, the Pearson correlation coefficient is used to calculate the correlation between the output PWM value of the control system and the header height. The results are shown in Table 5. At the same time, we draw six scatter charts according to relevant data, and the results are shown in Figure 25.
Combining Table 5 and Figure 25, we can see that the system has corresponding PWM outputs for different header heights, no matter whether the header is rising or falling. By calculating the Pearson coefficient, we can find that the PWM value output by the system is related to the header height. If the absolute value of the difference between the actual height of the header and the target height, |e(k)|, is used as the benchmark, the PWM values output by the system have a strong positive correlation, and the correlation coefficient of r is greater than 0.8.
Figure 25 showed that the PWM value output by the control system increases with the acceleration of harvest speed. The reason for this phenomenon is that, according to the contents of Section 2.5.3, the control system will produce three different proportional, integral, and differential parameters at different harvesting speeds. When the harvesting speed is 5 km, the harvester belongs to the low-speed operation mode, and the proportion coefficient generated by the control system in this mode is lower than that in the high-speed operation mode. Therefore, the output PWM peak of the control system is also lower than the high-speed operation range. Therefore, Figure 25 can prove the effectiveness of the function that the control system can change the PID parameters based on the increase of harvesting speed in Section 2.5.3.
We can conclude that the EVPIVS-PID harvesters’ header height control systemg can achieve the harvester’s operation speed of 5–11 km/h in plain areas, and the stubble height error is no more than 2 cm. This study provides a feasible way for the header control part of the follow-up, unmanned operation in combine harvesters.

4. Conclusions

Using the influence of natural frequency and damping ratios on the dynamic response of the second-order, underdamped system, this study comprehensively compares four system-dynamic indexes, determines the optimal parameters of the hydraulic cylinder in the harvester header, and carries out a simulation demonstration.
The header profiling monitoring mechanism and header height feedback mechanism, based on the angle sensor, are designed. An integrated solenoid proportional valve is added and its structure and working principle are discussed. Finally, the feasibility of the hydraulic system is demonstrated by a PWM simulation control test.
The limitations of traditional PID control strategies are explained, and a new EVPIVS-PID control strategy is designed. By using a simulation analysis of MATLAB, the validity of the function that the integral coefficient can be changed within the control system, based on the difference between the target value and the actual value in the EVPIVS-PID control strategy, is demonstrated.
Field experiments were conducted to analyse the sample data at different harvesting speeds and different stubble height settings, and to demonstrate the accuracy of the control system in height control, with the stubble height error at less than 2 cm. By analysing the correlation coefficient between the output PWM value of the system and the height of the harvester table, the accuracy of the input PWM value of the control system is demonstrated. Through analysis of data scatter plots, the validity of the function of changing PID parameters, based on monitoring harvesting operation speed in EVPIVS-PID control system, is demonstrated.
In this study, the control mode of only one monitoring mechanism can only meet the requirements of harvest operation in plain areas. In the future, we will also use the monitoring methods of ultrasonic transmitters and lidar for height control. We also need to design more advanced control strategies to meet the harvest requirements of complex terrain and high-speed operation.

Author Contributions

Conceptualisation, R.Y. and Z.W.; methodology, R.Y. and Z.W.; software, Z.W.; validation, Z.W.; formal analysis, J.Z.; investigation, X.Z. and Y.Q.; resources, R.Y. and S.S.; data curation, Z.W.; writing—original draft preparation, Z.W.; writing—review and editing, Z.W.; visualisation, Z.W.; supervision, R.Y. and S.S.; project administration, R.Y.; funding acquisition, R.Y. All authors have read and agreed to the published version of the manuscript.

Funding

This research was funded by Research and application of key technologies of intelligent harvesting equipment, China, Grant No. LJNY 201804.

Institutional Review Board Statement

Not applicable.

Data Availability Statement

The datasets presented in this study are available from the corresponding author on reasonable request.

Acknowledgments

Many thanks to all anonymous reviewers for their constructive comments on this manuscript. Meanwhile, we thank Shang Shuqi for his investigation assistance in the preparation of this manuscript.

Conflicts of Interest

The authors declare no conflict of interest.

References

  1. Glancey, J.L. Analysis of Header Loss From Pod Stripper Combines in Green Peas. Agric. Eng. Res. 1997, 68, 1–10. [Google Scholar] [CrossRef]
  2. Carlin, J.F. Electro-hydraulic control of combine header height and reel speed. SAE Int. 1984, 93, 252–256. [Google Scholar]
  3. Craessaerts, G.; De Baerdemaeker, B.J. Fuzzy control of the cleaning process on a combine harvester. Biosyst. Eng. 2010, 106, 103–111. [Google Scholar] [CrossRef]
  4. Lamp, B.J.; Johnson, W.H.; Harkness, K.A.; Smith, P.E. Soybean harvesting approaches to improved harvesting efficiencies. Ohio Agric. Exp. Stn. Res. Bull. 1962, 899. Available online: https://kb.osu.edu/bitstream/handle/1811/62695/1/OARDC_research_bulletin_n0899.pdf (accessed on 21 January 2022).
  5. Quick, G.R. Laboratory Analysis of the Combine Header. Trans ASAE 1973, 16, 0005–0012. [Google Scholar] [CrossRef]
  6. Dong, S.; Du, C. Development on electrical system performance test stand for combine harvester. IFAC-Pap. Online 2018, 51, 363–367. [Google Scholar] [CrossRef]
  7. Rehkugler, G.E. Dynamic analysis of automatic control of combine header height. Trans. ASAE 1970, 13, 225–231. [Google Scholar] [CrossRef]
  8. Xia, L.; Liang, X.; Wei, L.; Zhao, B. Research progress of automatic monitoring system for combine harvesters. Agric. Mach. 2013, 19, 141–144. [Google Scholar]
  9. Zhang, X. Design and Innovation of Combine Harvester Header Control System. Master’s Thesis, Hebei University of Technology, Tianjin, China, 2015. [Google Scholar]
  10. Alleyne, A.G.; Xie, Y.; Greer, A.; Deneault, D. Fundamental limits in combine harvester header height control. J. Dyn. Syst. Meas. Control 2013, 135, 034503. [Google Scholar] [CrossRef] [Green Version]
  11. Xie, Y.; Alleyne, A.; Greer, A.; Deneault, D. Header height control of a combine harvester system. Dyn. Syst. Control Conf. 2010, 44175, 7–14. [Google Scholar] [CrossRef]
  12. Xie, Y.; Alleyne, A. Two degrees of freedom control for combine harvester header height control, Dynamic Systems and Control Conference. Am. Soc. Mech. Eng. 2012, 45318, 539–547. [Google Scholar] [CrossRef]
  13. Lopes, T.; Magalhaaes, P.S.G.; Nobrega, E.G.O. Optimal Header Height Control System for Combine Harvesters. Biosyst. Eng. 2002, 81, 261–272. [Google Scholar] [CrossRef]
  14. Wang, C.; Liang, Y. Analysis of the automatic control system for the height of the grain combine harvester. Grain Oil Process. Food Mach. 1989, 3, 5–8. [Google Scholar]
  15. Chen, J.; Zhang, S.; Li, Y. Design of automatic control system for combing table height of combine harvester. J. Agric. Mach. 2003, 6, 65–67. [Google Scholar]
  16. Wei, L.; Che, Y.; Wang, F.; Li, W. Design and test of ground profiling control system for combine harvester header. Agric. Mech. Res. 2017, 39, 150–154. [Google Scholar]
  17. Zhang, C. Research on Harvester Header Profiling and Crop Altimetry Method. Master’s Thesis, Southeast University, Nanjing, China, 2019. [Google Scholar]
  18. Liu, L.; Wu, M. Least Squares Curve Fitting Based on Matlab. Fujian Comput. 2019, 8, 9–12. [Google Scholar]
  19. Zhang, Z. Design and Analysis of Hydraulic Lifting System for Header of Combine Harvester Cutting Table, Qingdao, China. 2019. Available online: https://portal.issn.org/resource/ISSN/1755-1315 (accessed on 21 January 2022).
  20. Yang, S.; Yang, Q.; Yang, Y. Design of Header Height Control System Based on Ultrasonic Sensor. Agric. Mech. Res. 2008, 3, 134–136, 156. [Google Scholar]
  21. Huang, C.; Shang, Q.; Yu, S.; Zhang, E. System Identification Based on Step Response Second-Order Plus Pure Lag Model. Mach. Manuf. 2010, 48, 19–21. [Google Scholar]
  22. Chen, B. Research on Electro-hydraulic Proportional Valve Control System Based on PID Algorithm. Master’s Thesis, Changsha University of Science and Technology, Changsha, China, 2012. [Google Scholar]
  23. Chen, X. Design and Simulation Analysis of Hydraulic Proportional Control System at the Inlet of Continuous Press. Master’s Thesis, Northeast Forestry University, Harbin, China, 2021. [Google Scholar]
  24. Siddique, M.A.A.; Kim, W.-S. Effects of Temperatures and Viscosity of the Hydraulic Oils on the Proportional Valve for a Rice Transplanter Based on PID Control Algorithm. Agriculture 2020, 10, 73. [Google Scholar] [CrossRef] [Green Version]
  25. Shamilah, A.M.; Darius, E.P. Actual field speed of rice combine harvester and its influence on grain loss in Malaysian paddy field. J. Saudi Soc. Agric. Sci. 2020, 19, 422–425. [Google Scholar] [CrossRef]
  26. Cao, H.; Guo, H. Optimization of PID Parameters of Hydraulic System of Elevating Wheelchair Based on AMESim. Procedia Eng. 2011, 15, 3710–3714. [Google Scholar] [CrossRef] [Green Version]
  27. Cheng, M.; Hu, Y.; Miao, Y. Research on fuzzy control strategy of header height of harvester. Mechatronics 2018, 24, 17–22. [Google Scholar]
  28. Dominic, E.; Tamás, F. On relationships between the Pearson and the distance correlation coefficients. Stat. Probab. Lett. 2021, 169, 108960. [Google Scholar] [CrossRef]
Figure 1. The structure of the ground profile height control system of the header. 1. Profiling roller; 2. Angle sensor; 3. Single-acting hydraulic cylinder; 4. Traditional harvester header structure; 5. Header lift rotation point; 6. Header height feedback mechanism.
Agriculture 12 00282 g001
Figure 2. Structural principle of the profiling sensor mechanism. 1. Articulated link; 2. Angle sensor; 3. Profiling roller; 4. Fixed rotation point.
Agriculture 12 00282 g002
Figure 3. Header height feedback sensing mechanism. 1. Angle sensor; 2. Articulated link.
Agriculture 12 00282 g003
Figure 4. Header adaptive control system structure.
Agriculture 12 00282 g004
Figure 5. Structural principle of integrated solenoid proportional valve. 1. Straight check valve; 2. The 2/3-way solenoid proportional valve; 3. Hydraulic outlet pressure reducing valve; 4. The 2/2-way solenoid proportional valve; 5. Hydraulic straight-through check valve.
Agriculture 12 00282 g005
Figure 6. The installation position of the integrated solenoid proportional valve. 1. Original electric control valve; 2. Retrofitting an integrated solenoid; 3. Proportional valve.
Agriculture 12 00282 g006
Figure 7. The working principle of the integrated solenoid proportional valve. (a) Header rise control principle; (b) Header descending control principle.
Agriculture 12 00282 g007
Figure 9. Step response curve of second-order, underdamped system. (a) System Compound Curve; (b) Natural Frequency Dynamic Effects; (c) Dynamic Influence of Damping Ratio.
Agriculture 12 00282 g009
Figure 10. Comparison of multiple response indicators of different oil cylinders. (a) Step response index; (b) Parameter index radar distribution map.
Agriculture 12 00282 g010
Figure 11. Influence of different PWM values on the lifting effect of the header. (a) Header response curve; (b) Field test chart.
Agriculture 12 00282 g011
Figure 12. Block diagram of analog PID control system.
Agriculture 12 00282 g012
Figure 13. Integral saturation affects system overshoot principle.
Agriculture 12 00282 g013
Figure 14. Comparison between PID after integral improvement and traditional PID.
Agriculture 12 00282 g014
Figure 15. EVPIVS-PID control algorithm structure principle.
Agriculture 12 00282 g015
Figure 16. EVPIVS-PID control algorithm structure principle.
Agriculture 12 00282 g016
Figure 17. Software Hydraulic System Modelling.
Agriculture 12 00282 g017
Figure 18. Hydraulic system simulation results. (a) Relationship between signal—flow—pressure. (b) Relationship between spool position—oil inlet pressure.
Agriculture 12 00282 g018
Figure 19. Manual collection cutting height.
Agriculture 12 00282 g019
Figure 20. Manual control of harvester header height effect.
Agriculture 12 00282 g020
Figure 21. EVPIVS-PID control harvester header height effect.
Agriculture 12 00282 g021
Figure 22. Partial enlarged view.
Agriculture 12 00282 g022
Figure 23. Comparison of different heights at a speed of 5 km/h.
Agriculture 12 00282 g023
Figure 24. Comparison of different speeds when cutting stubble at 16 cm.
Agriculture 12 00282 g024
Figure 25. Relationship between control system output PWM value and header height.
Agriculture 12 00282 g025aAgriculture 12 00282 g025b
Table 1. Dynamic index of second-order, underdamped system.
Dynamic Indicator TypeSymbolCalculation Formula
Rise Time t r t r = π arccos ( ζ ) ω n 1 ζ 2
Peak time t p t p = π ω n 1 ζ 2
System overshoot σ % σ % = e π ζ / 1 ζ 2 × 100 %
Adjustment time t s t s = 3.5 ζ ω n
Table 2. Dynamic indicators of various model parameters.
Piston Diameter ω n ζ t r t p σ % t s
5064.520.3310.02040.049833.20.166
5570.970.2490.01790.046944.40.199
6381.290.1650.01460.037858.70.283
7090.320.1210.01270.034868.20.355
Table 3. System modelling-related parameter settings.
Parameter NameParameterUnit
Hydraulic pump speed2100r/min
Hydraulic pump displacement35cc/rec
Relief valve operating pressure300bar
Solenoid valve operating current40mA
Piston diameter of hydraulic cylinder55mm
Stroke distance of hydraulic cylinder piston275mm
Single cylinder load mass600KG
Table 4. Header accuracy test results.
Serial NumberVehicle Speed 5 km/hHeight Setting 16 cm
15 cm16 cm17 cm5 km/h8 km/h11 km/h
115.7916.8116.5515.6616.2815.50
214.7715.9817.6116.7115.2915.69
315.1116.9517.8116.2615.0315.51
415.3816.5417.4716.9915.1617.84
515.4915.6316.7215.9315.8614.28
615.4915.8117.1216.8916.9815.37
714.8316.0917.8215.9716.0614.18
815.7915.9217.8016.2116.6816.90
915.8515.9417.3016.5316.7416.90
1015.8715.5817.2815.8216.5817.82
1115.8516.0416.7316.6816.4916.30
1215.2216.6117.8516.8216.1316.26
1314.9216.1117.8016.2815.7616.97
1415.9516.3317.6815.5216.8116.44
1515.9216.1317.6815.8915.7016.80
1614.8515.5917.6815.7416.8114.38
1714.9415.7517.6715.5515.6215.77
1815.5616.9616.5015.9216.1315.28
1915.5216.5916.5216.3315.2016.57
2015.4416.1717.2616.4715.0014.97
σ 2 6.794.266.854.868.0822.04
Table 5. Correlation test between PWM and header height.
Vehicle Speed (km/h)Header Rise PWM ValueHeader Down PWM Value
5−0.8650690.907017
8−0.8945210.915443
11−0.9319510.920679
Publisher’s Note: MDPI stays neutral with regard to jurisdictional claims in published maps and institutional affiliations.

