Article

Fenlong-Ridging Promotes Microbial Activity in Sugarcane: A Soil and Root Metabarcoding Survey

1
Guangxi Key Laboratory of Sugarcane Biology, College of Agriculture, Guangxi University, Nanning 530004, China
2
State Key Laboratory for Conservation and Utilization of Subtropical Agro—Bioresources, College of Agriculture, Guangxi University, Nanning 530004, China
3
Guangxi Academy of Agricultural Sciences, 174 Daxue East Rd., Nanning 530007, China
*
Author to whom correspondence should be addressed.
Agriculture 2022, 12(2), 244; https://doi.org/10.3390/agriculture12020244
Submission received: 30 November 2021 / Revised: 1 February 2022 / Accepted: 1 February 2022 / Published: 8 February 2022
(This article belongs to the Special Issue Innovative Conservation Cropping Systems and Practices)

Abstract

:
Fenlong-ridging (FL) is a recently proposed conservation tillage technology which has dramatic differences to traditional ones. Previous studies have demonstrated in many crops that FL has yield-increasing effects without additional inputs. However, little is known about the role that microbes play in mediating the growth-promoting effects of FL, which restricts its further application and improvement. Here, we characterized variation in the soil and root microbial diversity of sugarcane (GT44) under FL and traditional turn-over plough tillage (CK) by conducting 16S rRNA and ITS metabarcoding surveys. We also measured several phenotypic traits to determine sugarcane yields and analyzed the chemical properties of soil. We found that: (i) plant height (PH) and total biomass weight (TW) of sugarcane plants were 9.1% and 21.7% greater under FL than those under CK, indicating\increased biomass yield of the sugarcane in FL operation; (ii) contents of organic matter, total nitrogen, available phosphorus, and available potassium were lower in soil under FL than those under CK, which indicates the utilization of soil nutrients was greater in FL soil; (iii) FL promoted the activity of endophytic microbes in the roots, and these diverse microbial taxa might have an effect on sugarcane yield and soil chemical properties; and (iv) Sphingomonas, Rhizobium, and Paraburkholderia and Talaromyces, Didymella, and Fusarium were the top three most abundant genera of bacteria and fungi, respectively, in soil and root samples. In addition, strains from Rhizobium and Talaromyces were isolated to verify the results of the metabarcoding survey. Overall, our study provides new insights into the role of microbes in mediating the growth-promoting effects of FL. These findings could be used to further improve applications of this novel conservation tillage technology.

1. Introduction

The sustainable production of food is being increasingly challenged by human population growth and climate changes [1]. Conservation tillage is primarily used to protect soils from erosion and compaction, conserve soil moisture, and reduce production costs [2]. Soil and root microbial diversity and community composition are important for sustainable agriculture and conservation tillage because microbes mediate the processes supporting agricultural production [3,4,5]. However, many of these agriculturally important soil and root microbial taxa, and the impacts of different tillage practices on their abundances are largely unknown [6]. More studies are required to identify the soil and root microbial taxa under different types of tillage operations [7].
Fenlong-ridging (i.e., smash ridging, FL) is an advanced conservation tillage technology that has recently been proposed to increase the yields of many crops, such as rice and sugarcane, without requiring increases in fertilizer application [8,9]. Whereas traditional tillage methods involve plowing the soil, FL is a deep tillage technology (up to 40 cm in depth) that works by horizontally crushing the soil in situ. It maintains soil nutrients and moisture and increases soil air permeability, thereby enhancing the growth of crop roots [8]. This sustainable tillage method has become increasingly used in China in recent years and has helped contribute to achieving China’s carbon neutrality target [10,11]. Several studies have been tried to reveal the agronomic and/or physiological mechanism underlying the yield differences under Fenlong-ridging processing [9,12,13,14,15,16,17] but little work has been done on the alteration of the physicochemical properties of the soils surrounding plants root systems. As we know, the soil and endophytic microbial diversity have substantial effects on crop yield, play an important role in regulating the supply of nutrients for crops, and mediate resistance to plant diseases and insect pests [7]. Plants and the associated microbiota form a “holobiont” [7]. When plants are facing biotic stress, they may combat stress by altering root exudates to recruit beneficial microbes from the soil, and also can improve soil chemical properties condition by the same approach [7,18]. We can speculate that the FL should causes many differences in root micro-ecological environments. Understanding the role of microbes in FL will be benefit to the application and improvement of this technology.
Sequencing technology is generally considered one of the most effective approaches for characterizing the diversity of soil microbes [19]. Many previous studies have used various sequencing technologies to study bacterial communities, and these studies have provided key insights into the diverse ways in which microbes can affect plants. For example, Wang et al. [20] studied the response of the sugarcane rhizosphere bacterial community to drought stress, Achouak et al. [21] examined the control of microbial denitrification activity by plant hosts; and Guyonnet et al. [22] found that plant nutrient resource use strategies shape active rhizosphere microbiota through root exudation using metabarcoding sequencing.
Here, we studied the role of microbes in mediating the growth-promoting effects of FL in sugarcane (Saccharum officinarum L.), which is the world’s largest sugar-yielding crop and the second largest source of biofuel globally [23]. Specifically, we measured phenotypic indicators of yield, the chemical properties of soil, and the diversity of fungi and bacteria in the roots and rhizosphere of sugarcane through metabarcoding under FL tillage and conventional tillage. The results of the metabarcoding survey were verified by a culture-omics experiment.

2. Materials and Methods

2.1. Materials

2.1.1. Experimental Design

The experiment was conducted on the campus of Guangxi University, Nanning City, China. The experimental sugarcane field was surrounded by other fields of crops, including rice, corn, and multiple fruit trees covering 380 m2 (Figure 1a). Two tillage methods were used before planting sugarcane, FL and conventional tillage (CK), each of which were applied every other row (i.e., tillage methods were alternated among rows). For FL, the soil layers were crushed and loosened to a depth of 40 cm. CK was conducted by turn-over plowing with a mini-tiller, and the soil was tilled to a depth of 20 cm. Our tillage methods were based on the procedures described by Zhang et al. [8]. To minimize the effect of sampling on sugarcane phenotype data, we established protection rows and designated specific areas from which phenotype data and soil and root samples were collected (Figure 1a).

2.1.2. Soil and Root Sampling

Soil and roots were sampled after six months of growth (Figure 1b and Figure 2b). We randomly selected six sugarcane plants in CK and FL rows from the soil and root sample collection areas (Figure 1a) for sampling. First, we extracted entire sugarcane plants, removed the soil directly under the root system, crushed the soil, and then sifted it through a 0.6-mm sieve to obtain soil samples. The taproots were then cut and washed three times with sterile water, three times with 75% ethanol, and finally three times with sterile water (cleaning with residual ethanol) to obtain root samples.

2.2. Methods

This study was conducted per the procedures shown in Figure 1b.

2.2.1. Estimation of Sugarcane Yield

We evaluated sugarcane yields using two phenotypic traits, including total biomass weight (TW) and plant height (PH). A violin plot was created in R using the ggplot2 package (version 3.3.5; http://CRAN.R-project.org/package=ggplot2; accessed on 1 May 2021).

2.2.2. Analysis of Soil Chemical Properties

The mixed soil samples from FL and CK rows were used to determine chemical indicators, including organic matter (OM), total nitrogen (TN), available phosphorus (AP), and available potassium (APO), which were measured at the Center of Agricultural Analysis, Testing and Research, Guangxi University, Nanning City, China.

2.2.3. Metabarcoding Sequencing

Microbial DNA was extracted using HiPure Soil DNA Kits (Magen, Guangzhou, China) and DNA Isolation Kits (Sangon, No. B518231, China) per the manufacturer’s protocols. The 16S rRNA V5–V7 and ITS 1–2 regions of the metabarcoding biomarkers were amplified by PCR with the primers 799F: AACMGGATTAGATACCCKG and 1193R: ACGTCATCCCCACCTTCC [24] for bacteria and the primers ITS1-F: CTTGGTCATTTAGAGGAAGTAA and ITS2: GCTGCGTTCTTCATCGATGC [25] for fungi. The purified amplicons were pooled in equimolar ratios and paired-end sequenced (PE250) on an Illumina platform (Novaseq 6000 sequencing) following standard protocols.

2.2.4. Statistical Analysis

Representative operational taxonomic unit (OTU) sequences were classified by a naïve Bayesian model using an RDP classifier [26] (version 2.2) based on the SILVA database (for 16S rRNA metabarcoding data) [27] (version 132) and UNITE database (for ITS metabarcoding data) [28] (version 8.0), with a confidence threshold value of 0.8. All figures were made using R projects. Venn analysis was used to show OTU differences among different groups and was performed in R using the VennDiagram package (version 1.6.16); [29] (version 1.6.16); Sob (to assess species richness level), Shannon and Simpson (to comprehensively assess richness and evenness of species), and Good’s coverage (to assess sequencing saturation of samples). Indices were calculated in QIIME [30] (version 1.9.1). Principal component analysis (PCA, to assess sample composition relation) and Tukey’s honestly significant difference test (HSD, to assess genera significance of differences in abundance between groups) were performed in R using the vegan package (version 2.5.3; http://CRAN.R-project.org/package=vegan; accessed on 4 March 2021). Circular layout representations of species abundance were graphed using Circos [31] (version 0.69-3). All the above data were based on quantitative statistics of OTU numbers without any model transformation before analysis.

2.2.5. Isolation and Identification of Bacterial and Fungal Strains

First, clean sugarcane taproots from FL rows were collected, cut into pieces, and coated in medium (Fungi: PDA, which consisted of 200 g of potatoes, 20 g of glucose, and 16 g of agar per liter; bacteria: NB, which consisted of nutrient broth, 10 g of peptone, 3 g of beef extract powder, and 5 g of NaCl per liter) for culture at 25 °C (fungi) and 37 °C (bacteria). After 12 to 72 h, single colonies were selected for culture and preserved. We used two pairs of primers of ITS 16S rRNA as the DNA barcoding markers to identify the isolated strains, ITS1: TCCGTAGGTGAACCTGCGG and ITS4: TCCTCCGCTTATTGATATGC [32] (fungi) and 27f: AGAGTTTGATCATGGCTCAG and 1492r: ACGGTTACCTTGTTACGACTT [33] (bacteria). We identify the taxon of isolated strains by comparing with reference sequences in the database via phylogenetic trees. The reference sequences used in this study were downloaded from Genbank, and all DNA barcoding sequences together with reference sequences were aligned using Clustal X (1.83). Phylogenetic analysis based on the neighbor-joining method with 1000 bootstrap replications was conducted using MEGA v.4.0.

3. Results

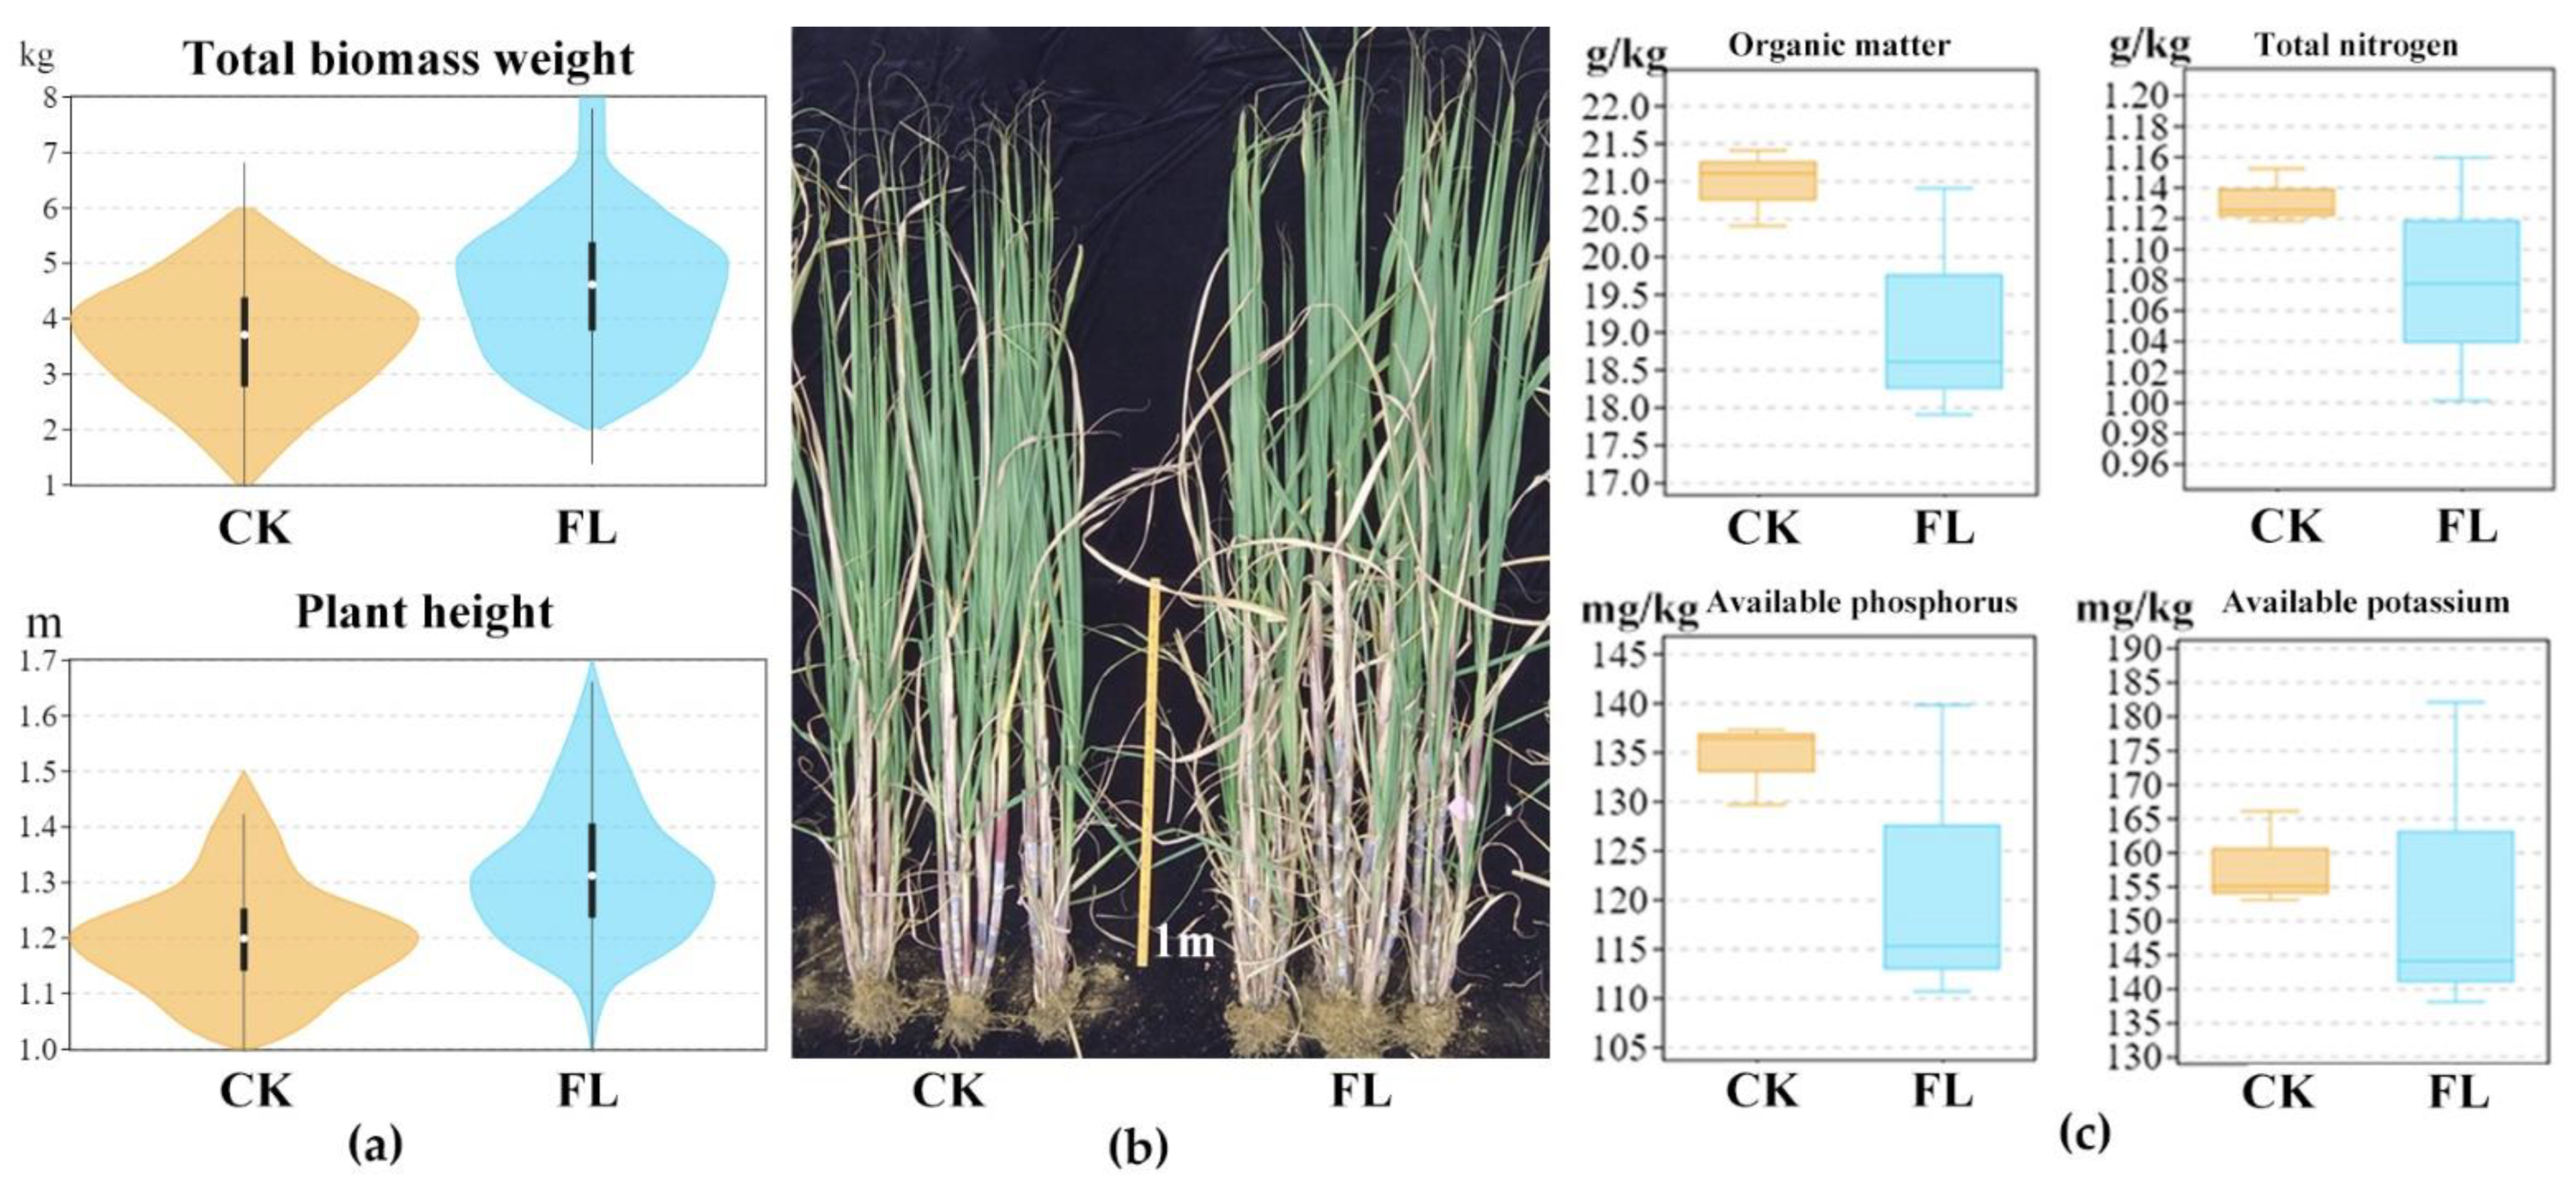
3.1. The Improved Agronomic Performace and the Altered Soil Properties Were Found in Fenlong Compared with the CK

We evaluated sugarcane yield using two agricultural traits: total biomass weight (TW) and plant height (PH). The mean values of TW for FL and CK were 4.6 kg and 3.6 kg per plant (21.7% increase in FL), and the mean values of PH were 1.32 m and 1.2 m per plant (9.1% increase in FL), respectively (Figure 2a). Generally, TW and PH were increased under FL compared with CK. The growth-promoting effects of FL were apparent at six months into the experiment, as the mean PH was approximately 9% higher under FL at this point compared with CK (CK: 2.18 m; FL: 2.39 m, Figure 2b). Overall, sugarcane yield was higher under FL than under CK.
We evaluated soil chemical properties by measuring five soil nutrient parameters. For FL and CK, the mean values of OM were 19.13 and 20.96 g/kg; the mean values of TN were 1.07 and 1.13 g/kg; the mean values of AP were 121.87 and 134.41 mg/kg; and the mean value of APO were 154.66 and 158 mg/kg, respectively (Figure 2c). The mean values of OM, TN, AP, and APO were lower in the FL group than in the CK group, which suggests that sugarcane cultivated by FL utilized soil nutrients more effectively than when it was cultivated by CK.

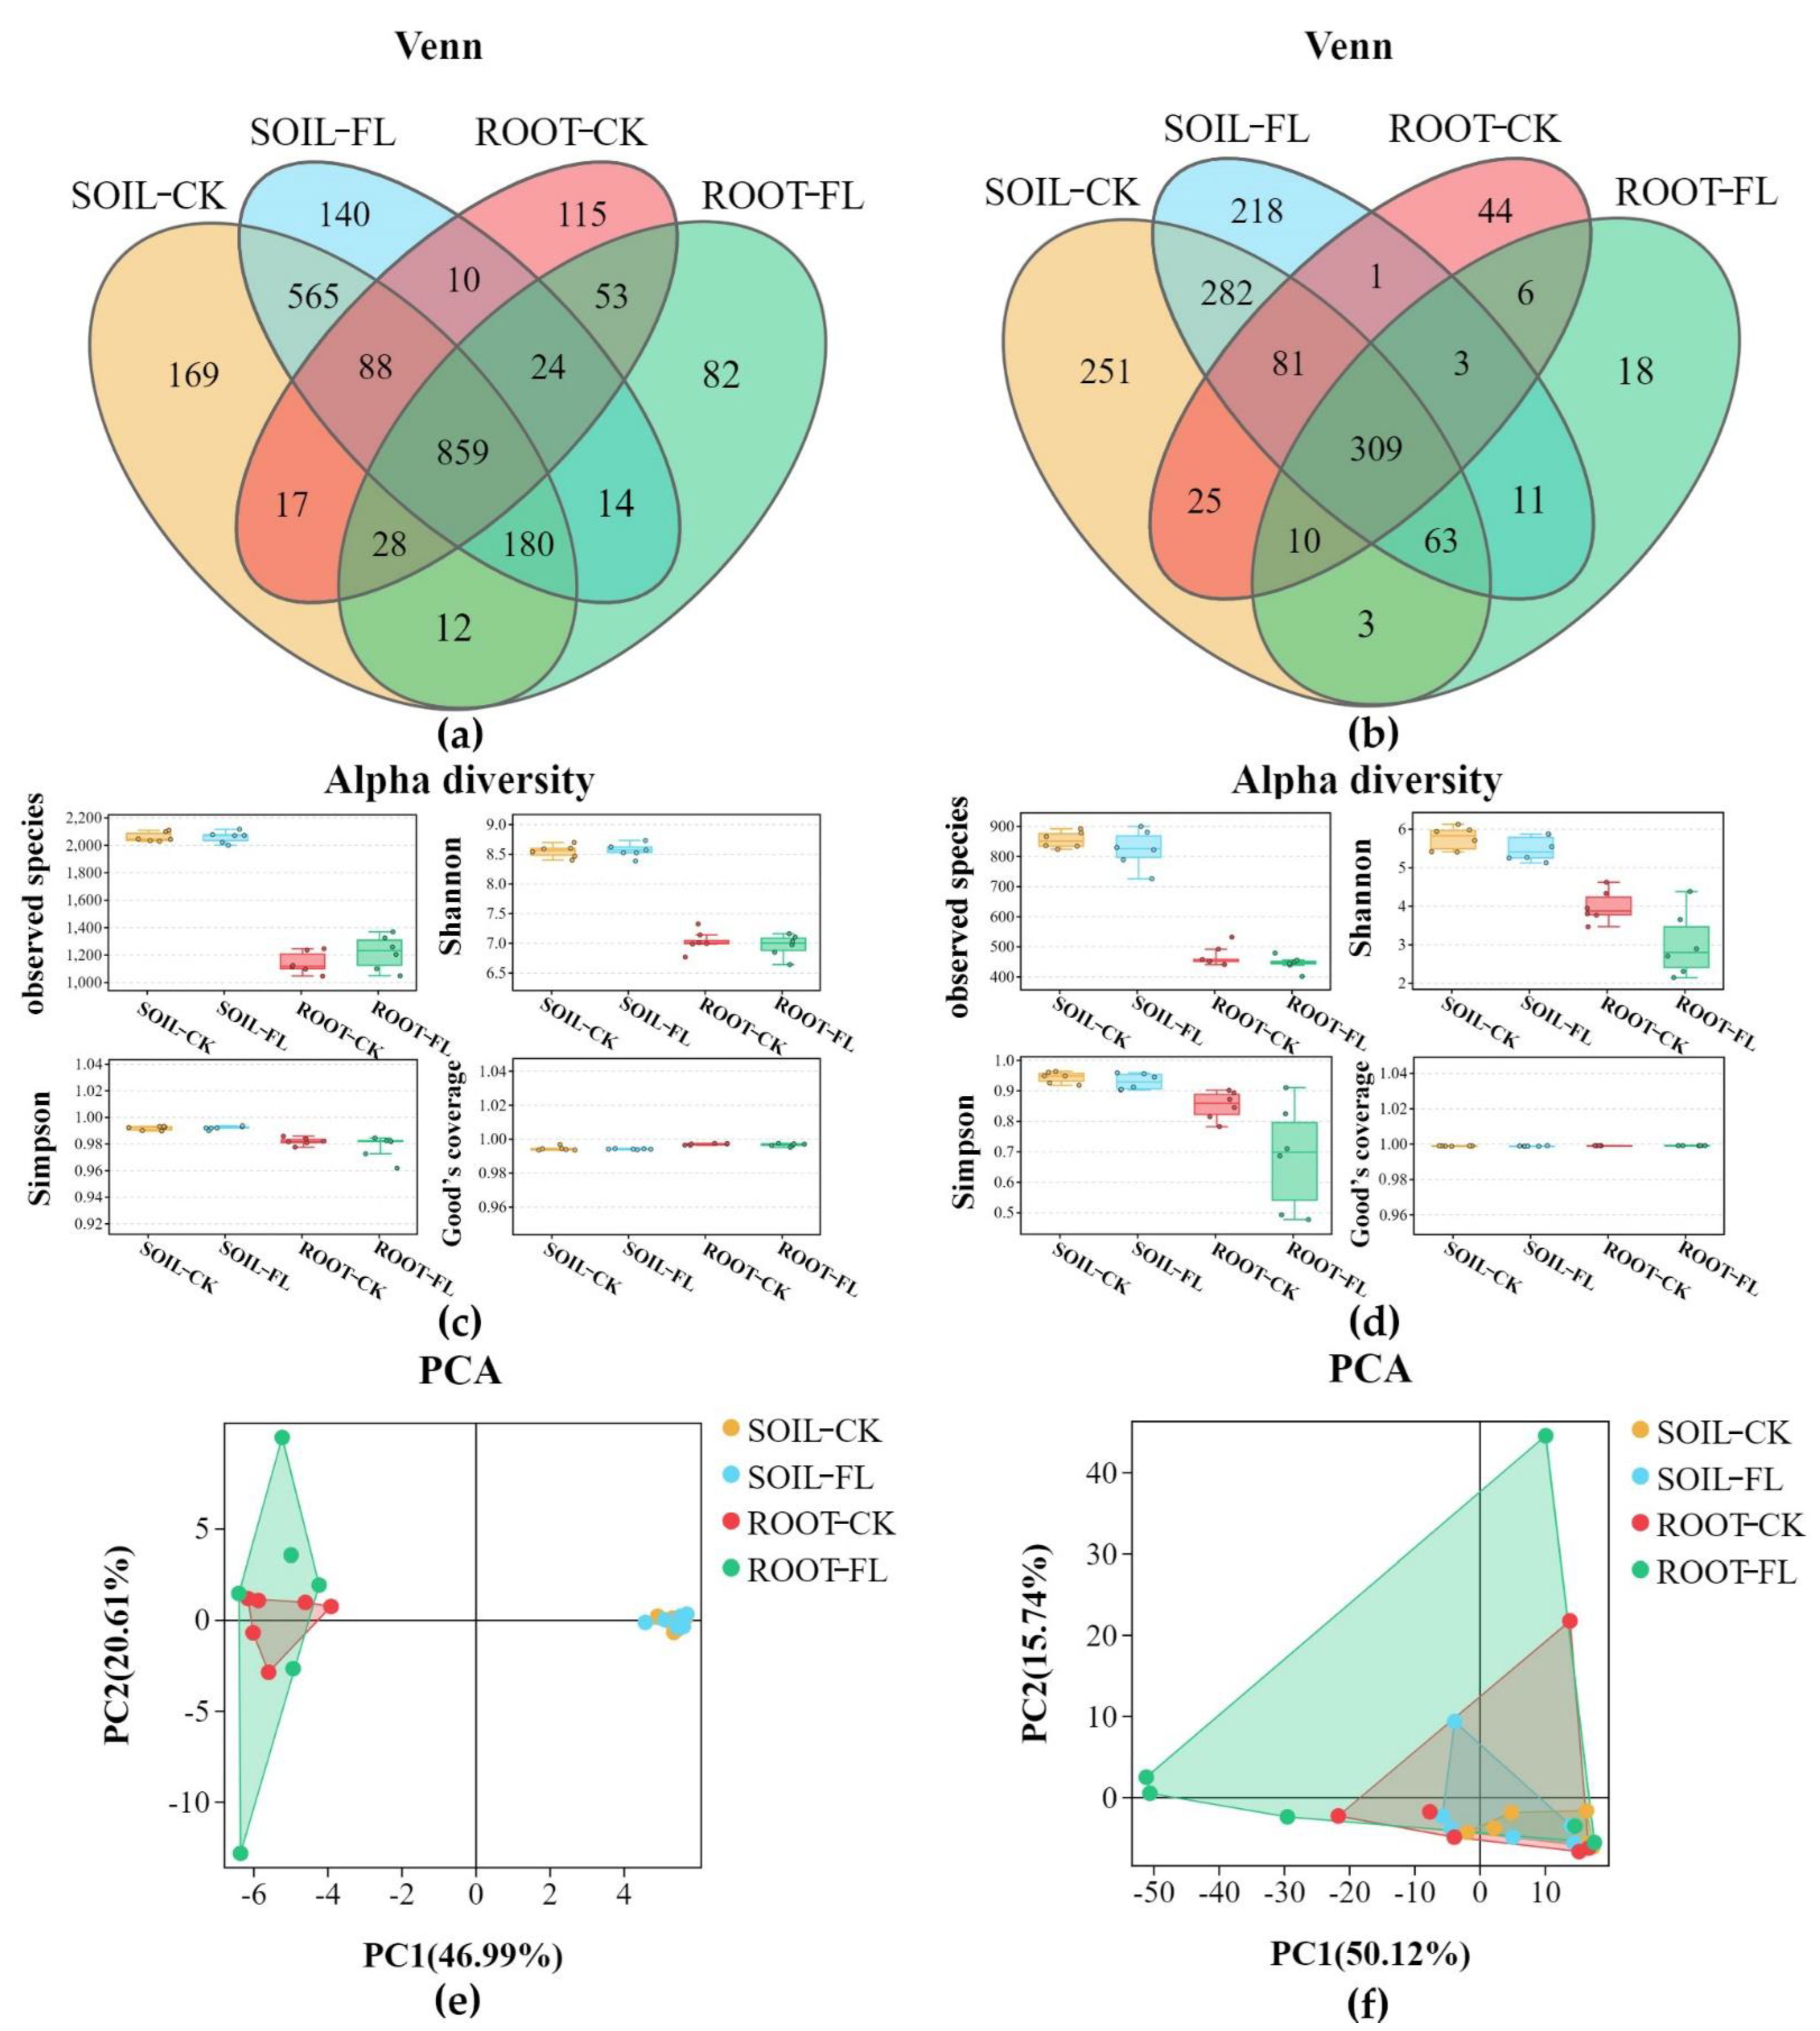
3.2. Metabarcoding Survey of Soil and Root Microbes

3.2.1. Sequencing Analysis Revealed the Greater Diversity in Fenlong Samples than in CK Samples for Fungi and/or Bacteria

A total of 5,613,900 metabarcoding tags were obtained from the sequencing data. The clustering analyses of the soil and root samples revealed 1618 and 648 operational taxonomic units (OTUs) on average for bacteria (based on 16S rRNA) and fungi (based on ITS), respectively (Table 1). A Venn diagram is a picture showing sets of things that have a shared quality as circles that cross over each other, to show which qualities the different sets have in common. It was revealed that 36.5% (859/2356) of bacterial OTUs and 23.3% (309/1325) of fungal OTUs were shared among the four groups of samples (ROOT-FL, SOIL-FL, ROOT-CK, and SOIL-CK) (Figure 3a,b). Alpha diversity was analyzed by Tukey’s HSD to assessing species diversity. The mean values of the observed species (Sob) index of soil samples from the CK and FL groups were 2058 and 2057.5 (bacteria) and 854.16 and 823.66 (fungi), respectively. The mean values of the Sob index of root samples from the CK and FL groups were 1141.83 and 1215.66 (bacteria) and 470.16 and 444.16 (fungi), respectively. The mean values of the Shannon index of soil samples from the CK and FL groups were 8.54 and 8.55 (bacteria) and 5.75 and 5.47 (fungi), respectively. The mean values of the Shannon index of root samples from the CK and FL groups were 7.03 and 6.95 (bacteria) and 3.98 and 3.0 (fungi), respectively. The mean values of the Simpson index of soil samples from the CK and FL groups were 0.99 and 0.99 (bacteria) and 0.94 and 0.92 (fungi), respectively. The mean values of the Simpson index of root samples from the CK and FL groups were 0.98 and 0.97 (bacteria) and 0.85 and 0.68 (fungi), respectively. The mean values of the Good’s coverage index were all under 0.99, indicating that the level of sequencing was adequate for elucidating microbial diversity (Figure 3c,d). To further assess sample composition relation, we performed principal components analysis (PCA). It was shown that the PC1 alone could divided the OTU of bacteria into the soil group and the root group, while the PC2 further distinguish the differences existed within root group (Figure 3e). However, the differences in OTU of fungi between soil and root was not obviously (Figure 3f). It was revealed that greater variation in FL samples than in CK samples for fungi in both root samples and soil samples (Figure 3f), while the greater variation in FL samples than in CK samples for bacteria in root samples but not in soil samples (Figure 3e). Overall, the diversity of endophytic bacteria and fungi in roots was generally lower than that of soil bacteria and fungi, and there was no significant difference in the diversity of OTUs between FL and CK soil and root samples according to the Sob index (Figure 3c,d). However, significant range variation in the Shannon and Simpson indices was observed among FL and CK soil and root samples. For example, Simpson index values ranged from 0.78 to 0.90 in CK root samples but ranged from 0.47 to 0.90 in FL root samples (Figure 3c,d).

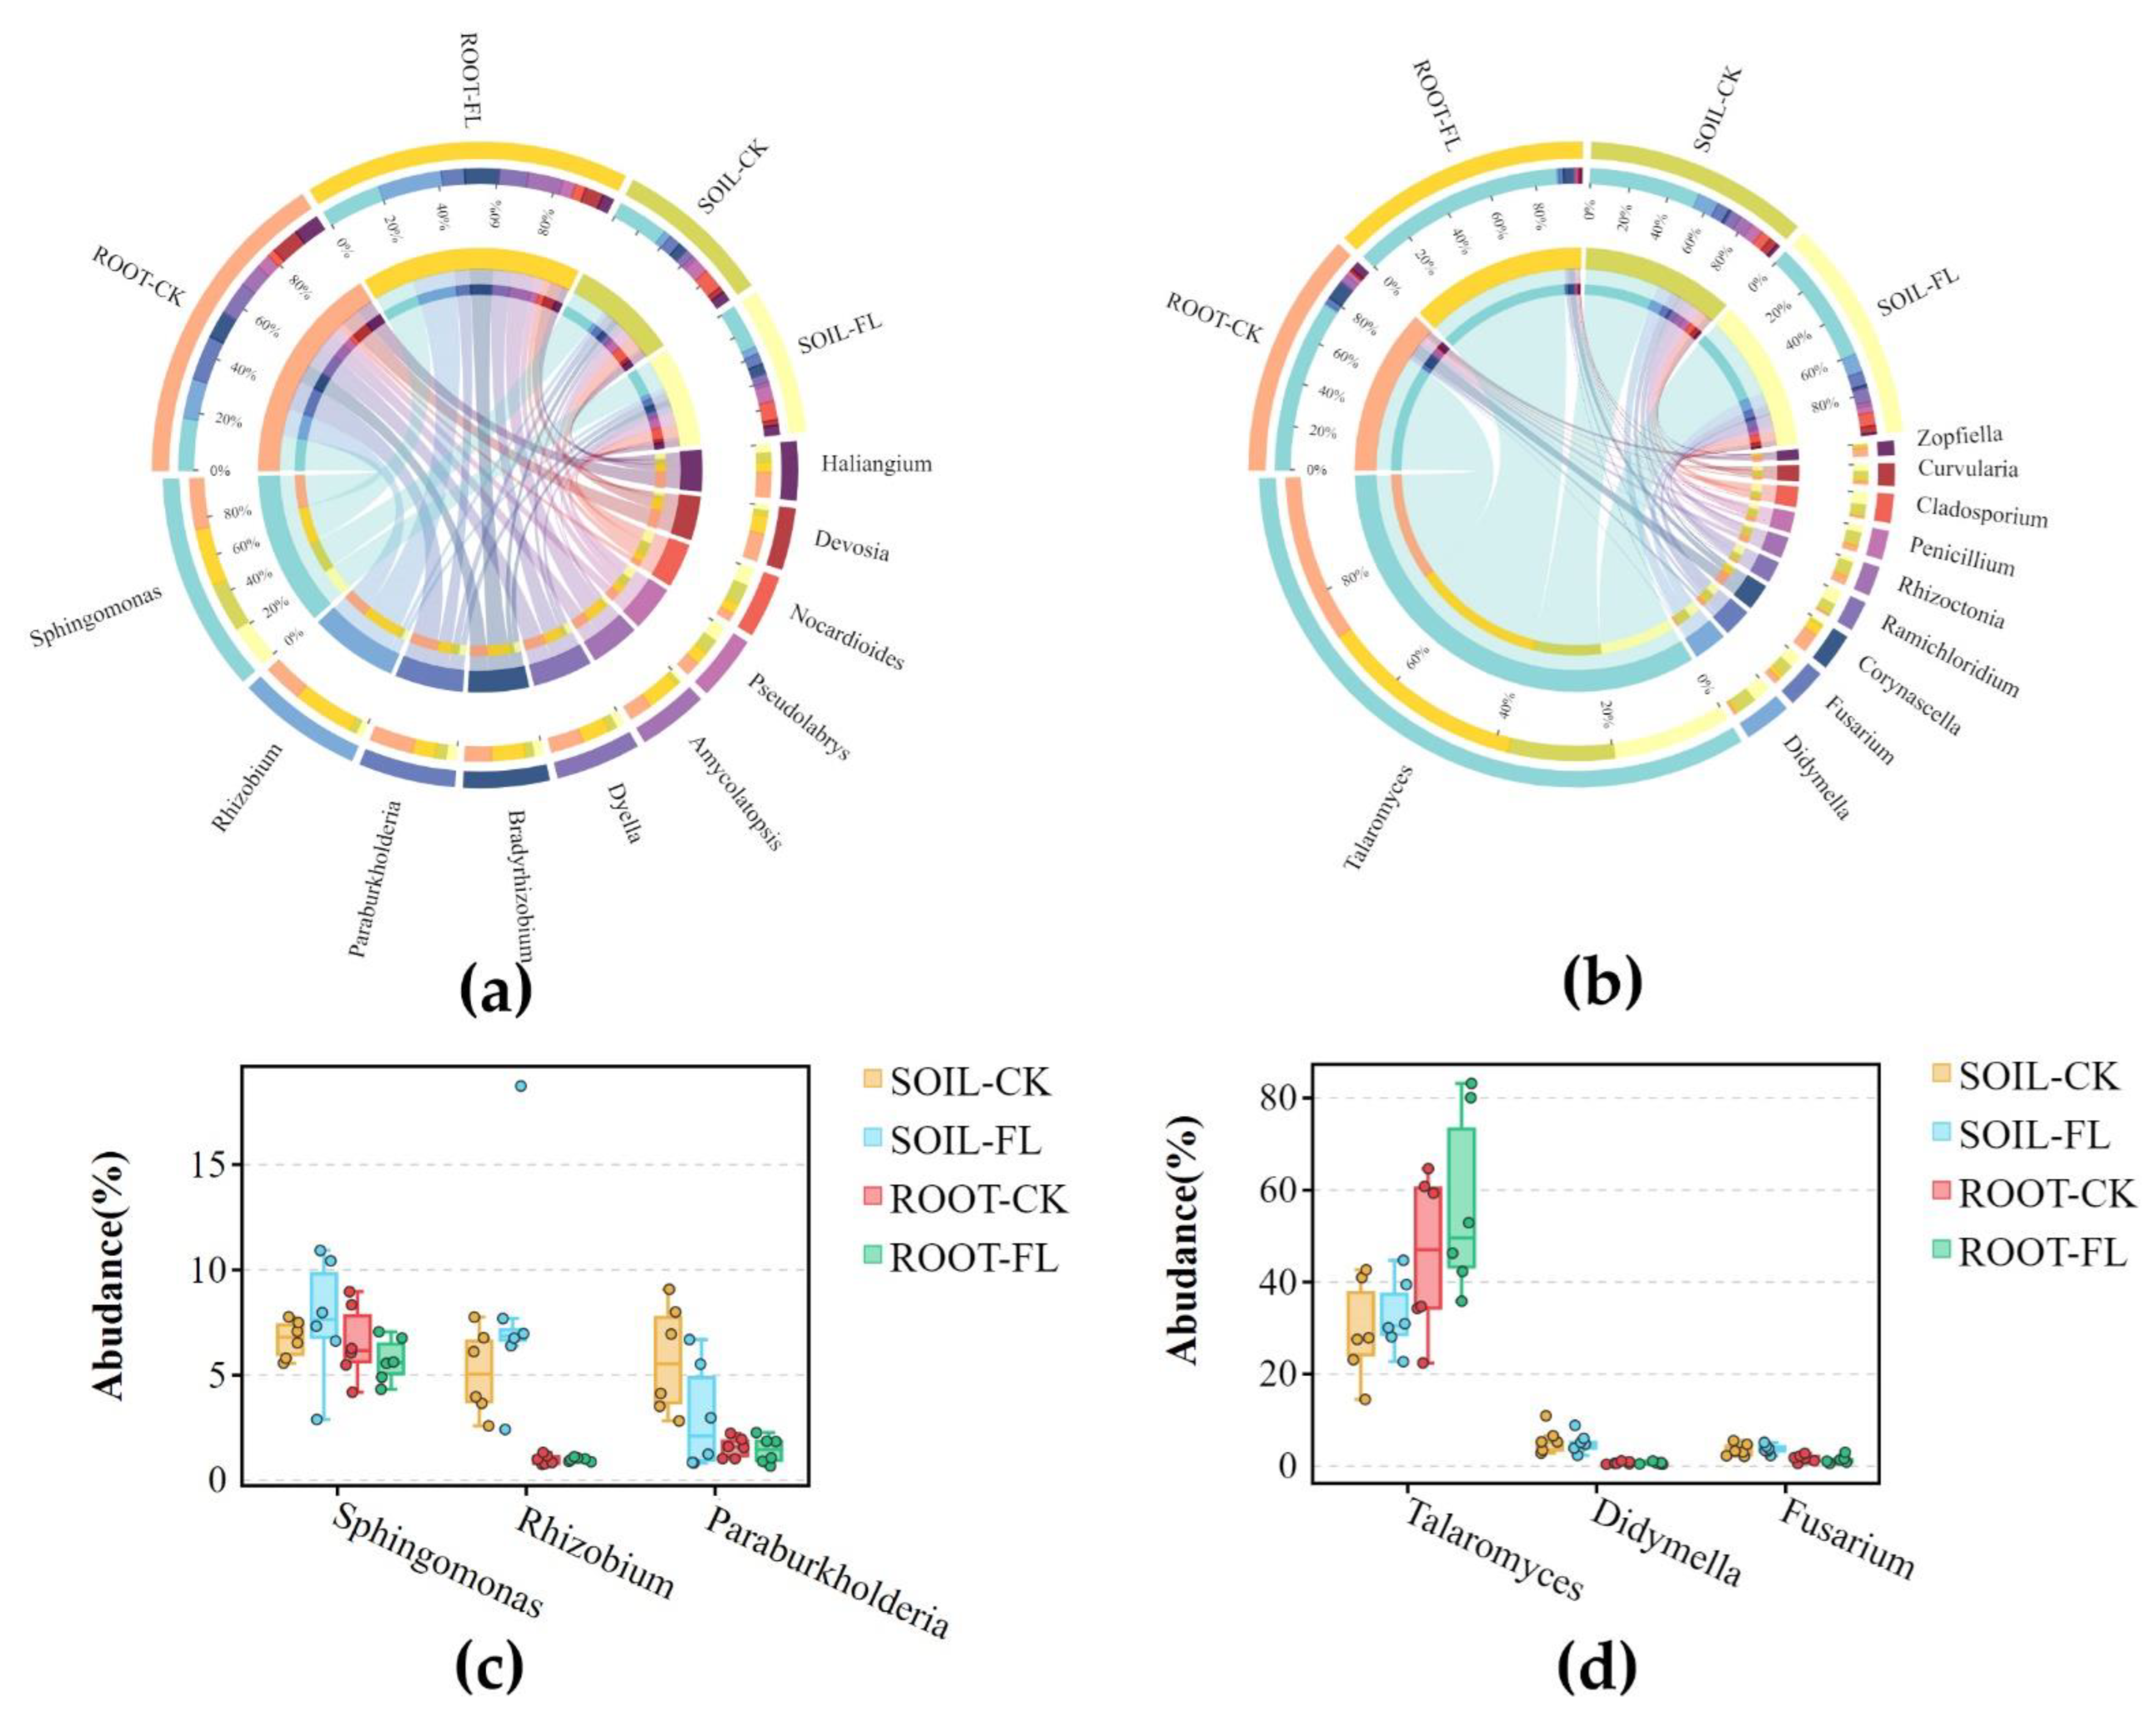
3.2.2. The Predominant Microbial Genera Identified in Fenlong Operation

We analyzed differences in the community compositions of bacteria and fungi in soil and root samples from the CK and FL groups based on the SILVA and UNITE databases. The main microbial genera detected are shown in Figure 4a,b. After low-abundance taxa and unmatched OTUs were removed, the top 10 most abundant bacteria were Sphingomonas (24.57, 21.38, 25.17%, and 28.89 in SOIL-CK, SOIL-FL, ROOT-CK, and ROOT-FL, respectively), Rhizobium (6.22, 6.3, 33.76, and 53.72%), Paraburkholderia (13.16, 12.03, 49.18, and 25.63%), Bradyrhizobium (11.17, 12.21, 33.63, and 42.98%), Dyella (10.74, 10.95, 42.26, and 36.06%), Amycolatopsis (5.89, 5.05, 35.85, and 53.21%), Pseudolabrys (26.41, 27.14, 24.16, and 22.29%), Nocardioides (36.18, 32.21, 13.63, and 18.09%), Devosia (9.49, 9.39, 48.73, and 32.39%), and Haliangium (17.4, 16.61, 46.01, and 19.98%). The top 10 most abundant fungi were Talaromyces (14.83, 19.79, 27.92, and 34.46%), Didymella (48.08, 43.3, 4.48, and 4.15%), Fusarium (34.51, 36.69, 15.89, and 12.91%), Corynascella (6.78, 7.42, 56.12, and 29.68%), Ramichloridium (39.63, 53.22, 3.61, and 3.54%), Rhizoctonia (50.3, 17.41, 29.33, and 6.65%), Penicillium (47.23, 27.39, 19.96, and 5.42%), Cladosporium (41.86, 50.69, 3.38, and 4.08%), Curvularia (42.44, 36.53, 11.8, and 9.24%), and Zopfiella (20.64, 7.96, 63.45, and 7.95%).
We characterized differences in the distribution of the top three abundant genera between all groups (including low-abundance taxa and unmatched OTUs). The mean total relative abundances of the top three bacterial genera Sphingomonas, Rhizobium, and Paraburkholderia were 6.62, 3.77, and 2.9%, respectively (Figure 4c). The mean total relative abundances of the top three fungal genus Talaromyces, Didymella, and Fusarium were 40.04, 2.88%, and 2.4%, respectively (Figure 4d). No significant differences in the relative abundances of fungal genera in soil and root samples in the CK and FL groups were observed.
Although no statistically significant differences between CK and FL samples were detected, two bacterial and fungal genera, Rhizobium and Talaromyces, were more common in the ROOT-FL group than in the ROOT-CK group. Specifically, the abundance of Rhizobium was 33.76 and 53.72% in the ROOT-CK and ROOT-FL groups, respectively, and the abundance of Talaromyces was 27.92 and 34.46% in the ROOT-CK and ROOT-FL groups, respectively (Figure 4a,b).

3.3. Isolation and Classification of the Specific Endophytic Root Bacteria and Fungi from Sugarcane Rhizosphere

To verify the above findings, we performed a culture-omics experiment on sugarcane samples from the ROOT-FL group. A total of 100 bacterial strains and 50 fungal strains were isolated, and 14 bacterial strains and 11 fungal strains could be resolved by DNA barcoding sequencing (16S rRNA 27f/1492r was used for bacteria, and ITS 1/4 was used for fungi). The sequences of related species downloaded from Genbank (Table 2) were used to construct phylogenetic trees of fungi and bacteria to identify the isolated strains. A total of 13 of the 14 bacterial strains clustered with sequences from Genbank (Figure 5a; Table 3). R1 was not closely clustered with sequences of type species, but instead was most closely clustered with Rhizobium species (Figure 5a; Table 3). R3, Lx2.2, Rx11, and R2 were most closely clustered with Bacillus aryabhattai; Rx4 and Lx2.1 were most closely clustered with Bacillus aerius; Rx12 and Rx18 were most closely clustered with Bacillus safensis; and Rx1, Rx16, Rx5, Rx13, and R5 were most closely clustered with Ralstonia sp. (Figure 5a; Table 3). Among fungi, T16 and T13 were most closely clustered with Penicillium ludwigii; RT8 was most closely clustered with Penicillium raperi; T5 was most closely clustered with Penicillium refeldin; T24 was most closely clustered with Penicillium sp.; T3 was most closely clustered with Aspergillus terreus; T19 was most closely clustered with Talaromyces sp.; RT4, T8, and R3 were most closely clustered with Talaromyces argentin; and T18 was most closely clustered with Curvularia petersoni (Figure 5b; Table 3). We thus successfully isolated species from the high-abundant genera Rhizobium and Talaromyces from sugarcane roots.

4. Discussion

The development of sustainable systems of tillage with reduced effort and reduced expenditure is important for agriculture [34,35]. Fenlong (FL) is an advanced tillage operation newly developed that has been shown to significantly increase the yield of many crops, including sugarcane, without extra inputs [9,12,13,17]; however, the mechanism by which FL promotes crop growth has not been far from enough explored to date. We identified the bacteria and fungi in both soil and roots of sugarcane under FL and CK to provide insight into how soil and root microbiota mediate the growth-promoting effects of FL.
Some previous work reported that FL significantly increased sugarcane yield up to 20% [9,12]. Plant height of the sugarcane was the most robust indicator of crop yield in our data set (Figure 2a,b). Similar increases in yield have been reported in rice [8]. Our results were basically consistent with these previous studies. In addition, we also found that FL increased the yield of sugarcane by increasing the efficiency with which soil nutrients could be utilized by plants (Figure 2). The effects of tillage practices on the chemical properties of soil as well as crop growth and yields vary [36]. In FL, the soil can be deeply plowed with minimal disturbance [8]. Thus, FL provides the advantages of deep tillage, including the stability of tilled soil, which promotes the development of crop roots. There was no significant difference in the available potassium content of soil in the FL and CK groups. Potassium is key for the synthesis and translocation of sucrose [37]. This finding suggests that FL does not affect Brix value of sugarcane. Overall, our findings confirmed the efficacy of FL for increasing crop yields.
Our microbial metabarcoding survey revealed that FL promoted the activity of endophytic microbes in sugarcane roots. Although FL affected the Sob index slightly in sugarcane soil and roots, analysis of alpha indices revealed significant differences in the abundance of specific OTUs in the ROOT-FL group relative to the other three groups (Figure 3c,d), indicating that the abundance of endophytic bacteria and fungi varied greatly after FL. In addition, principal components analysis revealed that FL could increase differences in the abundances of OTUs among root samples (Figure 3d–f). These findings indicate that FL increases the diversity of the root environment. We supposed FL may enhance soil-root interaction due to the soil being smashed while the main soil layer that makes the contact area between the roots and the soil is not disturbed. This may increase intensity of competition among microbial taxa. Competition between microbial taxa might also result in the appearance of additional metabolic processes [18], and this might contribute to explaining the sugarcane yield-promoting effects of FL.
Among the top three most abundant bacterial genera, Rhizobium was particularly noteworthy because the abundance of this genus varied greatly among all groups (Figure 4c), and was most abundant in the FL group (Figure 4a). Rhizobia species are plant growth-promoting bacteria that provide nitrogen to hosts by binding to plant roots [38]. Rhizobia populations have been previously studied in the soil and roots of sugarcane [20,39]. We also isolated a strain (R1) from the roots of sugarcane under FL that was most closely clustered with Rhizobium, and the phylogenetic tree suggested that this isolate might represent a new species (Figure 5a). Other strains of soil and root bacteria that were isolated or identified included: Sphingomonas, which is a common genus that has been widely isolated from soil [40]; Paraburkholderia, which plays a role in promoting soil metabolism [41]; Bacillus spp., which produce various compounds that contribute to the biocontrol of plant pathogens and promote plant growth [42]; and Bacillus aryabhattai, which plays a role in soil bioremediation [43] (Figure 5a); Ralstonia sp., which has been reported produce volatile compounds that promote plant growth [44], and that may related to the growth-promoting properties of FL. Among the top abundant fungal genera detected and isolated strains, Talaromyces was dominant in both soil and root samples. Talaromyces is known to be able to carry out phosphate solubilization [45]. The abundance of Talaromyces was higher in root and soil samples from the FL group (Figure 4d). Thus, Talaromyces might affect PLT and TW traits; however, this hypothesis requires further testing. Besides, with respect to the other two fungal top genera and isolated strains (genera of Didymella, Fusarium, Penicillium, Aspergillus and Curvularia), their relative abundance was low which implies their association with FL may not significant.
In summary, we revealed differences in the diversity of microbial taxa in the soil and roots of sugarcane under FL and CK. Our findings provide new insights that could be used to enhance sugarcane yields. The results of this research will also aid further improvement and application of FL.

Author Contributions

Conceptualization, L.W. and B.W.; methodology, M.D. and S.H.; software, M.D.; investigation, M.D., H.F., L.M. and Y.L.; resources, L.W. and Y.L.; data curation, M.D.; writing—original draft preparation, M.D.; writing—review and editing, L.W. and Y.L.; visualization, M.D.; supervision, L.W.; project administration, L.W. and S.L.; funding acquisition, L.W. All authors have read and agreed to the published version of the manuscript.

Funding

This research was funded by China Postdoctoral Science Foundation (2020M683619XB); Guangxi innovation driven development project (No. AA20302020-3); Natural Science Foundation of Guangxi (2020GXNSFDA238027).

Institutional Review Board Statement

Not applicable.

Informed Consent Statement

Not applicable.

Data Availability Statement

The raw amplicon sequencing dataset is available in the NCBI Sequence Read Archive under BioSample accession PRJNA783171.

Acknowledgments

We thank TopEdit (www.topeditsci.com, accessed on 11 November 2021) for linguistic assistance during the preparation of this manuscript.

Conflicts of Interest

The authors declare no conflict of interest.

References

  1. Zhang, H.; Li, Y.; Zhu, J.K. Developing naturally stress-resistant crops for a sustainable agriculture. Nat. Plants 2018, 4, 989–996. [Google Scholar] [CrossRef] [PubMed]
  2. Holland, J.M. The environmental consequences of adopting conservation tillage in Europe: Reviewing the evidence. Agric. Ecosyst. Environ. 2004, 103, 1–25. [Google Scholar] [CrossRef]
  3. Wang, Z.; Li, Y.; Li, T.; Zhao, D.; Liao, Y. Conservation tillage decreases selection pressure on community assembly in the rhizosphere of arbuscular mycorrhizal fungi. Sci. Total Environ. 2020, 710, 136326. [Google Scholar] [CrossRef] [PubMed]
  4. Wipf, H.M.; Xu, L.; Gao, C.; Spinner, H.B.; Taylor, J.; Lemaux, P.; Mitchell, J.; Coleman-Derr, D. Agricultural Soil Management Practices Differentially Shape the Bacterial and Fungal Microbiome of Sorghum bicolor. Appl. Environ. Microbiol. 2020, 87, e02345-20. [Google Scholar] [CrossRef]
  5. Li, Y.; Li, T.; Zhao, D.; Wang, Z.; Liao, Y. Different tillage practices change assembly, composition, and co-occurrence patterns of wheat rhizosphere diazotrophs. Sci. Total Environ. 2021, 767, 144252. [Google Scholar] [CrossRef]
  6. Fierer, N. Embracing the unknown: Disentangling the complexities of the soil microbiome. Nat. Rev. Microbiol. 2017, 15, 579–590. [Google Scholar] [CrossRef]
  7. Trivedi, P.; Leach, J.E.; Tringe, S.G.; Sa, T.; Singh, B.K. Plant–microbiome interactions: From community assembly to plant health. Nat. Rev. Microbiol. 2020, 18, 607–621. [Google Scholar] [CrossRef]
  8. Zhang, J.; Li, F.; Liao, P.; Khan, A.; Hussain, I.; Iqbal, A.; Ali, I.; Wei, B.; Jiang, L. Smash ridge tillage strongly influence soil functionality, physiology and rice yield. Saudi J. Biol. Sci. 2021, 28, 1297–1307. [Google Scholar] [CrossRef]
  9. Suli, L.; Jinling, H.; Benhui, W.; Xiaoying, L.; Ruijie, L.; Lingqiang, W.; Zhigang, L. Effects of Fenlong Tillage on Photosynthetic and Physiological Characteristics, Yield and Quality of Sugarcane (Saccharumofficinarum). Chin. J. Trop. Crops 2021, 42, 726–731. [Google Scholar]
  10. Bin, W.; Yu-E, L.; An-Dong, C.; Shuo, L.; Tian-Jing, R.; Jia-Qi, Z. Global policies in agricultural greenhouse gas reduction and carbon sequestration and their enlightenment to China in the view of carbon neutrality. Clim. Chang. Res. 2022, 18, 1–13. [Google Scholar]
  11. Zhenke, Z.; Mouliang, X.; Liang, W.; Shuang, W.; Jina, D.; Jianping, C.; Tida, G. The key biogeochemical processes of carbon sequestration in paddy soil and its countermeasures for carbon neutralization. Chin. J. Eco-Agric. 2021, 1–11. Available online: http://kns.cnki.net/kcms/detail/13.1432.S.20211224.1121.001.html (accessed on 29 November 2021).
  12. Ben-hui, W.; Xiu-qin, G.; Zhang-you, S.; Xiu-cheng, N.; Liu-ying, L.; Guang-po, W.; Yan-ying, L.; Po, H.; Bin, L.; Yan-yong, W. Yield Increase of Smash-Ridging Cultivation of Sugarcane. Sci. Agric. Sin. 2011, 44, 4544–4550. [Google Scholar] [CrossRef]
  13. Benhui, W.; Zhangyou, S.; Jia, Z.; Lingzhi, Z.; Po, H.; Xian, Z. Study on Effect and Mechanism of Improving Saline-alkali Soil by Fenlong Tillage. Soils 2020, 52, 699–703. [Google Scholar] [CrossRef]
  14. Jianghan, L.; Wenshou, H. Effects of Smash-ridging Technology on Soil Properties and Potato Yield. J. Northeast Agric. Sci. 2020, 45, 20–25. [Google Scholar] [CrossRef]
  15. Shijia, W.; Daihua, J.; Wenguo, Z.; Rongrong, Z.; Junwei, L.; Benhui, W. Effect of Deep Vertical Rotary Tillage on Aggregate Structure in Farmland of Lateritic Red Soil. Acta Pedol. Sin. 2020, 57, 326–335. [Google Scholar] [CrossRef]
  16. Xiaohua, D.; Xinyue, W.; Hongwu, Y.; Yongjun, L.; Yongsheng, D.; Miliang, Z.; Mingfa, Z.; Jiongping, Z.; Qi, L.; Weimin, W.; et al. Effects of Smashing Ridge Tillage on Growth, Dry Matter Accumulation, Output and Quality of Flue-cured Tobacco. Chin. Tob. Sci. 2020, 41, 28–35. [Google Scholar] [CrossRef]
  17. Hao, L.; Jin-ling, H.; Zhi-gang, L.; Ben-hui, W.; Xiao-ru, C.; Shi-jian, H.; Xiao-ying, L.; Su-li, L. Fenlong tillage increase soil nutrient availability, and benefit vascular tissue structure and nutrient absorption of sugarcane. J. Plant Nutr. Fertil. 2021, 27, 204–214. [Google Scholar] [CrossRef]
  18. Rolfe, S.A.; Griffiths, J.; Ton, J. Crying out for help with root exudates: Adaptive mechanisms by which stressed plants assemble health-promoting soil microbiomes. Curr. Opin. Microbiol. 2019, 49, 73–82. [Google Scholar] [CrossRef]
  19. Nesme, J.; Achouak, W.; Agathos, S.N.; Bailey, M.; Baldrian, P.; Brunel, D.; Frostegård, Å.; Heulin, T.; Jansson, J.K.; Jurkevitch, E.; et al. Back to the Future of Soil Metagenomics. Front. Microbiol. 2016, 7, 73. [Google Scholar] [CrossRef]
  20. Liu, Q.; Zhao, X.; Liu, Y.; Xie, S.; Xing, Y.; Dao, J.; Wei, B.; Peng, Y.; Duan, W.; Wang, Z. Response of Sugarcane Rhizosphere Bacterial Community to Drought Stress. Front. Microbiol. 2021, 12, 716196. [Google Scholar] [CrossRef]
  21. Achouak, W.; Abrouk, D.; Guyonnet, J.; Barakat, M.; Ortet, P.; Simon, L.; Lerondelle, C.; Heulin, T.; Haichar, F.E.Z. Plant hosts control microbial denitrification activity. FEMS Microbiol. Ecol. 2019, 95, fiz021. [Google Scholar] [CrossRef] [PubMed]
  22. Guyonnet, J.P.; Guillemet, M.; Dubost, A.; Simon, L.; Ortet, P.; Barakat, M.; Heulin, T.; Achouak, W.; Haichar, F.E.Z. Plant Nutrient Resource Use Strategies Shape Active Rhizosphere Microbiota Through Root Exudation. Front. Plant Sci. 2018, 9, 1662. [Google Scholar] [CrossRef] [PubMed] [Green Version]
  23. Singh, R.K.; Singh, P.; Li, H.B.; Song, Q.Q.; Guo, D.J.; Solanki, M.K.; Verma, K.K.; Malviya, M.K.; Song, X.P.; Lakshmanan, P.; et al. Diversity of nitrogen-fixing rhizobacteria associated with sugarcane: A comprehensive study of plant-microbe interactions for growth enhancement in Saccharum spp. BMC Plant Biol. 2020, 20, 220. [Google Scholar] [CrossRef] [PubMed]
  24. Beckers, B.; De Beeck, M.O.; Thijs, S.; Truyens, S.; Weyens, N.; Boerjan, W.; Vangronsveld, J. Performance of 16s rDNA Primer Pairs in the Study of Rhizosphere and Endosphere Bacterial Microbiomes in Metabarcoding Studies. Front. Microbiol. 2016, 7, 650. [Google Scholar] [CrossRef] [Green Version]
  25. Toju, H.; Tanabe, A.S.; Yamamoto, S.; Sato, H. High-coverage ITS primers for the DNA-based identification of ascomycetes and basidiomycetes in environmental samples. PLoS ONE 2012, 7, e40863. [Google Scholar] [CrossRef] [Green Version]
  26. Wang, Q.; Garrity, G.M.; Tiedje, J.M.; Cole, J.R. Naive Bayesian classifier for rapid assignment of rRNA sequences into the new bacterial taxonomy. Appl. Environ. Microbiol. 2007, 73, 5261–5267. [Google Scholar] [CrossRef] [Green Version]
  27. Pruesse, E.; Quast, C.; Knittel, K.; Fuchs, B.M.; Ludwig, W.; Peplies, J.; Glöckner, F.O. SILVA: A comprehensive online resource for quality checked and aligned ribosomal RNA sequence data compatible with ARB. Nucleic Acids Res. 2007, 35, 7188–7196. [Google Scholar] [CrossRef] [Green Version]
  28. Nilsson, R.H.; Larsson, K.H.; Taylor, A.F.S.; Bengtsson-Palme, J.; Jeppesen, T.S.; Schigel, D.; Kennedy, P.; Picard, K.; Glöckner, F.O.; Tedersoo, L.; et al. The UNITE database for molecular identification of fungi: Handling dark taxa and parallel taxonomic classifications. Nucleic Acids Res. 2019, 47, D259–D264. [Google Scholar] [CrossRef]
  29. Chen, H.; Boutros, P.C. VennDiagram: A package for the generation of highly-customizable Venn and Euler diagrams in R. BMC Bioinform. 2011, 12, 35. [Google Scholar] [CrossRef] [Green Version]
  30. Caporaso, J.G.; Kuczynski, J.; Stombaugh, J.; Bittinger, K.; Bushman, F.D.; Costello, E.K.; Fierer, N.; Peña, A.G.; Goodrich, J.K.; Gordon, J.I.; et al. QIIME allows analysis of high-throughput community sequencing data. Nat. Methods 2010, 7, 335–336. [Google Scholar] [CrossRef] [Green Version]
  31. Krzywinski, M.; Schein, J.; Birol, I.; Connors, J.; Gascoyne, R.; Horsman, D.; Jones, S.J.; Marra, M.A. Circos: An information aesthetic for comparative genomics. Genome Res. 2009, 19, 1639–1645. [Google Scholar] [CrossRef] [PubMed] [Green Version]
  32. White, T.J.; Bruns, T.; Lee, S.; Taylor, J. 38—Amplification and Direct Sequencing of Fungal Ribosomal RNA Genes for Phylogenetics. In PCR Protocols; Innis, M.A., Gelfand, D.H., Sninsky, J.J., White, T.J., Eds.; Academic Press: San Diego, CA, USA, 1990; pp. 315–322. [Google Scholar] [CrossRef]
  33. Avşar, C.; Aras, E.S. Community structures and comparison of nosZ and 16S rRNA genes from culturable denitrifying bacteria. Folia Microbiol. 2020, 65, 497–510. [Google Scholar] [CrossRef]
  34. Busari, M.A.; Kukal, S.S.; Kaur, A.; Bhatt, R.; Dulazi, A.A. Conservation tillage impacts on soil, crop and the environment. Int. Soil Water Conserv. Res. 2015, 3, 119–129. [Google Scholar] [CrossRef] [Green Version]
  35. Selman, P. Learning to Love the Landscapes of Carbon-Neutrality. Landsc. Res. 2010, 35, 157–171. [Google Scholar] [CrossRef]
  36. Li, J.; Wang, Y.-K.; Guo, Z.; Li, J.-B.; Tian, C.; Hua, D.-W.; Wang, H.-Y.; Han, J.-C.; Xu, Y. Effects of conservation tillage on soil physicochemical properties and crop yield in an arid Loess Plateau, China. Sci. Rep. 2020, 10, 4716. [Google Scholar] [CrossRef] [PubMed]
  37. Kwong, K. The effects of potassium on growth, development, yield and quality of sugarcane. In Pasricha and Bansal. Potassium for Sustainable Crop Production: Potash Research Institute of India and International Potash Institute; Springer: Horgen, Switzerland, 2002; pp. 430–440. Available online: https://www.ipipotash.org/uploads/udocs/Potassium%20in%20sugarcane.pdf (accessed on 29 November 2021).
  38. Poole, P.; Ramachandran, V.; Terpolilli, J. Rhizobia: From saprophytes to endosymbionts. Nat. Rev. Microbiol. 2018, 16, 291–303. [Google Scholar] [CrossRef]
  39. Júnior, I.D.A.M.; de Matos, G.F.; de Freitas, K.M.; da Conceição Jesus, E.; Rouws, L.F.M. Occurrence of diverse Bradyrhizobium spp. in roots and rhizospheres of two commercial Brazilian sugarcane cultivars. Braz. J. Microbiol. 2019, 50, 759–767. [Google Scholar] [CrossRef]
  40. An, D.S.; Liu, Q.M.; Lee, H.G.; Jung, M.S.; Kim, S.C.; Lee, S.T.; Im, W.T. Sphingomonas ginsengisoli sp. nov. and Sphingomonas sediminicola sp. nov. Int. J. Syst. Evol. Microbiol. 2013, 63, 496–501. [Google Scholar] [CrossRef] [Green Version]
  41. Cyle, K.T.; Klein, A.R.; Aristilde, L.; Martínez, C.E. Ecophysiological Study of Paraburkholderia sp. Strain 1N under Soil Solution Conditions: Dynamic Substrate Preferences and Characterization of Carbon Use Efficiency. Appl. Environ. Microbiol. 2020, 86, e01851-20. [Google Scholar] [CrossRef]
  42. Miljaković, D.; Marinković, J.; Balešević-Tubić, S. The Significance of Bacillus spp. in Disease Suppression and Growth Promotion of Field and Vegetable Crops. Microorganisms 2020, 8, 1037. [Google Scholar] [CrossRef]
  43. Inthama, P.; Pumas, P.; Pekkoh, J.; Pathom-Aree, W.; Pumas, C. Plant Growth and Drought Tolerance-Promoting Bacterium for Bioremediation of Paraquat Pesticide Residues in Agriculture Soils. Front. Microbiol. 2021, 12, 604662. [Google Scholar] [CrossRef] [PubMed]
  44. Tahir, H.A.S.; Gu, Q.; Wu, H.; Raza, W.; Safdar, A.; Huang, Z.; Rajer, F.U.; Gao, X. Effect of volatile compounds produced by Ralstonia solanacearum on plant growth promoting and systemic resistance inducing potential of Bacillus volatiles. BMC Plant Biol. 2017, 17, 133. [Google Scholar] [CrossRef] [PubMed]
  45. Rubio, P.J.S.; Godoy, M.S.; Mónica, I.F.D.; Pettinari, M.J.; Godeas, A.M.; Scervino, J.M. Carbon and Nitrogen Sources Influence Tricalcium Phosphate Solubilization and Extracellular Phosphatase Activity by Talaromyces flavus. Curr. Microbiol. 2016, 72, 41–47. [Google Scholar] [CrossRef] [PubMed]
Figure 1. Design of the plots in field experiment (a) and the procedure of the sampling and analysis (b). “Fenlong” indicates Fenlong-ridging while “CK” is conventional tillage. At the sixth month after planting, the samples of sugarcane roots and rhizosphere soil were collected for metabarcoding sequencing and testing of the soil chemistry properties. Meanwhile, artificial isolation of endophytic bacteria and fungi from roots were conducted. At the ninth month, the sugarcane yield traits were investigated. Based on the data obtained from above processes, the microbial process of Fenlong-ridging in sugarcane was evaluated and analyzed.
Agriculture 12 00244 g001
Figure 2. Improved agronomic performance and phenotypes of sugarcane plants and the soil nutrients alteration in Fenglong compared to traditional tillage. (a) Statistical analysis of agronomic traits of sugarcanes under conventional tillage (CK) and Fenlong (FL) at six months. The violin-shaped columns indicate the distributions of the data. The curves of the violin-shaped columns represent the probability curve of the data distribution. The number of data points at a particular value is positively correlated with the width of the probability curve. The upper and lower ends of each violin-shaped column indicate the maximum and minimum values of non-outlier data, respectively. The upper and lower edges of the vertical line in each violin-shaped column indicate the 75th and 25th percentiles of the data, respectively; and the central dot indicates the median. (b) Phenotypes of the sugarcane plants at six months. (c) Soil nutrient traits of the soils under CK and FL conditions. The box-plot shows the maximum (top whisker), minimum (bottom whisker), median (line inside the box), upper quartile (top margin of the box), and lower quartile (lower margin of the box).
Agriculture 12 00244 g002
Figure 3. Venn analysis, alpha diversity analysis, and principal component analysis based on the recovered OTUs. (a,b) Venn analysis of bacteria and fungi, respectively; (c,d) alpha diversity analysis for bacteria and fungi using Tukey’s HSD; (e,f) principal component analysis of the OUT of the bacteria and fungi from soil and roots under FL and CK. The colored dots in the figures correspond to the different sample groups.
Agriculture 12 00244 g003
Figure 4. Microbial community composition and taxa (genera) of the top three biomarker species of bacteria and fungi at the genus level. (a,b) Top 10 abundant bacterial and fungal genera in soil and roots in the CK and FL groups. The colors of the upper half of the circle indicate the different sample groups, and the color of the lower half of the circle indicates the main genera. The colors of the outermost ring of the lower half of the circle indicate the genera, and the innermost ring of the circle indicates the abundance of the genera in the different groups. The thickness of the lines connecting genera to samples indicates the abundance of the genera in particular samples. (c,d) Biomarker genus abundance analysis for bacteria and fungi by Tukey’s HSD.
Agriculture 12 00244 g004
Figure 5. Phylogenetic tree of bacteria (a) and fungi (b). The similarity distance scale is provided in the lower left corner. Values on the nodes of the phylogenetic tree are bootstrap values.
Agriculture 12 00244 g005
Table 1. Statistics of the metabarcoding sequencing data for soil and root samples. FL stands for Fenlong-ridging, and CK stands for conventional tillage.
Sample ID16S rRNAITS
TagsN90 (bp)OTUsTagsN90 (bp)OTUs
SOIL-CK-11187184092098123409301823
SOIL-CK-21038274082041115703297878
SOIL-CK-31137754092031119342301833
SOIL-CK-41057554092027127228301891
SOIL-CK-51123794082044127989300865
SOIL-CK-61128994092107128203300835
SOIL-FL-11162534092069119658302725
SOIL-FL-21039954062019131919302899
SOIL-FL-31124074092075120641302788
SOIL-FL-41106594032070117866301821
SOIL-FL-51103784091998114546301829
SOIL-FL-61114984082114125921301880
ROOT-CK-11198014091234127742310491
ROOT-CK-21037734091095113294285457
ROOT-CK-31099024091244120016301451
ROOT-CK-41125554091111116902320451
ROOT-CK-51145014091045127469302531
ROOT-FL-11094884091122128731297440
ROOT-FL-11094884091257126253302401
ROOT-FL-21117474101098124065339438
ROOT-FL-31076284091202128470320444
ROOT-FL-41118544101047113670318449
ROOT-FL-51169194091367124252296478
ROOT-FL-61085494091323121863301455
Table 2. Sequence information (Genbank ID) used in this study.
BacteriaFungi
Genbank IDTaxonGenbank IDTaxon
NR026067Rhizobium tropiciNR138339Penicillium ludwigii
NR115466Rhizobium tropiciNR121230Penicillium raperi
NR118084Rhizobium tropiciNR138263Penicillium brefeldi
NR113739Rhizobium tropiciNR158825Penicillium panissan
NR044063Rhizobium miluonenseNR131276Aspergillus terreus
NR109703Rhizobium mayenseNR077153Penicillium crustosu
EF061096Rhizobium miluonenseNR135337Aspergillus glaucus
AY738130Rhizobium lusitanumNR103665Talaromyces calidica
NR118139Rhizobium mesoamericNR147413Talaromyces flavus
FN908229Rhizobium mesoamericaNR170732Talaromyces annesoph
NR117203Rhizobium nepotumNR172395Talaromyces coprophi
NR115953Bacillus aryabhattaiNR165525Talaromyces argentin
NR118439Bacillus aeriusNR138223Curvularia lunata
NR041794Bacillus safensisNR158448Curvularia petersoni
NR113945Bacillus safensis
NR114126Ralstonia sp.
Note: 16S rRNA 27f/1492r was used to identify bacteria, and ITS1/4 was used to identify fungi.
Table 3. Endophytic strains of fungi and bacteria isolated in this study.
BacteriaFungi
Strain IDClustering of SpecieStrain IDClustered Species
R1Rhizobium sp.T16Penicillium ludwigii
R3Bacillus aryabhattaiT13
Lx2.2RT8Penicillium raperi
Rx11T5Penicillium brefeldi
R2T24Penicillium sp.
Rx4Bacillus aeriusT3Aspergillus terreus
Lx2.1T19Talaromyces sp.
Rx12Bacillus safensisRT4Talaromyces argentin
Rx18T8
Rx1Ralstonia sp.R3
Rx16T18Curvularia petersoni
Rx5
Rx13
R5
Publisher’s Note: MDPI stays neutral with regard to jurisdictional claims in published maps and institutional affiliations.

